In the published article, there was an error in the legend for Figure 2 as published. In the legend for Figure 2, “(N) Brown adipose tissue (BAT).” is a duplicate and needs to be deleted because the BAT is explained in the legend for Figure 2I. The corrected legend appears below.
“FIGURE 2 | EPC ameliorated MAFLD in rats. (A) Body weight (BW). (B) BW gain. (C–E) Organ wet weight. (F) Inguinal white adipose tissue (iWAT). (G) Perirenal white adipose tissue (pWAT). (H) Epididymis white adipose tissue (eWAT). (I) Brown adipose tissue (BAT). (J) iWAT/BW ratio. (K) pWAT/BW ratio; (L) eWAT/BW rati. (M) BAT/BW ratio. (N) Representative rat liver images of hematoxylin and eosin (H and E) and Oil Red O staining per group (X200). (O) Representative iWAT, pWAT, eWAT, BAT. One-way analysis of variance (ANOVA) was conducted for the group comparison. n = 8, data are presented as mean ± SEM.*p < 0.05, **p < 0.01, ***p < 0.001 vs. MOD group. EPC, P. cocos ethanol extract; CON, normal diet control group; MOD, high-fat diet group; FC, Fenofibrate capsules; EPC-L, low-dose P. cocos ethanol extract; EPC-H, high-dose P. cocos ethanol extract.].
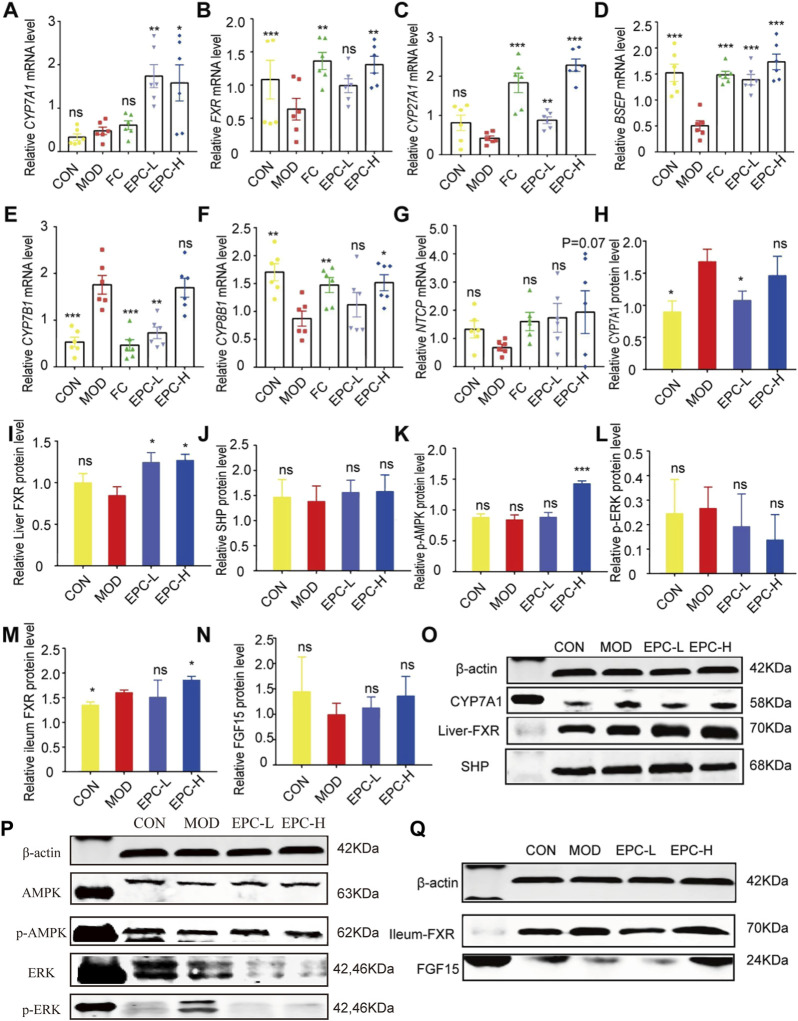
Furthermore, there was an error in Figure 6P as published. The authors apologize for uploading the ERK protein image in Figure 6 incorrectly, with image of p-JNK, in this article. Furthermore, P-ERK should be p-ERK in Figure 6P. The corrected Figure 6 appears below.
FIGURE 6.
EPC ameliorated MAFLD formation in rats by regulating BA metabolism. (A–G) Relative expression of CYP7A1, FXR, CYP27A1, BSEP, CYP7B1, CYP8B1, NTCP mRNA in liver, n = 6; (H–L) Relative expression of protein CYP7A1, FXR, SHP, p-AMPK, and p-ERK in the liver, n = 4; (M–N) Relative expression of protein FXR and FGF15 in the ileum, n = 4. (O–P) Representative immunoblotting images of CYP7A1, FXR, SHP, p-AMPK,and p-ERK in the liver. (Q) Representative immunoblotting images of FXR and FGF15 in the ileum. Data are presented as mean ± SEM. One-way analysis of variance (ANOVA) was conducted for the group comparison. *p < 0.05, **p < 0.01, ***p < 0.001 vs. MOD group. CYP7A1, cholesterol 7α-hydroxylase; FXR, farnesoid X receptor; CYP27A1, sterol 27-hydroxylase; BSEP, bile salt export protein; CYP7B1, oxysterol 7α-hydroxylase; CYP8B1, sterol 12αhydroxylase; NTCP, Na + -taurocholate co-transporting polypeptides; SHP, small heterodimer partner; AMPK, 5′-AMP-activated protein kinase; ERK, Extracellular signal-regulated kinase.
Publisher’s note
All claims expressed in this article are solely those of the authors and do not necessarily represent those of their affiliated organizations, or those of the publisher, the editors and the reviewers. Any product that may be evaluated in this article, or claim that may be made by its manufacturer, is not guaranteed or endorsed by the publisher.


