

Abstract
Introduction
Cancer cachexia, highly prevalent in lung cancer, is a debilitating syndrome characterized by involuntary loss of skeletal muscle mass and is associated with poor clinical outcome, decreased survival and negative impact on tumour therapy. Various lung tumour‐bearing animal models have been used to explore underlying mechanisms of cancer cachexia. However, these models do not simulate anatomical and immunological features key to lung cancer and associated muscle wasting. Overcoming these shortcomings is essential to translate experimental findings into the clinic. We therefore evaluated whether a syngeneic, orthotopic lung cancer mouse model replicates systemic and muscle‐specific alterations associated with human lung cancer cachexia.
Methods
Immune competent, 11 weeks old male 129S2/Sv mice, were randomly allocated to either (1) sham control group or (2) tumour‐bearing group. Syngeneic lung epithelium‐derived adenocarcinoma cells (K‐ras G12D ; p53 R172HΔG ) were inoculated intrapulmonary into the left lung lobe of the mice. Body weight and food intake were measured daily. At baseline and weekly after surgery, grip strength was measured and tumour growth and muscle volume were assessed using micro cone beam CT imaging. After reaching predefined surrogate survival endpoint, animals were euthanized, and skeletal muscles of the lower hind limbs were collected for biochemical analysis.
Results
Two‐third of the tumour‐bearing mice developed cachexia based on predefined criteria. Final body weight (−13.7 ± 5.7%; P < 0.01), muscle mass (−13.8 ± 8.1%; P < 0.01) and muscle strength (−25.5 ± 10.5%; P < 0.001) were reduced in cachectic mice compared with sham controls and median survival time post‐surgery was 33.5 days until humane endpoint. Markers for proteolysis, both ubiquitin proteasome system (Fbxo32 and Trim63) and autophagy‐lysosomal pathway (Gabarapl1 and Bnip3), were significantly upregulated, whereas markers for protein synthesis (relative phosphorylation of Akt, S6 and 4E‐BP1) were significantly decreased in the skeletal muscle of cachectic mice compared with control. The cachectic mice exhibited increased pentraxin‐2 (P < 0.001) and CXCL1/KC (P < 0.01) expression levels in blood plasma and increased mRNA expression of IκBα (P < 0.05) in skeletal muscle, indicative for the presence of systemic inflammation. Strikingly, RNA sequencing, pathway enrichment and miRNA expression analyses of mouse skeletal muscle strongly mirrored alterations observed in muscle biopsies of patients with lung cancer cachexia.
Conclusions
We developed an orthotopic model of lung cancer cachexia in immune competent mice. Because this model simulates key aspects specific to cachexia in lung cancer patients, it is highly suitable to further investigate the underlying mechanisms of lung cancer cachexia and to test the efficacy of novel intervention strategies.
Keywords: Cancer cachexia, Lung cancer, Muscle wasting, Mouse model, Orthotopic mouse model, OLCC
Introduction
Lung cancer is the leading cause of cancer related mortality worldwide. 1 About 85% of the lung cancers are non‐small cell lung cancer (NSCLC). 2 With an average 17% 5 year survival rate and increasing incidence rates, 1 NSCLC remains a devastating disease. Many patients with lung cancer experience cancer cachexia, defined as unintentional weight loss and muscle wasting. 3 Cachexia may be the primary cause of mortality in end stage disease and contributes to poor survival by increasing postoperative mortality and lowering patient tolerance to chemo‐, radiation‐ and immunotherapy. 4 , 5 , 6 In addition to earlier diagnosis and more effective treatment of NSCLC, prevention and treatment of cachexia is an additional target to improve patients' wellbeing and survival.
Therapies to prevent or treat cachexia are currently lacking. Many therapies proven effective in experimental animal models of cancer cachexia appear unsuccessful in patients. A major factor that may contribute to the failure of these trials is that existing models of cancer cachexia fail to fully replicate the aetiology of the human disease. 7 The most widely used animal models for cancer cachexia are subcutaneous tumour allograft transplants in rodents. 8 Although these animal models have been useful in investigating the underlying mechanisms of cancer cachexia, they differ from the situation seen in patients with respect to tumour burden and anatomical location. In addition, these subcutaneous mouse models have a relatively rapid onset and progression of cachexia compared to human, complicating the translatability of these models. To better characterize the systemic impact of human tumours, patient‐derived xenografts have been developed. 9 However, the need to use immune‐deficient recipient mice limits their use for modelling cancer cachexia. In order to simulate lung cancer cachexia more realistically, animal models needs to recreate the context in which the tumour can interact with the complex microenvironment and immune system, as happens in humans. 10 This relevant microenvironment can only be created in the organ of tumour origin, the lung. These so‐called orthotopic animal models are more clinically relevant than their subcutaneous counterparts as the establishment of a tissue‐specific tumour microenvironment may determine the aetiology of cachexia and affect the outcome of therapies. Lung‐specific genetic engineered mouse models (GEMMs) have been developed and used to study cancer cachexia. 11 However, these GEMM require intratracheal or intranasal viral delivery to accomplish Cre recombinase mediated activation of tumour growth, which might elicit interfering immune responses. Alternatively, orthotopic inoculated lung cancer mouse models have been described, 12 but have never been designed and characterized to study lung cancer cachexia. The monitoring of orthotopic lung tumours is no longer an obstacle to avoid the use of these models, as we recently demonstrated the routine deployment of non‐invasive micro computed tomography (μCT) imaging to follow up and quantify tumour growth longitudinally. 13 Moreover, we developed a deep learning algorithm to simultaneously automatically determine muscle mass changes on the same μCT images, allowing real time monitoring of muscle wasting during cachexia. 14
Thus, in order to develop promising targeted cachexia intervention strategies, new models that better replicate clinical lung cancer cachexia are needed. Such a model should exhibit: (1) orthotopic tumour growth; (2) immune competence; (3) prolonged disease progression; (4) skeletal muscle mass loss; (5) systemic inflammation; and (6) muscle specific alterations that reflect changes in patient muscle biopsies. Here, we present the development and characterization of a novel orthotopic lung cancer cachexia (OLCC) mouse model, which meets these criteria.
Materials and methods
Animals
Male 129 mice of 11 weeks (129S2/SvPasCrl, Charles River Laboratories, Germany) were socially housed (n = 3) in GM500 IVC cages (Tecniplast, Buguggiate, Italy) with Corn cob bedding (JRS Lignocel, Rosenberg, Germany), shelter and nesting material in a climate‐controlled room (12:12 dark–light cycle with a constant room temperature of 21 ± 1°C). Mice were given ad libitum access to food (AIN‐93M [3.6 kcal/g], Bio Services BV, Uden, the Netherlands) and drinking water (autoclaved, softened and acidified (pH = 2.5)). After 1 week of acclimatization, animals were randomly allocated to either the sham control group (n = 8) or the 344P tumour bearing group (n = 15; Figure S1). Following surgery, animals were monitored daily. Cachexia was defined as more than 5% of body weight loss in combination with confirmed muscle mass loss measured by micro Cone Beam Computed Tomography (μCBCT). Based on an animal welfare scoring list (incl. body weight, body composition, activity, fur/skin and posture), cachexia‐related humane endpoints were applied (surrogate survival endpoint). Furthermore, tumours were scored for location and size. If the primary tumour did not appear in the lung, mice were excluded. When a total tumour volume of 100 mm3 was reached or in case of signs of dyspnoea due to tumour growth or pulmonary constriction, humane endpoint was reached and the animals were sacrificed.
This work was conducted in accordance with institutional guidelines for the care and use of laboratory animals established by the Ethics Committee for Animal Experimentation of the Maastricht University and in full compliance to national legislation on animal research following the European Directive 2010/63/EU for the use of animals for scientific purposes.
Tumour model: Transpleural orthotopic lung tumour cell injection
Murine 344P lung epithelium‐derived adenocarcinoma cells [S1] were kindly provide by Prof. J.M. Kurie (University of Texas MD Anderson Cancer Center). Before expansion, the cells were tested for the presence of murine viruses and mycoplasma (QM diagnostics, Nijmegen, the Netherlands). Murine 344P cells were cultured with Roswell Park Memorial Institute 1640 medium (Gibco, Rockville, MD) supplemented with 9% fetal bovine serum (Gibco). After two passages, tumour cells were trypsinized in a sub‐confluent state and suspended in Matrigel matrix (Corning) at a well‐established concentration (2 × 10⁶ cells/mL). Animals were anaesthetised using a mixture of air and isoflurane (4% induction, 2% maintenance) and placed in a position of right lateral decubitus. Fur was removed, and a 1 cm superficial skin incision was made below the left scapula. Fat tissue was moved aside, and underlying muscles (excluding intercostal muscles) were carefully lifted. While visualizing the lung motion, 10 μL of Matrigel only (sham) or with tumour cells (2 × 10⁴ cells in 10 μL) was injected through the intercostal space into the lung. The muscles were placed back on top of the rib cage in the correct orientation and the skin was closed using a 5–0 suture. All mice received a single dose of pre‐operative analgesia (Carprofen and Buprenorphine) via subcutaneous injection and post‐operative analgesia (Carprofen) in the drinking water for 2 days.
Experimental protocol
All procedures of the experimental protocol were performed at a standardized time window during their inactive period of the day. Body weight and food intake were measured daily. At baseline and weekly after surgery, forelimb grip strength was measured with a calibrated grip strength tester (Bioseb, Vitrolles, France), and μCBCT imaging was performed for all mice to assess lung tumour development 13 and to detect muscle volume changes over time 14 with an extensively verified 3D deep convolutional neural network. At the end of the experiment, mice were scanned under anaesthesia and subsequently sacrificed in the ad libitum state using pentobarbital overdose. Skeletal muscles (e.g. m. soleus, m. plantaris, m. gastrocnemius, m. tibialis anterior (TA) and m. extensor digitorum longus (EDL)) were collected from both hind limbs, using standardized dissection methods. Subsequently, muscles were immediately weighed in pairs on an analytical balance and snap frozen in liquid nitrogen. The experimental setup is depicted in Figure S2.
Histological characterization of orthotopic lung tumour
Lungs were fixed in 4% formaldehyde (Unifix, Klinipath, Duiven) followed by dehydration, paraffin embedding, sectioning, and haematoxylin and eosin (HE) staining. Images were made at a 200× magnification.
Clinical validation
To assess whether the OLCC mouse model mimics the muscle intracellular changes related to human lung cancer cachexia, human samples were used from a previously published cross‐sectional study. 15 , 16 Vastus lateralis muscle biopsies of newly diagnosed treatment‐naïve NSCLC patients with cachexia (n = 8) and age‐matched and sex‐matched healthy controls (n = 8) were processed for RNA sequencing.
RNA extraction
For mRNA expression analysis, TRI Reagent (Sigma‐Aldrich) was used according to the manufacturer's protocol. Muscle gastrocnemius (mouse) and muscle vastus lateralis (human) were grinded into powder and homogenized in TRI Reagent by using a Mini bead beater (Cole Parmer) sample homogenizer, and total RNA was extracted. A Qubit fluorometer (Invitrogen) and the Agilent 4200 Tapestation system (Agilent Technologies) were used to measure the quantity, purity and integrity of the RNA. The RNA integrity number (RIN) values for all mouse samples were between 8.4 and 9.1, and the RIN values for all human samples were greater than 7.4.
Reverse transcription quantitative real time polymerase chain reaction
A fixed amount of 400 ng of total RNA was used for the reverse transcriptase reaction. First‐strand cDNA synthesis was performed using the Tetro cDNA Synthesis Kit according to the manufacturer's protocol (GC‐Biotech). cDNA was diluted (1:50) in nuclease‐free H2O and stored at 4°C, cDNA stocks were stored at −20°C. For real‐time PCR amplification, each reaction contained 5 μL SyBr‐green mix (Sensimix SYBR & Fluorescein, GC Biotech), 0.6 μL PCR primer mix (5 μM forward primer + 5 μM reverse primer) and 4.4 μL diluted cDNA template. PCR settings were 95°C for 10 min, followed by 45 cycles of 95°C for 10 s and 60°C for 20 s, carried out on a Roche LightCycler480 system. Melt curves were made using a gradual increase in temperature of 0.11°C/s with 5 acquisitions/s and a temperature range of 60 to 90°C. The melt curves were examined using the LightCycler480 software (Roche). PCR efficiency was determined using LinRegPCR software. The resultant N0 values were exported and normalized to the geometric average of five reference genes (Rplp0, Rpl13a, B2m, Ppia and Hprt) using GeNorm. Cut‐off number of cycles was set as 40. The thresholds used to determine significance of differentially expressed mRNAs were set as P < 0.05 and a Cq ≥ 1 cycle. The primers used are listed in Table S1.
RNA sequencing
Pure, intact mRNA was isolated from 1 μg of total RNA using the NEXTFLEX Poly (A) Beads 2.0 kit (PerkinElmer). The purified mRNA was used to prepare directional, strand specific RNA libraries for sequencing using the NEXTFLEX Rapid Directional RNA‐Seq kit 2.0 (PerkinElmer) according to manufacturer's instruction. The NETFLEX RNA‐Seq 2.0 Unique Dual Index Barcodes (PerkinElmer) were used as adapter. A Qubit fluorometer (Invitrogen) and the Agilent 4200 Tapestation system (Agilent Technologies) were used to measure the quantity and quality of the libraries. Equal amounts (1.6 nM) of libraries were pooled and sequenced using the S2 flow cell (200 cycles) of the Illumina NovaSeq 6000.
The obtained raw data was first trimmed using fastp [S2] and the remaining reads were mapped to either the Ensembl mouse genome (release 100) or Ensembl human genome (release 100) using STAR (version 2.7.3a) [S3] and quantified using RSEM (v.1.3.1) [S4]. The resultant raw read counts were processed using the R package DESeq2 [S5]. Low expressed genes, defined as more than 75% of the samples of any given condition not detected (0 read), were first removed from the analysis. Genes were considered differentially expressed with an adjusted P‐value (FDR) below 0.01. Raw RNA‐Seq data files are available at EMBL‐EBI ArrayExpress: E‐MTAB‐12780 and E‐MTAB‐12781.
In silico gene set enrichment analysis
Overrepresentation analysis was performed on the up‐ and down‐regulated differentially expressed genes (DEGs) using g:Profiler (g:GOSt) [S6]. DEGs were mapped to biological pathway databases (KEGG, Reactome and WikiPathways) and statistically significant enriched pathways were detected (P < 0.01).
Protein isolation and western blot
Muscle gastrocnemius was grinded into powder and homogenized in 400 μL whole cell lysate buffer (20 mM Tris pH 7.4, 150 mM NaCl, 1% Nonidet, 1 mM DTT, cOmplete mini protease inhibitor cocktail and PhosSTOP) by using a Polytron PT 1600 E (Kinematica). The homogenates were incubated for 30 min on ice and centrifuged (14 000× g) for 30 min at 4°C. Subsequently, supernatant fraction was separated from the pellet fraction. Protein concentration of the fractions were determined by using a BCA protein assay kit (Pierce, Thermo Fischer Scientific).
For Western Blot analysis, Laemmli buffer (0.25 M Tris–HCl pH 6.8, 8% (w/v) SDS, 40% (v/v) glycerol, 0.4 M DTT and 0.02% (w/v) Bromophenol blue) was added in a 1:4 dilution to the supernatant fraction and were incubated for 5 min at 95°C. Equal amounts of protein were loaded per lane on a Criterion XT Precast 4–12% Bis‐Tris gel (Bio‐Rad). Proteins were separated by electrophoresis (100–140 V). The proteins were transferred to 0.45 μm nitrocellulose membranes (Bio‐Rad) by electroblotting (Bio‐Rad Criterion Blotter) at 100 V for 1 h. Membranes were blocked during 1 h at room temperature in 5% non‐fat dried milk (ELK, Campina) diluted in Tris‐buffered saline with 0.05% Tween‐20 (TBS‐T). Membranes were washed with TBS‐T and overnight exposed at 4°C with specific primary antibodies (1:1000). Subsequently, membranes were washed with TBS‐T and were incubated with secondary antibodies (1:10.000) of anti‐mouse IgG peroxidase (Vector) or anti‐rabbit peroxidase (Vector). Detection was performed using SuperSignal West Pico Chemiluminescent substrate (Thermo Fischer Scientific) according to the manufacturers' protocol. Membranes were imaged (Amersham Imager 600, GE Life Sciences) and quantified using the ImageQuantTL software (GE Life Sciences). The primary antibodies used are listed in Table S2.
Cytokine quantification
Blood was collected in heparin tubes (Sarstedt AG & Co. KG). Blood was centrifuged (2.000× g for 10 min at 4°C) and plasma was stored at −20°C. Plasma Pentraxin‐2 and CXCL1/KC (Quantikine ELISA, R&D Systems) levels were quantified according to manufacturer's protocol.
Results
Cachexia characteristics in the orthotopic lung cancer mouse model
Mice were orthotopically injected with lung tumour cells that express an activation mutation in Kras as well as a loss of function mutation in p53. One week after surgery, 80% of the mice developed a solid type adenocarcinoma centrally in the left lung lobe (Figures S1 and S3). Sixty‐seven per cent of the tumour‐bearing mice developed cachexia (OLCC, n = 8), defined as more than 5% of body weight loss in combination with confirmed muscle mass loss measured by non‐invasive CT‐imaging. 14 The other 33% of the tumour‐bearing mice reached humane endpoint criteria before they developed cachexia (OLC(‐C), n = 4; Figure S1). Tumour development was monitored by non‐invasive CT‐imaging, 13 with a maximum tumour burden of 0.5% of total body weight (Figure 1A,B). The OLCC mice reached surrogate survival endpoint at a median of 33.5 days post‐surgery and showed significant loss of body weight over time compared with sham control mice (Figure 1C,D). At the endpoint, on average OLCC mice lost 13.7% (P < 0.01) of total body weight (Figure 1E). No differences in food intake were observed between OLCC and sham control mice (Figure 1F).
Figure 1.
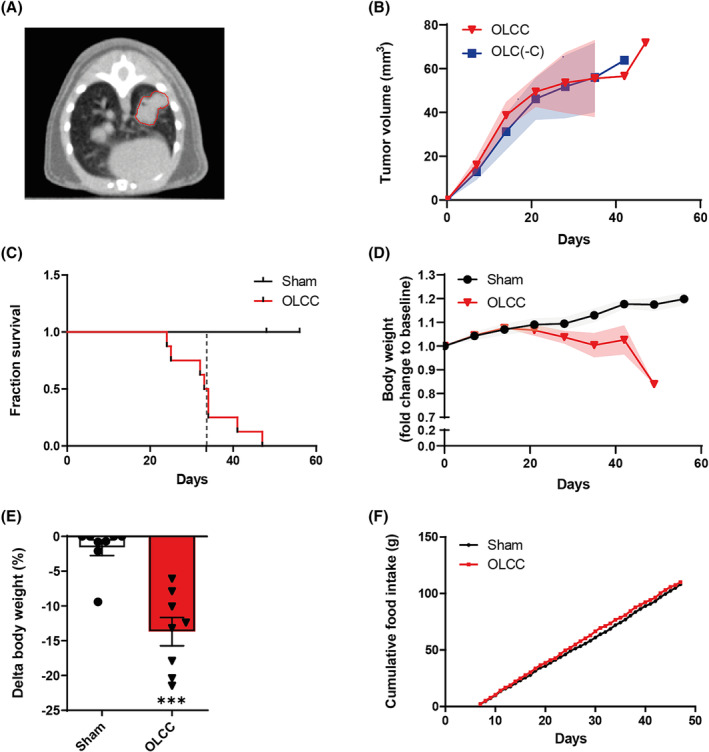
Tumour, body weight and survival characteristics in orthotopic lung cancer cachexia (OLCC) mice. (A) Representative axial slice of a μCBCT image illustrating a single nodule in the left lung lobe of the OLCC mouse. (B) Tumour volume (mm3) of tumour‐bearing mice with (OLCC, n = 8) and without cachexia (OLC(‐C), n = 4) over time, measured by μCBCT. (C) Kaplan–Meier survival plot for sham and OLCC mice. The dotted vertical line indicates the median surrogate survival time for the OLCC mice (33.5 days). (D) Total mouse body weight over time, normalized to body weight at baseline (pre‐surgery). (E) Relative change (%) in body weight (∆BW) at the end of the experiment. (F) Cumulative food intake from 7 days post‐surgery. Data are presented as mean ± SEM, sham control n = 8 and OLCC mice n = 8. Comparisons were statistically tested with the Mann–Whitney U test. Significance is shown as **P < 0.01.
The loss of body weight in OLCC mice was accompanied by significant loss of muscle mass, which became visible by non‐invasive CT imaging 21 days post‐surgery (Figure 2A). At endpoint, OLCC mice lost 13.8% (P < 0.01) muscle mass of the hind limbs (Figure 2B). CT‐based hind limb muscle wasting was reflected by the significant loss in m. plantaris (P < 0.01), m. gastrocnemius (P < 0.05) and m. TA (P < 0.01) wet masses (Figure 2C). In addition, OLCC mice showed decreased muscle function (P < 0.001) measured by forelimb grip strength (Figure 2D,E). Importantly, CT‐derived muscle mass correlated with muscle function (r = 0.397, n = 98; P < 0.01) (Figure 2F).
Figure 2.
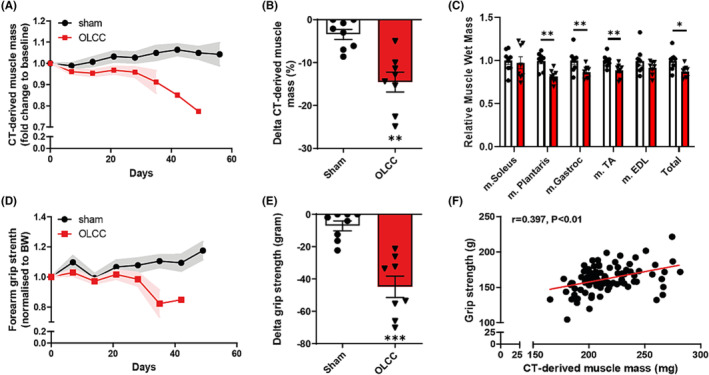
Loss of muscle mass and function in OLCC mice. (A) μCBCT‐derived muscle mass over time, normalized to μCBCT‐derived muscle mass at baseline (pre‐surgery). (B) Relative change (%) in μCBCT‐derived muscle mass at the end of the experiment. (C) Relative change in muscle wet mass at the end of the experiment. (D) Forearm grip strength (gram) over time, normalized to total body weight (gram) at baseline. (E) Absolute change in grip strength (gram) at the end of the experiment. (F) Correlation between forearm grip strength and μCBCT‐derived muscle mass (mg), r = 0.397 (n = 98). The correlation was statistically tested with Pearson's correlation coefficient (two‐tailed). Data are presented as mean ± SEM, sham control n = 8 and OLCC mice n = 8. Comparisons were statistically tested with two‐tailed unpaired t‐test for normally distributed data or Mann–Whitney U test for non‐parametric data. Significances are shown as *P < 0.05; **P < 0.01, and ***P < 0.001.
Increased proteolysis signalling in atrophied muscle of orthotopic lung cancer cachexia mice
Next, to assess activation of proteolysis signalling, we measured the expression of genes coding for components of the ubiquitin proteasome system (UPS) and autophagy lysosomal pathway (ALP), which have been implicated in cancer‐induced muscle atrophy. 17 The observed muscle wasting was associated with increased mRNA expression of the ubiquitin E3 ligases Fbxo32 (P < 0.001) and Trim63 (P < 0.01), but not Nedd4 (Figure 3A). The mRNA expression levels of Gabarapl1 (P < 0.01) and Bnip3 (P < 0.05) were upregulated (Figure 3A) and the ratio of phosphorylated ULK (Ser757) over total ULK was decreased (P < 0.05; Figure 3B), suggesting increased activation of the ALP. Finally, the protein levels of phosphorylated FoxO1 (Ser256) over total FoxO1 was decreased (P < 0.05; Figure 3C) mainly by elevated levels of total FoxO1 protein (P < 0.05), which is consistent with increased mRNA expression of Foxo1 (P < 0.05; Figure 3A). Combined, these findings indicates increased proteolysis signalling in the muscle of OLCC compared with sham control mice.
Figure 3.
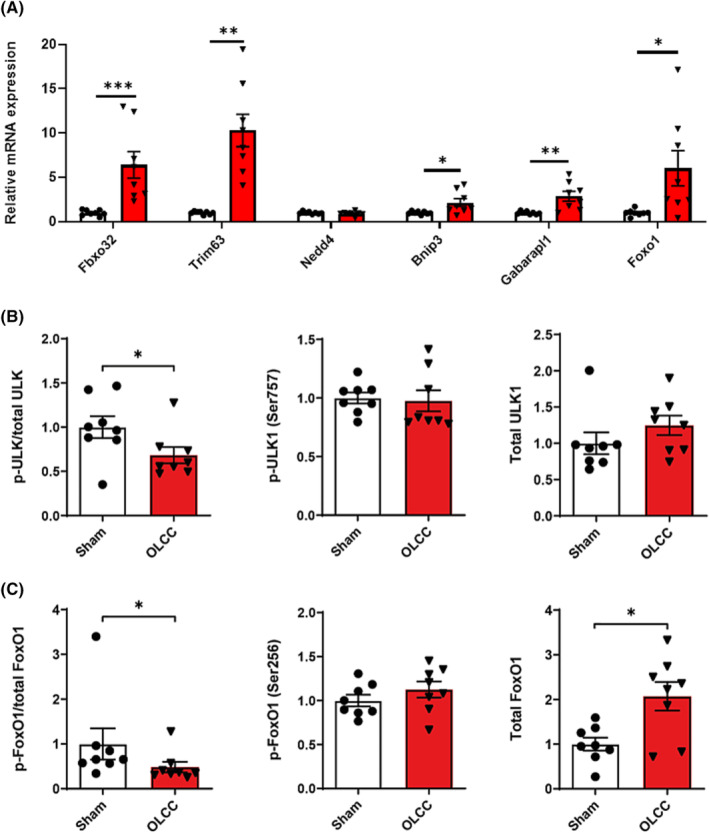
Increased proteolysis signalling in the muscle of OLCC mice. (A) Relative mRNA expression levels of Fbxo32, Trim63, Nedd4, Bnip3, Gabarapl1 and Foxo1 measured in the m. gastrocnemius. (B) Ratio of phosphorylated ULK (Ser757) over total ULK, and the relative protein expression of phosphorylated ULK (Ser757) and total ULK. (C) Ratio of phosphorylated FoxO1 (Ser256) over total FoxO1, and the relative protein expression of phosphorylated FoxO1 (Ser256) and total FoxO1. Representative pictures of the western blot data are shown in Figure S4. Data are presented as mean ± SEM, sham control n = 8 and OLCC mice n = 8. Comparisons were statistically tested with two‐tailed unpaired t‐test for normally distributed data or Mann–Whitney U test for non‐parametric data. Significances are shown as *P < 0.05; **P < 0.01, and ***P < 0.001.
Decreased protein synthesis signalling in atrophied muscle of orthotopic lung cancer cachexia mice
To assess the anabolic activity in the skeletal muscle of OLCC mice, the activity of multiple components of the Akt/mTOR signalling pathway were measured. The protein levels of phosphorylated Akt (Ser473) over total Akt were decreased (P < 0.05) in OLCC compared with sham control mice (Figure 4A). Protein levels of mTOR did not show significant changes in phosphorylation status (Figure 4B). Downstream of mTOR, the phosphorylation status of S6 (P < 0.05) and 4E‐BP1 (P < 0.001) were decreased in the muscle of OLCC compared with sham control mice (Figure 4C,D). Finally, the mRNA expression of Ddit4 (REDD1), an inhibitor of mTOR, was increased in OLCC mice (P < 0.01; Figure 4E). Altogether, these observations indicate decreased anabolic signalling in the muscle of OLCC mice.
Figure 4.

Decreased protein synthesis signalling in the muscle of OLCC mice. (A) Ratio of phosphorylated Akt (Ser473) over total Akt, and the relative protein expression of phosphorylated Akt (Ser473) and total Akt. (B) Ratio of phosphorylated mTOR (Ser2448) over total mTOR, and the relative protein expression of phosphorylated mTOR (Ser2448) and total mTOR. (C) Ratio of phosphorylated S6 (Ser235/236) over total S6, and the relative protein expression of phosphorylated S6 (Ser235/236) and total S6. (D) Phosphorylation distribution of 4E‐BP1. Representative pictures of the Western blot data are shown in Figure S4. (E) Relative mRNA expression of Ddit4 (REDD1). Data are presented as mean ± SEM, sham control n = 8 and OLCC mice n = 8. Comparisons were statistically tested with two‐tailed unpaired t‐test for normally distributed data or Mann–Whitney U test for non‐parametric data. Significances are shown as *P < 0.05; **P < 0.01, and ***P < 0.001.
Increased systemic inflammation and inflammatory signalling in atrophied muscle of orthotopic lung cancer cachexia mice
As markers of systemic inflammation, circulating levels of the pro‐inflammatory chemokine CXCL1/KC (murine interleukin‐8 (IL‐8) orthologue) and acute phase protein pentraxin‐2 were assessed and found to be increased in blood plasma of OLCC mice compared with sham control (respectively P < 0.01 and P < 0.001; Figure 5A,B). In addition, the mRNA expression of IκBα was increased in muscle of OLCC compared with sham control mice (P < 0.05; Figure 5C), suggesting increased inflammatory signalling in the skeletal muscle of OLCC mice.
Figure 5.
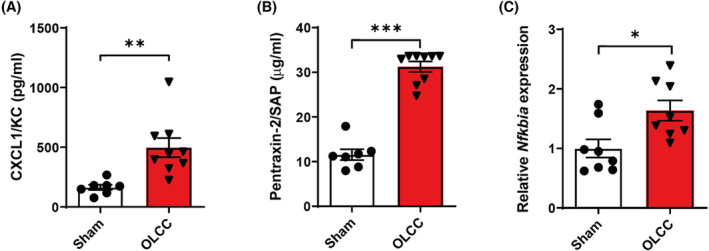
Increased systemic inflammation and inflammatory signalling in the muscle of OLCC mice. Blood plasma expression levels of (A) CXCL1/KC in pg/mL and (B) Pentraxin‐2 in μg/mL. (C) Relative mRNA expression of Nfkbia (IκBα) measured in the m. gastrocnemius. Data are presented as mean ± SEM, sham control n = 8 and OLCC mice n = 8. Comparisons were statistically tested with two‐tailed unpaired t‐test for normally distributed data or Mann–Whitney U test for non‐parametric data. Significances are shown as *P < 0.05; **P < 0.01, and ***P < 0.001.
Intracellular changes specifically associated with muscle atrophy in NSCLC patients are preserved in OLCC mouse muscle
Given the limitations of the currently available animal models of lung cancer cachexia, we assessed whether the OLCC mouse model comprehensively recapitulates the muscle intracellular changes related to human lung cancer cachexia. To this end, we applied a comparative transcriptomic analysis in muscle biopsies of cachectic NSCLC patients and OLCC mice. Gene expression profiling in NSCLC patients with cachexia resulted in 225 DEGs compared with healthy control subjects, using a FDR of <0.01 (Figure 6A). The majority of the genes (63%) were downregulated. In the mouse model, we identified a total of 3956 DEGs between sham control and OLCC mice (Figure 6B). Here, 45% of the DEGs were downregulated. Subsequently, pathway enrichment analysis was deployed to identify similarly regulated pathways and processes in human and mouse cachectic muscle. Although we did not found any enrichment among the upregulated DEGs in cachectic patients with NSCLC, enrichment analysis on the upregulated DEGs of the OLCC mice resulted in pathways related to mRNA processing, mitophagy, autophagy, FoxO signalling (Figure S5). Remarkable overlap was observed in enrichment analysis of the downregulated DEGs of the cachectic NSCLC patients (Figure 6C) and OLCC mice (Figure 6D), identifying significant alterations in pathways related to metabolism, oxidative phosphorylation and mitochondrial functioning. These findings suggest similar alterations in the molecular processes governing muscle metabolism characterizing cachectic muscle of lung cancer patients and OLCC mice.
Figure 6.
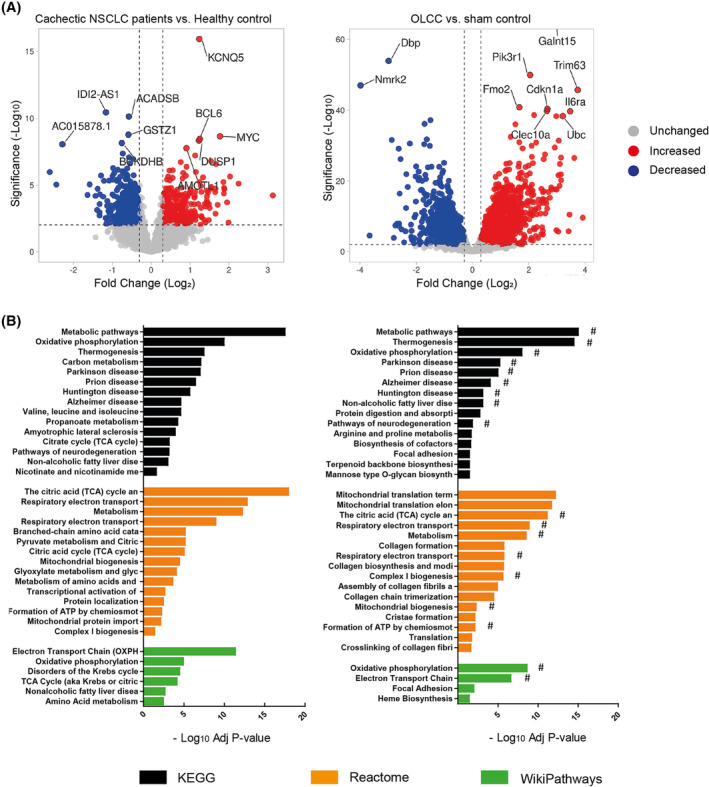
Comparative transcriptomic analysis in muscle biopsies of cachectic NSCLC patients and OLCC mice. (A) Volcano plot of RNA sequencing data of newly diagnosed treatment naïve non‐small cell lung cancer (NSCLC) patients with cachexia (n = 8) compared with age‐ and gender‐matched healthy controls (n = 8; left panel) and OLCC mice (n = 4) compared with sham control (n = 4; right panel). Volcano plots are depicted with fold change (Log 2) and significance (‐Log 10 adjusted P‐value). Significantly upregulated genes are shown in red, while significantly downregulated genes are shown in blue. (B) Horizontal bar chart of enriched biological pathways among significantly downregulated genes in NSCLC patients with cachexia (left panel) and OLCC mice (right panel). Enriched biological pathways are derived from three independent databases: Kyoto Encyclopedia of Genes and Genomes (KEGG; black bars), Reactome (orange bars) and WikiPathways (green bars). Overlapping pathways NSCLC patients with cachexia and OLCC mice are indicated with a hashtag (#).
Differential miRNA expression in atrophied muscle of orthotopic lung cancer cachexia mice
In previous work we showed alterations in miRNA expression in muscle of cachectic lung cancer patients. 16 Specifically, the expression of miR‐322(424)‐5p and miR‐450a‐5p were significantly upregulated and the expression of miR‐451a and miR‐144‐5p significantly downregulated in the skeletal muscle of lung cancer patients with cachexia. In accordance, the intramuscular expression of miR‐322(424)‐5p and miR‐450a‐5p were increased and the expression of miR‐451a and miR‐144‐5p decreased in OLCC (Figure 7A–D). These findings indicate that similar processes are involved in the muscle of both OLCC mice and patients with lung cancer cachexia.
Figure 7.
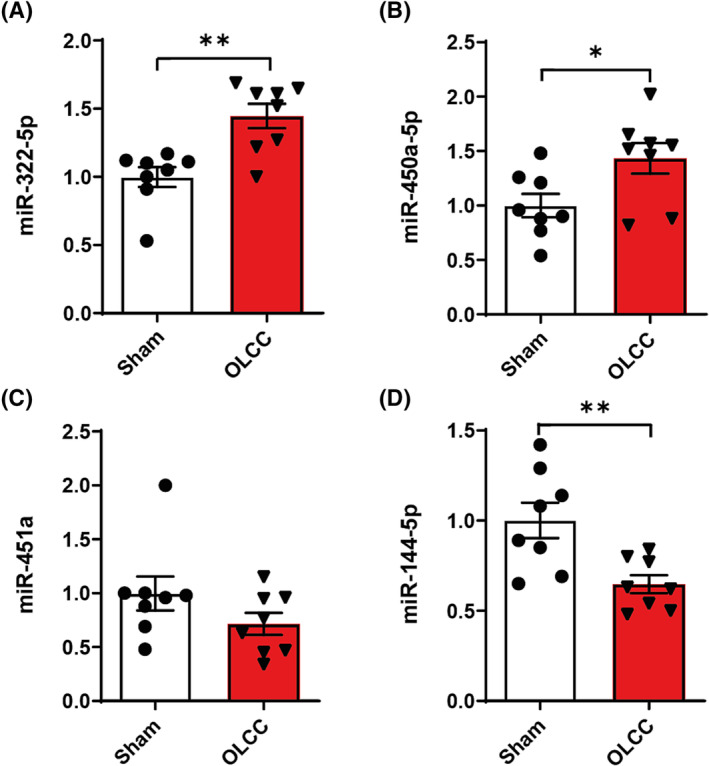
Relative miRNA expression of (A) mmu‐miR‐322‐5p, (B) mmu‐miR‐450a‐5p, (C) mmu‐miR‐451a, and (D) mmu‐miR‐144‐5p measured in the m. gastrocnemius. Data are presented as mean ± SEM, sham control n = 8 and orthotopic lung cancer cachexia (OLCC) n = 8. Comparisons were statistically tested with two‐tailed unpaired t‐test for normally distributed data or Mann–Whitney U test for non‐parametric data. Significances are shown as *P < 0.05; **P < 0.01, and ***P < 0.001.
Discussion
In this study, we evaluated whether a syngeneic, orthotopic lung cancer mouse model replicates systemic and muscle‐specific alterations associated with human lung cancer cachexia. Lung epithelium‐derived adenocarcinoma cells derived from Kras G12D ; p53 R172HΔG mice were implanted in the lung of immune competent mice. The OLCC mice showed significant loss of skeletal muscle mass and function. The observed muscle wasting was accompanied by increased systemic inflammation and alterations in the regulation of muscle anabolic signalling, reflecting increased proteolysis and suppressed protein synthesis. Finally, we showed that the muscle transcriptome of the mouse model simulates key aspects specific to cachexia in lung cancer patients.
The Lewis lung carcinoma (LLC) mouse model is by far the most commonly used animal model in lung cancer cachexia research. 18 In this mouse model, the LLC NSCLC cells are injected subcutaneous in immunocompetent mice. 19 This model has several advantages, including technical feasibility (easy to setup, absence of anaesthesia) and tumour accessibility (direct measurement with calliper). However, the LLC model is limited by differences between tumour origin and (lung) microenvironment, including extra cellular matrix and immune infiltration, which may determine the aetiology of cachexia. In addition, the LLC mouse model as used in cachexia research, develops relatively large ectopic growing tumours, which often represent more than 10% of the total body mass. 18 This may strongly impact the metabolism and energy requirements of the host and consequently determine the rapid cachexia symptom onset and a relatively short survival time typically observed in this model. 18
In orthotopic mouse models, the tumour grows in the appropriate anatomical site and local cellular context, which increases the relevance of experimental models, including those to study cancer cachexia. 7 , 20 Previously, there only have been a few efforts to develop mouse models of lung cancer cachexia that focus on tumours arising in their original tissue, including a GEMM 11 and an intravenous metastasis model. 21 However, these models are limited by their discrepancies with respect to the clinical situation, as these models have hundreds of primary tumours that are difficult to follow up and quantify. In contrast to these models, the OLCC mouse model develops a single primary tumour of max 0.5% of total body weight in the left lung lobe of the mice, which better reflects the tumour burden in NSCLC patients and is easier to follow up. Approximately 67% of the tumour‐bearing mice developed cachexia. This is similar in magnitude to the incidence observed in the Kras G12D/+ ; Lkb1 f/f GEMM. 11 It is important to note that anorexia is absent in this model and that the symptom onset is less rapid compared with the widely used subcutaneous mouse models, 18 which makes the OLCC model highly suitable to study the therapeutic effects of (nutritional) intervention options.
Skeletal muscle loss is a major hallmark of cancer cachexia. In alignment with cachexia in patients with lung cancer 15 and different animal models of cancer cachexia, 7 , 20 , 22 , 23 , 24 we demonstrate that the OLCC mice lose significant amount of muscle mass compared with sham control. Skeletal muscle wasting is an important contributing factor to muscle weakness. Cachectic patients have a lower hand grip strength compared with patients without cachexia. 25 , 26 Muscle weakness in cachexia adversely affects performance status, quality of life and hospitalization risk of cancer patients. 27 In murine models of cancer cachexia, a decreased grip strength has been observed in cachectic mice compared with control mice. 24 , 28 In line with these findings, the OLCC mice have significantly decreased grip strength compared with sham control, illustrating that progressive loss of muscle mass and function as major hallmarks of cancer cachexia are evident in the OLCC mouse model.
Systemic inflammation may be an important contributing factor to cancer‐induced muscle atrophy. 29 We showed that OLCC mice exhibit increased pentraxin‐2 and CXCL1/KC (murine IL‐8 orthologue) expression levels in the blood plasma. Pentraxin‐2, also known as serum amyloid P component, is a major acute phase plasma protein in mice belonging to the same family as C‐reactive protein (CRP) in human. 30 Increased circulating levels of CRP have been observed in cancer patients with cachexia compared with weight stable cancer patients and healthy controls. 15 , 31 , 32 Raised levels of IL‐8 have also been found in NSCLC patients 15 and pancreatic cancer patients with cachexia. 33 Furthermore, it has been shown that IL‐8 is an independent predictor of survival in pancreatic cancer patients. 33 It has been suggested that IL‐8 can directly contribute to muscle atrophy. 34 Besides increased IL‐8 plasma levels, we found increased mRNA expression of IκBα (Nfkbia) in the skeletal muscle of cachectic mice, which is also reported in muscle biopsies of patients with lung cancer cachexia. 15 As Nfkbia is a target gene of the NF‐κB transcription factor, this finding suggests increased inflammatory signalling in the muscle of the cachectic mice.
Intracellularly, the skeletal muscle wasting observed in OLCC mice is associated with increased proteolysis, involving both through UPS and ALP, and decreased anabolic signalling. From experimental models of cancer cachexia, there is abundant evidence for increased protein degradation and decreased protein synthesis. 7 , 11 , 21 , 35 Compared with these results from animal models, evidence from human patients is rather inconclusive. Increased activation of the UPS in correlation with disease severity has been shown in skeletal muscle of patients with gastric cancer, although before the clinical onset of cachexia. 36 , 37 In contrast, a study in lung cancer patients with cachexia did not find increased expression of UPS components in skeletal muscle. 15 In line with the OLCC mouse model, several studies have reported increased expression of autophagy markers in patients with cancer cachexia. 38 , 39 , 40 Op den Kamp et al. found increased expression of autophagy markers (BNIP3 and LC3B) in muscle biopsies of NSCLC patients with cachexia compared with healthy control. 15 Available data on decreased protein synthesis, or activation status of the Akt/mTOR signalling pathway, in cancer patients are very limited. In one study on patients with pancreatic cancer and weight loss, decreased activation of Akt, mTOR and p70S6k was observed in skeletal muscle tissue compared with pancreatic cancer patients without weight loss. 41 Another study on cachectic NSCLC patients reported increased activation of Akt compared with healthy controls. 15 In contrast, none of the downstream signalling proteins, such as mTOR and 4E‐BP1, showed significant changes in phosphorylation. 15 These differences between the mouse model and the patients can be explained by the different kinetics by which cachexia develops. While in the mouse model cachexia progresses within a few weeks, in the patient the progression comprises several months. The gradual nature of the process in patients together with the constant turnover of muscle suggests that imbalances in muscle protein synthesis and breakdown may be more subtle and consequently difficult to detect in cachectic muscle.
A major drawback of many mouse models used in prior cancer cachexia research, including the LLC model, is the fact that the gene signatures in mouse skeletal muscle are completely distinct from those in cachectic patients. 7 To comprehensively assess whether the OLCC model reproduces the muscle intracellular changes related to human lung cancer cachexia, we compared the DEGs in OLCC mice with the DEGS in cachectic NSCLC patients. Using pathway‐enrichment analysis, we found a remarkable overlap in the down‐regulated DEGs, demonstrating similar alterations in the molecular processes governing muscle metabolism between the OLCC mice and cachectic NSCLC patients. Interestingly, many of the enriched pathways are suggestive of mitochondrial dysfunction in the skeletal muscle in lung cancer cachexia. This is in line with previous work reporting impairment of mitochondrial quality and function, 42 and calls for follow‐up research to further unravel the role of mitochondrial dysfunction in cancer cachexia. In addition, we measured the expression levels of four miRNAs potentially involved in the regulation of muscle atrophy in the skeletal muscle of OLCC mice. We found an identical miRNA expression pattern (up‐ and down‐regulated) in the skeletal muscle of the OLCC mice as has been found in NSCLC patients. 16 This observation warrants further investigation into the role of these miRNAs in cancer cachexia. Combined, these expression data demonstrate that intracellular changes specifically associated with muscle atrophy in NSCLC patients are preserved in OLCC mouse muscle.
To conclude, we developed and characterized an orthotopic lung cancer mouse model in immune competent mice, which simulates key aspects of human lung cancer cachexia. The model presented here provides opportunities to advance cancer cachexia research, including understanding the aetiology of lung cancer cachexia and the development and evaluation of novel intervention strategies.
Funding
This research was funded as part of a grant of Danone Nutricia Research, grant name “Preclinical development of intervention strategies in lung cancer cachexia”.
Conflict of interest
Wouter van de Worp, Jan Theys, Alba Sanz González, Brent van der Heyden, Florian Caiment, Duncan Hauser, Bert Smeets, Annemie Schols and Ramon Langen do not have any conflicts of interest. Frank Verhaegen is co‐founder of SmART Scientific Solutions B. V. Ardy van Helvoort is employed by Danone Nutricia Research.
Supporting information
Fig. S1: Flowchart of the animal experiment. Mice, 11‐weeks old, were randomly allocated to either sham control group (N = 8) or tumour‐bearing group (N = 15). One week after surgery, animals without a primary tumour in the left lung were excluded (N = 3). Only the tumour‐bearing mice which developed cachexia (OLCC; N = 8) were included for further analysis.
Fig. S2: Experimental setup animal experiment. Body weight and food intake were measured daily. At baseline (T‐3) and weekly after tumour injection (T0), forelimb grip strength was assessed and CT‐imaging was performed to assess tumour growth and muscle mass. At T0, tumour cells were injected intrapulmonary into the left lung lobe of the mice. At T7, only animals with an appropriate tumour take and location (N = 12) were included in follow up analyses. After reaching cachexia‐related Humane Endpoint (HEP), animals were euthanized and tissues were collected.
Fig. S3: Representative images of the tumour H&E. (A) Adjacent to the border with lung tissue, the tumours show a cribriform pattern with back‐to‐back glands (indicated with red arrows). (B) Towards the core, the tumour presents solid nests of clear cells with eosinophilic cytoplasm. These patterns are characteristic for a solid type lung adenocarcinoma.
Fig. S4: Representative images of Western Blot data. S: sham, O: OLCC. The intensity of the bands was normalized to Ponceau S.
Fig. S5: Horizontal bar chart of enriched biological pathways among significantly upregulated genes in OLCC mice. Enriched biological pathways are derived from three independent databases: Kyoto Encyclopedia of Genes and Genomes (KEGG; black bars), Reactome (orange bars) and WikiPathways (green bars).
Table S1: List of primers.
Table S2: List of primary antibodies.
Data S1. Supporting Information.
Data S2. Supplementary References.
Acknowledgements
The authors of the manuscript would like to thank Natasja Lieuwes and employees of the CPV Maastricht for their assistance with animal experiments. The authors of this manuscript certify that they comply with the ethical guidelines for authorship and publishing in the Journal of Cachexia, Sarcopenia and Muscle. 43
van de Worp W. R. P. H., Theys J., González A. S., van der Heyden B., Verhaegen F., Hauser D., et al (2023) A novel orthotopic mouse model replicates human lung cancer cachexia, Journal of Cachexia, Sarcopenia and Muscle, 14, 1410–1423, 10.1002/jcsm.13222
References
- 1. Sung H, Ferlay J, Siegel RL, Laversanne M, Soerjomataram I, Jemal A, et al. Global Cancer Statistics 2020: GLOBOCAN Estimates of Incidence and Mortality Worldwide for 36 Cancers in 185 Countries. CA Cancer J Clin 2021;71:209–249. [DOI] [PubMed] [Google Scholar]
- 2. Herbst RS, Heymach JV, Lippman SM. Lung cancer. N Engl J Med 2008;359:1367–1380. [DOI] [PMC free article] [PubMed] [Google Scholar]
- 3. Anker MS, Holcomb R, Muscaritoli M, von Haehling S, Haverkamp W, Jatoi A, et al. Orphan disease status of cancer cachexia in the USA and in the European Union: a systematic review. J Cachexia Sarcopenia Muscle 2019;10:22–34. [DOI] [PMC free article] [PubMed] [Google Scholar]
- 4. Dewys WD, Begg C, Lavin PT, Band PR, Bennett JM, Bertino JR, et al. Prognostic effect of weight loss prior to chemotherapy in cancer patients. Eastern Cooperative Oncology Group. Am J Med 1980;69:491–497. [DOI] [PubMed] [Google Scholar]
- 5. Ross PJ, Ashley S, Norton A, Priest K, Waters JS, Eisen T, et al. Do patients with weight loss have a worse outcome when undergoing chemotherapy for lung cancers? Br J Cancer 2004;90:1905–1911. [DOI] [PMC free article] [PubMed] [Google Scholar]
- 6. Turner DC, Kondic AG, Anderson KM, Robinson AG, Garon EB, Riess JW, et al. Pembrolizumab Exposure‐Response Assessments Challenged by Association of Cancer Cachexia and Catabolic Clearance. Clin Cancer Res 2018;24:5841–5849. [DOI] [PubMed] [Google Scholar]
- 7. Talbert EE, Cuitiño MC, Ladner KJ, Rajasekerea PV, Siebert M, Shakya R, et al. Modeling Human Cancer‐induced Cachexia. Cell Rep 2019;28:1612–1622.e1614. [DOI] [PMC free article] [PubMed] [Google Scholar]
- 8. Suzuki T, Von Haehling S, Springer J. Promising models for cancer‐induced cachexia drug discovery. Expert Opin Drug Discovery 2020;15:627–637. [DOI] [PubMed] [Google Scholar]
- 9. Delitto D, Judge SM, Delitto AE, Nosacka RL, Rocha FG, DiVita BB, et al. Human pancreatic cancer xenografts recapitulate key aspects of cancer cachexia. Oncotarget 2017;8:1177–1189. [DOI] [PMC free article] [PubMed] [Google Scholar]
- 10. Whiteside TL. The tumor microenvironment and its role in promoting tumor growth. Oncogene 2008;27:5904–5912. [DOI] [PMC free article] [PubMed] [Google Scholar]
- 11. Goncalves MD, Hwang S‐K, Pauli C, Murphy CJ, Cheng Z, Hopkins BD, et al. Fenofibrate prevents skeletal muscle loss in mice with lung cancer. Proc Natl Acad Sci 2018;115:E743–E752. [DOI] [PMC free article] [PubMed] [Google Scholar]
- 12. Sosa Iglesias V, van Hoof SJ, Vaniqui A, Schyns LE, Lieuwes N, Yaromina A, et al. An orthotopic non‐small cell lung cancer model for image‐guided small animal radiotherapy platforms. Br J Radiol 2019;92:20180476. [DOI] [PMC free article] [PubMed] [Google Scholar]
- 13. van de Worp WR, van der Heyden B, Lappas G, van Helvoort A, Theys J, Schols AM, et al. Deep Learning Based Automated Orthotopic Lung Tumor Segmentation in Whole‐Body Mouse CT‐Scans. Cancer 2021;13:4585. [DOI] [PMC free article] [PubMed] [Google Scholar]
- 14. van der Heyden B, van de Worp WR, van Helvoort A, Theys J, Schols AM, Langen RC, et al. Automated CT‐derived skeletal muscle mass determination in lower hind limbs of mice using a 3D U‐Net deep learning network. J Appl Physiol 2020;128:42–49. [DOI] [PubMed] [Google Scholar]
- 15. Op den Kamp CM, Langen RC, Snepvangers FJ, de Theije CC, Schellekens JM, Laugs F, et al. Nuclear transcription factor κ B activation and protein turnover adaptations in skeletal muscle of patients with progressive stages of lung cancer cachexia. Am J Clin Nutr 2013;98:738–748. [DOI] [PubMed] [Google Scholar]
- 16. van de Worp WR, Schols AM, Dingemans AMC, Op den Kamp CM, Degens JH, Kelders MC, et al. Identification of microRNAs in skeletal muscle associated with lung cancer cachexia. J Cachexia Sarcopenia Muscle 2020;11:452–463. [DOI] [PMC free article] [PubMed] [Google Scholar]
- 17. Schiaffino S, Dyar KA, Ciciliot S, Blaauw B, Sandri M. Mechanisms regulating skeletal muscle growth and atrophy. FEBS J 2013;280:4294–4314. [DOI] [PubMed] [Google Scholar]
- 18. Ballarò R, Costelli P, Penna F. Animal models for cancer cachexia. Curr Opin Support Palliat Care 2016;10:281–287. [DOI] [PubMed] [Google Scholar]
- 19. Mayo JG. Biologic characterization of the subcutaneously implanted Lewis lung tumor. Cancer Chemother Rep 2 1972;3:325–330. [PubMed] [Google Scholar]
- 20. Michaelis KA, Zhu X, Burfeind KG, Krasnow SM, Levasseur PR, Morgan TK, et al. Establishment and characterization of a novel murine model of pancreatic cancer cachexia. J Cachexia Sarcopenia Muscle 2017;8:824–838. [DOI] [PMC free article] [PubMed] [Google Scholar]
- 21. Arneson‐Wissink PC, Ducharme AM, Doles JD. A novel transplantable model of lung cancer‐associated tissue loss and disrupted muscle regeneration. Skeletal Muscle 2020;10:6. [DOI] [PMC free article] [PubMed] [Google Scholar]
- 22. Argilés JM, Figueras M, Ametller E, Fuster G, Olivan M, de Oliveira CCF, et al. Effects of CRF2R agonist on tumor growth and cachexia in mice implanted with Lewis lung carcinoma cells. Muscle Nerve 2008;37:190–195. [DOI] [PubMed] [Google Scholar]
- 23. Murphy KT, Chee A, Gleeson BG, Naim T, Swiderski K, Koopman R, et al. Antibody‐directed myostatin inhibition enhances muscle mass and function in tumor‐bearing mice. Am J Physiol Regul Integr Comp Physiol 2011;301:R716–R726. [DOI] [PubMed] [Google Scholar]
- 24. Zhou X, Wang JL, Lu J, Song Y, Kwak KS, Jiao Q, et al. Reversal of Cancer Cachexia and Muscle Wasting by ActRIIB Antagonism Leads to Prolonged Survival. Cell 2010;142:531–543. [DOI] [PubMed] [Google Scholar]
- 25. Agelaki S, Rounis K, Papadaki C, Monastirioti AA, Vamvakas L, Gioulbasanis I, et al. Cancer cachexia, sarcopenia and hand‐GRIP strength (HGS) in the prediction of outcome in patients with metastatic non‐small cell lung cancer (NSCLC) treated with immune checkpoint inhibitors (ICIs): A prospective, observational study. J Clin Oncol 2019;37:9099. [Google Scholar]
- 26. Burtin C, Bezuidenhout J, Sanders KJC, Dingemans AC, Schols A, Peeters STH, et al. Handgrip weakness, low fat‐free mass, and overall survival in non‐small cell lung cancer treated with curative‐intent radiotherapy. J Cachexia Sarcopenia Muscle 2020;11:424–431. [DOI] [PMC free article] [PubMed] [Google Scholar]
- 27. Aapro M, Arends J, Bozzetti F, Fearon K, Grunberg SM, Herrstedt J, et al. Early recognition of malnutrition and cachexia in the cancer patient: a position paper of a European School of Oncology Task Force. Ann Oncol 2014;25:1492–1499. [DOI] [PubMed] [Google Scholar]
- 28. Puppa MJ, Murphy EA, Fayad R, Hand GA, Carson JA. Cachectic skeletal muscle response to a novel bout of low‐frequency stimulation. J Appl Physiol (Bethesda, Md : 1985) 2014;116:1078–1087. [DOI] [PMC free article] [PubMed] [Google Scholar]
- 29. Webster JM, Kempen L, Hardy RS, Langen RCJ. Inflammation and Skeletal Muscle Wasting During Cachexia. Front Physiol 2020;11:597675. [DOI] [PMC free article] [PubMed] [Google Scholar]
- 30. Lu J, Mold C, Du Clos TW, Sun PD. Pentraxins and Fc Receptor‐Mediated Immune Responses. Front Immunol 2018;9:2607. [DOI] [PMC free article] [PubMed] [Google Scholar]
- 31. Bilir C, Engin H, Can M, Temi YB, Demirtas D. The prognostic role of inflammation and hormones in patients with metastatic cancer with cachexia. Med Oncol 2015;32:56. [DOI] [PubMed] [Google Scholar]
- 32. Stephens NA, Skipworth RJ, Gallagher IJ, Greig CA, Guttridge DC, Ross JA, et al. Evaluating potential biomarkers of cachexia and survival in skeletal muscle of upper gastrointestinal cancer patients. J Cachexia Sarcopenia Muscle 2015;6:53–61. [DOI] [PMC free article] [PubMed] [Google Scholar]
- 33. Hou Y‐C, Wang C‐J, Chao Y‐J, Chen H‐Y, Wang H‐C, Tung H‐L, et al. Elevated Serum Interleukin‐8 Level Correlates with Cancer‐Related Cachexia and Sarcopenia: An Indicator for Pancreatic Cancer Outcomes. J Clin Med 2018;7:502. [DOI] [PMC free article] [PubMed] [Google Scholar]
- 34. Callaway CS, Delitto AE, Patel R, Nosacka RL, D'Lugos AC, Delitto D, et al. IL‐8 Released from Human Pancreatic Cancer and Tumor‐Associated Stromal Cells Signals through a CXCR2‐ERK1/2 Axis to Induce Muscle Atrophy. Cancers (Basel) 2019;11:1863. [DOI] [PMC free article] [PubMed] [Google Scholar]
- 35. White JP, Baynes JW, Welle SL, Kostek MC, Matesic LE, Sato S, et al. The regulation of skeletal muscle protein turnover during the progression of cancer cachexia in the Apc (Min/+) mouse. PLoS ONE 2011;6:e24650. [DOI] [PMC free article] [PubMed] [Google Scholar]
- 36. Bossola M, Muscaritoli M, Costelli P, Bellantone R, Pacelli F, Busquets S, et al. Increased muscle ubiquitin mRNA levels in gastric cancer patients. Am J Physiol Regul Integr Comp Physiol 2001;280:R1518–R1523. [DOI] [PubMed] [Google Scholar]
- 37. Bossola M, Muscaritoli M, Costelli P, Grieco G, Bonelli G, Pacelli F, et al. Increased muscle proteasome activity correlates with disease severity in gastric cancer patients. Ann Surg 2003;237:384–389. [DOI] [PMC free article] [PubMed] [Google Scholar]
- 38. Zhang Y, Wang J, Wang X, Gao T, Tian H, Zhou D, et al. The autophagic‐lysosomal and ubiquitin proteasome systems are simultaneously activated in the skeletal muscle of gastric cancer patients with cachexia. Am J Clin Nutr 2020;111:570–579. [DOI] [PubMed] [Google Scholar]
- 39. De Castro GS, Simoes E, Lima JD, Ortiz‐Silva M, Festuccia WT, Tokeshi F, et al. Human cachexia induces changes in mitochondria, autophagy and apoptosis in the skeletal muscle. Cancer 2019;11:1264. [DOI] [PMC free article] [PubMed] [Google Scholar]
- 40. Aversa Z, Pin F, Lucia S, Penna F, Verzaro R, Fazi M, et al. Autophagy is induced in the skeletal muscle of cachectic cancer patients. Sci Rep 2016;6:30340. [DOI] [PMC free article] [PubMed] [Google Scholar]
- 41. Schmitt TL, Martignoni ME, Bachmann J, Fechtner K, Friess H, Kinscherf R, et al. Activity of the Akt‐dependent anabolic and catabolic pathways in muscle and liver samples in cancer‐related cachexia. J Mol Med (Berl) 2007;85:647–654. [DOI] [PubMed] [Google Scholar]
- 42. Beltrà M, Pin F, Ballarò R, Costelli P, Penna F. Mitochondrial Dysfunction in Cancer Cachexia: Impact on Muscle Health and Regeneration. Cell 2021;10:3150. [DOI] [PMC free article] [PubMed] [Google Scholar]
- 43. von Haehling S, Morley JE, Coats AJS, Anker SD. Ethical guidelines for publishing in the Journal of Cachexia, Sarcopenia and Muscle: update 2021. J Cachexia Sarcopenia Muscle 2021;12:2259–2261. [DOI] [PMC free article] [PubMed] [Google Scholar]
Associated Data
This section collects any data citations, data availability statements, or supplementary materials included in this article.
Supplementary Materials
Fig. S1: Flowchart of the animal experiment. Mice, 11‐weeks old, were randomly allocated to either sham control group (N = 8) or tumour‐bearing group (N = 15). One week after surgery, animals without a primary tumour in the left lung were excluded (N = 3). Only the tumour‐bearing mice which developed cachexia (OLCC; N = 8) were included for further analysis.
Fig. S2: Experimental setup animal experiment. Body weight and food intake were measured daily. At baseline (T‐3) and weekly after tumour injection (T0), forelimb grip strength was assessed and CT‐imaging was performed to assess tumour growth and muscle mass. At T0, tumour cells were injected intrapulmonary into the left lung lobe of the mice. At T7, only animals with an appropriate tumour take and location (N = 12) were included in follow up analyses. After reaching cachexia‐related Humane Endpoint (HEP), animals were euthanized and tissues were collected.
Fig. S3: Representative images of the tumour H&E. (A) Adjacent to the border with lung tissue, the tumours show a cribriform pattern with back‐to‐back glands (indicated with red arrows). (B) Towards the core, the tumour presents solid nests of clear cells with eosinophilic cytoplasm. These patterns are characteristic for a solid type lung adenocarcinoma.
Fig. S4: Representative images of Western Blot data. S: sham, O: OLCC. The intensity of the bands was normalized to Ponceau S.
Fig. S5: Horizontal bar chart of enriched biological pathways among significantly upregulated genes in OLCC mice. Enriched biological pathways are derived from three independent databases: Kyoto Encyclopedia of Genes and Genomes (KEGG; black bars), Reactome (orange bars) and WikiPathways (green bars).
Table S1: List of primers.
Table S2: List of primary antibodies.
Data S1. Supporting Information.
Data S2. Supplementary References.