Abstract
Extrusion-based bioprinting is a widely used approach to construct artificial organs or tissues in the medical fields due to its easy operation and good ability to combine multimaterial. Nevertheless, the current technology is limited to some printing errors when combining multi-material printing, including mismatch between printing filaments of different materials and error deposited materials (e.g., under-extrusion and overextrusion). These errors will affect the function of the printed structure (e.g., mechanical and biological properties), and the traditional manual correction methods are inefficient in time and material, so an automatic procedure is needed to improve multimaterial printing accuracy and efficiency. However, to the best of our knowledge, very few automated procedure can achieve the registration between printing filaments of different materials. Herein, we utilized optical coherence tomography (OCT) to monitor printing process and presented a multi-material static model and a time-related control model in extrusion-based multi-material bioprinting. Specifically, the multi-material static model revealed the relationship between printed filament metrics (filament size and layer thickness) and printing parameters (printing speeds or pressures) with different materials, which enables the registration of printing filaments by rapid selection of printing parameters for the materials, while time-related control model could correct control parameters of nozzles to reduce the material deposition error at connection point between nozzles in a short time. According to the experimental results of singlelayer scaffold and multi-layer scaffold, material deposition error is eliminated, and the same layer thickness between different materials of the same layer is achieved, which proves the accuracy and practicability of these models. The proposed models could achieve improved precision of printed structure and printing efficiency.
Keywords: Optical coherence tomography, Multi-material, Multi-nozzle, Printing control, Bioprinted scaffold
1. Introduction
237In recent years, bioprinting technology, which allows the generation of customized human organs or tissues, has become as a promising tool to meet the global demand for organ transplantation[1-3], and many works have been reported on the technology and 238applications of bioprinting, including the development and improvement of bio-ink[4], relevant bio-structure[5], and methods to achieve biological function using printed structures[6]. To pave the way for real application of printed structures, it is of great significance to simulate human organs or tissues with complex structures and heterogeneous properties. To achieve this, multi-material bioprinting is essential.
Bioprinting have various categories, including vat polymerization[7], material jetting[8], and material extrusion[9]. Among them, material extrusion is the most used method, and its advantages include flexible control of printing parameters and low requirements on the material. It also avoids the use of photo-initiators in vat polymerization that may affect the cell growth, and is easier to realize complicated structure as compared with material jetting[10-12]. In addition, by using multi-nozzles and bio-inks with live cells, extrusion-based bioprinting can establish a bio-model that remains biologically active, which can better mimic the real tissue or organ both morphologically and biologically. However, high-precision registration of the print structure and the target structure is the basis for the function of the artificial organ or tissue. Thus, applications of multi-material bioprinting impose higher requirements on printing accuracy compared with the single-material bioprinting. For example, the printing structure should perfectly match the suture defect to provide correct and sufficient mechanical support in the application of bone defect repair[13]. In the field of cell containers, high-precision registration of four printing supports with four materials can be used to simultaneously culture four types of cells in a non-contact way[14]. Therefore, some studies related with the optimization of the printing path before printing were reported to ensure printing accuracy. Sodupe-Ortega et al. studied the influence of the main parameters of multi-material 3D bioprinting and proposed two main calibration models to adjust the positions of multiple print heads to improve printing accuracy[15]. Naghavi et al. studied the deviation between the as-designed and as-built matrices, and designed compensation strategy before the fabrication of scaffolds, which can improve the printing accuracy[16].
Among all contributing factors, the properties of printing materials and the printing parameters are primary factors that influence printing accuracy[17,20]. The material properties include physical properties[21], viscoelasticity, thixotropic property[22], and fluidity[23], and the printing parameters include the pressure applied during printing, the moving speed and the temperature of the platform, and the printing nozzle[24]. Normally, for the same material, the relationship between the printing parameters and the filament size of the printed filaments is studied by later imaging results to achieve improved printing accuracy. For example, Zhou et al. proposed a model for silica gel material, which can predict and control the filament size between the critical moving speed and the limit moving speed[25]. Considering the distinguished properties difference between various materials in multi-material bioprinting, the same printing parameters used for different materials would generate matching errors between the printed structures, such as layer thicknesses deviation or filament sizes difference between different materials, resulting in crack or collapse of the overall printed structure.
Especially, extrusion-based biological 3D printing has been the simplest and popular bio-printing technique among the multi-material printing methods. This method usually uses multi-nozzle for different materials, and mechanically switches nozzles to change the material. In this way, different materials can be deposited in the same or different layers[26]. Errors are easily produced in the printing process, such as the problem of under-extrusion and over-extrusion. To improve the extrusion-based printing process, Hoelzle et al. adopted compression dynamic model which proposed that the system presents response hysteresis at both the start and end positions[27]. However, efficiency suffers from their manual error correction method. Armstrong et al. employed the process monitoring method to determine the time to reduce the pressure input signal to correct the error and make ensure that material was deposited in the correct position[28,29]. However, the method Armstrong et al. proposed failed to solve the problem of separation or overlapping of extruded materials at the connection point between different nozzles.
In order to improve printing accuracy in multi-material extrusion-based bioprinting process, efficient imaging technology are required to evaluate the state of 3D-printed models to correct printing errors for high-precision structure construction. It was reported that Almela et al. used micro-CT technology to analyze the porosity and connectivity of printed bone scaffolds[30]. Gerdes et al. used camera imaging to quantify the effect of process variables on the exactness of the dimension and shape of the deposited strand[31]. However, these technologies mentioned above are limited by the imaging results with relatively low resolution and ability of only providing 2D structural information. To overcome these disadvantages, optical coherence tomography (OCT) is utilized to facilitate the structural observation in label-free, noninvasive 3D imaging of printing structure. For example, Joshua et al. developed a multi-material bioprinting platform with integrated OCT, which can enable quantitative 3D volumetric imaging with micron resolution over centimeter length scales, the ability to detect a range of print defect types within a 3D volume, and real-time imaging of the printing process at each print 239layer[32]. Our previous work also used OCT to realize realtime multi-parameter quantization and feedback during the bioprinting process for mono-material[33], which shows superiority in data collecting as feedback in the bioprinting process. Thus, in situ volumetric imaging, error detection, and 3D reconstruction can be realized by OCT, which provides a comprehensive method for print quality assessment, paving the way to establish establishing high- precision registration procedure for improving the printing accuracy.
In this study, the multi-material static model and the time-related control model were built with the benefit of OCT technology to achieve high-accuracy multi-material printing. Specifically, the static model was adopted to quickly determine the printing parameters for different materials under the required filament size or layer thickness, realizing the registration of different materials. The control model determines the time-relevant response of nozzles for each material at the starting or ending points and may automatically correct for errors in one or two correction cycles, which can improve both the registration precision at connection points and the overall printing efficiency. In the end, these models are used to printed single-layer scaffold and multi-layer scaffold, and these experiments results show that different material printing paths have the same layer thickness, and materials are precisely extruded at the connection point between different nozzles. Experiments were conducted to demonstrate the feasibility of the proposed method. In other words, the method is helpful to improve the printing accuracy and efficiency of multi-material and multi-nozzle printing.
2. Materials and methods
2.1. Bioprinting system and printing materials
In this study, we adopted the self-developed 3D bioprinting system (Regenovo Bio-Architect PX, Hangzhou Regenovo Biotechnology Co, Ltd.) based on optical coherence tomography[34]. The 3D bioprinting system integrated with a swept-source OCT (SS-OCT) model whose probe was mounted next to the extrusion nozzle for on-site process monitoring. Specifically, a swept laser source (HSL-20- 50-M, Santec) was adopted with a central wavelength of 1310 nm, a bandwidth of 105 nm, a scanning rate of 50 KHz, and an axial resolution of 7.2 μm in the air[34]. The sensitivity of the system was about 68 dB[34]. The maximum axial range of the system was 6 mm (z) in the air, and the transverse field-of-view was 19 mm (x) × 19 mm (y). The actual sizes of a pixel in transverse and axial directions were 19.4 μm and 5.8 μm, respectively.
The 2D projection view restored from the 3D OCT data was used to analyze the filament size and layer thickness. The projection of the filament on the XY plane and XZ plane was shown in Figure 1A. In the red box of XY plane in the figure, along the X direction, we counted the number of a pixel value of 1 in the Y direction (Numi) at each position (Xi) and the filament pixel size was . In the XZ plane, the pixel layer thickness was Ztop-Zbottom, Ztop was the pixel coordinate with pixel values greater than 0 appearing first at the top in the Z direction, and Zbottom was the pixel coordinate in the Z direction at the bottom. Thus, the filament size was and the layer thickness was .
Figure 1.
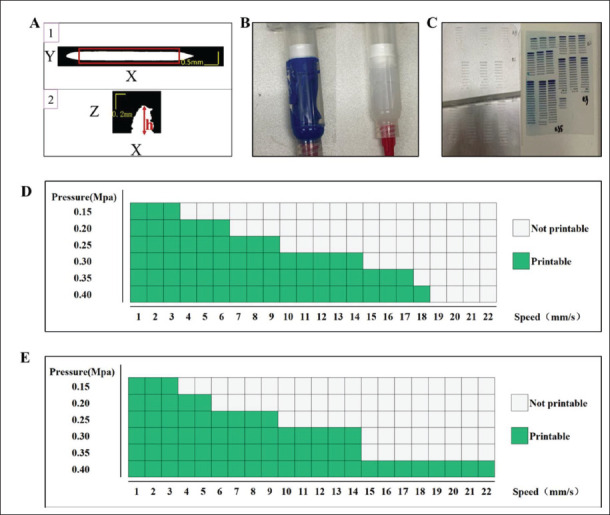
OCT data, printed materials, experimental results and the feasible parameter range for different materials. (A) XY plane projection and XZ plane projection of OCT data. (B) The print material: 1 is paste silica gel (i.e., silica gel- B) and 2 is semi-flowing silica gel (i.e., silica gel-W). (C) Experimental printing results of the two types of silica gel. (D) Feasible parameter range for the silica gel-W. (E) Feasible parameter range for the silica gel-B.
In this study, we focused on the silica gel materials which are commonly used in the bioprinting field. Two different silica gels with different viscosity properties, silica gel-B and silica gel-W, were used in our study to experimentally demonstrate different printing materials, namely paste type and semi-flowing type, respectively. The extrusion rate of semi-flowing silica gel was greater than that of paste silica gel, and the surface drying time of paste silica gel was less than that of semi-flowing silica gel. In Figure 1B, the material on the left was silica gel-B, and the material on the right was silica gel-W.
2.2. Multi-material static model
Due to the different rheological properties between materials, the same printing parameters will lead to different printed filament metrics (i.e., filament size and layer thickness), causing mismatch between the printed structure and the target structure. If the nonadditive effect and interaction between different materials during bioprinting can be omitted, a static printing model can be established to provide a feasible range for the one material and reveal the relationship between filament metrics and the printing parameters.
During a certain printing process, speed and pressure play the most important role in controlling the filament metrics among all the potential printing parameters[35]. The two silica gel materials selected in this experiment can be cured at normal atmospheric temperature, and the small-diameter nozzle is more capable of printing delicate structures[36]. Thus, we selected a 0.26 mm nozzle for printing, and studied the effect of speed and pressure on the filament metrics with different silica gel. Then, both silica gel materials were used within a pressure range of 0.15–0.40 Mpa with an interval of 0.05 Mpa, a speed range of 1–22 mm/s with the interval of 1 mm/s to print a series of filaments with a length of 8 mm. The same parameters were applied in three groups. Actual printing results are shown in Figure 1C. Through observation, the printing240 parameters that could print straight filaments were chosen as the feasible parameter range. The range of feasible parameters for different silica gel materials was different. The feasible parameter range for silica gel-W and silica gel-B are shown in Figure 1D and E, respectively.
In the feasible parameter range, the relationship between the printing parameters (speeds and pressure) and the filament metrics was established as the static model of silica gel-B and silica gel-W, as shown in Figure 2. Specifically, the OCT was used to collect structural data from different materials, and the restored XY plane and XZ plane images of OCT were used to quantify filament size and layer thickness, respectively. Figures 2A1, A3 and B1, B3 show the numerical values of the filament metrics from different silica gel materials within their own feasible parameters ranges. In multi-material static model, the filament size of the same material initially decreased with the increase speed under the same pressure, and then the filament size was stable when the speed increased to a certain range. The filament size of the same material was also increased with increased pressure under the same speed. The layer thickness of the same material was decreased with increased speed under same pressure. Due to the instability of the material, the metrics of the filament printed under the same parameters will fluctuate. Therefore, the reciprocal of the standard deviation of241 the quantized results of filament size and layer thickness under the same print parameters, S (i.e., , where xi is the variable, is the mean value, and N is the population numbers) was used to evaluate the stability of the filament size and layer thickness. A larger S is more stable and S = 0 denotes the nonprintable condition, as shown in Figures 2A2, A4 and B2, B4. Thus, the optimal set of speed–pressure pairs could be obtained for the target filament size or layer thickness by first determining the curve, and then choosing the pair with the highest S value. In this case, printing parameters of different materials can be chosen individually, achieving a precise registration of filament size or layer thickness between different materials.
Figure 2.
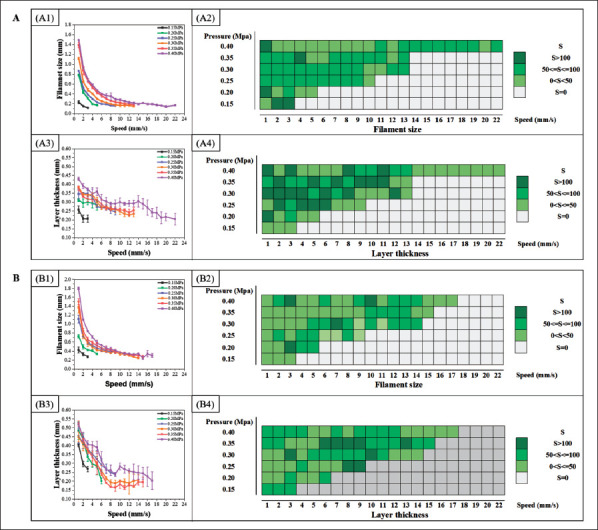
The static model of silica gel-B and silica gel-W. (A) The static model of silica gel-B. A1 and A3 are filament size curves and layer thickness curves with different print parameters (speed and pressure); A2 and A4 are the stability analysis of filament size and layer thickness, where a larger value of S indicates that the printing parameter is more stable. (B) The static model of silica gel-W. B1 and B3 are filament size curves and layer thickness curves with different print parameters (speed and pressure); B2 and B4 are the stability analysis of filament size and layer thickness, where a larger value of S indicates that the printing parameter is more stable.
2.3. Printing model of multi-material bioprinting matching
Maintaining the same layer thickness of different materials on the same layer affects the accuracy of printing, and the determination of printing parameters is vital to keep the layer thickness; therefore, a multi-material bioprinting 242matching model can be obtained with the multi-material static model. The model is used to determine the printing parameters of the same filament metrics under printing parameters to design printing path better so that the printing structure is registered with the target structure with high precision.
Specifically, the layer thickness was designed as H for the process requirements, and printing parameters of the materials required for the process were determined using the multi-material static model (i.e., the printing parameter with the largest S). Then, the filament size printed by the materials required under the corresponding printing parameters can be obtained using the static model. Suppose the filament size of material 1 is 2 * d1 and that of material 2 is 2 * d2 and the path is designed with a target distance d between the connecting positions of two materials, the adjusted distance between the two materials is dʹ = d1 + d + d2.
2.4. Time-related control model
Multi-nozzle printing requires distributing different materials by constantly switching nozzles. For example, the moving speeds of nozzle 1 and nozzle 2 were V1 and V2, respectively; nozzle 2 was switched on to print after the path of nozzle 1 was finished. In the connection point between nozzles, the printing strategies could be divided into two categories: (i) nozzle 1 and nozzle 2 were at same point when starting or ending printing, i.e., the starting (or ending) point of nozzle 2 was connected to the starting (or ending) point of nozzle 1; (ii) nozzle 1 and nozzle 2 were at different points when starting or ending printing, so the starting (or ending) point of nozzle 2 was connected with the ending (or starting) point of nozzle 1. At this point, due to the extrusion delay of nozzles, two problems may occur in the printing result, one was the paths of extruded materials are separated (under-extrusion), and another was the paths of extruded materials are overlapped (overextrusion). Therefore, the parameters of nozzle should be controlled, that is, taking the time of advance extrusion (AET) at the starting point and the position of advance termination of extrusion (ATEP) at the ending point. Based on the print result, these parameters function as control variables to establish different models. These models will be used to avoid the trial and error in artificial correction of parameters, and obtain the target path of extruded materials (good extrusion) by a few numbers of parameter corrections. The specific content of these models in detail were described as follows.
2.4.1. Common-starting/ending-point model (model 1)
When the starting point of nozzle 2 was connected with the starting point of nozzle 1 (common-starting -point), the initial values of the AET of nozzle 1 was T1, and the AET of nozzle 2 was T2. Then, T2 was updated according to the under-extrusion result. Suppose the separated distance between materials at the connection point at this time was L, as shown in Figure 3A1 and the speed of nozzle 2 was V2, then the additional time for nozzle 2 was
Figure 3.
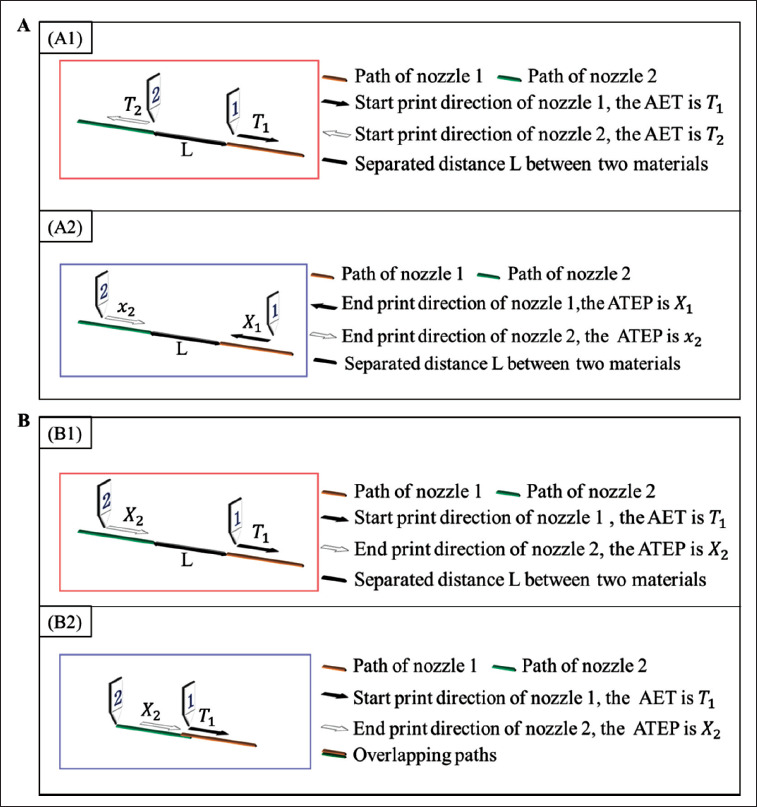
Time-related nozzle control model. (A) Nozzle control model 1. A1 is the first case where the starting point of nozzle 2 is connected to the starting point of nozzle 1; A2 is the second case where the ending point of nozzle 2 is connected to the ending point of nozzle 1. (B) Nozzle control model 2. B1 is the first case where the ending point of nozzle 2 is connected to the starting point of nozzle 1; B2 is the second case where the ending point of nozzle 2 is connected to the starting point of nozzle 1.
| (I) |
The AET for nozzle 2 was updated to:
| (II) |
When the ending point of nozzle 2 was connected with the ending point of nozzle 1 (common-ending-point), as shown in Figure 3A2, the initial values for ATEP of nozzle 1 and nozzle 2, namely X1 and X2, were first set. When overextrusion was found in the print result, X2 was updated to:
| (III) |
where was the updated value of X2. The update process continued until good extrusion could be obtained in the result. We found that usually only one or two cycles of such parameter correction was needed to achieve high precision.
2.4.2. Ending/starting-point-starting/ending-point model (model 2)
When the ending point of nozzle 2 was connected with the starting point of nozzle (ending-point-starting-point), as show in Figure 3B1, the AET of nozzle 1 (T1) and the ATEP of nozzle 2 (X2) were controlled to solve the problem of under-extrusion and over-extrusion at the connection point between nozzles. Good extrusion effect could be achieved for this point after one or two cycles of parameter correction.
When the initial values for T1 and X2 were both 0, in the first case, there was a separated path between the two materials, and the distance was L. Suppose the speed of nozzle 1 was V1, the AET of nozzle 1 should be optimized as:
| (IV) |
In the latter case, the printing result showed overlapping paths between extruded materials, as shown in Figure 3B2. The ATEP of nozzle 2 need optimized while the AET of nozzle 1 was kept unchanged. The X2 for nozzle 2 was first assigned with a large value. When the ATEP of nozzle 2 was adjusted to x2, the print result was the same as the situation shown in Figure 3B1, and the separated distance is L. Then, to ensure that the two materials will not accumulate at the conjunction point, the updated value of ATEP of nozzle 2 came to:
| (V) |
243When starting point of nozzle 2 was connected with the ending point of nozzle (starting-point-ending-point), this situation was the same as that of end-point-starting-point, the AET of nozzle 2 (T2) and the ATEP of nozzle 1 (X1) are corrected through once or twice that achieve good extrusion. For example, if separated path between the two materials occurs at this point, T2 is to be updated; if this point has excessive material deposition, X1 is to be updated.
Using the print path shown in Figure 4A, the connections point between nozzles were shown in area 1 and area 2. Combination of the print path and different printing methods as shown in Figure 4B and C, the above print strategies were used in the connection point between nozzles.
Figure 4.
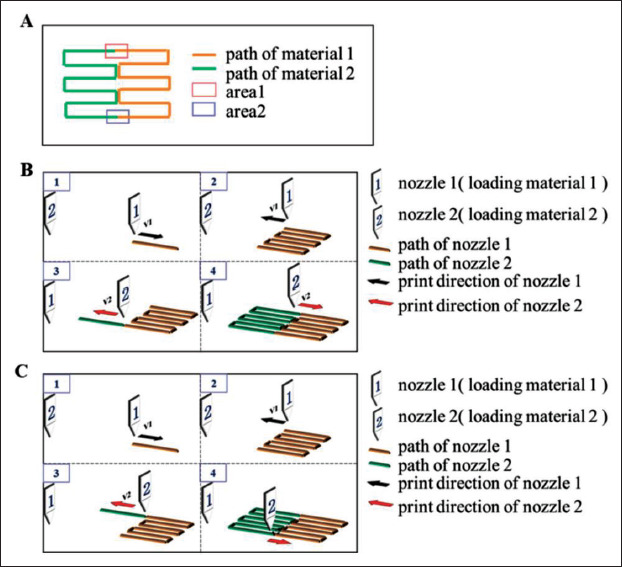
Printing path and the printing process for different models. (A) Printing path. (B) The printing process, where 1 refers to nozzle 1 and 2 refers to nozzle 2; the process of the first printing method is 1-2-3-4. (C) The printing process, where 1 refers to nozzle 1 and 2 refers to nozzle 2; and the process of the second printing method is 1-2-3-4.
2.5. Workflow of the multi-nozzle, multi-material bioprinting process
The flowchart of the printing process with the proposed method is illustrated in Figure 5. The printing requirements are determined in advance, and the following steps can be taken to achieve a high-precision registration between materials.
Figure 5.
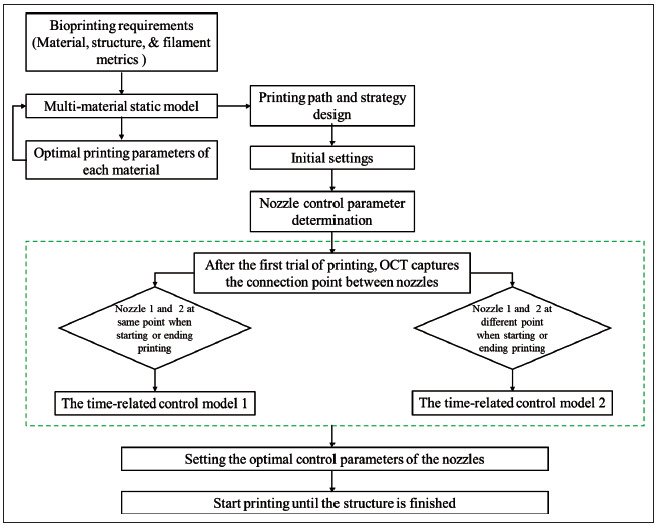
The flowchart of the printing process with the proposed method.
-
(i)
Step 1: The static models for the used materials are retrieved and the optimal printing parameters 244(i.e., pressure and speed) with the best stability are obtained with target filament metrics.
-
(ii)
Step 2: The trajectory and connection strategy for each nozzle is designed.
-
(iii)
Step 3: A 1-layer trajectory is printed, and connection areas are evaluated from OCT data.
-
(iv)
Step 4: nozzle control parameters (i.e., AET and ATEP) are optimized for each nozzle to improve connection performance.
-
(v)
Step 5: Printing with optimal parameters is performed.
3. Results
3.1. Experiment of optimizing printing path
In the first experiment, the layer thickness of the two materials (H) was designed to be consistent with a nominal value of 0.28 mm. Based on the printed structures of multimaterial bioprinting matching, the printing parameters of the two materials in the multi-material static model was selected. In detail, the printing parameters of silica gel-W and the silica gel-B were both selected as 6 mm/s and 0.3 Mpa. Meanwhile, the filament size of the silica gel-W (d1) and silica gel-B (d2) could be obtained as 0.42 mm and 0.26 mm, respectively. The printing path shown in Figure 4A was adopted in the experiment. Nozzle 1 and nozzle 2 were loaded with silica gel-B and silica gel-W, respectively.
Before the optimization of the printing path and printing parameters, obvious defects were observed in the printing results, as shown in colored boxes in Figure 6, such as the changing of the filament size at the corner, the over-extrusion at intermediate connection area, and the over- or under-extrusion of the two materials at the connection point. The printing path was further optimized to balance the filament sizes at the corners, and the design scheme was illustrated in Figure 7A. The solid line denoted the printing path for silica gel-B, and the dotted line denotes the printing path for silica gel-W. The area in the box was the connection area between the middle corners of the two materials, and the designed distance between the two materials (dʹ) was 0.45 mm (dʹ = 0.7 * d1 + 0 + 0.6 * d2 = 0.45 mm). As the filament metrics of the printed corners would change, the following pre-experiments were performed on the parameter selection of the corners. To245 obtain the best speed at the corners, the speed was changed to 7 mm/s, 8 mm/s and 9 mm/s at different corners, which was marked by the colored lines in Figure 7A.
Figure 6.

Print map of nonoptimized path.
Figure 7.
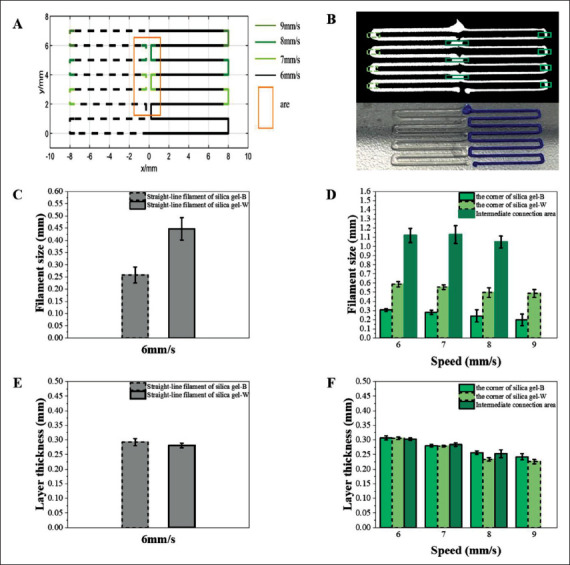
Path design and experimental results. (A) Designed path, where the solid line is the printing path for silica gel-B, and the dotted line is the printing path for silica gel-W. (B) OCT data projection diagram and printed result. (C) Filament size of the printed results with different material at the speed of 6 mm/s. (D) Filament size of different corner positions at different speeds. (E) The layer thickness of printed filament with different materials at 6 mm/s speed. (F) Layer thickness of different corners at different speeds.
By using data from the OCT, the 3D structure of the whole path was obtained, and the projection map in the XY plane and printed result are shown in Figure 7B. The filament metrics of corners and the connection area of both materials were all quantified. The straight-line filament metrics of different materials are shown in Figure 7C and E, respectively. The filament size of the straight-line filament with silica gel-B and silica gel-W was 0.26 ± 0.0329 mm and 0.43 ± 0.0460 mm at a speed of 6 mm/s, respectively. At a speed of 6 mm/s, the layer thickness of filament with246 silica gel-B and silica gel-W was 0.29 ± 0.0154 mm and 0.28 ± 0.0080 mm, respectively. The error between the experimental filament metrics and the static model was about 0.01 mm, and the layer thickness error of different materials in the experiment was about 0.01 mm, which was within the acceptable range. Thus, the experimental results prove the accuracy of the static model.
The quantitative results, which were obtained in the pre-experiment, of filament metrics at corners with different speeds are shown in Figure 7D and F. The best corner-control parameter obtained for 6 mm/s printing was to speed up to 7 mm/s at 0.5 mm before the corner and return to 6 mm/s at 0.5 mm after the corner. The filament size of the right corner with silica gel-B was 0.27 ± 0.0374 mm, and the layer thickness was 0.28 ± 0.004 mm; the left corner filament size with silica gel-W on the left was 0.45 ± 0.0227 mm, and the layer thickness was 0.28 ± 0.003 mm; the filament size and the layer thickness of the connection area were 0.80 ± 0.0201 mm and 0.28 ± 0.006 mm, respectively.
3.2. Experiment of nozzle control parameters optimization
3.2.1. Experiment of nozzle control for model 1
247The common-starting/ending-point path and printing method are shown in Figure 8A1, with the control parameters of the nozzles shown in Table 1. Area 1 was the common-starting-pointed area, the AET of nozzle 1(T1) and nozzle 2 (T2) was set to 60 ms and 0 ms, respectively; and area 2 was the common-ending-pointed area, where the ATEP of both nozzles were not set to 0 mm (X1 = X2 = 0 mm). The OCT data projection of area 1 and area 2 is shown in Figure 8A2. The separation of printed paths in area 1 and the overlapping of printed paths in area 2. In area 1, the average pixel size of the middle interval was 18 px, so the separated distance between the two materials was 0.349 mm.
Figure 8.
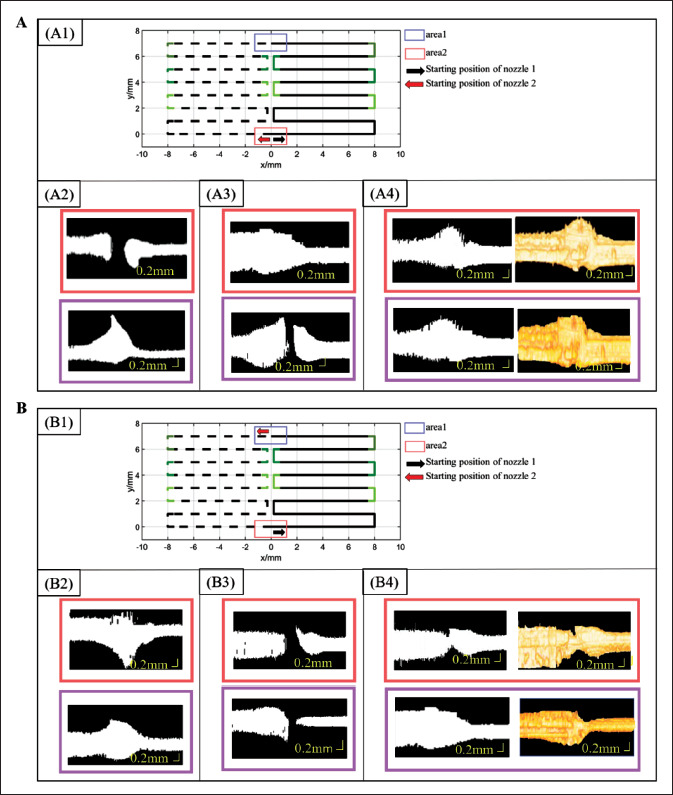
Experimental results of time-related nozzle control model. (A) Experimental results of nozzle control Model 1. A1 is the designed path, where the solid line is the printing path for silica gel-B, and the dotted line is the printing path for silica gel-W; A2 is OCT data projection map of area 1 and area 2 at initial state; A3 is OCT data projection of area 1 and area 2 at initial control state; A4 is OCT data projection map and reconstruction map of area 1 and area 2 after optimization. (B) Experimental results of nozzle control Model 2. B1 is the designed path, where the solid line is the printing path for silica gel-B, and the dotted line is the printing path for silica gel-W; B 2 is OCT data projection map of area 1 and area 2 at initial state; B3 is OCT data projection of area 1 and area 2 at initial control state; B4 is OCT data projection map and reconstruction map of area 1 and area 2 after optimization.
Table 1. Initial control parameters of nozzle 1 and nozzle 2 in nozzle control model 1.
| Position | Controlled parameters | Nozzle 1 | Nozzle 2 |
|---|---|---|---|
| Area 1 | AET (T) | 60 ms | 0 ms |
| Area 2 | ATEP (X) | 0 mm | 0 mm |
Model 1 was then adopted for area 1 and area 2. First, in area 1, T1 is 60 ms, which remains unchanged, the speed of nozzle 2 (V2) was 6 mm/s, and its AET was updated to 60 ms (T2 = 0.349/6 ms ≈ 60 ms). In area 2, X1 and X2 were set to 0.5 mm and 0.8 mm, respectively. The initial control parameters of the two nozzles are shown in Table 2. As248 shown in Figure 8A3, the printing result started to connect at the point of area 1, and there was no need to continue to update the control parameters of the two nozzles in area 1. There was a separation of printed paths in area 2. The average pixel size of the interval was 10 px, and the separated distance was 0.194 mm. Therefore, the ATEP of nozzle 2 was changed to 0.6 mm (X2 = 0.8 - 0.194 ≈ 0.6 mm).
Table 2. Control parameters 1 of nozzle 1 and nozzle 2 in initial state.
| Position | Controlled parameters | Nozzle 1 | Nozzle 2 |
|---|---|---|---|
| Area 1 | AET (T) | 60 ms | 60 ms |
| Area 2 | ATEP (X) | 0.5 mm | 0.8 mm |
The optimized control parameters of the two nozzles are shown in Table 3. The OCT data projection and reconstruction of area 1 and area 2 are shown in Figure 8A4, respectively. The two materials at area 1 and area 2 had been connected, and there was no over-extrusion or underextrusion. Therefore, the nozzle parameters listed in Table 3 were optimization parameters for the condition where the two nozzles share the same starting or ending point.
Table 3. Optimized control parameters for nozzle 1 and nozzle 2 control in model 1.
| Position | Controlled parameters | Nozzle 1 | Nozzle 2 |
|---|---|---|---|
| Area 1 | AET (T) | 60 ms | 60 ms |
| Area 2 | ATEP (X) | 0.5 mm | 0.6 mm |
3.2.2. Experiment of nozzle control for model 2
The path and printing method of the ending/starting- point-starting/ending-point are shown in Figure 8B1. The printing parameters of both nozzles were not set in area 1 or area 2, as shown in Table 4. At this time, there was overextrusion in area 1 and area 2, as shown in Figure 8B2. Therefore, the model of nozzle control was adopted for area 1 and area 2.
Table 4. Control parameters 2 of nozzle 1 and nozzle 2 in initial state.
| Position | Nozzle 1 | Nozzle 2 |
|---|---|---|
| Area 1 | AET (T) 0 ms | ATEP (X) 0 mm |
| Area 2 | ATEP (X) 0 mm | AET (T) 0 ms |
First, the printing parameters set for the two nozzles are listed in Table 5. No AET was set for nozzle 1 at area 1 (T1 is 0 ms), and ATEP of nozzle 2 (X2) was set to 1 mm. At area 2, the ATEP of nozzle 1 (X1) was 1 mm, and the AET of nozzle 2 remained 0 (T2 is 0 ms). The OCT projection images of area 1 and area 2 are shown in Figure 8B3. The printing path between the materials in area 1 was separated. The average pixel size of the middle interval was about 15 px, the distance of early terminate extrusion should be 0.2371 mm. Thus, the ATEP of nozzle 2 was updated to 0.8 mm (X2 = 1 - 0.2371 ≈ 0.8 mm). Area 2 also had a separation of printed paths, and the average pixel size of the middle interval was about 12.5 px, that is, 0.2914 mm. The ATEP of nozzle 1 was updated to 0.7 mm (X1 = 1 - 0.2914 ≈ 0.7 mm).
Table 5. Initial control parameters of nozzle 1 and nozzle 2 in nozzle control model 2.
| Position | Nozzle 1 | Nozzle 2 |
|---|---|---|
| Area 1 | AET (T) 0 ms | ATEP (X) 1 mm |
| Area 2 | ATEP (X) 1 mm | AET (T) 0 ms |
The optimized control parameters for the two nozzles are listed in Table 6. Figure 8B4 shows the reconstructed OCT models of area 1 and area 2. After the nozzle control parameters were optimized, the two materials showed a good connection without overlapping material in area 1 and area 2.
Table 6. Optimized control parameters for nozzle 1 and nozzle 2 control in model 2.
| Position | Nozzle 1 | Nozzle 2 | |
|---|---|---|---|
| Area 1 | AET (T) 0 ms | ATEP (X) | 0.8 mm |
| Area 2 | ATEP (X) 0.7 mm | AET (T) | 0 ms |
3.3. Multi-material bioprinting of single-layer scaffold
According to the results of the corner optimization of the above path and the results of optimizing the nozzle parameters, the different printing methods of the singlelayer support were designed, as shown in Figures 9A and 10A. The spacing between the two materials at the middle corner was designed to be 0.45 mm, the printing corner speed was increased to 7 mm/s at 0.5 mm in advance of the corner and 0.5 mm out of the corner, and the printing speed of the remaining straight lines was maintained at 6 mm/s.
Figure 9.
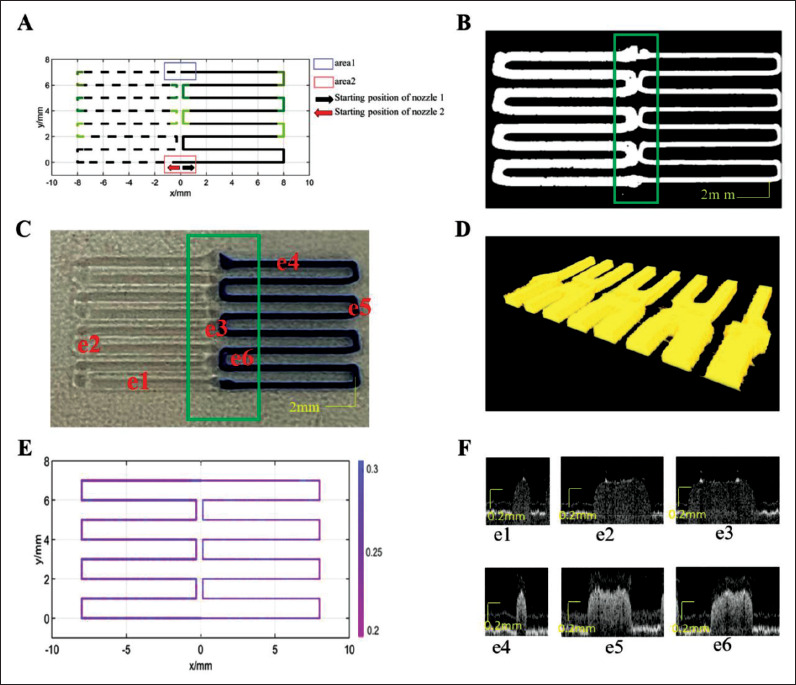
Single-layer scaffold path for design 1 and printing results. (A) Designed path, where the solid line is the printing path for silica gel-B, and the dotted line is the printing path for silica gel-W. (B) Projection image from OCT data. (C) Printed result. (D) OCT data reconstruction map of the box area in (C). (E) Layer thickness distribution along the path. (F) Cross-sectional images from OCT data at different positions.
Figure 10.
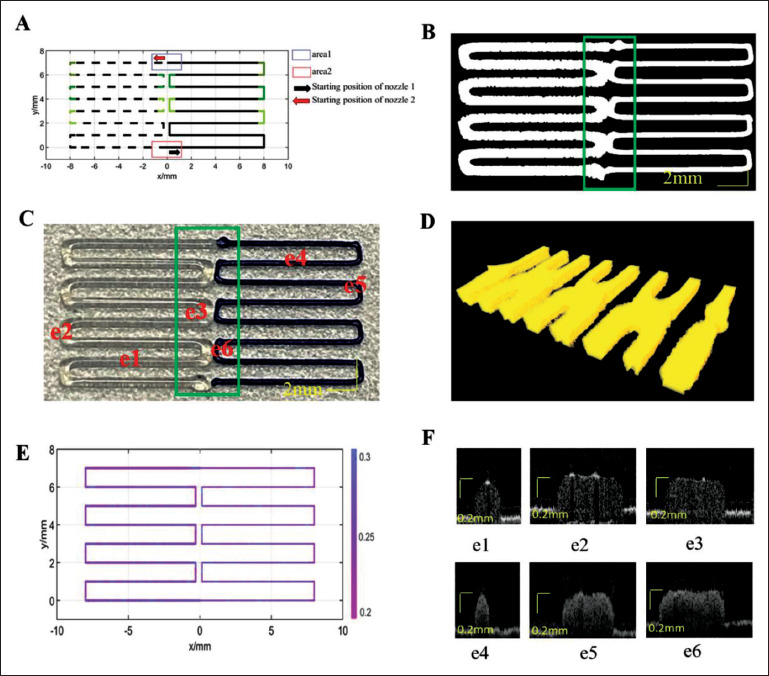
Single-layer scaffold path for design 2 and printing results. (A) Designed path, where the solid line is the printing path for silica gel-B, and the dotted line is the printing path for silica gel-W. (B) Projection image from OCT data. (C) Printed result. (D) OCT data reconstruction map of the box area in (C). (E) Layer thickness distribution along the path. (F) Cross-sectional images from OCT data at different positions.
When the starting and ending points of the two nozzles were coincided, according to the optimization results of the above nozzle control parameters, the optimization parameters of the control nozzle are shown in Table 3. In area 1, the AET of nozzle 1 and nozzle 2 were both set to 60 ms. In area 2, the ATEP of nozzle 1 was set to 0.5 mm, and that of nozzle 2 was set to 0.6 mm in advance. We249 printed according to the optimization of path and nozzle control parameters, the OCT projection images are shown in Figure 9B, and the actual printing result is shown in Figure 9C. Figure 9D shows the OCT data reconstruction map of the box area in Figure 9C, the box area included the intermediate connection area and the connection point of two materials, and the materials in the area were successfully extruded. The layer thickness of this path was quantified as shown in Figure 9E. Figure 9F shows the cross-sectional view of different silica materials at different positions from OCT data, e1–e3 and e4–e6 are the layer thickness maps of silica gel-W and silica gel-B at the straight-line position, the right corner, and the middle corner, respectively. The average layer thickness of this path was 0.2938 ± 0.0282 mm, which was within an acceptable range of the 0.28 mm required by the process.
The optimal parameters for controlling the two nozzles for different starting and ending points are shown in Table 6. In area 1, ATEP was 0 mm for nozzle 1 and 0.8 mm for nozzle 2; in area 2, ATEP was 0.7 mm for nozzle 1 and 0 for nozzle 2. The OCT data projection is shown in Figure 10B, and the printing result is shown in Figure 10C. Figure 10D shows the OCT data reconstruction map of the box area in Figure 10C. The two materials were precisely connected at the connection point, and there was not overextrusion and under-extrusion. The layer thickness of this path was quantified, and its distribution is shown in Figure 10D. The OCT data layer thickness cross-sections of the locations are shown in e1–e6 in Figure 10E. The average layer thickness along this path was 0.2734 ± 0.0456 mm, and the layer thickness error with 0.28 mm was about 0.0071 mm.
3.4. Multi-material bioprinting of multi-layer scaffolds
Three-layer scaffolds were printed whose printing path is shown in Figure 11A. As shown in Figure 11C, the250 printing result without optimization had the problem of over-extrusion on the first layer of the support. Thus, it was impossible to print the subsequent layers. After the proposed path optimization and print nozzle control parameter optimization, the top view of the actual printing result is shown in Figure 11D. The OCT data projection of the result and the OCT data reconstruction map of the box area are as shown in Figure 11B. There was no over-extrusion of materials at the connection areas or at the corners, indicating a good printing effect. After the printing with the proposed method, the OCT was used to collect data for the whole scaffolds and quantify the layer thickness at the numbered position as shown in Figure 11E. As shown in Figure 11F, the target layer thickness is 0.28 mm, the real layer thickness of the top layer is 0.28 ± 0.0179 mm, and the height of the whole scaffold is 0.82 ± 0.0151 mm, corresponding to a relative error of 1.08%.
Figure 11.
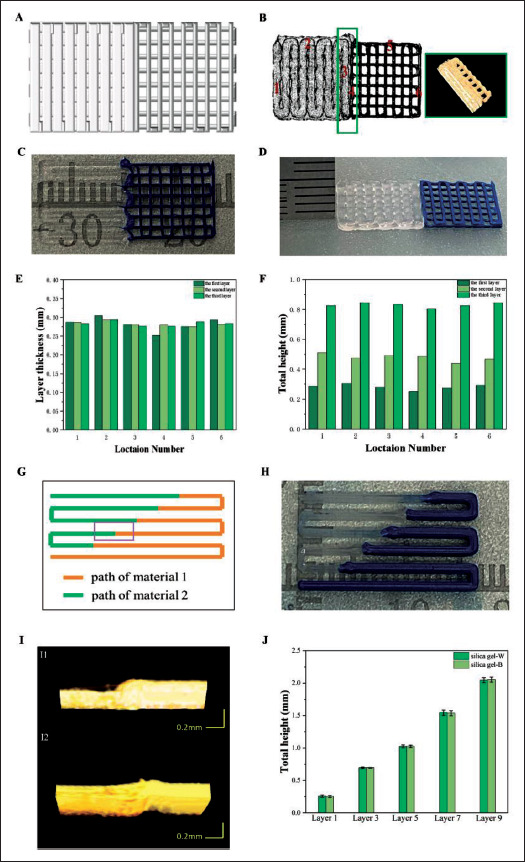
Multi-layer scaffold design and printing results. (A) Designed path of three-layer scaffold. (B) OCT data projection of optimized three-layer scaffold and OCT data reconstruction map of the box area. (C) Printed three-layer scaffold before optimization. (D) Printed three-layer scaffold after optimization and actual layer thickness. (E) Layer thickness distribution at different locations in different layers of three-layer scaffold. (F) Total height at different locations in different layers of three-layer scaffold. (G) Designed path of nine-layer scaffold. (H) Printed nine-layer scaffold after optimization. (I) The OCT data reconstruction map of the same connection point during printing. I1 is before nozzle control optimization and I2 is after the optimization. (J) Total height in different layers of nine-layer scaffold.
A two-material, nine-layer scaffold was printed using the proposed method with a design layer thickness of 0.26 mm. Its designed path is shown in Figure 11G and the result is shown in Figure 11H. In this experiment, connection points were arranged at different positions of the line segments. The parameters for two materials were obtained from the static model, which were 0.25 Mpa and 7 mm/s for silica gel-W and 0.35 Mpa and 8 mm/s for silica gel-B. Nozzle 1 was used to print silica gel-B and nozzle 2 for silica gel-W. After the print of one layer and analysis using OCT, the nozzle control parameter set for nozzle 1 is {AET = 90 ms, ATEP = 0.5 mm} and the set for nozzle 2 is {AET = 60 ms, ATEP = 0.5 mm}, which already eliminates the material accumulation or gap, as shown in Figure 11I. The total height for the scaffold in the printing process was evaluated using OCT data and is illustrated in Figure 11J, and the total heights of the nine-layer scaffold for gel-W and gel-B are 2.04 ± 0.0386 mm and 2.05 ± 0.0395 mm,251 respectively, which indicates a good uniformity in layer thickness between different materials.
4. Discussion
As indicated by many studies, multi-material printing is necessary for the bioprinted tissues to maintain the distinct morphology features and complicated function signatures of their in vivo counterparts’ organs. The high-precision printed structure is the basis of realizing the function of target structure. However, the distinguished properties in different materials lead to errors in multi-material printing, which often requires a tedious trial-and-error process to obtain a good outcome, resulting in a huge waste of material. Therefore, this study is aimed at establishing a printing model (multi-material static model and time-related 252control model), which provides control parameters for multi-material printing, achieving improved printing accuracy of multi-material 3D-printed scaffolds.
In this study, we used an extrusion-based multi-nozzle printer to establish printing model in the OCT monitoring printing process. Compared with the conventional machine vision method[37], OCT imaging technology not only quantifies the error in the print plane, but also detects the defects in the depth direction, which allows for a more accurate evaluation of the fracture degree and material accumulation at the connection points in our pre-experimental model, as shown in Figures 7 and 8. In addition, OCT imaging enables different layers of the scaffold to be distinguished during printing and allows the 3D evaluation of the printing result, as shown in Figures 9–11.
In a previous study on the complex relationship between printing parameters and filament size, main attention has been paid to optimize the printing parameter of a single material[38], but in this study, we focused more on the registration between the filament metrics (filament size and layer thickness) with different materials. In the multi-material static model, we found that the filament size and the layer thickness of different materials with the same needle cannot be guaranteed to be the same by adjusting the printing parameters, as shown in Figure 2. However, according to the characteristics of multi-material printing, the key is to keep the same layer thickness of printed filaments of different materials on the same plane. Therefore, the printing parameters were selected and were optimized in corner area according to the target layer thickness, and a good match of the layer thicknesses of different materials in the same plane was obtained, as shown in Figures 9E and 10E.
The smooth transition of the connection points between different materials is one of the key problems in multi-material printing. To solve this problem, we studied the extrusion delay property of the nozzles at the starting and ending point in the multi-nozzle printing process. We established a time-related control model, monitoring the results of different nozzle printing strategies using OCT and optimizing the control parameters of each nozzle in one or two cycles. The above experimental results showed that the materials extruded by different nozzles were closely and smoothly connected in the connection points, the problem of stress concentration in this area was alleviated, and the overall accuracy of the printing scaffold was improved, as shown in Figure 8.
To investigate the feasibility of the connection registration method using nozzle control parameters in a general condition, a circle trajectory with a radius of 4 mm and a triangle with 8 mm bottom edge and height was designed and printed. The designed trajectories and the printing strategies are illustrated in Figure 12A and D, respectively. The pressure is set to 0.30 Mpa and the speed is 6 mm/s to obtain a 0.28 mm filament size from the static model. For each printing condition, two connection points were evaluated using OCT. The printing results without the proposed method (i.e., AET = 0 and ATEP = 0) are shown in Figure 12B and E. For the circle trajectory, a gap of 0.146 mm exists in area 1 and obvious material accumulation occurs in area 2. For the triangle trajectory, 253material accumulation occurs in area 2. After the nozzle control optimization, the printing results were obtained and are shown in Figure 12C and F, where no material accumulation or gap was observed.
Figure 12.
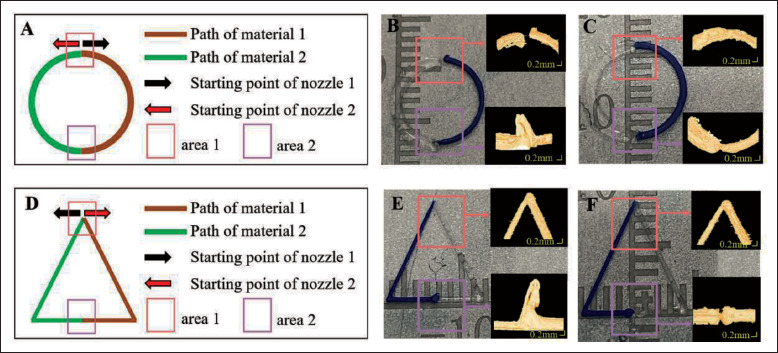
Printing design and experimental results of different trajectories. (A) The printing trajectory and strategy for a circle. (B) Printing results before optimization of nozzle control parameters for the circle. (C) Printing results after optimization of nozzle control parameters for the circle. (D) The printing trajectory and strategy for a triangle. (E) Printing results before optimization of nozzle control parameters for the triangle. (F) Printing results after optimization of nozzle control parameters for the triangle.
In the proposed method, the static model for materials is established before the actual printing task and without prior knowledge of the printing task, and it works as a database for the materials. But the nozzle control modal is task-related, thus it may have off-line or on-line applications. In the off-line application, pre-experiments with first one or few layers of the scaffold are performed, and the optimal nozzle control parameters can be optimized, as discussed in section 2.4. When the optimal parameters were obtained, the actual printing task was performed. Its performance is shown in both the three-layer scaffold experiment and the nine-layer scaffold in section 3.4. On the other hand, the nozzle control parameter optimization can be integrated into the actual printing process, which is the on-line application, and the parameter is updated each time a new layer is finished. In most pre-experiments, including those in section 3.4, it was noted that material accumulation or gap can be eliminated within 1 cycle of nozzle control parameter correction, which shows the high efficiency in correction. In addition, in the nine-layer scaffold printing experiment, the same nozzle control parameter set was adopted for the connection points at different positions, which shows the tolerance performance of the parameter set. Thus, this method has the potential in on-line applications where no considerable changes occur in neighboring layers’ trajectories.
At present, we have realized the printing of scaffolds with the same layer thickness, where the layer thickness of silica gel materials with different properties were accurately registered, as shown in Figures 9–11. In the future work, a wider collection of biological materials (e.g., hydrogel materials and PCL materials), more complicated scaffold structures (e.g., circular structures and tubular structures), and more filament control means (e.g., needle shape) could be further explored to expand the application scenarios and enhance the flexibility of filament size and layer thickness control. In addition, although we have ensured the accuracy of the result through the model with pre-experiments, there is still room for improvement in the modeling process. First, OCT technology has poor imaging effect on the internal structure of the multi-layer transparent material printing scaffolds, and the signal-to-noise ratio of the image can be further enhanced by adding a contrast agent into the transparent material. Second, an intelligent software program can be made to predict the optimal nozzle control parameters of multi-material bioprinting using deep learning or other methods[39,40].
5. Conclusion
In this paper, a multi-material static model and a time-related control model were proposed to improve the accuracy for multi-material scaffold bioprinting and the printing efficiency. Both models were experimentally established via OCT imaging data. The multi-material static model provides feasible printing parameter ranges for different materials to achieve accurate mutual matching of filament size or layer thickness and printing requirements with different materials. The time-related nozzle control model could modify nozzle control parameters efficiently and improve the printing accuracy of different materials at the connection point in the face of different printing methods of multi-nozzles. Experiments were correspondingly conducted to verify the proposed models and the method, and accuracy improvement using the models was observed. In the future, we will explore more complicated structures and establish an intellectual program for parameter determination in the multi-material bioprinters.
Acknowledgments
None.
Funding
The authors thankfully acknowledge the financial support listed as follows: National Natural Science Foundation of China (No. 31927801); Key Research and Development Foundation, Science and Technology Department of Zhejiang Province (No. 2022C01123).
Conflict of interest
The authors declare no conflict of interests.
Author contributions
Conceptualization: Jin Wang, Ling Wang, Mingen Xu
Formal analysis: Jin Wang, Shanshan Yang
Investigation: Jin Wang, Chen Xu
Methodology: Jin Wang, Chen Xu, Shanshan Yang
Supervision: Mingen Xu
Writing – original draft: Jin Wang, Chen Xu
Writing – review & editing: Shanshan Yang, Ling Wang
All authors have given approval to the final version of the manuscript.
Ethics approval and consent to participate
Not applicable.
Consent for publication
Not applicable.
Availability of data
254Data underlying the results presented in this paper are not publicly available at this time but may be obtained from the authors upon reasonable request.
References
- 1.Wang W, Zhang B, Li M, et al. 3D printing of PLA/ n-HA composite scaffolds with customized mechanical properties and biological functions for bone tissue engineering. Compos Part B-Eng. 2021;224:09192. https://doi.org/10.1016/j.compositesb.2021.109192. [Google Scholar]
- 2.Daulbayev C, Mansurov Z, Sultanov F, et al. 2020. A numerical study of fluid flow in the porous structure of biological scaffolds. Eurasian Chem-Technol J 22 3 149 156. https://doi.org/10.18321/ectj974 [Google Scholar]
- 3.He J, Mao M, Li X, et al. Bioprinting of 3D functional tissue constructs. Int J Bioprint. 2021;7(3):395. doi: 10.18063/ijb.v7i3.395. https://doi.org/10.18063/ijb.v7i3.395. [DOI] [PMC free article] [PubMed] [Google Scholar]
- 4.Wei LN, Chee KC, Shen YF. Print me an organ! Why we are not there yet. Progr Polym Sci. 2019;97:101145. https://doi.org/10.1016/j.progpolymsci.2019.101145. [Google Scholar]
- 5.Ashammakhi N, Ahadian S, Xu C, et al. Bioinks and bioprinting technologies to make heterogeneous and biomimetic tissue constructs—ScienceDirect. Mater Today Bio. 2019;1(C):100008. doi: 10.1016/j.mtbio.2019.100008. https://doi.org/10.1016/j.mtbio.2019.100008. [DOI] [PMC free article] [PubMed] [Google Scholar]
- 6.Zhang Y, Wang B, Hu J, et al. 3D composite bioprinting for fabrication of artificial biological tissues. Int J Bioprint. 2021;7(1):299. doi: 10.18063/ijb.v7i1.299. https://doi.org/10.18063/ijb.v7i1.299. [DOI] [PMC free article] [PubMed] [Google Scholar]
- 7.Wan LL, Luis SM, Juan A, et al. 2020. Recent advances in formulating and processing biomaterial inks for vat polymerization-based 3D printing. Adv Healthc Mater 2000156 1 18. https://doi.org/10.1002/adhm.202000156 [DOI] [PMC free article] [PubMed] [Google Scholar]
- 8.Ng WL, Huang X, Shkolnikov V, et al. Controlling droplet impact velocity and droplet volume: Key factors to achieving high cell viability in sub-nanoliter droplet-based bioprinting. Int J Bioprint. 2022;8(1):424. doi: 10.18063/ijb.v8i1.424. https://doi.org/10.18063/ijb.v8i1.424. [DOI] [PMC free article] [PubMed] [Google Scholar]
- 9.Zhuang P, Ng WL, An J, et al. Layer-by-layer ultraviolet assisted extrusion-based (UAE) bioprinting of hydrogel constructs with high aspect ratio for soft tissue engineering applications. PLoS One. 2019;14(6):e0216776. doi: 10.1371/journal.pone.0216776. https://doi.org/10.1371/journal.pone.0216776. [DOI] [PMC free article] [PubMed] [Google Scholar]
- 10.Tao J, Jose GM, Salvador FT, et al. Extrusion bioprinting of soft materials: An emerging technique for biological model fabrication. Appl Phys Rev. 2019;6(1):011310. https://doi.org/10.1063/1.5053909. [Google Scholar]
- 11.Li XD, Liu BX, Ben P, et al. 2020. Inkjet bioprinting of biomaterials. Chem Rev 120 19 10596 10636. https://doi.org/10.1021/acs.chemrev.0c00008 [DOI] [PubMed] [Google Scholar]
- 12.Wei LN, Jia ML, Zhou M, et al. Vat polymerizationbased bioprinting—Process, materials, applications and regulatory challenges. Biofabrication. 2020;12(2):022001. doi: 10.1088/1758-5090/ab6034. https://doi.org/10.1088/1758-5090/ab6034. [DOI] [PubMed] [Google Scholar]
- 13.Zhang B, Huang J, Narayan RJ. Gradient scaffolds for osteochondral tissue engineering and regeneration. J Mater Chem B. 2020;8:8149. doi: 10.1039/d0tb00688b. https://doi.org/10.1039/D0TB00688B. [DOI] [PubMed] [Google Scholar]
- 14.Wang XY, Zhang M, Ma JG, et al. 2020. 3D printing of cellcontainer-like scaffolds for multicell tissue engineering— ScienceDirect. Engineering 6 11 1276 1284. https://doi.org/10.1016/j.eng.2020.08.001 [Google Scholar]
- 15.Sodupe-Ortega E, Sanz-Garcia A, Pernia-Espinoza A, et al. Accurate calibration in multi-material 3D bioprinting for tissue engineering. Materials. 2018;11(8):1402. doi: 10.3390/ma11081402. https://doi.org/10.3390/ma11081402. [DOI] [PMC free article] [PubMed] [Google Scholar]
- 16.Naghavi SA, Wang H, Varma SN, et al. On the morphological deviation in additive manufacturing of porous Ti6Al4V scaffold: A design consideration. Materials. 2022;15(14):4729. doi: 10.3390/ma15144729. https://doi.org/10.3390/ma15144729. [DOI] [PMC free article] [PubMed] [Google Scholar]
- 17.Suwanprateeb J, Thammarakcharoen F, Wasoontararat K, et al. 2012. Influence of printing parameters on the transformation efficiency of 3D‐printed plaster of paris to hydroxyapatite and its properties. Rapid Prototyp J 18 6 490 499. https://doi.org/10.1108/13552541211272036 [Google Scholar]
- 18.Zhang B, Cristescu R, Chrisey DB, et al. Solventbased extrusion 3D printing for the fabrication of tissue engineering scaffolds. Int J Bioprint. 2020;6(1):19. doi: 10.18063/ijb.v6i1.211. https://doi.org/10.18063/ijb.v6i1.211. [DOI] [PMC free article] [PubMed] [Google Scholar]
- 19.Tao Y, Li P, Pan L. 2019. Improving tensile properties of polylactic acid parts by adjusting printing parameters of open source 3D printers. Mater Sci 26 1 83 87. https://doi.org/10.5755/j01.ms.26.1.20952 [Google Scholar]
- 20.Mao M, Liang H, He J, et al. Coaxial electrohydrodynamic bioprinting of pre-vascularized cell-laden constructs for tissue engineering. Int J Bioprint. 2021;7(3):362. doi: 10.18063/ijb.v7i3.362. https://doi.org/10.18063/ijb.v7i3.362. [DOI] [PMC free article] [PubMed] [Google Scholar]
- 21.255Busra TD, Fatma BE, Tugba A, et al. 3D bio-printing of levan/polycaprolactone/gelatin blends for bone tissue engineering: Characterization of the cellular behavior. Polym Paint Colour. 2019;119:426–437. https://doi.org/10.1016/j.eurpolymj.2019.08.015. [Google Scholar]
- 22.Chen Y, Xiong X, Liu X, et al. Bioprinting of shearthinning hybrid bioinks with excellent bioactivity derived from gellan/alginate and thixotropic magnesium phosphate- based gels. J Mater Chem B. 2020;8:5500–5514. doi: 10.1039/d0tb00060d. https://doi.org/10.1039/D0TB00060D. [DOI] [PubMed] [Google Scholar]
- 23.Shao Y, Han R, Quan X, et al. Study on ink flow of silicone rubber for direct ink writing. J Appl Polym Sci. 2021;138(33):50819. https://doi.org/10.1002/app.50819. [Google Scholar]
- 24.Peki A, Ekici B. Experimental and statistical analysis of robotic 3D printing process parameters for continuous fiber reinforced composites. Int J Compos Mater. 2021;55(19):2645–2655. https://doi.org/10.1177/0021998321996425. [Google Scholar]
- 25.Zhou L, Gao Q, Fu J. Multi-material 3D printing of highly stretchable silicone elastomer. ACS Appl Mater Interfaces. 2019;11(26):23573–23583. doi: 10.1021/acsami.9b04873. https://doi.org/10.1021/acsami.9b04873. [DOI] [PubMed] [Google Scholar]
- 26.Nicholas B, Chen XB. Review of extrusion-based multi-material bioprinting processes—ScienceDirect. Bioprinting. 2022;25:e00189. https://doi.org/10.1016/j.bprint.2021.e00189. [Google Scholar]
- 27.Hoelzle DJ, Alleyne AG, Johnson A. 2008. Iterative learning control for robotic deposition using machine vision. American Control Conference 2008 https://doi.org/10.1109/ACC.2008.4587211 [Google Scholar]
- 28.Armstrong AA, Norato J, Andrew GA, et al. Direct process feedback in extrusion-based 3D bioprinting. Biofabrication. 2020;12(1):015017. doi: 10.1088/1758-5090/ab4d97. https://doi.org/10.1088/1758-5090/ab4d97. [DOI] [PubMed] [Google Scholar]
- 29.Armstrong AA, Alleyne AG, Johnson A. 1D and 2D error assessment and correction for extrusion-based bioprinting using process sensing and control strategies. Biofabrication. 2020;12(4):045023. doi: 10.1088/1758-5090/aba8ee. https://doi.org/10.1088/1758-5090/aba8ee. [DOI] [PubMed] [Google Scholar]
- 30.Almela T, Brook IM, Khoshroo K, et al. Simulation of cortico-cancellous bone structure by 3D printing of bilayer calcium phosphate-based scaffolds. Bioprinting. 2017;6:1–7. https://doi.org/10.1016/j.bprint.2017.04.001. [Google Scholar]
- 31.Gerdes S, Mostafavi A, Ramesh S, et al. Processstructure-quality relationships of 3D printed PCL- hydroxyapatite scaffolds. Tissue Eng Part A. 2020;26(5-6):279–291. doi: 10.1089/ten.tea.2019.0237. https://doi.org/10.1089/ten.TEA.2019.0237. [DOI] [PMC free article] [PubMed] [Google Scholar]
- 32.Joshua WT, Daniel JS, Brian C, et al. In situ volumetric imaging and analysis of FRESH 3D bioprinted constructs using optical coherence tomography. Biofabrication. 2022;15(1):104102. doi: 10.1088/1758-5090/ac975e. https://doi.org/10.1088/1758-5090/ac975e. [DOI] [PubMed] [Google Scholar]
- 33.Yang S, Wang L, Chen Q, et al. In situ process monitoring and automated multi-parameter evaluation using optical coherence tomography during extrusionbased bioprinting. Addit Manuf. 2021;47:102251. https://doi.org/10.1016/j.addma.2021.102251. [Google Scholar]
- 34.Yang S, Chen Q, Wang L, et al. In situ defect detection and feedback control with three-dimensional extrusionbased bioprinter-associated optical coherence tomography. Int J Bioprint. 2022;9(1):642. doi: 10.18063/ijb.v9i1.624. https://doi.org/10.18063/ijb.v9i1.624. [DOI] [PMC free article] [PubMed] [Google Scholar]
- 35.Geng P, Zhao J, Wu W, et al. Effects of extrusion speed and printing speed on the 3D printing stability of extruded PEEK filament. J Manuf Process. 2019;37:266–273. https://doi.org/10.1016/j.jmapro.2018.11.023. [Google Scholar]
- 36.Jeffrey P, Tian X, Albert S. Measurement and modeling of forces in extrusion-based additive manufacturing of flexible silicone elastomer with thin wall structures. J Manuf Sci Eng. 2018;140(9):09100. https://doi.org/10.1115/1.4040350. [Google Scholar]
- 37.Liu C, Liu J, Yang C, et al. Computer vision-aided 2D error assessment and correction for helix bioprinting. Int J Bioprint, 2022;8(2):547. doi: 10.18063/ijb.v8i2.547. https://doi.org/10.18063/ijb.v8i2.547. [DOI] [PMC free article] [PubMed] [Google Scholar]
- 38.Braeden W, Barry JD. Parameter optimization for 3D bioprinting of hydrogels. Bioprinting, 2017;8:8–12. https://doi.org/10.1016/j.bprint.2017.09.001. [Google Scholar]
- 39.Wei LN, Alvin C, Yew SO, et al. Deep learning for fabrication and maturation of 3D bioprinted tissues and organs. Virtual Phys Prototyp. 2022;15(11):1–19. https://doi.org/10.1080/17452759.2020.1771741. [Google Scholar]
- 40.Bonatti AF, Vozzi G, Chua CK, et al. A deep learning quality control loop of the extrusion based bioprinting process. Int J Bioprint. 2022;8(4):620. doi: 10.18063/ijb.v8i4.620. https://doi.org/10.18063/ijb.v8i4.620. [DOI] [PMC free article] [PubMed] [Google Scholar]
Associated Data
This section collects any data citations, data availability statements, or supplementary materials included in this article.
Data Availability Statement
254Data underlying the results presented in this paper are not publicly available at this time but may be obtained from the authors upon reasonable request.


