

Abstract
Several molecules can extend healthspan and lifespan across organisms. However, most are upstream signaling hubs or transcription factors orchestrating complex anti-aging programs. Therefore, these molecules point to but do not reveal the fundamental mechanisms driving longevity. Instead, downstream effectors that are necessary and sufficient to promote longevity across conditions or organisms may reveal the fundamental anti-aging drivers. Towards this goal, we searched for effectors acting downstream of the transcription factor EB (TFEB), known as HLH-30 in C. elegans, because TFEB/HLH-30 is necessary across anti-aging interventions and its overexpression is sufficient to extend C. elegans lifespan and reduce biomarkers of aging in mammals including humans. As a result, we present an Alcohol-dehydrogenase Mediated anti-Aging Response (AMAR) that is essential for C. elegans longevity driven by HLH-30 overexpression, caloric restriction, mTOR inhibition, and insulin-signaling deficiency. The sole overexpression of ADH-1 is sufficient to activate AMAR, which extends healthspan and lifespan by reducing the levels of glycerol – an age-associated and aging-promoting alcohol. Adh1 overexpression is also sufficient to promote longevity in yeast, and adh-1 orthologs are induced in calorically restricted mice and humans, hinting at ADH-1 acting as an anti-aging effector across phyla.
Introduction
Advances in the field of aging include the discovery of several genetic and biochemical pathways that shorten or extend lifespan. However, the molecules found to be necessary and sufficient to extend health and lifespan have mostly been upstream signaling hubs (e.g. mTOR) or intermediate transcription factors (e.g. FOXO/DAF-16). Therefore, it remains unclear whether there are downstream effectors that are necessary and sufficient for longevity. This is relevant, as downstream molecules with robust anti-aging effects may reveal the fundamental mechanisms that determine the rate of aging and may be safer and more effective geroprotective targets.
An attractive approach to the discovery of downstream effectors of longevity is the study of the transcription factors (TFs) responsible for activating anti-aging programs in multiple pro-longevity conditions. A prominent anti-aging TF in this class is the Transcription Factor EB (TFEB). Activation of TFEB, and its C. elegans ortholog HLH-30, is necessary to extend healthspan and lifespan across anti-aging interventions1,3. Furthermore, activating HLH-30/TFEB is sufficient to promote longevity and reduce biomarkers of aging across organisms1,4–8. As a master regulator of autophagy and lysosomal biogenesis9, the current model states that HLH-30/TFEB extends health and lifespan through the activation of autophagy1, a cell rejuvenating process that is also thought to be required across anti-aging interventions and organisms10–14.
While investigating the potential role of autophagy in the hlh-30 dependent longevity of the mxl-3 C. elegans mutant, we found that the current model has exceptions. Since mxl-3-driven longevity requires the activity of hlh-30, HLH-30/TFEB is the master regulator of autophagy, and autophagy is thought to be universally required for longevity, we hypothesized that hlh-30 was promoting longevity in the mxl-3 mutants through the activation of autophagy. However, contrary to expectation, we found that autophagy is not activated in the mxl-3 mutant, and that neither autophagy nor lysosomal activity2 are required for the longevity phenotype observed in these mutant animals. Therefore, mxl-3 longevity is hlh-30-dependent but autophagy-independent. Instead, we found the gene encoding the Alcohol DeHydrogenase ADH-1 induced in mxl-3 and other hlh-30-dependent anti-aging interventions, including caloric restriction (eat-2 mutants), insulin-signaling deficiency (daf-2 deficient) and mTOR-inhibition. More importantly, adh-1 is necessary for the longevity phenotype of all these anti-aging interventions, and ADH-1 overexpression is sufficient to extend C. elegans lifespan. We propose that ADH-1 extends lifespan through metabolizing the otherwise toxic alcohol glycerol, which accumulates with age. Finally, we present evidence suggesting that ADH-1’s anti-aging capacity may be conserved across species. Altogether, we establish ADH-1 as an effector of longevity acting downstream of multiple anti-aging interventions and propose it as a druggable enzyme whose activation may suffice to promote healthspan and lifespan in organisms ranging from yeast to humans.
Results
Autophagy and lysosomal activity can be dispensable for hlh-30-dependent longevity
C. elegans mutants for the helix-loop-helix transcription factor mxl-3 are long-lived. This longevity phenotype is suppressed by inactivation of the gene encoding the transcription factor HLH-30 (known as TFEB in mammals) (Figure 1A; Data S1A). Given that HLH-30/TFEB is known as the master regulator of autophagy and lysosomal biogenesis, we hypothesized that mxl-3’s longevity was also dependent on autophagic and lysosomal activity. However, the levels of autophagy in the long-lived mxl-3 animals are normal at the transcriptional (Figure S1A), biochemical (Figure S1B) and cytological levels (Figure S1C). Most importantly, (1) post-developmental inactivation by RNAi of two autophagy genes that are lethal when mutated, lgg-1 (a.k.a. Atg-8 or LC3) and bec-1 (Figure S1D; Data S1B), (ii) loss-of-function mutation of the non-lethal autophagy gene atg-18 (Figure 1B and Data S1C), and (iii) chemical inhibition of all lysosomal enzymes with chloroquine do not suppress or rescue mxl-3’s longevity, respectively (Figure S1E; Data S1C). In fact, post-developmental RNAi against atg-18, lgg-1 and bec-1 and post-developmental administration of chloroquine further increased mxl-3 lifespan (Figure S1D, Figure S1E and Data S1B and S1C), demonstrating that the treatments worked but, more importantly, that autophagic and lysosomal activity are not always necessary for longevity.
Figure 1. adh-1 activation drives HLH-30-mediated longevity.
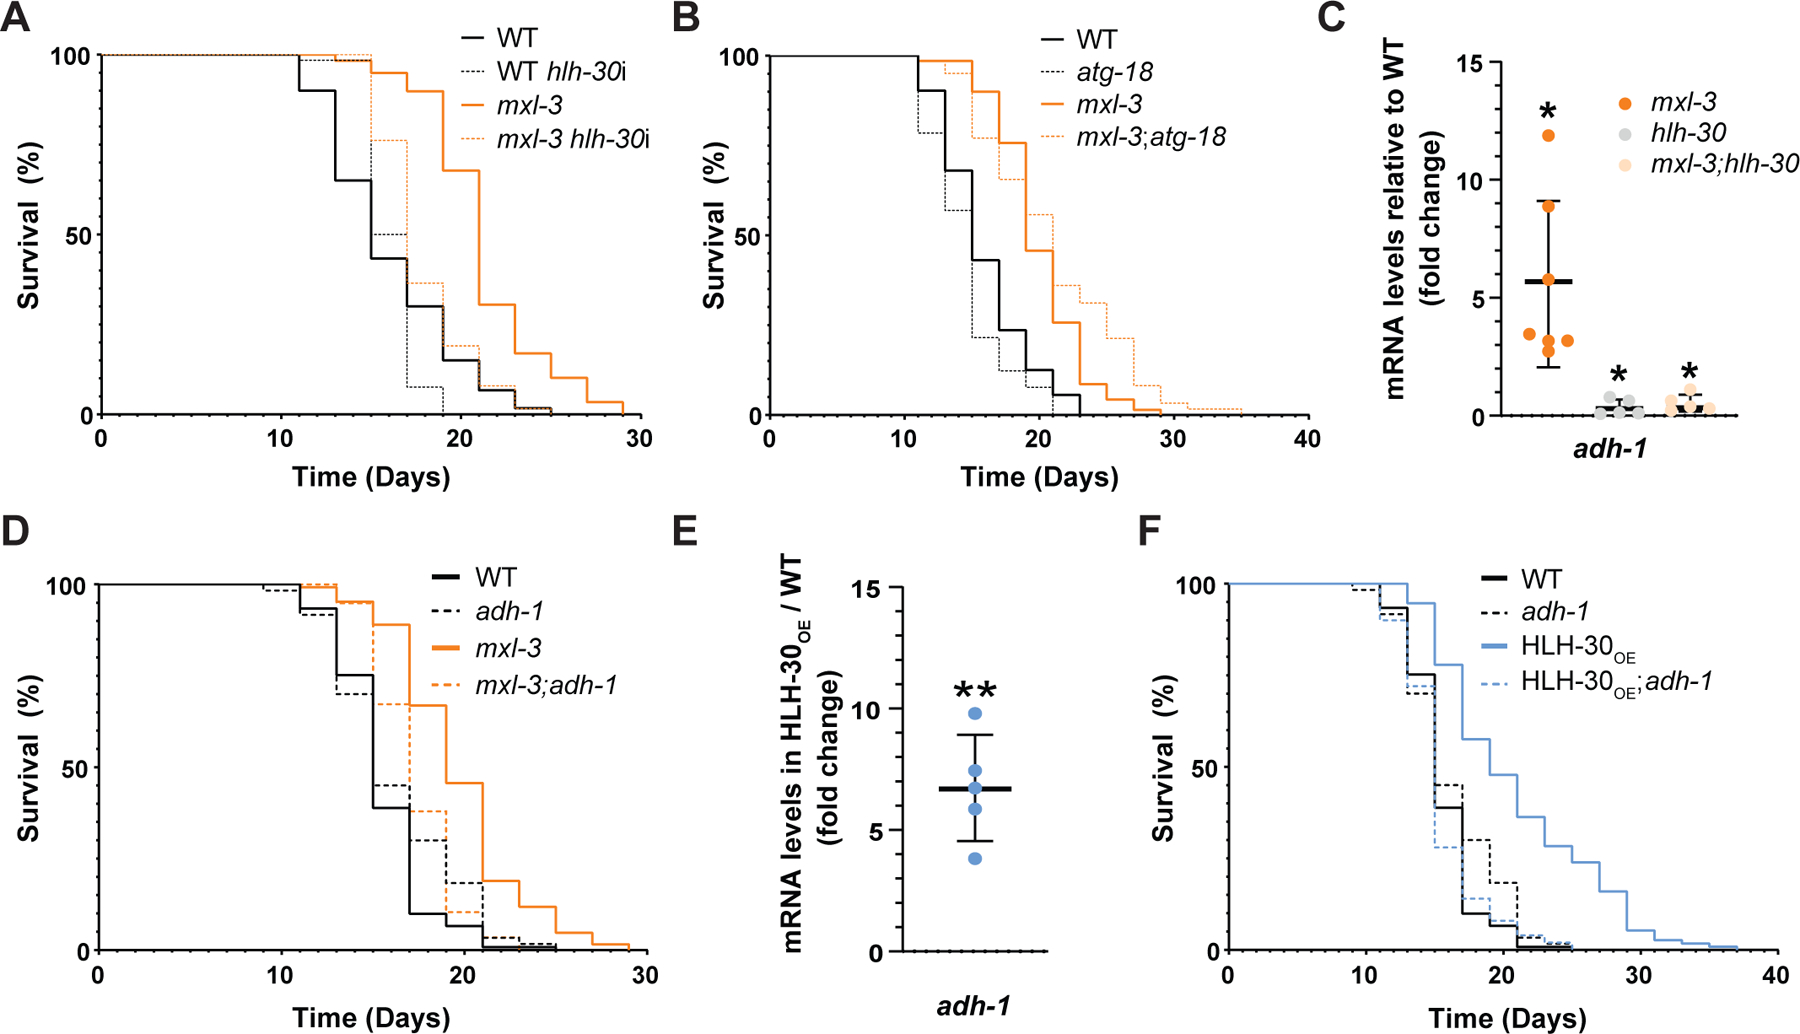
(A) The master regulator of autophagy and lysosomal biogenesis, TF hlh-30/Tfeb, is required for the longevity phenotype of the mxl-3 C. elegans mutant (representative of 3 biological replicates; see Data S1A). (B) Loss-of-function mutation of the non-lethal autophagy gene atg-18 does not suppress mxl-3 longevity (representative of 3 biological replicates; see Data S1C). In addition, autophagy levels are not elevated at the transcriptional (Figure S1A), biochemical (Figure S1B), or cellular (Figure S1C) levels in the mxl-3 mutant, and post-developmental RNAi against the lethal autophagy genes bec-1 and lgg-1 or full inhibition of lysosomal activity and autophagy with chloroquine do not suppress mxl-3 longevity (Figure S1D-E). (C) As measured by RT-qPCR, adh-1 transcript levels are elevated in the mxl-3 mutant in an hlh-30 dependent manner (n=5–7 biological replicates). See Table S1 for RT-qPCR primers. (D) The longevity of the mxl-3 mutant is suppressed by loss-of-function mutation of adh-1 (representative of three biological replicates; see Data S1D). (E) adh-1 transcript levels are elevated in the HLH-30OE animals (n=5 biological replicates). (F) Loss-of-function mutation of adh-1 fully suppresses the extended lifespan of the HLH-30OE animals (representative of 3 biological replicates; see Data S1D and Figure S2). (A-F) Error bars denote SEM. ns= not significant, *p<0.05, **p<0.01, ***p<0.001, ****p<0.0001; hlh-30i = hlh-30 RNAi. All experiments were performed using E. coli XU363 carrying L4440 (empty vector) or L4440 + the gene of interest.
adh-1 mediates HLH-30-driven longevity
To identify alternative effectors driving HLH-30-mediated longevity, we mined published hlh-30 mutant transcriptomics15, and HLH-30 overexpression (HLH-30OE) transcriptomics16, proteomics16, and ChIP-Seq studies17. The top gene that met the following criteria: (i) mRNA and protein dysregulated in the hlh-30 mutant and HLH-30OE strains, respectively, and (ii) a hit in the HLH-30 ChIP-seq study, was K12G11.3, which encodes for the alcohol dehydrogenase ADH-1. We therefore used the mxl-3 mutant model to investigate adh-1’s potential role in hlh-30-driven longevity. In line with ADH-1 playing a role in hlh-30-mediated longevity, adh-1 was induced in the mxl-3 mutant animals in an hlh-30-dependent manner (Figure 1C). More importantly, loss-of-function mutation of adh-1 suppressed mxl-3’s longevity phenotype (Figure 1D & Data S1D). Therefore, unlike autophagy, the activity of the alcohol dehydrogenase ADH-1 is necessary for hlh-30-dependent mxl-3 longevity.
We then investigated whether adh-1 played a role in HLH-30-mediated longevity beyond the mxl-3 model. In C. elegans, the sole overexpression of HLH-30 is sufficient to extend lifespan1. We confirmed this result, while also finding the pro-longevity effect of overexpressing HLH-30 to be more pronounced in the C. elegans line OP43318 than in the previously described MAH235 and MAH240 lines1 (Data S1D). This, in addition to OP433 being the C. elegans line used in the referred ChIP-Seq and proteomics analyses, persuaded us to use OP433 as the model for HLH-30 hyperactivation throughout this study (hereinafter referred to as HLH-30OE; please refer to the Methods section “C. elegans lifespan assays” for experimental conditions). In line with ADH-1 being an anti-aging effector downstream of HLH-30, we found adh-1 induced in HLH-30OE animals (Figure 1E). More importantly, loss-of-function mutation of adh-1 fully suppressed HLH-30OE longevity (Figure 1F, Figure S2, Data S1D & Data S1E). This result indicates that adh-1 plays a critical role in HLH-30-driven longevity in contexts beyond the loss of mxl-3.
ADH-1 is necessary and sufficient to promote longevity
Given that hlh-30 is necessary for longevity across anti-aging interventions1, we then tested whether adh-1 similarly contributes to longevity across interventions, namely: (i) caloric restriction through the use of the eating-deficient mutant eat-2, (ii) mTOR inhibition through RNAi knockdown of its encoding gene let-363, and (iii) reduced insulin signaling through RNAi knockdown of the insulin receptor-encoding gene daf-2. Mining published microarray data suggested that adh-1 is induced in the eat-219 and daf-219,20 models. We confirmed these observations in dedicated transcriptional analyses and, critically, we found that hlh-30 is necessary for the induction of adh-1 in all three longevity models (Figure 2A). More importantly, adh-1 inactivation partially suppressed the extended lifespan of C. elegans subject to caloric restriction (Figure 2B & Data S1F) and mTOR deficiency (Figure 2C & Data S1G) and, most strikingly, fully suppressed the extremely long lifespan of the daf-2-deficient animals (Figure 2D & Data S1H), demonstrating that adh-1 is a potent downstream effector of longevity across anti-aging interventions.
Figure 2. adh-1 is necessary and sufficient to extend lifespan and healthspan.
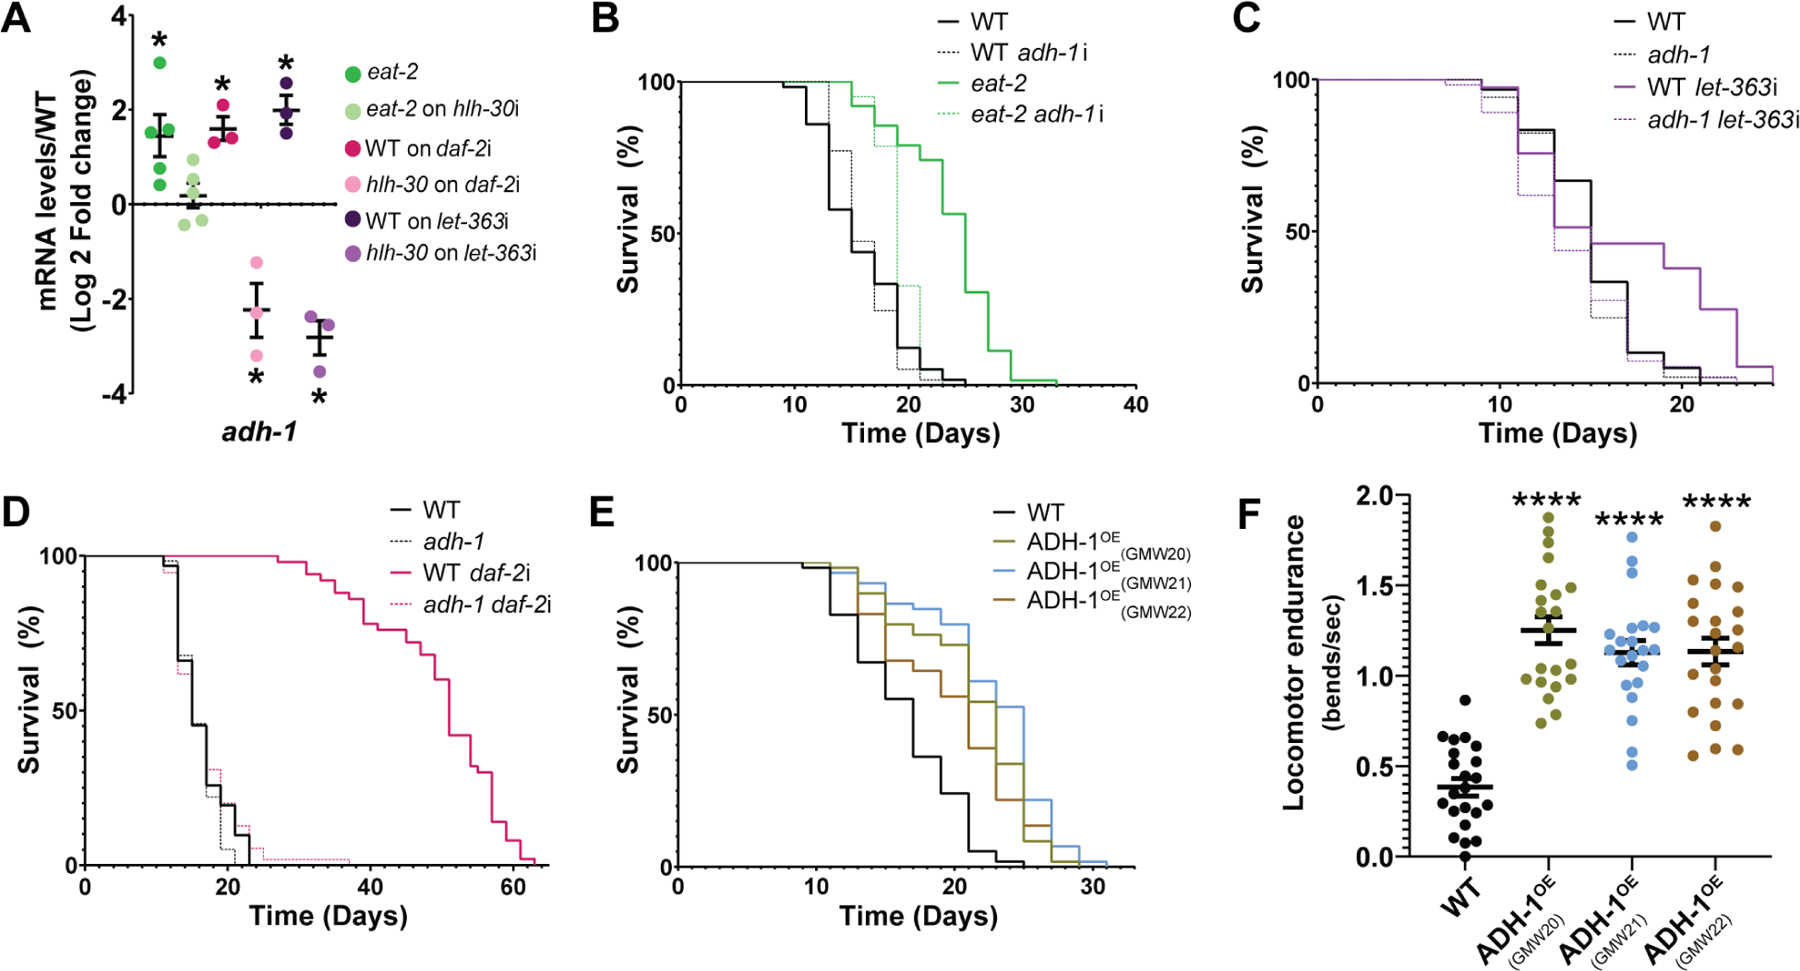
(A) adh-1 is induced in an hlh-30-dependent manner in the longevity models caloric restriction (eat-2), insulin insensitivity (daf-2), and mTOR inhibition (let-363 RNAi) (n=3 to 5 biological replicates). See Table S1 for RT-qPCR primers. (B-D) In C. elegans, adh-1 is required for longevity driven by (B) caloric restriction, (C) mTOR inhibition, and (D) deficient insulin-signaling (representative of three biological replicates; see Data S1F-H). (E) Overexpressing ADH-1 (ADH-1OE) is sufficient to promote longevity in C. elegans. Survival curves for three independent overexpression lines (GWM20–22) are presented (representative of three biological replicates; see Data S1I). (F) ADH-1 promotes locomotor endurance as measured by thrashing in liquid medium in 12-days old ADH-1OE and wild-type C. elegans (representative of three biological replicates; repeats in Data S1N). Also see Figure S3 for further characterization of C. elegans overexpressing ADH-1. (A-F) Error bars denote SEM. ns= not significant, *p<0.05, **p<0.01, ***p<0.001, ****p<0.0001. (A-D) daf-2i = daf-2 RNAi, hlh-30i = hlh-30 RNAi, adh-1i = adh-1 RNAi, let-363i = let-363 RNAi. All experiments were performed using E. coli XU363 carrying L4440 (empty vector) or L4440 + the gene of interest.
Having found that adh-1 is necessary for lifespan extension across longevity models, we set out to test whether hyperactivating adh-1 was sufficient to promote longevity. For this, we generated three independent ADH-1 overexpressing C. elegans strains (GMW20, GMW21, GMW22 referred to as ADH-1OE). After backcrossing and confirming that all three strains had increased adh-1 transcript levels (Figure S3A), we found all three to be long-lived relative to the wild-type strain (Figure 2E, Figure S3C, Data S1I & Data S1J). We also found that aged ADH-1OE animals show improved locomotor endurance compared to their age-matched WT counterparts (Figure 2F), suggesting that hyperactivation of ADH-1 may also extend healthspan. Therefore, ADH-1 is not only necessary for longevity across anti-aging interventions, but it is also sufficient to extend lifespan and likely healthspan.
Next, we characterized the ADH-1OE animals. We found no difference in the size (Figure S3D) or in the feeding rate (pharyngeal pumping) (Figure S3E) of ADH-1OE animals compared to WT animals, suggesting that overexpressing ADH-1 does not cause caloric restriction in C. elegans. The defecation rate of ADH-1OE animals was also normal (Figure S3F), suggesting normal passage of food through the digestive system. We also sought to determine whether there was a trade-off between extended lifespan and fertility in ADH-1OE animals, as this tradeoff occurs in several longevity models21,22. Indeed, we found that the ADH-1OE animals exhibit reduced brood size compared to their WT counterparts (Figure S3G and Figure S3H).
ADH-1 promotes longevity by reducing glycerol toxicity
Alcohol dehydrogenases are among the most conserved and studied enzymes due to their biotechnological (e.g. wine production) and biomedical relevance (e.g. alcohol toxicity). To gain insight into the mechanism through which ADH-1 extends C. elegans lifespan, we tested the primary sequence prediction that ADH-1 can metabolize alcohols using a specific in vivo alcohol dehydrogenase (AD) assay validated in organisms ranging from yeast to humans23–25. In this assay, ADs convert allyl-alcohol (AA) into the lethal aldehyde acrolein; hence, higher AD activity leads to higher lethality26. ADH-1OE C. elegans showed hypersensitivity to allyl-alcohol (Figure 3A), confirming these animals have increased capacity to metabolize alcohols.
Figure 3. adh-1 extends lifespan by preventing the accumulation of the aging-promoting metabolite glycerol.
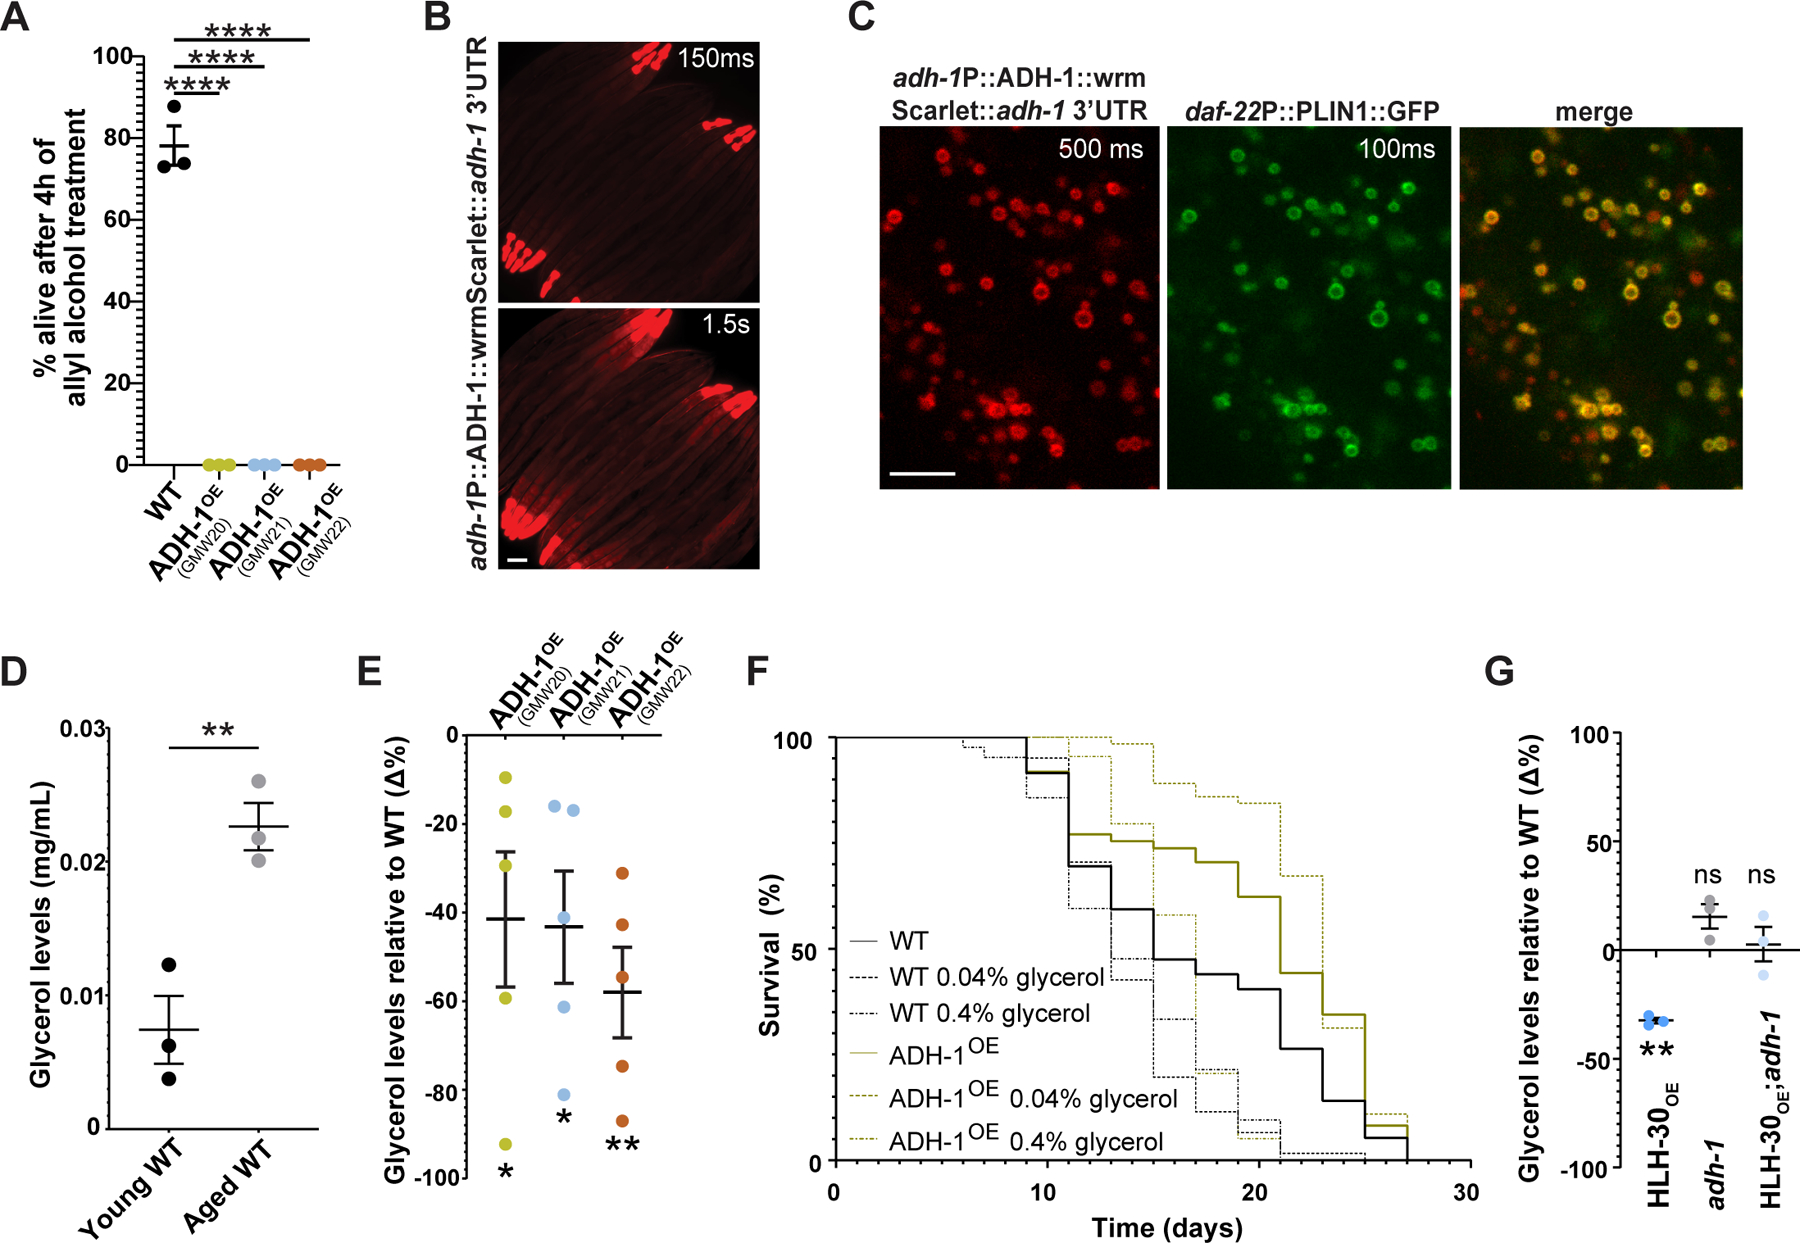
(A) ADH-1OE strains are hypersensitive to allyl alcohol, indicating increased in vivo alcohol dehydrogenase activity (n=3 biological replicates). (B) Whole-body expression of the ADH-1 protein as observed in N2 C. elegans carrying wrmScarlet knocked-in in-frame in the adh-1 locus via CRISPR/Cas9 (scale bar = 100µm). Two exposure times of the same image are depicted. At the 1.5s exposure time, muscle and intestinal signals are visible. See also Figure S4A-B for additional information on the anatomical localization of ADH-1. (C) ADH-1 co-localizes with intestinally expressed D. melanogaster perilipin, a lipid droplet marker expressed from the integrated transgene Pdaf-22::PLIN1::GFP31 (scale bar = 5µm). Exposure times are depicted. See Figure S4C for autofluorescence control. (D) Wild type worms accumulate glycerol as they age. Young corresponds to day-1 adult, and aged corresponds to day-8 adult, the latest day we can harvest live worms free of contaminating dead worms (n=3 biological replicates). (E) Three independent ADH-1OE lines show decreased glycerol levels relative to wild type (n=5 biological replicates). (F) ADH-1OE animals are resistant to the pro-aging effect of glycerol (representative of three biological replicates; see Data S1K & Data S1L). (G) Loss-of-function mutation of adh-1 suppresses the otherwise low glycerol levels observed in HLH-30OE animals. Statistical significance relative to wild-type controls (n=3 biological replicates). (A-G) Error bars denote SEM. ns= not significant, *p<0.05, **p<0.01, ***p<0.001, ****p<0.0001. All experiments (except the glycerol supplementation experiment) were performed using E. coli XU363 carrying L4440 (empty vector). The glycerol supplementation experiment was performed using E. coli OP50 bacteria.
Using scRNA-Seq27 (Figure S4A), we found adh-1 expressed in the distal tip cells of the gonad, in the marginal and muscle cells of the pharynx (pm3_pm4_pm5 & pm6_pm7), in all body wall muscle cells, and in the anterior intestinal cells. We then used CRISPR/Cas9 to knock-in wrmScarlet28 in frame with the coding sequence of adh-1 to generate a strain carrying adh-1P::ADH-1::wrmScarlet::adh-1 3’UTR in the adh-1 locus. In congruence with the scRNA-Seq expression pattern, we found ADH-1::wrmScarlet expressed in the distal tip, pharynx, body-wall muscle, and the intestinal cells of adult C. elegans (Figure 3B, 3C and S4B). At the subcellular level, we noticed that ADH-1 was expressed in droplet-like structures in the intestine, which was intriguing because homologous alcohol dehydrogenases are mainly found in the cytoplasm or in the mitochondria29,30. Co-expression of adh-1P::ADH-1::wrmScarlet::adh-1 3’UTR with the intestinal lipid droplet (LD) reporter daf-22P::PLIN1::GFP31 showed that ADH-1 colocalizes with LDs (Figure 3C).
Given that (i) ADH-1 is an alcohol dehydrogenase expressed in close proximity to LDs, (ii) the major molecular class present in LDs is triglycerides, which are composed of fatty acids and the alcohol glycerol, and (iii) glycerol had previously been shown to reduce lifespan32, we hypothesized that ADH-1 extends C. elegans lifespan by reducing the levels of the aging-promoting alcohol glycerol. In support of this hypothesis, we found that wild-type C. elegans accumulate glycerol as they age (Figure 3D), and that ADH-1OE animals show reduced glycerol levels relative to wild-type worms (Figure 3E) and are resistant to the pro-aging effect of glycerol (Figure 3F & Data S1K & S1L). We also performed a food choice assay to determine whether ADH-1OE animals show a differential attraction to glycerol. Wild-type C. elegans showed no preference for glycerol at the doses used in the lifespan assays (0.04% and 0.4%), and we observed no differences between the ADH-1OE and WT genotypes (Figure S3I & S3J); therefore, ADH-1OE animals are not living longer because they are avoiding the glycerol or the glycerol-embedded food. Altogether, the data support a model in which wild-type C. elegans accumulate glycerol as they age which results in reduced lifespan. However, when adh-1 is induced, as in the HLH-30-dependent longevity models, glycerol levels are lower, and lifespan is extended (schematic model in Figure 4F). We name this lifespan-extending mechanism Alcohol dehydrogenase Mediated Anti-aging Response or AMAR, which in Sanskrit means immortal. A prediction of the AMAR model is that HLH-30OE animals would have reduced glycerol levels relative to WT worms, and that this reduction would depend on the activity of ADH-1. Indeed, we find that HLH-30OE animals have reduced glycerol levels compared to WT worms, and that this reduction is suppressed when adh-1 is mutated (Figure 3G).
Figure 4. adh-1 mediated lifespan requires aldehyde dehydrogenase activity.

(A-E) Treatment with the aldehyde dehydrogenase inhibitor cyanamide rescues the extended lifespan driven by (A) ADH-1OE (GWM20–22 are three independent ADH-1OE lines), (B) mxl-3 mutation, (C) Caloric restriction (eat-2 mutation), (D) reduced insulin sensitivity (daf-2 RNAi), and (E) HLH-30OE. See also Data S1F, Data S1H, Data S1I, and Data S1M. (F) Working model of the Alcohol and aldehyde dehydrogenase-Mediated Anti-aging Response (AMAR= immortal in Sanskrit). # Indicates that it remains to be defined how the three inhibitors of HLH-30 tested here (food, the insulin receptor DAF-2, and mTOR) interact among them (or not) to regulate HLH-30 activity. (A-F) Error bars denote SEM. ns = not significant, *p<0.05, **p<0.01, ***p<0.001, ****p<0.0001. All experiments were performed using E. coli XU363 carrying L4440 (empty vector) or L4440 + the gene of interest.
ADH-1 mediated longevity requires ALH activity
Another prediction of the AMAR model is that increased glycerol metabolism by ADH-1 will lead to increased levels of another toxic and aging-promoting metabolite, glyceraldehyde33. We therefore hypothesized that adh-1-driven longevity would require aldehyde dehydrogenase (ALH) activity to convert glyceraldehyde into its non-toxic salt, glycerate. C. elegans has over 12 aldehyde dehydrogenase encoding genes. Therefore, to determine whether ALH activity is required for ADH-1 mediated longevity, we used the ALH-specific inhibitor cyanamide34,35. Treating ADH-1OE worms with cyanamide fully rescued their longevity phenotypes (Figure 4A, Figure S3C & Data S1I and S1J). Furthermore, cyanamide suppressed the extended lifespan of the hlh-30-dependent longevity models mxl-3 (Figure 4B & Data S1M), eat-2 (Figure 4C & Data S1F), daf-2 (Figure 4D & Data S1H), and, as predicted by the model, HLH-30OE animals (Figure 4E, Figure S2 & Data S1E and S1M). Therefore, concerted alcohol- and aldehyde-dehydrogenase function is required for lifespan extension across anti-aging interventions.
ADH-1 is a conserved anti-aging effector
Having found that adh-1 is necessary and sufficient for longevity in C. elegans, we mined the literature in search for evidence of conservation. We found studies in yeast demonstrating that alcohol dehydrogenase (AD) activity decreases with age36. On the other hand, here we show that Adh1 protein levels increase in yeast subject to caloric restriction (Figure 5A) and, more importantly, using an estradiol-based system to increase Adh1 levels (Figure S5A), we show that Adh1 promotes a dose-dependent increase in yeast chronological lifespan (Figure 5B). Adh1’s necessity and sufficiency to extend lifespan in C. elegans, and sufficiency to extend yeast lifespan, suggest that this enzyme’s anti-aging role might be conserved across species.
Figure 5. Adh1 is induced upon caloric restriction and is sufficient to extend chronological lifespan in yeast.

(A) Adh1 protein levels are increased in calorically restricted (CR) compared to non-restricted yeast as assessed by Western blot. CR duration indicates time since entering the diauxic shift (n=3 biological replicates). (B) Adh1 overexpression extends yeast chronological lifespan under non-restricted conditions (representative of n=3 biological replicates). Two different doses of estradiol were added to cultures to induce Adh1 expression. See also Figure S5. (A-B) Error bars denote SEM. *p<0.05, **p<0.01, ***p<0.001, ****p<0.0001.
To test this notion, we mined the literature for transcriptomics analyses of mammals subject to two life-extending treatments: fasting or caloric restriction. Data S1S lists all the studies we found in which Adh1, or other close homologs of C. elegans’ adh-1 such as Adh4, Adh5, and Sord, were induced (see Data S1S). Briefly, we found 18 transcriptomic datasets where the mouse orthologs of C. elegans adh-1 were induced in calorically restricted humans. Similarly, we found 6 transcriptomic datasets where the human orthologs of C. elegans adh-1 are induced in calorically restricted humans. Altogether, the data demonstrate that ADH-1 is an anti-aging effector common to multiple anti-aging interventions and suggest that it may promote longevity across species.
Discussion
The transcription factor HLH-30, known as Mitf in flies and TFEB in mammals, has been the focus of intense study. At the molecular level, HLH-30/TFEB is known as the master regulator of lysosomal biogenesis and autophagy because in vitro in cellular models37,38 and in vivo in animal models, HLH-30/TFEB is necessary and sufficient for the expansion of the lysosomal compartment and the activation of autophagy3,9,39,40. At the organismal level, HLH-30/TFEB promotes survival to acute stress41–43 and reduces the incidence and severity of the symptoms of aging across model systems6–8,44, and, in C. elegans, hlh-30 is necessary for longevity1,3. Autophagy, a downstream output of HLH-30/TFEB activation is also thought to be indispensable for extended lifespan12,13. Therefore, it was reasonable to hypothesize that the broad requirement of HLH-30/TFEB to promote survival was due to its role in the activation of the cellular rejuvenating process of autophagy. However, work from the Antebi lab showed that the months-long survival of the germline in C. elegans undergoing starvation, a survival program known as adult reproductive diapause (ARD), depends on the activity of HLH-30 but not of autophagy45. This indicates that autophagy is not always necessary for HLH-30-driven survival to stress. Furthermore, enhanced autophagy may not be sufficient to promote long-term survival. For instance, C. elegans carrying a hypomorphic mutation in the gene encoding the insulin receptor daf-2 are long lived, and loss-of-function mutation of the transcription factor daf-16 (mammalian Foxo) fully suppresses this longevity phenotype. However, daf-16 does not suppress the high levels of autophagy observed in the daf-2 mutant worms11. Therefore, daf-2;daf-16 double mutant worms have high-levels of autophagy but are not long-lived. Together, the ARD and daf-2;daf-16 studies suggest that autophagy is neither universally required nor sufficient to promote long-term survival.
By contrast, HLH-30/TFEB seems necessary across anti-aging interventions and sufficient to reduce the burden of aging across species. Therefore, common downstream effectors of longevity could be discovered by investigating hlh-30’s mechanism of lifespan extension. To identify these effectors, we here characterized the C. elegans mutant mxl-3. On one side, we chose this anti-aging intervention because the mxl-3’s longevity phenotype is completely suppressed by loss of hlh-30 function. On the other hand, distinct from other hlh-30-dependent anti-aging interventions (e.g., mTOR or insulin receptor inactivation) that perturb upstream signaling hubs with broad cellular impacts, mxl-3 encodes for a transcription factor with the same DNA-binding site as HLH-303. Therefore, the study of the mxl-3-hlh-30 longevity model was more likely to point us to critical anti-aging effectors acting downstream of HLH-30.
The initial characterization of the mxl-3 C. elegans mutant showed that its longevity phenotype does not require autophagy. It is worth noting here that, distinct from some previous studies, we used post-developmental RNAi and post-developmental chloroquine treatment to test the contribution of the autophagy and lysosomal machinery to mxl-3’s longevity. Post-developmental treatment was necessary because inactivation of autophagy during development leads to several developmental defects ranging from developmental arrest46,47 to altered adult physiology (e.g., reduced fat accumulation48). We found that post-developmental RNAi against atg-18, lgg-1, and bec-1, as well as complete inhibition of lysosomal activity with chloroquine, further increased the lifespan of the mxl-3 mutant worms. Future studies may investigate whether this enhanced longevity is due to a hormetic effect by which reduced autophagy promotes the activation of alternative cellular homeostatic processes such as the heat-shock response, proteasomal function, or other compensatory responses to dysfunctional autophagy, as previously observed in vitro49,50. Furthermore, our observations are in line with previous studies showing that post-developmental inactivation of autophagy can extend C. elegans lifespan51 and a study showing that chloroquine treatment can increase lifespan in rats, in part through the modulation of autophagy52. The results presented here indicate that longevity is possible in the absence of enhanced autophagy and that the master regulator of autophagy, HLH-30/TFEB, can promote longevity by mechanisms that are autophagy-independent.
Our search for alternative mechanisms of longevity orchestrated by HLH-30 pointed us to the alcohol dehydrogenase ADH-1. In the intestine of C. elegans, we found that ADH-1 localizes to the surface of lipid droplets (LDs). The main component of LDs are triglycerides, and triglycerides are composed of fatty acids and glycerol. Although most of the attention given to lipotoxicity focuses on the detrimental effects of free fatty acids, the alcohol glycerol can also be toxic. In fact, glycerol has been shown to shorten C. elegans lifespan32, and we show here that it normally accumulates in aging worms. Therefore, ADH-1 is in the right place in the cell to access and metabolize glycerol and, therefore, reduce the pro-aging effects of this naturally occurring alcohol (working model in Figure 4F). In line with this model, ADH-1OE worms have lower levels of glycerol compared to wild type worms and are resistant to the pro-aging effects of glycerol. It is worth noting that ADH-1 overexpression and adh-1 loss of function mutation do not have opposite phenotypes in C. elegans, which is similar to hlh-30 itself. Loss of hlh-30 function does not reduce C. elegans lifespan1,3 while hlh-30 overexpression promotes longevity. Nevertheless, we here demonstrate that loss of adh-1 leads to higher levels of glycerol in the HLH-30OE background, which otherwise shows low levels of glycerol. Therefore, ADH-1 activity negatively correlates with the levels of glycerol, and glycerol levels negatively correlate with lifespan. We propose that ADH-1 extends lifespan, at least in part, through alleviating the toxic effects of glycerol likely derived from fat stores that normally increase with age.
Additionally, in line with adh-1 being a critical downstream effector of HLH-30 longevity, loss of adh-1 function suppresses the longevity phenotype of all the hlh-30-dependent longevity models tested (mxl-3, eat-2, daf-2 and mTOR). Interestingly, although loss of adh-1 function significantly suppresses the extreme longevity phenotype of daf-2 C. elegans, inhibition of the next step in the metabolism of glycerol (aldehyde dehydrogenase) only partially rescued daf-2 longevity. There are at least two possible interpretations for this observation. From a technical perspective, it is possible that the dose of cyanamide was insufficient to fully inhibit all aldehyde dehydrogenase activity. From a biological perspective, it is possible that ADH-1 contributes to longevity through additional mechanisms.
Interestingly, the longevity models dependent on adh-1 either mimic fasting conditions (e.g., reduced insulin and mTOR signaling, and HLH-30 overexpression), or reduce food intake (i.e., eat-2). Furthermore, the hlh-30-dependent but autophagy-independent ARD program of germline-survival is activated in response to fasting45. Fasting and caloric restriction are anti-aging interventions effective across species and because ADH-1 is a common mediator of fasting-like anti-aging interventions, we hypothesized that ADH-1 may promote lifespan extension across species. We here confirmed this hypothesis in Saccharomyces cerevisiae, where we observed that overexpressing Adh1 is sufficient to extend chronological lifespan. We also found several studies showing that alcohol-dehydrogenase levels decrease in aging flies, rodents, and humans53–57, and our mining of published transcriptomics studies of mammals subject to fasting or caloric restriction identified adh-1 orthologs induced in 18 mouse and 6 human transcriptomic datasets. Furthermore, a meta-analysis of transcriptomic studies of calorically restricted mice, rats, pigs, and rhesus monkeys identified ADH1 as the most induced gene58. A separate meta-analysis of mouse transcriptomic data identified ADH1 as induced in response to several longevity-promoting interventions including caloric restriction, every-other-day feeding, and rapamycin treatment59. Additionally, comparing the mouse inbred lines C3H and C57BL/6J, showed that C57BL/6J has twice as much liver ADH1 activity60 and correspondingly, on average, C57BL/6J mice outlive CH3 by more than 100 days61. Admittedly, these studies are correlative, however, coupled to our C. elegans and yeast causal tests they suggest that Adh1 may be a universal anti-aging effector. Indeed, two causal studies in mice support this hypothesis. Tissue-specific overexpression of Adh1 protects mice against neurodegeneration62 and cardiac dysfunction63. In summary, the evidence points to the AMAR, as a convergent anti-aging effector acting across longevity programs and possibly across organisms including humans.
EXPERIMENTAL MODEL AND SUBJECT DETAILS
C. elegans strains and husbandry
C. elegans N2 (Bristol, UK), adh-1 (ok2799), mxl-3 (ok1947), atg-18 (gk378), eat-2 (ad456), OP433 [hlh-30::TY1::EGFP::3xFLAG + unc-119(+)], MAH235 (sqIs19 [hlh-30p::hlh-30::GFP + rol-6(su1006)]) and MAH240 (sqIs17 [hlh-30p::hlh-30::GFP + rol-6(su1006)]) were obtained from the Caenorhabditis Genetics Center (CGC). The CRISPR-Cas9 adh-1KI strain (PHX2365) and the 3 independent ADH-1OE strains (PHX2888, PHX2889, PHX2890) were generated for this study by SunyBiotech (China). After UV-driven integration, PHX2888, PHX2889, and PHX2890 were backcrossed ≥3 times; the respective backcrossed strains are referred to as GMW20, GMW21, GMW22. XD3971 strain (xdIs143[Pdaf-22::PLIN1::GFP; rol-6(su1006)]) was a generous gift from Dr. Monica Driscoll and Dr. Xun Huang. Genetic crosses were performed to generate mxl-3;adh-1, mxl-3;atg-18, HLH-30OE;adh-1, and pLIPIN::GFP;adh-1::wrmScarlet strains. For maintenance, C. elegans were grown at 20°C on NGM plates seeded with E. coli strain OP50. All experiments (except the glycerol supplementation aging experiments) including those not involving RNAi were performed using E. coli XU36364 carrying L4440 (empty vector) or L4440 plus the gene of interest. We used E. coli XU363 to avoid changing the bacterial background.
Yeast strains and culture
The estradiol-inducible ADH1 overexpression strain SY1144 is isogenic to diploid strain Y15090 (MATa/α [HAP1-NatMX-ACT1pr-Z3EV-ENO2term]/HAP1 ura3∆0/URA3 [can1∆::STE2pr-SpHIS5]/CAN1 his3∆1/his3∆1 lyp1∆/LYP1)65. Estradiol supplementation of the media causes translocation of a constitutively expressed Z3EV artificial transcriptional activator into the nucleus. Z3EV activates the expression of the ADH1 gene, which was engineered to contain six Z3EV binding sites in the promoter65. Yeast strains were grown in Synthetic Complete (SC) media with 2% glucose for the chronological lifespan and western blotting assays. To induce ADH1 expression, β-estradiol (dissolved in DMSO) was added to the liquid cultures at a final concentration of 6.25 or 100nM. All liquid cultures and agar plates were grown at 30°C.
METHOD DETAILS
C. elegans lifespan assays
Gravid worms of the strains of interest were bleached and the embryos rocked at 20ºC for 18 hours to synchronize the hatchlings. After estimating the concentration of hatchlings by counting the number of hatchlings in ≥5x 5µl drops, around 200 hatchlings were seeded on NGM + 1mM IPTG + 25µg/mL carbenicillin plates (RNAi plates) seeded with E. coli strain XU363 carrying an empty L4440 plasmid (control). To initiate the lifespan assays, 30–40 young-adult worms were picked onto 6cm RNAi plates supplemented with 100µg/mL FUdR (RPI, United States) and seeded with E. coli XU363 carrying the L4440 control plasmid (EV) or a dsRNA-producing plasmid. For RNAi against lgg-1, knockdown was confirmed by western blotting (Figure S1E). When stated, cyanamide (1mM) or chloroquine (1mM) were added to plates right before transferring the young adults.
Aging experiments in the absence of FUdR (Figures S2 and S3C) were performed as described above but omitting the FUdR. Once worms reached adulthood, they were moved every day to fresh NGM plates seeded with E. coli XU363 L4440 (empty plasmid) until progenies were no longer produced.
For lifespan assays on glycerol, glycerol was added to the molten agar at a final concentration of 0.04% or 0.4%. Hatchlings were seeded on NGM plates without glycerol. Once worms reached the L4 stage, they were moved to glycerol containing-NGM plates seeded with OP50 and 50µM FUdR as previously described66. Survival was scored daily or every other day. Worms were scored as dead if they did not respond to prodding with a platinum pick. Animals that escaped or died by bursting through the vulva were censored. Results were analyzed on SPSS using the Kaplan-Meier estimate with log rank test comparison across different strata. Figures were made using GraphPad Prism.
QUANTIFICATION AND STATISTICAL ANALYSIS
Data were considered statistically significant when p < 0.05 by Kaplan-Meier estimator with log rank test comparison across different strata (for aging experiments), unpaired Student’s t-test or one-way and two-way ANOVA (for non-aging experiments) as indicated in the Figure, Figure legends or experimental methods. Asterisks denote corresponding statistical significance: ns = not significant, *p<0.05, **p<0.01, ***p<0.001, ****p<0.0001. For aging experiments all p-values are reported in Data S1. Individual data points are presented where relevant, in addition to the mean and standard error of the mean (SEM) denoted by the error bars. The number of biological replicates for each experiment is stated in the legend of every figure or in the corresponding supplementary tables. In the figure legends or supplementary tables, N refers to the number of animals and n refers to the number of biological replicates. All statistical analyses were performed on SPSS (for aging experiments) or GraphPad Prism (for non-aging experiments).
Yeast lifespan assays
For yeast chronological lifespan assays (CLS), 10 mL of Synthetic Complete (SC) media with 2% glucose was inoculated with 100 µl of overnight culture and incubated on a roller drum (TC-7, New Brunswick Scientific) in glass tubes with metal caps allowing for gas exchange. After 72 hours, the first measurement of colony forming units (CFUs) on YPD agar plates was made and this was treated as day 1 for the experiment (100% starting viability), to which all the other CFU data was normalized. Measurements were taken every 2 days as previously described67,68. Briefly, at each time point, 20 µl of the cell suspension were removed from each tube and 10-fold serially diluted three times with sterile water. Next, 2.5 µl aliquots of each dilution were spotted onto a YPD plate. After 16 hours, images of the spots were taken under a Nikon Eclipse E400 brightfield microscope at 30x magnification. Microcolonies within the spots were automatically counted from the digital images using OrganoSeg69, with the parameters adjusted for yeast colony counting65. After accounting for the dilution factor, colony numbers from each day were divided by the number of colonies from the first time point (day 1) to calculate the viability score. Mean lifespan (in days) and the 95% confidence intervals were calculated using OASIS 269.
RT-qPCR
Worms were grown and synchronized as described in “Lifespan assays”. Approximately 1,500 synchronized L1 worms were seeded per 10cm RNAi plates containing control E. coli XU363. Once they reached the young adult stage, worms were transferred to RNAi plates containing 100µg/mL FUdR. At day 8 of adulthood, the animals were harvested using a mesh to remove the dead eggs, and worms were flash frozen in liquid nitrogen and preserved at -80ºC until processing.
RNA extraction was performed on frozen worms using TRI Reagent (MRC, United States) as described by the manufacturer. The purity and concentration of the RNA samples were determined using a NanoDrop. 3µg of RNA were then used to synthesize 20µL of complementary DNA (cDNA).
Quantitative PCR was finally carried out by running a mixture of cDNA, SYBR green and primers for the genes of interest (Table S1) in a real time PCR thermal cycler (Biorad, United States). Fold changes were calculated using the Pfaffl method71 and statistical significance compared to the WT control was calculated using an unpaired Student’s t-test.
C. elegans western blotting
Worms were grown and synchronized as described in “Lifespan assays”. Approximately 2,000 synchronized L1 worms were seeded onto 10cm RNAi plates containing E. coli XU363 control. After growing the worms to day 1 adults, half the worms were transferred to RNAi plates containing 20mM chloroquine (Sigma, United States) while the other half of the worms (controls) were harvested, meshed to remove any laid eggs, and then flash frozen in liquid nitrogen. After 8 hours of treatment with chloroquine (CQ), CQ-treated animals were harvested, meshed, and flash frozen in liquid nitrogen.
RIPA buffer (Cold Spring Harbor protocols) was added to 100µL of packed worm pellets which were subsequently sonicated at 40% amplitude for 10 secs, a total of 5 times (keeping them on ice in between cycles). Protein content in the lysate was estimated using a Bradford assay (Thermo Scientific, United States), and lysates were then stored at −20°C after adding protein loading buffer. From each lysate, 30µg of protein were loaded and resolved in a 4–12% Bis-Tris precast gel (Thermo Scientific, United States, Cat #: NP0322BOX) and then transferred to a nitrocellulose membrane. The membrane was blocked using Intercept (PBS) Blocking Buffer (Li-cor, United States) for 4 hours at room temperature, followed by an overnight incubation in 1:250 of our previously published anti-LGG-172 or in 1:5,000 anti-tubulin (DSHB, United States) primary antibodies. The next day, after washing, the membranes were incubated for an hour in the secondary antibody, Alexa Fluor® 800cw anti-rabbit (Li-cor, United States) or IRDye 800cw anti-mouse (Li-cor, United States). The proteins were visualized using a Li-cor Odyssey imaging system (Li-cor, United States) and the bands were quantified using densitometry analysis on ImageJ. Statistical significance compared to the WT and/or untreated control was calculated using an unpaired Student’s t-test.
Yeast western blotting
Western blots for yeast proteins were performed as previously described73. Cells were pelleted and stored at −80°C. To extract protein, cells were thawed on ice and resuspended in 0.5mL 20% trichloroacetic acid (TCA) at 4°C and then vortexed with glass beads 4 times for 30 seconds with 15 second rests on ice in between. Cell lysates were transferred to new microcentrifuge tubes. The beads were washed twice with 0.5mL 5% TCA at 4°C and the washes combined with the lysates, then centrifuged at 3,000 rpm for 10 minutes. Supernatants were discarded and the crude protein pellets were resuspended in 200μL of sample buffer (50 mM Tris HCl, pH 6.8, 2% SDS, 10% glycerol, 0.1% bromophenol blue, 5% 2-mercaptoethanol). After resuspension, 50μL of 2M Tris base was added and proteins were boiled for 5 minutes at 100°C. Samples (20 µl) were run on a 10% SDS polyacrylamide gel, then transferred onto PVDF membranes using a Biorad semi-dry transfer apparatus at 25 volts for 60 minutes. Membranes were blocked overnight with 5% non-fat milk in TBST at 4°C. Membranes were then incubated with either anti-alcohol dehydrogenase antibody (Rockland Immunochemicals, 200–4143-0100) at 1:1,000 or anti-alpha-tubulin antibody (Invitrogen, MA1–80017) at 1:5,000 in blocking buffer for 1 hour at room temperature. Membranes were washed in TBST once for 10 minutes followed by 3 washes for 5 minutes each. Membranes were then incubated in a secondary antibody, either HRP-conjugated anti-rabbit IgG (Promega Corporation, W4018) or HRP-conjugated anti-rat IgG (Abcam, ab6734) for 1 hour at room temperature. The membrane was washed again and then soaked for 5 minutes in HRP peroxidase substrate (Millipore, WBKLS0500), followed by a 1-minute soak in luminol (Millipore, WBKLS0500). Proteins were visualized using an Amersham ImageQuant 800 (Cytiva Life Sciences, 29399481) and the resulting bands were quantified using densitometry analysis on ImageJ. Statistical significance comparing Adh1 levels in CR relative to the non-restricted (NR) condition was determined by two-way ANOVA. Significance of estradiol induced Adh1 overexpression was determined by one-way ANOVA.
For caloric restriction, yeast cells were grown in Synthetic Complete (SC) media with 0.5% glucose. For no restriction (NR), they were grown in SC media containing 2% glucose. For Adh1 overexpression, beta-estradiol dissolved in DMSO was added to the SC NR media at the time of inoculation of yeast cells in concentrations of 0nM, 6.25nM and 100nM.
Immunostaining
Whole-body immunostaining against LGG-1 was performed as recently reported93. Briefly, adult worms were treated with mock or chloroquine as described above and then fixed in 60% isopropanol. They were then immobilized on slides using a polyacrylamide gel where they were treated with β-mercaptoethanol and collagenase. Worms were then incubated in a blocking solution before being incubated in anti-LGG-1 antibody (1:250) overnight at 4°C. Worms were then washed and incubated in a goat anti-rabbit antibody (1:500) (Invitrogen, United States) at room temperature for 2 hours. Images were taken using a Leica spinning disk confocal microscope (Leica, Germany) and analyzed using ImageJ.
Allyl alcohol survival assay
Worms were grown and synchronized as described in “Lifespan assays”. Fifty day-1 adults were transferred to RNAi plates supplemented with 0.3% Allyl Alcohol (Sigma, United States). Worms were scored 4 hours post-treatment; animals not responding to prodding with a platinum pick were scored as dead. Statistical significance relative to the appropriate control was calculated using an unpaired Student’s t-test.
Fluorescent imaging
Worms were grown and synchronized as described in “Lifespan assays”. On day 1 of adulthood, ~100 worms were harvested and immobilized with 100mg/mL levamisole. Worms were then mounted on agar pads and imaged using a Leica spinning disk confocal microscope (Leica, Germany) at 60x magnification (numerical aperture: 1.4). The daf-22P::PLIN1::GFP was excited and visualized with a CSU-488 laser (emission filter 540 nm) and the adh-1P::ADH-1::wrmScarlet::adh-13’UTR was excited and visualized with a CSU-561 laser (emission filter 600 nm). We also imaged the PLIN1::GFP;adh-1::WrmScarlet strains in the blue channel (CSU-405 laser; emission filter 488 nm) to ensure that the signal observed in the other channels was not due to autofluorescence from the gut granules (Figure S4C). Images were analyzed using ImageJ. Statistical significance relative to the appropriate control was calculated using an unpaired Student’s t-test.
Glycerol measurement
Glycerol quantification was performed as previously described with some modifications74. Worms were grown and synchronized as described in “Lifespan assays”. On day 1 (young) or 8 (aged) of adulthood, ~2,000 worms were harvested, flash-frozen in liquid nitrogen and stored at −80°C. Day 8 was picked because it is the last day that worms can be harvested without including a large number of dead animals in the samples. Additionally, by day 8, the worms already show significant signs of aging including damaged tissues, tubular lysosomes, atrophied intestine, and loss of self-fertility. To prepare worm lysates, 85µL of water was added to the frozen pellets of worms which were then sonicated for 10 seconds 5 times, keeping them for 2 minutes on ice between each sonication pulse. Samples were then centrifuged at 18,600g for 5 minutes at 4°C. Part of the supernatant was kept for protein quantification using a BCA assay, while the rest was deproteinized using trichloroacetic acid (TCA) and then neutralized following the manufacturer’s instructions (AAT Bioquest, United States). The neutralization solution (AAT Bioquest, United States) was added to the samples until the pH was between 6.7–7.5. Glycerol was then measured in the deproteinized samples using a commercial kit following the manufacturer’s protocol (R-Biopharm, Germany, Cat #: NC9662370). The measured amount of glycerol was then normalized to the corresponding sample’s amount of protein, and to a standard glycerol curve per manufacturer instructions. Statistical significance relative to the appropriate control was calculated using an unpaired Student’s t-test.
For glycerol measurement of HLH-30OE animals, the same protocol was followed except L1 worms were grown on E. coli XU363 carrying L4440 + GFP plasmids before being switched to E. coli XU363 carrying L4440 (empty plasmid) at the L4 stage for 24 hours. The worms were then harvested as described above. This approach allowed us to perform an acute overexpression of HLH-30.
Locomotor endurance assay
Approximately twenty-four 12-days old worms were picked into individual wells of 24-well RNAi plates. Worms were allowed to adapt to the well for ~1h. Wells were then flushed one at a time with S-buffer and one-minute videos were taken using an Olympus SZX7 microscope fitted with an Olympus U-CMAD3 camera. Videos were then analyzed using the wrMTrck plugin on ImageJ75. Statistical significance relative to the appropriate control was calculated using an unpaired Student’s t-test.
Egg laying assay
As soon as the N2 and GMW20 (ADH-1OE) worms reached the adult stage, single worms were picked into ten individual 6cc RNAi plates seeded with E. coli XU363 bacteria. Each of the ten worms was moved to fresh individual RNAi plates every 12h until reproduction ceased. The progenies laid during each 12h-period were allowed to develop until the L3-L4 stage at 20°C, and then counted. Statistical significance relative to the appropriate control was calculated using an unpaired Student’s t-test.
Glycerol choice assay
Eight 10µL spots of E. coli XU363 were seeded on 10cc RNAi plates equidistant from the plate-center and from each other. Alternating between the spots, glycerol was added to 4 of the E. coli XU363 spots. In parallel 1-day old worms were harvested, washed with S-buffer, and the concentration of worms in the suspension was estimated by counting worms in five 5µl drops. Worms were concentrated to five worms per microliter by centrifugation. To start the assay, approximately 200 synchronized adult worms (40µl) were seeded in the center of the plate. Plates were incubated at 20°C. After 3h, 6h, 12h and 24h, the number of worms on each spot was counted. Statistical significance was calculated using an unpaired Student’s t-test.
QUANTIFICATION AND STATISTICAL ANALYSIS
Data were considered statistically significant when p < 0.05 by Kaplan-Meier estimator with log rank test comparison across different strata (for aging experiments), unpaired Student’s t-test or one-way and two-way ANOVA (for non-aging experiments) as indicated in the Figure, Figure legends or experimental methods. Asterisks denote corresponding statistical significance: ns = not significant, *p<0.05, **p<0.01, ***p<0.001, ****p<0.0001. For aging experiments all p-values are reported in Data S1. Individual data points are presented where relevant, in addition to the mean and standard error of the mean (SEM) denoted by the error bars. The number of biological replicates for each experiment is stated in the legend of every figure or in the corresponding supplementary tables. In the figure legends or supplementary tables, N refers to the number of animals and n refers to the number of biological replicates. All statistical analyses were performed on SPSS (for aging experiments) or GraphPad Prism (for non-aging experiments).
RESOURCE AVAILABILITY
Lead contact
Further information and requests for resources and reagents should be directed to and will be fulfilled by the lead contact, Dr. Eyleen O’Rourke (ejorourke@virginia.edu).
Materials availability
C. elegans strains generated in this study will be made publicly available through the Caenorhabditis Genetics Center (CGC) after the first personal request.
Data and code availability
All data generated in this study are available in the main paper, supplemental information and supplemental excel file. This paper also analyzes existing, publicly available datasets: the accession numbers for the datasets are listed in the key resources table.
This paper does not report original code.
Any additional information required to reanalyze the data reported in this paper is available from the lead contact upon request.
KEY RESOURCES TABLE
| REAGENT or RESOURCE | SOURCE | IDENTIFIER |
|---|---|---|
| Antibodies | ||
| Rabbit anti-LGG-1 | Ke et al, 202071 | N/A |
| Rabbit anti-Adh1 (for yeast ADH1 western blotting) | Rockland Immunochemicals | Cat #: 200–4143-0100 |
| Mouse anti-tubulin | DSHB | Cat #: 4A1-s |
| Rat anti-alpha-tubulin | Invitrogen | Cat #: MA1–80017 |
| Alexa Fluor 800cw goat anti-rabbit | Li-cor | Cat #: 926–32211 |
| IRDye 800cw goat anti-mouse | Li-cor | Cat #: 92632210 |
| HRP-conjugated anti-rabbit IgG | Promega Corporation | Cat #: W4018 |
| HRP-conjugated anti-rat IgG | Abcam | Cat #: ab6734 |
| Alexa Fluor 594 goat anti-rabbit | Invitrogen | Cat #: A11012 |
| Bacterial and Virus Strains | ||
| E. coli strain OP50 | CGC | N/A |
| E. coli strain XU363 | CGC | N/A |
| Chemicals, Peptides, and Recombinant Proteins | ||
| 5-fluoro-2-deoxyuridine (FUDR) | Research Products International | Cat #: F10705–1.0 |
| Chloroquine Diphosphate Salt | Sigma-Aldrich | Cat #: C6628 |
| Cyanamide | Sigma-Aldrich | Cat #: 187364–5G |
| Glycerol | Fisher BioReagents | Cat #: BP229–1 |
| Allyl alcohol | Thomas Scientific | Cat #: C984Z15/240532–100ML |
| Carbenicillin, Disodium salt | Genesee Scientific | Cat #: 25–532 |
| TRI Reagent | Molecular Research Center | Cat #: TR 118 |
| FastSYBR Mixture | CoWin Biosciences, Inc. | Cat #: CW0955H |
| Intercept (PBS) Blocking Buffer | Li-cor | Cat #: 927–70001 |
| Critical Commercial Assays | ||
| ReadiUse TCA Deproteinization Sample Preparation Kit | AAT Bioquest | Cat #: 19501 |
| Glycerol assay kit | R-Biopharm | Cat #: NC9662370 |
| BCA protein assay kit | Fisher Scientific | Cat #: 23227 |
| Deposited Data | ||
| RNA-Seq of human adipose tissue after long term caloric restriction | Armenise et al, 201776 | Accession number: GSE95640 |
| DNA microarray of human adipose tissue after long term caloric restriction | Capel et al, 200877 | PMID: 18782868 |
| DNA microarray of human adipose tissue after long term caloric restriction | Tareen et al, 202078 | Accession number: GSE77962 |
| DNA microarray of human adipose tissue after long term caloric restriction | Capel et al, 200979 | Accession number: GSE11975 |
| DNA microarray of human adipose tissue after long term caloric restriction | Mutch et al, 201180 | Accession number: GSE24432 |
| DNA microarray of human adipose tissue after long term caloric restriction | Nookaew et al, 201381 | Accession number: GSE35710 |
| DNA microarray of mouse heart tissue after short term caloric restriction | Noyan et al, 201582 | Accession number: GSE68646 |
| DNA microarray of mouse adipose tissue after short term caloric restriction | Kim et al, 201683 | Accession number: GSE60596 |
| DNA microarray of mouse adipose tissue after long term caloric restriction | Higami et al, 200484 | PMID: 14688200 |
| DNA microarray of mouse liver tissue after long term caloric restriction | Mitchell et al, 201685 | Accession number: GSE81959 |
| DNA microarray of mouse liver tissue after short term caloric restriction | Tsuchiya et al, 200486 | PMID: 15039484 |
| DNA microarray of rat liver tissue after long term progressive caloric restriction | Pohjanvirta et al, 200887 | Accession number: GSE9121 |
| DNA microarray of mouse intestinal tissue after long term fasting | Hakvoort et al, 201188 | Accession number: GSE24504 |
| DNA microarray of mouse gastrocnemius muscle after long term caloric restriction | Lanza et al, 201289 | Accession number: GSE36285 |
| DNA microarray of mouse kidney tissue after long term fasting | Jongbloed et al, 201490 | Accession number: GSE52982 |
| DNA microarray of mouse cochlea after long term caloric restriction | Someya et al, 200691 | Accession number: GSE4786 |
| DNA microarray of mouse liver tissue after long term caloric restriction | Aon et al, 202092 | Accession number: GSE124294 |
| Experimental Models: Organisms/Strains | ||
| C. elegans strain: N2 Bristol | CGC | N/A |
| C. elegans strain: adh-1 (ok2799) | CGC | N/A |
| C. elegans strain: mxl-3 (ok1947) | CGC | N/A |
| C. elegans strain: atg-18 (gk378) | CGC | N/A |
| C. elegans strain: eat-2 (ad456) | CGC | N/A |
| C. elegans strain: OP433 [hlh-30::TY1::EGFP::3xFLAG + unc-119(+)] | CGC | N/A |
| C. elegans strain: MAH235 (sqIs19 [hlh-30p::hlh-30::GFP + rol-6(su1006)]) | CGC | N/A |
| C. elegans strain: MAH240 (sqIs17 [hlh-30p::hlh-30::GFP + rol-6(su1006)]) | CGC | N/A |
| C. elegans strain: PHX2365 gene knock-in (adh-1P::ADH-1::wrmScarlet::adh-1 3’UTR) | This study | N/A |
| C. elegans strain: GMW20 integrated arrays backcrossed 3x (adh-1P::ADH-1::wrmScarlet::adh-1 3’UTR) | This study | N/A |
| C. elegans strain: GMW21 integrated arrays backcrossed 3x (adh-1P::ADH-1::wrmScarlet::adh-1 3’UTR) | This study | N/A |
| C. elegans strain: GMW22 integrated arrays backcrossed 3x (adh-1P::ADH-1::wrmScarlet::adh-1 3’UTR) | This study | N/A |
| C. elegans strain: XD3971 (xdIs143[Pdaf-22::PLIN1::GFP; rol-6(su1006)]) | Liu et al, 201431 | N/A |
| Yeast strain: Y15090 (MATa/α [HAP1-NatMX-ACT1pr-Z3EV-ENO2term]/HAP1 ura3∆0/URA3 [can1∆::STE2pr-SpHIS5]/CAN1 his3∆1/his3∆1 lyp1∆/LYP1) | Calico labs | N/A |
| Oligonucleotides | ||
| Primers for qRT-PCR, see Table S1 | This study | N/A |
| Software and algorithms | ||
| SPSS | IBM | N/A |
| GraphPad Prism | GraphPad | N/A |
| OASIS 2 | Han et al, 201670 | N/A |
Supplementary Material
(A) Knockdown of hlh-30 suppresses mxl-3 longevity. EV = empty vector. Blue font denotes differential lifespan (as delta %) as compared to WT and red as compared to WT and red as compared to mxl-3 mutants. (*) denotes repeat depicted in Figure 1A. (B) Knockdown of autophagy genes atg-18, bec-1 and lgg-1 further extends mxl-3 lifespan. EV = empty vector. Blue font denotes differential lifespan (as delta %) as compared to WT and red font as compared to mxl-3 mutants. (*) denotes repeats depicted in Figure S1D. (C) Impairing autophagy by mutating atg-18 or lysosomal function and autophagy by treating worms with 1mM chloroquine does not suppress mxl-3 longevity. EV = empty vector. Blue font denotes differential lifespan (as delta %) as compared to WT and red font as compared to mxl-3 mutants. (*) denotes repeats depicted in Figures 1B and S1E. (D) adh-1 mediates mxl-3 and HLH-30OE longevity. EV = empty vector. Blue font denotes differential lifespan (as delta %) as compared to WT, red font as compared to mxl-3 mutant, and green font as compared to mxl-3 mutants. and green as compared to HLH-30OE. (*) denotes repeats depicted in Figures 1D & 1F. (E) Knockout of adh-1 and treatment with the aldehyde dehydrogenase inhibitor cyanamide decreases HLH-30OE lifespan in the absence of FUdR. Blue font denotes differential lifespan (as delta %) as compared to WT and red font as compared to HLH-30OE worms. (*) denotes repeat depicted in Figure S2. (F) Knockdown of adh-1 and treatment with the aldehyde dehydrogenase inhibitor cyanamide partially suppress eat-2 longevity. Blue font denotes differential lifespan (as delta %) as compared to WT and red font as compared to eat-2 mutants. (*) denotes repeats depicted in Figures 2B & 4C. (G) Knockdown of adh-1 suppresses let-363 RNAi lifespan extension. Blue font denotes differential lifespan (as delta %) as compared to WT and red font as compared to let-363 RNAi. (*) denotes repeats depicted in Figure 2C (H) Mutation of adh-1 and treatment with the aldehyde dehydrogenase inhibitor cyanamide suppress daf-2 RNAi-mediated longevity. Blue font denotes differential lifespan (as delta %) as to compared to WT and red font as compared to daf-2 RNAi. (*) denotes repeats depicted in Figures 2D & 4D. (I) Overexpression of ADH-1 is sufficient to promote longevity. This extended lifespan is dependent on cyanamide. Blue font denotes differential lifespan (as delta %) as compared to WT and red font as compared to ADH-1OE (GMW20, GMW21 or GMW22). (*) denotes repeats depicted in Figures 2E & 4A. (J) ADH-1 overexpression prolongs lifespan in the absence of FUdR. This extended lifespan is dependent on cyanamide. Blue font denotes differential lifespan (as delta %) as compared to WT and red font as compared to ADH-1OE (GMW20). (*) denotes repeats depicted in Figures S3C. (K) Overexpression of ADH-1 alleviates the pro-aging effect of glycerol (0.04%). Blue font denotes differential lifespan (as delta %) as compared to WT and red font as compared to ADH-1OE (GMW20) untreated. (*) denotes repeats depicted in Figure 3F. (L) Overexpression of ADH-1 alleviates the pro-aging effect of glycerol (0.4%). Blue font denotes differential lifespan (as delta %) as compared to WT and red font as compared to ADH-1OE (GMW20) untreated. (*) denotes repeats depicted in Figure 3F. (M) The aldehyde dehydrogenase inhibitor cyanamide suppresses mxl-3 and HLH-30OE longevity. EV = empty vector. Blue font denotes differential lifespan (as delta %) as compared to WT, red font as compared to mxl-3 mutants, and green font as compared to HLH-30OE. (*) denotes repeat depicted in Figures 3B and 3E. (N) Raw data for locomotor endurance assay to compare 12-days old wild type to same age ADH-1OE animals. (*) denotes repeat depicted in Figure 2F. (O) Raw data for size measurements of WT and ADH-1 OE animals. (*) denotes repeat depicted in Figure S3D. (P) Pharyngeal pumping assay comparing WT and ADH-1OE animals. (*) denotes repeat depicted in Figure S3E. (Q) Defecation assay comparing WT and ADH-1OE. (*) denotes repeat depicted in Figure S1F. (R) Fertility assay comparing WT and ADH-1 OE. (*) denotes repeat depicted in Figures S1G and S1H. (S) ADH1 encoding genes are induced upon calorie restriction across species. The reported levels of induction relative to control condition shown in brackets.
eTOC blurb
Ghaddar, Mony et al. show that longevity caused by activation of the transcriptional activator of autophagy, TFEB/HLH-30, may not always require autophagy. Instead, they present the Alcohol-dehydrogenase Mediated anti-Aging Response (AMAR) as an HLH-30/TFEB-dependent, but more importantly, necessary and sufficient anti-aging effector acting across interventions and organisms.
Highlights:
AMAR is required for longevity across anti-aging interventions
AMAR is sufficient to promote longevity in C. elegans and yeast
AMAR extends lifespan, at least in part, by metabolizing glycerol
AMAR is activated in response to geroprotective interventions in mice and humans
Acknowledgements
We thank Drs. Monica Driscoll and Xun Huang for sharing the XD3971 LD reporter strain. We thank Dr. Felipe Cabreiro for providing advice on the glycerol-supplementation lifespan assay. We thank Dr. Kevin Janes for comments on the manuscript. We thank Nella Solodukhina for helping manage the lab and preparing reagents. Yeast strains were provided by Calico Labs and Charles Boone’s lab at the University of Toronto. AG was supported by a dissertation-year fellowship from the Society of Fellows (UVA) and a Harrison Family Jefferson Fellowship from the Jefferson Scholars Foundation. EEH was supported by the Medical Scientist Training Program (MSTP) training grant T32GM007267, the Cell and Molecular Biology (CMB) training grant T32GM008136, and an individual National Research Service Award (F30AG067760) from the National Institutes of Health (NIH). JSS is supported by NIH grants RO1GM075240 and RO1GM127394. EJO is supported by a Biomedical Scholars award from the Pew Charitable Trusts, an award from the Jeffress Trust, and grants from the NIH (DK087928) and W.M. Keck Foundation. Finally, we would like to acknowledge the CGC, which is funded by NIH Office of Research Infrastructure Programs (P40 OD010440), for providing C. elegans strains.
Footnotes
Publisher's Disclaimer: This is a PDF file of an unedited manuscript that has been accepted for publication. As a service to our customers we are providing this early version of the manuscript. The manuscript will undergo copyediting, typesetting, and review of the resulting proof before it is published in its final form. Please note that during the production process errors may be discovered which could affect the content, and all legal disclaimers that apply to the journal pertain.
Declaration of interests
The authors declare no competing interests.
References
- 1.Lapierre LR, De Magalhaes Filho CD, McQuary PR, Chu C-C, Visvikis O, Chang JT, Gelino S, Ong B, Davis AE, Irazoqui JE, et al. (2013). The TFEB orthologue HLH-30 regulates autophagy and modulates longevity in Caenorhabditis elegans. Nat. Commun 4, 2267. [DOI] [PMC free article] [PubMed] [Google Scholar]
- 2.Mony VK, Drangowska-Way A, Albert R, Harrison E, Ghaddar A, Horak MK, Ke W, O’Rourke EJ, (2021). Context-specific regulation of lysosomal lipolysis through network-level diverting of transcription factor interactions. Proc Natl Acad Sci U S A 118(41):e210483211. [DOI] [PMC free article] [PubMed] [Google Scholar]
- 3.O’Rourke EJ, and Ruvkun G (2013). MXL-3 and HLH-30 transcriptionally link lipolysis and autophagy to nutrient availability. Nat. Cell Biol 15, 668–676. [DOI] [PMC free article] [PubMed] [Google Scholar]
- 4.Zhang W, Li X, Wang S, Chen Y, and Liu H (2020). Regulation of TFEB activity and its potential as a therapeutic target against kidney diseases. Cell Death Discov 6, 32. [DOI] [PMC free article] [PubMed] [Google Scholar]
- 5.Zhang X, Chen W, Gao Q, Yang J, Yan X, Zhao H, Su L, Yang M, Gao C, Yao Y, et al. (2019). Rapamycin directly activates lysosomal mucolipin TRP channels independent of mTOR. PLoS Biol 17, e3000252. [DOI] [PMC free article] [PubMed] [Google Scholar]
- 6.Polito VA, Li H, Martini-Stoica H, Wang B, Yang L, Xu Y, Swartzlander DB, Palmieri M, di Ronza A, Lee VM-Y, et al. (2014). Selective clearance of aberrant tau proteins and rescue of neurotoxicity by transcription factor EB. EMBO Mol. Med 6, 1142–1160. [DOI] [PMC free article] [PubMed] [Google Scholar]
- 7.Decressac M, Mattsson B, Weikop P, Lundblad M, Jakobsson J, and Björklund A (2013). TFEB-mediated autophagy rescues midbrain dopamine neurons from α-synuclein toxicity. Proc Natl Acad Sci USA 110, E1817–26. [DOI] [PMC free article] [PubMed] [Google Scholar]
- 8.Pastore N, Ballabio A, and Brunetti-Pierri N (2013). Autophagy master regulator TFEB induces clearance of toxic SERPINA1/α-1-antitrypsin polymers. Autophagy 9, 1094–1096. [DOI] [PMC free article] [PubMed] [Google Scholar]
- 9.Settembre C, Di Malta C, Polito VA, Garcia Arencibia M, Vetrini F, Erdin S, Erdin SU, Huynh T, Medina D, Colella P, et al. (2011). TFEB links autophagy to lysosomal biogenesis. Science 332, 1429–1433. [DOI] [PMC free article] [PubMed] [Google Scholar]
- 10.Jia K, and Levine B (2007). Autophagy is required for dietary restriction-mediated life span extension in C. elegans. Autophagy 3, 597–599. [DOI] [PubMed] [Google Scholar]
- 11.Hansen M, Chandra A, Mitic LL, Onken B, Driscoll M, and Kenyon C (2008). A role for autophagy in the extension of lifespan by dietary restriction in C. elegans. PLoS Genet 4, e24. [DOI] [PMC free article] [PubMed] [Google Scholar]
- 12.Hansen M, Rubinsztein DC, and Walker DW (2018). Autophagy as a promoter of longevity: insights from model organisms. Nat. Rev. Mol. Cell Biol 19, 579–593. [DOI] [PMC free article] [PubMed] [Google Scholar]
- 13.Cuervo AM (2008). Autophagy and aging: keeping that old broom working. Trends Genet 24, 604–612. [DOI] [PMC free article] [PubMed] [Google Scholar]
- 14.Choi AMK, Ryter SW, and Levine B (2013). Autophagy in human health and disease. N. Engl. J. Med 368, 1845–1846. [DOI] [PubMed] [Google Scholar]
- 15.Grove CA, De Masi F, Barrasa MI, Newburger DE, Alkema MJ, Bulyk ML, and Walhout AJM (2009). A multiparameter network reveals extensive divergence between C. elegans bHLH transcription factors. Cell 138, 314–327. [DOI] [PMC free article] [PubMed] [Google Scholar]
- 16.Harvald EB, Sprenger RR, Dall KB, Ejsing CS, Nielsen R, Mandrup S, Murillo AB, Larance M, Gartner A, Lamond AI, et al. (2017). Multi-omics Analyses of Starvation Responses Reveal a Central Role for Lipoprotein Metabolism in Acute Starvation Survival in C. elegans. Cell Syst 5, 38–52.e4. [DOI] [PubMed] [Google Scholar]
- 17.ENCODE Project Consortium (2012). An integrated encyclopedia of DNA elements in the human genome. Nature 489, 57–74. [DOI] [PMC free article] [PubMed] [Google Scholar]
- 18.Celniker SE, Dillon LAL, Gerstein MB, Gunsalus KC, Henikoff S, Karpen GH, Kellis M, Lai EC, Lieb JD, MacAlpine DM, et al. (2009). Unlocking the secrets of the genome. Nature 459, 927–930. [DOI] [PMC free article] [PubMed] [Google Scholar]
- 19.Gao AW, Smith RL, van Weeghel M, Kamble R, Janssens GE, and Houtkooper RH (2018). Identification of key pathways and metabolic fingerprints of longevity in C. elegans. Exp. Gerontol 113, 128–140. [DOI] [PMC free article] [PubMed] [Google Scholar]
- 20.Murphy CT, McCarroll SA, Bargmann CI, Fraser A, Kamath RS, Ahringer J, Li H, and Kenyon C (2003). Genes that act downstream of DAF-16 to influence the lifespan of Caenorhabditis elegans. Nature 424, 277–283. [DOI] [PubMed] [Google Scholar]
- 21.Tissenbaum HA, and Ruvkun G (1998). An insulin-like signaling pathway affects both longevity and reproduction in Caenorhabditis elegans. Genetics 148, 703–717. [DOI] [PMC free article] [PubMed] [Google Scholar]
- 22.Good TP, and Tatar M (2001). Age-specific mortality and reproduction respond to adult dietary restriction in Drosophila melanogaster. J. Insect Physiol 47, 1467–1473. [DOI] [PubMed] [Google Scholar]
- 23.Widholm JM, and Kishinami I (1988). Allyl Alcohol Selection for Lower Alcohol Dehydrogenase Activity in Nicotiana plumbaginifolia Cultured Cells. Plant Physiol 86, 266–269. [DOI] [PMC free article] [PubMed] [Google Scholar]
- 24.Plapp BV, Lee AT-I, Khanna A, and Pryor JM (2013). Bradykinetic alcohol dehydrogenases make yeast fitter for growth in the presence of allyl alcohol. Chem. Biol. Interact 202, 104–110. [DOI] [PMC free article] [PubMed] [Google Scholar]
- 25.Toennes SW, Schmidt K, Fandiño AS, and Kauert GF (2002). A fatal human intoxication with the herbicide allyl alcohol (2-propen-1-ol). J. Anal. Toxicol 26, 55–57. [DOI] [PubMed] [Google Scholar]
- 26.Serafini-Cessi F (1972). Conversion of allyl alcohol into acrolein by rat liver. Biochem. J 128, 1103–1107. [DOI] [PMC free article] [PubMed] [Google Scholar]
- 27.Ghaddar A, Armingol E, Huynh C, Gevirtzman L, Lewis NE, Waterston R, and O’Rourke EJ (2022). Whole-body gene expression atlas of an adult metazoan. BioRxiv [DOI] [PMC free article] [PubMed]
- 28.El Mouridi S, Lecroisey C, Tardy P, Mercier M, Leclercq-Blondel A, Zariohi N, Boulin T (2017) Reliable CRISPR/Cas9 Genome Engineering in Caenorhabditis elegans Using a Single Efficient sgRNA and an Easily Recognizable Phenotype. G3 (Bethesda) 7, 1429–1437. [DOI] [PMC free article] [PubMed] [Google Scholar]
- 29.Heick HM, Willemot J, and Begin-Heick N (1969). The subcellular localization of alcohol dehydrogenase activity in baker’s yeast. Biochim. Biophys. Acta 191, 493–501. [DOI] [PubMed] [Google Scholar]
- 30.de Smidt O, du Preez JC, and Albertyn J (2008). The alcohol dehydrogenases of Saccharomyces cerevisiae: a comprehensive review. FEMS Yeast Res 8, 967–978. [DOI] [PubMed] [Google Scholar]
- 31.Liu Z, Li X, Ge Q, Ding M, and Huang X (2014). A lipid droplet-associated GFP reporter-based screen identifies new fat storage regulators in C. elegans. J. Genet. Genomics 41, 305–313. [DOI] [PubMed] [Google Scholar]
- 32.Lee S-J, Murphy CT, and Kenyon C (2009). Glucose shortens the life span of C. elegans by downregulating DAF-16/FOXO activity and aquaporin gene expression. Cell Metab 10, 379–391. [DOI] [PMC free article] [PubMed] [Google Scholar]
- 33.Edwards C, Canfield J, Copes N, Brito A, Rehan M, Lipps D, Brunquell J, Westerheide SD, and Bradshaw PC (2015). Mechanisms of amino acid-mediated lifespan extension in Caenorhabditis elegans. BMC Genet 16, 8. [DOI] [PMC free article] [PubMed] [Google Scholar]
- 34.Shirota FN, Stevens-Johnk JM, DeMaster EG, and Nagasawa HT (1997). Novel prodrugs of cyanamide that inhibit aldehyde dehydrogenase in vivo. J. Med. Chem 40, 1870–1875. [DOI] [PubMed] [Google Scholar]
- 35.Loomis CW, and Brien JF (1983). Inhibition of hepatic aldehyde dehydrogenases in the rat by calcium carbimide (calcium cyanamide). Can. J. Physiol. Pharmacol 61, 1025–1034. [DOI] [PubMed] [Google Scholar]
- 36.Grzelak A, Macierzyńska E, and Bartosz G (2006). Accumulation of oxidative damage during replicative aging of the yeast Saccharomyces cerevisiae. Exp. Gerontol 41, 813–818. [DOI] [PubMed] [Google Scholar]
- 37.Medina DL, Fraldi A, Bouche V, Annunziata F, Mansueto G, Spampanato C, Puri C, Pignata A, Martina JA, Sardiello M, et al. (2011). Transcriptional activation of lysosomal exocytosis promotes cellular clearance. Dev. Cell 21, 421–430. [DOI] [PMC free article] [PubMed] [Google Scholar]
- 38.Roczniak-Ferguson A, Petit CS, Froehlich F, Qian S, Ky J, Angarola B, Walther TC, and Ferguson SM (2012). The transcription factor TFEB links mTORC1 signaling to transcriptional control of lysosome homeostasis. Sci. Signal 5, ra42. [DOI] [PMC free article] [PubMed] [Google Scholar]
- 39.Palmieri M, Impey S, Kang H, di Ronza A, Pelz C, Sardiello M, and Ballabio A (2011). Characterization of the CLEAR network reveals an integrated control of cellular clearance pathways. Hum. Mol. Genet 20, 3852–3866. [DOI] [PubMed] [Google Scholar]
- 40.Sardiello M, and Ballabio A (2009). Lysosomal enhancement: a CLEAR answer to cellular degradative needs. Cell Cycle 8, 4021–4022. [DOI] [PubMed] [Google Scholar]
- 41.Chen H-D, Kao C-Y, Liu B-Y, Huang S-W, Kuo C-J, Ruan J-W, Lin Y-H, Huang C-R, Chen Y-H, Wang H-D, et al. (2017). HLH-30/TFEB-mediated autophagy functions in a cell-autonomous manner for epithelium intrinsic cellular defense against bacterial pore-forming toxin in C. elegans. Autophagy 13, 371–385. [DOI] [PMC free article] [PubMed] [Google Scholar]
- 42.Pan B, Zhang H, Cui T, and Wang X (2017). TFEB activation protects against cardiac proteotoxicity via increasing autophagic flux. J. Mol. Cell. Cardiol 113, 51–62. [DOI] [PMC free article] [PubMed] [Google Scholar]
- 43.Visvikis O, Ihuegbu N, Labed SA, Luhachack LG, Alves A-MF, Wollenberg AC, Stuart LM, Stormo GD, and Irazoqui JE (2014). Innate host defense requires TFEB-mediated transcription of cytoprotective and antimicrobial genes. Immunity 40, 896–909. [DOI] [PMC free article] [PubMed] [Google Scholar]
- 44.Chen M, Dai Y, Liu S, Fan Y, Ding Z, and Li D (2021). TFEB biology and agonists at a glance. Cells 10. [DOI] [PMC free article] [PubMed] [Google Scholar]
- 45.Gerisch B, Tharyan RG, Mak J, Denzel SI, Popkes-van Oepen T, Henn N, and Antebi A (2020). HLH-30/TFEB Is a Master Regulator of Reproductive Quiescence. Dev. Cell 53, 316–329.e5. [DOI] [PubMed] [Google Scholar]
- 46.Palmisano NJ, and Meléndez A (2019). Autophagy in C. elegans development. Dev. Biol 447, 103–125. [DOI] [PMC free article] [PubMed] [Google Scholar]
- 47.Meléndez A, and Neufeld TP (2008). The cell biology of autophagy in metazoans: a developing story. Development 135, 2347–2360. [DOI] [PMC free article] [PubMed] [Google Scholar]
- 48.Lapierre LR, Silvestrini MJ, Nuñez L, Ames K, Wong S, Le TT, Hansen M, and Meléndez A (2013). Autophagy genes are required for normal lipid levels in C. elegans. Autophagy 9, 278–286. [DOI] [PMC free article] [PubMed] [Google Scholar]
- 49.Kocaturk NM, and Gozuacik D (2018). Crosstalk Between Mammalian Autophagy and the Ubiquitin-Proteasome System. Front. Cell Dev. Biol 6, 128. [DOI] [PMC free article] [PubMed] [Google Scholar]
- 50.Saftig P, and Puertollano R (2021). How Lysosomes Sense, Integrate, and Cope with Stress. Trends Biochem. Sci 46, 97–112. [DOI] [PMC free article] [PubMed] [Google Scholar]
- 51.Hashimoto Y, Ookuma S, and Nishida E (2009). Lifespan extension by suppression of autophagy genes in Caenorhabditis elegans. Genes Cells 14, 717–726. [DOI] [PubMed] [Google Scholar]
- 52.Doeppner TR, Coman C, Burdusel D, Ancuta D-L, Brockmeier U, Pirici DN, Yaoyun K, Hermann DM, and Popa-Wagner A (2022). Long-term treatment with chloroquine increases lifespan in middle-aged male mice possibly via autophagy modulation, proteasome inhibition and glycogen metabolism. Aging (Albany NY) 14, 4195–4210. [DOI] [PMC free article] [PubMed] [Google Scholar]
- 53.Agarwal S, and Sohal RS (1994). Aging and protein oxidative damage. Mech. Ageing Dev 75, 11–19. [DOI] [PubMed] [Google Scholar]
- 54.Pozzato G, Moretti M, Franzin F, Crocè LS, Lacchin T, Benedetti G, Sablich R, Stebel M, and Campanacci L (1995). Ethanol metabolism and aging: the role of “first pass metabolism” and gastric alcohol dehydrogenase activity. J. Gerontol. A Biol. Sci. Med. Sci 50, B135–41. [DOI] [PubMed] [Google Scholar]
- 55.Petrosino JM, Longenecker JZ, Ramkumar S, Xu X, Dorn LE, Bratasz A, Yu L, Maurya S, Tolstikov V, Bussberg V, et al. (2021). Paracardial fat remodeling affects systemic metabolism through alcohol dehydrogenase 1. J. Clin. Invest 131. [DOI] [PMC free article] [PubMed] [Google Scholar]
- 56.Seitz HK, Meydani M, Ferschke I, Simanowski UA, Boesche J, Bogusz M, Hoepker WW, Blumberg JB, and Russell RM (1989). Effect of aging on in vivo and in vitro ethanol metabolism and its toxicity in F344 rats. Gastroenterology 97, 446–456. [DOI] [PubMed] [Google Scholar]
- 57.Kayo T, Allison DB, Weindruch R, and Prolla TA (2001). Influences of aging and caloric restriction on the transcriptional profile of skeletal muscle from rhesus monkeys. Proc Natl Acad Sci USA 98, 5093–5098. [DOI] [PMC free article] [PubMed] [Google Scholar]
- 58.Plank M, Wuttke D, van Dam S, Clarke SA, and de Magalhães JP (2012). A meta-analysis of caloric restriction gene expression profiles to infer common signatures and regulatory mechanisms. Mol. Biosyst 8, 1339–1349. [DOI] [PubMed] [Google Scholar]
- 59.Tyshkovskiy A, Bozaykut P, Borodinova AA, Gerashchenko MV, Ables GP, Garratt M, Khaitovich P, Clish CB, Miller RA, and Gladyshev VN (2019). Identification and Application of Gene Expression Signatures Associated with Lifespan Extension. Cell Metab 30, 573–593.e8. [DOI] [PMC free article] [PubMed] [Google Scholar]
- 60.Balak KJ, Keith RH, and Felder MR (1982). Genetic and developmental regulation of mouse liver alcohol dehydrogenase. J. Biol. Chem 257, 15000–15007. [PubMed] [Google Scholar]
- 61.Yuan R, Meng Q, Nautiyal J, Flurkey K, Tsaih S-W, Krier R, Parker MG, Harrison DE, and Paigen B (2012). Genetic coregulation of age of female sexual maturation and lifespan through circulating IGF1 among inbred mouse strains. Proc Natl Acad Sci USA 109, 8224–8229. [DOI] [PMC free article] [PubMed] [Google Scholar]
- 62.Wang Y, Zhang Y, Zhang X, Yang T, Liu C, and Wang P (2019). Alcohol Dehydrogenase 1B Suppresses β-Amyloid-Induced Neuron Apoptosis. Front. Aging Neurosci 11, 135. [DOI] [PMC free article] [PubMed] [Google Scholar]
- 63.Guo KK, and Ren J (2006). Cardiac overexpression of alcohol dehydrogenase (ADH) alleviates aging-associated cardiomyocyte contractile dysfunction: role of intracellular Ca2+ cycling proteins. Aging Cell 5, 259–265. [DOI] [PubMed] [Google Scholar]
- 64.Xiao R, Chun L, Ronan EA, Friedman DI, Liu J, and Xu XZS (2015). RNAi Interrogation of Dietary Modulation of Development, Metabolism, Behavior, and Aging in C. elegans. Cell Rep 11, 1123–1133. [DOI] [PMC free article] [PubMed] [Google Scholar]
- 65.Arita Y, Kim G, Li Z, Friesen H, Turco G, Wang RY, Climie D, Usaj M, Hotz M, Stoops EH, et al. (2021). A genome-scale yeast library with inducible expression of individual genes. Mol. Syst. Biol 17, e10207. [DOI] [PMC free article] [PubMed] [Google Scholar]
- 66.Pryor R, Norvaisas P, Marinos G, Best L, Thingholm LB, Quintaneiro LM, De Haes W, Esser D, Waschina S, Lujan C., et al. (2019). Host-Microbe-Drug-Nutrient Screen Identifies Bacterial Effectors of Metformin Therapy. Cell 178(6):1299–1312.e29. doi: 10.1016/j.cell.2019.08.003. Epub 2019 Aug 29. [DOI] [PMC free article] [PubMed] [Google Scholar]
- 67.Enriquez-Hesles E, Smith DL, Maqani N, Wierman MB, Sutcliffe MD, Fine RD, Kalita A, Santos SM, Muehlbauer MJ, Bain JR, et al. (2021). A cell-nonautonomous mechanism of yeast chronological aging regulated by caloric restriction and one-carbon metabolism. J. Biol. Chem 296, 100125. [DOI] [PMC free article] [PubMed] [Google Scholar]
- 68.Wierman MB, Maqani N, Strickler E, Li M, and Smith JS (2017). Caloric restriction extends yeast chronological life span by optimizing the snf1 (AMPK) signaling pathway. Mol. Cell. Biol 37. [DOI] [PMC free article] [PubMed] [Google Scholar]
- 69.Borten MA, Bajikar SS, Sasaki N, Clevers H, and Janes KA (2018). Automated brightfield morphometry of 3D organoid populations by OrganoSeg. Sci. Rep 8, 5319. [DOI] [PMC free article] [PubMed] [Google Scholar]
- 70.Han SK, Lee D, Lee H, Kim D, Son HG, Yang J-S, Lee S-JV, and Kim S (2016). OASIS 2: online application for survival analysis 2 with features for the analysis of maximal lifespan and healthspan in aging research. Oncotarget 7, 56147–56152. [DOI] [PMC free article] [PubMed] [Google Scholar]
- 71.Pfaffl MW (2001). A new mathematical model for relative quantification in real-time RT-PCR. Nucleic Acids Res 29, e45. [DOI] [PMC free article] [PubMed] [Google Scholar]
- 72.Ke W, Saba JA, Yao C-H, Hilzendeger MA, Drangowska-Way A, Joshi C, Mony VK, Benjamin SB, Zhang S, Locasale J, et al. (2020). Dietary serine-microbiota interaction enhances chemotherapeutic toxicity without altering drug conversion. Nat. Commun 11, 2587. [DOI] [PMC free article] [PubMed] [Google Scholar]
- 73.Hontz RD, Niederer RO, Johnson JM, and Smith JS (2009). Genetic identification of factors that modulate ribosomal DNA transcription in Saccharomyces cerevisiae. Genetics 182, 105–119. [DOI] [PMC free article] [PubMed] [Google Scholar]
- 74.Burkewitz K, Choe KP, Lee EC-H, Deonarine A, and Strange K (2012). Characterization of the proteostasis roles of glycerol accumulation, protein degradation and protein synthesis during osmotic stress in C. elegans. PLoS ONE 7, e34153. [DOI] [PMC free article] [PubMed] [Google Scholar]
- 75.Nussbaum-Krammer CI, Neto MF, Brielmann RM, Pedersen JS, and Morimoto RI (2015). Investigating the spreading and toxicity of prion-like proteins using the metazoan model organism C. elegans. J. Vis. Exp 52321. [DOI] [PMC free article] [PubMed]
- 76.Armenise C, Lefebvre G, Carayol J, Bonnel S, Bolton J, Di Cara A, Gheldof N, Descombes P, Langin D, Saris WH., et al. (2017). Transcriptome profiling from adipose tissue during a low-calorie diet reveals predictors of weight and glycemic outcomes in obese, nondiabetic subjects. Am J Clin Nutr 106(3):736–746. doi: 10.3945/ajcn.117.156216. Epub 2017 Aug 9. [DOI] [PubMed] [Google Scholar]
- 77.Capel F, Viguerie N, Vega N, Dejean S, Arner P, Klimcakova E, Martinez JA, Saris WH, Holst C, Taylor M, et al. (2008). Contribution of energy restriction and macronutrient composition to changes in adipose tissue gene expression during dietary weight-loss programs in obese women. J Clin Endocrinol Metab 93(11):4315–22. doi: 10.1210/jc.2008-0814. Epub 2008 Sep 9. [DOI] [PubMed] [Google Scholar]
- 78.Tareen SHK., Kutmon M, de Kok TM, Mariman ECM, van Baak MA, Evelo CT, Adriaens ME, Arts ICW, (2020). Stratifying cellular metabolism during weight loss: an interplay of metabolism, metabolic flexibility and inflammation. Sci Rep 10(1):1651. doi: 10.1038/s41598-020-58358-z. [DOI] [PMC free article] [PubMed] [Google Scholar]
- 79.Capel F, Klimcáková E, Viguerie N, Roussel B, Vítková M, Kováciková M, Polák J, Kovácová Z, Galitzky J, Maoret JJ., et al. (2009). Macrophages and adipocytes in human obesity: adipose tissue gene expression and insulin sensitivity during calorie restriction and weight stabilization. Diabetes 58(7):1558–67. doi: 10.2337/db09-0033. Epub 2009 Apr 28. [DOI] [PMC free article] [PubMed] [Google Scholar]
- 80.Mutch DM., Pers TH., Temanni MR, Pelloux V, Marquez-Quiñones A, Holst C, Martinez JA, Babalis D, van Baak MA, Handjieva-Darlenska T, et al. (2011). A distinct adipose tissue gene expression response to caloric restriction predicts 6-mo weight maintenance in obese subjects. Am J Clin Nutr 94(6):1399–409. doi: 10.3945/ajcn.110.006858. Epub 2011 Oct 26. [DOI] [PubMed] [Google Scholar]
- 81.Nookaew I, Svensson PA, Jacobson P, Jernås M, Taube M, Larsson I, Andersson-Assarsson JC, Sjöström L, Froguel P, Walley A, et al. (2013). Adipose tissue resting energy expenditure and expression of genes involved in mitochondrial function are higher in women than in men. J Clin Endocrinol Metab 98(2):E370–8. doi: 10.1210/jc.2012-2764. Epub 2012 Dec 21. [DOI] [PMC free article] [PubMed] [Google Scholar]
- 82.Noyan H, El-Mounayri O, Isserlin R, Arab S, Momen A, Cheng HS, Wu J, Afroze T, Li RK, Fish JE, et al. (2015). Cardioprotective Signature of Short-Term Caloric Restriction. PLoS One, 10(6):e0130658. doi: 10.1371/journal.pone.0130658. [DOI] [PMC free article] [PubMed] [Google Scholar]
- 83.Kim SS., Choi KM, Kim S, Park T, Cho IC, Lee JW, Lee CK (2016). Whole-transcriptome analysis of mouse adipose tissue in response to short-term caloric restriction. Mol Genet Genomics, 291(2):831–47. doi: 10.1007/s00438-015-1150-3. Epub 2015 Nov 25. [DOI] [PubMed] [Google Scholar]
- 84.Higami Y, Pugh TD, Page GP, Allison DB, Prolla TA, Weindruch R, (2004). Adipose tissue energy metabolism: altered gene expression profile of mice subjected to long-term caloric restriction. FASEB J 18(2):415–7. doi: 10.1096/fj.03-0678fje. Epub 2003 Dec 19. [DOI] [PubMed] [Google Scholar]
- 85.Mitchell SJ., Madrigal-Matute J, Scheibye-Knudsen M, Fang E, Aon M, González-Reyes JA, Cortassa S, Kaushik S, Gonzalez-Freire M, Patel B, et al. (2016). Effects of Sex, Strain, and Energy Intake on Hallmarks of Aging in Mice. Cell Metab 23(6):1093–1112. doi: 10.1016/j.cmet.2016.05.027. [DOI] [PMC free article] [PubMed] [Google Scholar]
- 86.Tsuchiya T, Dhahbi JM, Cui X, Mote PL, Bartke A, Spindler SR, (2004). Additive regulation of hepatic gene expression by dwarfism and caloric restriction. Physiol Genomics, 19;17(3):307–15. doi: 10.1152/physiolgenomics.00039.2004. [DOI] [PubMed] [Google Scholar]
- 87.Pohjanvirta R, Boutros PC, Moffat ID, Lindén J, Wendelin D, Okey AB, (2008). Genome-wide effects of acute progressive feed restriction in liver and white adipose tissue. Toxicol Appl Pharmacol 230(1):41–56. doi: 10.1016/j.taap.2008.02.002. Epub 2008 Feb 14. [DOI] [PubMed] [Google Scholar]
- 88.Hakvoort TB.,Moerland PD., Frijters R., Sokolović A., Labruyère WT., Vermeulen JL., Ver Loren van Themaat E, Breit TM., Wittink FR., van Kampen AH., et al. (2011). Interorgan coordination of the murine adaptive response to fasting. J Biol Chem 286(18):16332–43. doi: 10.1074/jbc.M110.216986. Epub 2011 Mar 10. [DOI] [PMC free article] [PubMed] [Google Scholar]
- 89.Lanza IR.,Zabielski P., Klaus KA., Morse DM., Heppelmann CJ., Bergen HR. 3rd, Dasari S., Walrand S, Short KR., Johnson ML., et al. (2012). Chronic caloric restriction preserves mitochondrial function in senescence without increasing mitochondrial biogenesis. Cell Metab 16(6):777–88. doi: 10.1016/j.cmet.2012.11.003. [DOI] [PMC free article] [PubMed] [Google Scholar]
- 90.Jongbloed F, de Bruin RW, Pennings JL, Payán-Gómez C, van den Engel S, van Oostrom CT., de Bruin A., Hoeijmakers JH., van Steeg H., IJzermans JN., et al. (2014). Preoperative fasting protects against renal ischemia-reperfusion injury in aged and overweight mice. PLoS One, 9(6):e100853. doi: 10.1371/journal.pone.0100853. [DOI] [PMC free article] [PubMed] [Google Scholar]
- 91.Someya S, Yamasoba T, Weindruch R,Prolla TA, Tanokura M, (2007). Caloric restriction suppresses apoptotic cell death in the mammalian cochlea and leads to prevention of presbycusis. Neurobiol Aging 28(10):1613–22. doi: 10.1016/j.neurobiolaging.2006.06.024. Epub 2006 Aug 4. [DOI] [PubMed] [Google Scholar]
- 92.Aon MA., Bernier M.,Mitchell SJ., Di Germanio C., Mattison JA., Ehrlich MR., Colman RJ., Anderson RM.,de Cabo R., (2020). Untangling Determinants of Enhanced Health and Lifespan through a Multi-omics Approach in Mice. Cell Metab 32(1):100–116.e4. doi: 10.1016/j.cmet.2020.04.018. Epub 2020 May 14. [DOI] [PMC free article] [PubMed] [Google Scholar]
- 93.Ghaddar A, Ke W, O’Rourke E Immunostaining of intact C. elegans using polyacrylamide embedding. STAR Protoc 2023. doi: 10.1016/j.xpro.2022.101956 [DOI] [PMC free article] [PubMed] [Google Scholar]
Associated Data
This section collects any data citations, data availability statements, or supplementary materials included in this article.
Supplementary Materials
(A) Knockdown of hlh-30 suppresses mxl-3 longevity. EV = empty vector. Blue font denotes differential lifespan (as delta %) as compared to WT and red as compared to WT and red as compared to mxl-3 mutants. (*) denotes repeat depicted in Figure 1A. (B) Knockdown of autophagy genes atg-18, bec-1 and lgg-1 further extends mxl-3 lifespan. EV = empty vector. Blue font denotes differential lifespan (as delta %) as compared to WT and red font as compared to mxl-3 mutants. (*) denotes repeats depicted in Figure S1D. (C) Impairing autophagy by mutating atg-18 or lysosomal function and autophagy by treating worms with 1mM chloroquine does not suppress mxl-3 longevity. EV = empty vector. Blue font denotes differential lifespan (as delta %) as compared to WT and red font as compared to mxl-3 mutants. (*) denotes repeats depicted in Figures 1B and S1E. (D) adh-1 mediates mxl-3 and HLH-30OE longevity. EV = empty vector. Blue font denotes differential lifespan (as delta %) as compared to WT, red font as compared to mxl-3 mutant, and green font as compared to mxl-3 mutants. and green as compared to HLH-30OE. (*) denotes repeats depicted in Figures 1D & 1F. (E) Knockout of adh-1 and treatment with the aldehyde dehydrogenase inhibitor cyanamide decreases HLH-30OE lifespan in the absence of FUdR. Blue font denotes differential lifespan (as delta %) as compared to WT and red font as compared to HLH-30OE worms. (*) denotes repeat depicted in Figure S2. (F) Knockdown of adh-1 and treatment with the aldehyde dehydrogenase inhibitor cyanamide partially suppress eat-2 longevity. Blue font denotes differential lifespan (as delta %) as compared to WT and red font as compared to eat-2 mutants. (*) denotes repeats depicted in Figures 2B & 4C. (G) Knockdown of adh-1 suppresses let-363 RNAi lifespan extension. Blue font denotes differential lifespan (as delta %) as compared to WT and red font as compared to let-363 RNAi. (*) denotes repeats depicted in Figure 2C (H) Mutation of adh-1 and treatment with the aldehyde dehydrogenase inhibitor cyanamide suppress daf-2 RNAi-mediated longevity. Blue font denotes differential lifespan (as delta %) as to compared to WT and red font as compared to daf-2 RNAi. (*) denotes repeats depicted in Figures 2D & 4D. (I) Overexpression of ADH-1 is sufficient to promote longevity. This extended lifespan is dependent on cyanamide. Blue font denotes differential lifespan (as delta %) as compared to WT and red font as compared to ADH-1OE (GMW20, GMW21 or GMW22). (*) denotes repeats depicted in Figures 2E & 4A. (J) ADH-1 overexpression prolongs lifespan in the absence of FUdR. This extended lifespan is dependent on cyanamide. Blue font denotes differential lifespan (as delta %) as compared to WT and red font as compared to ADH-1OE (GMW20). (*) denotes repeats depicted in Figures S3C. (K) Overexpression of ADH-1 alleviates the pro-aging effect of glycerol (0.04%). Blue font denotes differential lifespan (as delta %) as compared to WT and red font as compared to ADH-1OE (GMW20) untreated. (*) denotes repeats depicted in Figure 3F. (L) Overexpression of ADH-1 alleviates the pro-aging effect of glycerol (0.4%). Blue font denotes differential lifespan (as delta %) as compared to WT and red font as compared to ADH-1OE (GMW20) untreated. (*) denotes repeats depicted in Figure 3F. (M) The aldehyde dehydrogenase inhibitor cyanamide suppresses mxl-3 and HLH-30OE longevity. EV = empty vector. Blue font denotes differential lifespan (as delta %) as compared to WT, red font as compared to mxl-3 mutants, and green font as compared to HLH-30OE. (*) denotes repeat depicted in Figures 3B and 3E. (N) Raw data for locomotor endurance assay to compare 12-days old wild type to same age ADH-1OE animals. (*) denotes repeat depicted in Figure 2F. (O) Raw data for size measurements of WT and ADH-1 OE animals. (*) denotes repeat depicted in Figure S3D. (P) Pharyngeal pumping assay comparing WT and ADH-1OE animals. (*) denotes repeat depicted in Figure S3E. (Q) Defecation assay comparing WT and ADH-1OE. (*) denotes repeat depicted in Figure S1F. (R) Fertility assay comparing WT and ADH-1 OE. (*) denotes repeat depicted in Figures S1G and S1H. (S) ADH1 encoding genes are induced upon calorie restriction across species. The reported levels of induction relative to control condition shown in brackets.
Data Availability Statement
All data generated in this study are available in the main paper, supplemental information and supplemental excel file. This paper also analyzes existing, publicly available datasets: the accession numbers for the datasets are listed in the key resources table.
This paper does not report original code.
Any additional information required to reanalyze the data reported in this paper is available from the lead contact upon request.
KEY RESOURCES TABLE
| REAGENT or RESOURCE | SOURCE | IDENTIFIER |
|---|---|---|
| Antibodies | ||
| Rabbit anti-LGG-1 | Ke et al, 202071 | N/A |
| Rabbit anti-Adh1 (for yeast ADH1 western blotting) | Rockland Immunochemicals | Cat #: 200–4143-0100 |
| Mouse anti-tubulin | DSHB | Cat #: 4A1-s |
| Rat anti-alpha-tubulin | Invitrogen | Cat #: MA1–80017 |
| Alexa Fluor 800cw goat anti-rabbit | Li-cor | Cat #: 926–32211 |
| IRDye 800cw goat anti-mouse | Li-cor | Cat #: 92632210 |
| HRP-conjugated anti-rabbit IgG | Promega Corporation | Cat #: W4018 |
| HRP-conjugated anti-rat IgG | Abcam | Cat #: ab6734 |
| Alexa Fluor 594 goat anti-rabbit | Invitrogen | Cat #: A11012 |
| Bacterial and Virus Strains | ||
| E. coli strain OP50 | CGC | N/A |
| E. coli strain XU363 | CGC | N/A |
| Chemicals, Peptides, and Recombinant Proteins | ||
| 5-fluoro-2-deoxyuridine (FUDR) | Research Products International | Cat #: F10705–1.0 |
| Chloroquine Diphosphate Salt | Sigma-Aldrich | Cat #: C6628 |
| Cyanamide | Sigma-Aldrich | Cat #: 187364–5G |
| Glycerol | Fisher BioReagents | Cat #: BP229–1 |
| Allyl alcohol | Thomas Scientific | Cat #: C984Z15/240532–100ML |
| Carbenicillin, Disodium salt | Genesee Scientific | Cat #: 25–532 |
| TRI Reagent | Molecular Research Center | Cat #: TR 118 |
| FastSYBR Mixture | CoWin Biosciences, Inc. | Cat #: CW0955H |
| Intercept (PBS) Blocking Buffer | Li-cor | Cat #: 927–70001 |
| Critical Commercial Assays | ||
| ReadiUse TCA Deproteinization Sample Preparation Kit | AAT Bioquest | Cat #: 19501 |
| Glycerol assay kit | R-Biopharm | Cat #: NC9662370 |
| BCA protein assay kit | Fisher Scientific | Cat #: 23227 |
| Deposited Data | ||
| RNA-Seq of human adipose tissue after long term caloric restriction | Armenise et al, 201776 | Accession number: GSE95640 |
| DNA microarray of human adipose tissue after long term caloric restriction | Capel et al, 200877 | PMID: 18782868 |
| DNA microarray of human adipose tissue after long term caloric restriction | Tareen et al, 202078 | Accession number: GSE77962 |
| DNA microarray of human adipose tissue after long term caloric restriction | Capel et al, 200979 | Accession number: GSE11975 |
| DNA microarray of human adipose tissue after long term caloric restriction | Mutch et al, 201180 | Accession number: GSE24432 |
| DNA microarray of human adipose tissue after long term caloric restriction | Nookaew et al, 201381 | Accession number: GSE35710 |
| DNA microarray of mouse heart tissue after short term caloric restriction | Noyan et al, 201582 | Accession number: GSE68646 |
| DNA microarray of mouse adipose tissue after short term caloric restriction | Kim et al, 201683 | Accession number: GSE60596 |
| DNA microarray of mouse adipose tissue after long term caloric restriction | Higami et al, 200484 | PMID: 14688200 |
| DNA microarray of mouse liver tissue after long term caloric restriction | Mitchell et al, 201685 | Accession number: GSE81959 |
| DNA microarray of mouse liver tissue after short term caloric restriction | Tsuchiya et al, 200486 | PMID: 15039484 |
| DNA microarray of rat liver tissue after long term progressive caloric restriction | Pohjanvirta et al, 200887 | Accession number: GSE9121 |
| DNA microarray of mouse intestinal tissue after long term fasting | Hakvoort et al, 201188 | Accession number: GSE24504 |
| DNA microarray of mouse gastrocnemius muscle after long term caloric restriction | Lanza et al, 201289 | Accession number: GSE36285 |
| DNA microarray of mouse kidney tissue after long term fasting | Jongbloed et al, 201490 | Accession number: GSE52982 |
| DNA microarray of mouse cochlea after long term caloric restriction | Someya et al, 200691 | Accession number: GSE4786 |
| DNA microarray of mouse liver tissue after long term caloric restriction | Aon et al, 202092 | Accession number: GSE124294 |
| Experimental Models: Organisms/Strains | ||
| C. elegans strain: N2 Bristol | CGC | N/A |
| C. elegans strain: adh-1 (ok2799) | CGC | N/A |
| C. elegans strain: mxl-3 (ok1947) | CGC | N/A |
| C. elegans strain: atg-18 (gk378) | CGC | N/A |
| C. elegans strain: eat-2 (ad456) | CGC | N/A |
| C. elegans strain: OP433 [hlh-30::TY1::EGFP::3xFLAG + unc-119(+)] | CGC | N/A |
| C. elegans strain: MAH235 (sqIs19 [hlh-30p::hlh-30::GFP + rol-6(su1006)]) | CGC | N/A |
| C. elegans strain: MAH240 (sqIs17 [hlh-30p::hlh-30::GFP + rol-6(su1006)]) | CGC | N/A |
| C. elegans strain: PHX2365 gene knock-in (adh-1P::ADH-1::wrmScarlet::adh-1 3’UTR) | This study | N/A |
| C. elegans strain: GMW20 integrated arrays backcrossed 3x (adh-1P::ADH-1::wrmScarlet::adh-1 3’UTR) | This study | N/A |
| C. elegans strain: GMW21 integrated arrays backcrossed 3x (adh-1P::ADH-1::wrmScarlet::adh-1 3’UTR) | This study | N/A |
| C. elegans strain: GMW22 integrated arrays backcrossed 3x (adh-1P::ADH-1::wrmScarlet::adh-1 3’UTR) | This study | N/A |
| C. elegans strain: XD3971 (xdIs143[Pdaf-22::PLIN1::GFP; rol-6(su1006)]) | Liu et al, 201431 | N/A |
| Yeast strain: Y15090 (MATa/α [HAP1-NatMX-ACT1pr-Z3EV-ENO2term]/HAP1 ura3∆0/URA3 [can1∆::STE2pr-SpHIS5]/CAN1 his3∆1/his3∆1 lyp1∆/LYP1) | Calico labs | N/A |
| Oligonucleotides | ||
| Primers for qRT-PCR, see Table S1 | This study | N/A |
| Software and algorithms | ||
| SPSS | IBM | N/A |
| GraphPad Prism | GraphPad | N/A |
| OASIS 2 | Han et al, 201670 | N/A |