

Abstract
Anterior gradient‐2 (AGR2) is crucial to breast cancer progression. However, its role in the tumor immune microenvironment remains unclear. RNA sequencing expression profiles and associated clinical information were downloaded from The Cancer Genome Atlas and Gene Expression Omnibus databases, respectively. The AGR2 expression patterns were verified using clinical samples of breast cancer. Based on single‐cell transcriptomic data, AGR2 expression patterns were identified and cell communication analysis was carried out. Furthermore, the roles of AGR2 in breast tumor progression were explored by a series of functional experiments. We found that DNA methylation was an important mechanism for regulating the expression patterns of AGR2. Patients with AGR2 low expression displayed an immune “hot” and immunosuppressive phenotype characterized by high abundance of tumor immune cell infiltration and increased enrichment scores for transforming growth factor‐β (TGF‐β) and epithelial–mesenchymal transition pathways, whereas patients with AGR2 high expression showed an opposite immunologic feature with a lack of immune cell infiltration, suggestive of an immune “cold” and desert phenotype. Moreover, single‐cell analysis further revealed that AGR2 in malignant cells alters cell–cell interactions by coordinating cytokine–chemokine signaling and immune infiltration. Notably, two immunotherapy cohorts revealed that AGR2‐coexpressed genes could serve as prognostic indicators of patient survival. In conclusion, AGR2 could promote breast cancer progression by affecting the tumor immune microenvironment. Patients with AGR2 low expression could be suitable for combination treatment with immune checkpoint inhibitor agents and TGF‐β blockers. Therefore, this study provides a theoretical foundation for developing a strategy for personalized immunotherapy to patients with breast cancer.
Keywords: AGR2, breast cancer, immunotherapy, single‐cell analysis, tumor microenvironment
AGR2 in malignant cells regulates cell‐cell communication by coordinating cytokine‐chemokine signaling and immune infiltration. AGR2 could affect tumor immune microenvironment and thus promoted the progression of breast cancer.
Abbreviations
- AGR2
anterior gradient‐2
- BRCA
breast carcinoma
- EMT
epithelial–mesenchymal transition
- ER
estrogen receptor
- GDSC
Genomics of Drug Sensitivity in Cancer
- GEO
Gene Expression Omnibus
- GSVA
gene set variation analysis
- HER
human epidermal growth factor receptor
- ICD
immunogenic cell death
- ICP
immune checkpoint
- IKK
inhibitor of κB kinase
- PD‐1
programmed death‐1
- PD‐L1
programmed death‐ligand 1
- PI
propidium iodide
- PR
progesterone receptor
- TCGA
The Cancer Genome Atlas
- TGF‐β
transforming growth factor‐β
- TME
tumor microenvironment
- TNBC
triple negative breast cancer
- UMAP
uniform manifold approximation and projection
1. INTRODUCTION
Adenocarcinoma is a malignant tumor derived from the glandular epithelium, and its overall prognosis is poor. 1 World‐wide, breast cancer is the most prevalent form of adenocarcinoma, and is the leading cause of cancer‐associated death in women. Death is primarily due to the dissemination of malignant cells from the primary tumor to other organs of the body, leading to the growth of new tumors. 2 Effective diagnostic, prognostic, and therapeutic biomarkers can help to predict the survival of patients, track disease progression, and aid in the development of therapeutic agents. Although targeted therapy drugs, such as trastuzumab, olaparib, and lapatnib, 3 , 4 and immunotherapy drugs based on ICP inhibitors, such as pembrolizumab, and atezolizumab, 5 have been used successfully as breast cancer treatments, and combinations of immunotherapy with targeted drugs, such as pembrolizumab and eribulin, durvalumab and trastuzumab, or pembrolizumab and trastuzumab, 6 have achieved promising results in clinical trials, the therapeutic effect of these therapies remains unsatisfactory, due to the high heterogeneity of the TME. 7 Intratumor heterogeneity drives tumor progression and restricts the efficacy of current breast cancer therapies. 8 Thus, research aimed at identifying key genes that can be used to develop personalized therapeutic strategies for breast cancer is urgently needed.
Anterior gradient‐2, a member of the protein disulfide isomerase gene family, is a hormone‐responsive, secreted, endoplasmic reticulum‐resident chaperone protein, which plays major roles in the folding and quality control of cysteine‐rich transmembrane receptors and mucins by catalyzing disulfide bond formation and isomerization. 9 Anterior gradient‐2 is distributed widely in glandular tissues, and its enhanced expression is almost exclusively restricted to adenocarcinomas. 10 , 11 Numerous studies have shown that overexpression of AGR2 promotes the growth, survival, migration, invasion, and malignant transformation of tumor cells, all of which are associated with an adverse prognosis in multiple types of adenocarcinoma, including breast cancer. 12 The current study further revealed that AGR2 is a metastasis‐related gene, and could be a promising marker for the early diagnosis of breast cancer and a therapeutic target. 13 Anterior gradient‐2 has also been reported to be associated with the suppression of antitumor immunity in lung adenocarcinoma. 14 A novel therapeutic approach that is increasingly being offered to tumor patients involves targeting the TME. 15 Cancer cells exist in a TME composed of stromal cells such as fibroblasts, endothelial cells, epithelial cells, and myeloid cells. 16 These cells play important roles in cancer growth, invasion, and metastasis through a dynamic interaction with tumor cells. It is therefore necessary to undertake single‐cell analysis after the study of the average state of a cell population of genetically and environmentally different bulk tissues. However, the current study provides limited insight into the functional roles of AGR2 at single‐cell resolution within and between malignant and nonmalignant cells inside the tumor tissue.
In this study, we investigated the regulatory mechanism of AGR2 expression and its role in breast cancer, as well as the association between AGR2 expression and the tumor immune microenvironment of breast cancer. Our results revealed that AGR2 expression patterns were determined by promoter methylation. Moreover, AGR2 in malignant cells regulates cell–cell communication by coordinating cytokine‐chemokine signaling and immune infiltration. Two subgroups – high expression and low expression – were identified and validated based on the AGR2 expression. These groups showed markedly different cellular and molecular features, as well as distinct tumor immune microenvironment characteristics. Our findings provide a basis for the development of an AGR2‐based strategy for personalized therapy of breast cancer.
2. MATERIALS AND METHODS
2.1. Data acquisition
RNA sequencing expression profiles (fragments per kilobase million data) and associated clinical information about adenocarcinoma samples, including invasive BRCA, lung adenocarcinoma, pancreatic adenocarcinoma, prostate adenocarcinoma, and thyroid carcinoma, were downloaded from the TCGA (https://www.cancer.gov/tcga) database and GEO (http://www.ncbi.nlm.nih.gov/geo) database (GSE22219). The methylation levels of glandular tissues in humans were also acquired from the GEO database, including stomach (GSM 1120333), pancreas (GSM 1010966), blood vessel (GSM 1120329), muscle (GSM 1010986), heart (GSM 1120335), and adipose tissues (GSM 1120331), as well as from the Encyclopedia of DNA Elements (https://www.encodeproject.org/) database (ENCDO793LXB, ENCDO271OUW). Data about transcript levels in normal nonglandular tissues and glandular tissues were obtained from the Genotype‐Tissue Expression (https://gtexportal.org/home/) database. Expression datasets of ICP genes in breast cancer patients were accessed from The Cancer Immunome Database (http://tcia.at/home). Single‐cell mRNA sequencing data for breast cancer were obtained from the GEO database (GSE176078). Two immunotherapy cohorts were retrieved from the GEO database (GSE78220) and http://research‐pub.gene.com/IMvigor210CoreBiologies. The code used in analysis for this study is provided in Code S1.
2.2. Analysis of relationships between AGR2 expression, clinicopathological parameters, and drug sensitivity
Samples from patients with breast cancer were divided into the high and low AGR2 expression subgroups based on a cut‐off value. The cut‐off value was calculated using the surv_cutpoint function. 17 We used the χ2‐test to analyze the association between AGR2 expression and clinicopathologic characteristics, and p values less than 0.05 were considered significant. The clinicopathologic parameters included PR, TNBC, HER, and ER status, tumor, N and T stages, age, and gender. To evaluate the correlation between AGR2 expression and drug sensitivity, data on drug responses and targets/pathways were acquired from the GDSC (http://www.cancerrxgene.org/downloads), 18 and the Spearman correlation analysis was carried out. Values of |Rs| > 0.2 and p < 0.05 were considered to indicate significant correlations.
2.3. Gene set variation analysis
In order to explore the differences in the pathways in which genes in the high‐ and low‐expression subgroups were involved, we used pathway data from the Kyoto Encyclopedia of Genes and Genomes 19 and undertook GSVA enrichment analysis using the “GSVA” R package with an adjusted p < 0.05 indicating significance. 20
2.4. Evaluation of relationships between AGR2 expression, tumor‐infiltrating immune cells, and immune‐related signal pathways in TME
To estimate the abundance of each infiltrating immune cell type, single‐sample gene set enrichment analysis was carried out. 21 , 22 We further analyzed the relationship between AGR2 expression with immune‐related signal pathways. The relationships of AGR2 expression with tumor‐infiltrating immune cells and immune‐related signal pathways in the TME were detected using Wilcoxon signed‐rank tests, and p < 0.05 was taken to indicate a significant correlation.
2.5. Single‐cell analysis of breast cancer
Cell clustering assays were undertaken on the basis of the integrated joint embedding generated by Harmony with the Louvain algorithm. 23 The shared nearest neighbor graph was computed using the Louvain algorithm embedded in the “FindClusters” function of the Seurat package. We then used UMAP analysis to visualize the clusters identified using principal component analysis. The cell clusters were annotated based on well‐known previously reported cellular markers (Table S1). 24 Differences in the expression of these marker genes between the groups were identified using the default nonparametric Wilcoxon rank sum test.
We defined genes that were coexpressed with AGR2 as AGR2‐related genes. The top 100 AGR2‐related genes were identified using Spearman's test (Table S2). Next, principal component analysis was carried out to construct AGR2 relevant gene signature. Both principals 1 and 2 were selected to act as signature scores. We then defined the AGR2‐related gene score using a method similar to gene genealogy interrogation: 25
where i is the expression of AGR2‐related genes.
2.6. Analysis of intercellular interaction and cytokine signaling activity
Cell–cell interactions were analyzed using CellphoneDB. 26 Briefly, we first calculated the average expression levels of annotated ligand‐receptor pairs obtained from the STRING database. 27 Ligand‐receptor pairs were then determined as those with p values less than 0.05 returned by CellphoneDB. Finally, the associations between malignant cells and T cells were assessed using these pairs. To analyze the cytokine signaling activity, we used CytoSig, 28 a data‐driven platform to predict cytokine activities.
2.7. Clinical specimens and cell lines
Clinical specimens were obtained from 12 patients with breast cancer. Each patient provided a tumor sample and a sample from adjacent normal tissue. These patients did not develop metastases, and had no a history of other solid tumors, radiotherapy, or chemotherapy. All patients signed informed consent forms, and the protocol was approved by the Ethics Committee of Guizhou Medical University (2022[105]).
The human breast cancer cell lines MCF‐7 and MDA‐MB‐231 were obtained from ATCC. The cells were maintained in DMEM (Gibco, Thermo Fisher Scientific) with 10% FBS (Biological Industries), at 37°C under 5% CO2. Furthermore, MDA‐MB‐231 cells were treated with different concentrations of 5‐azacytidine (0, 0.3, 0.6, and 1.0 μM) for 48 h.
2.8. Determination of gene expression
For lentiviral transduction, the MCF‐7 and MDA‐MB‐231 cell lines were transiently transfected with the shRNA vector GV344 (hU6‐MCS‐CMV‐puromycin) obtained from Genechem. The stable knockdown cells were selected with puromycin (1 μg/mL). The sequences for the shRNAs were: shRNA‐1, CTCAAGTTGCTGAAGACTGAA; and shRNA‐2, GACAAACACCTTTCTCCTGAT.
We examined the mRNA levels of genes using quantitative real‐time PCR. Total RNA was extracted with TRIzol (9108; Takara), and mRNA levels were analyzed using 2× Super SYBR Green qPCR Master Mix (ES Science). The primer sequences for genes are shown in Table S3.
The expression levels of AGR2 protein were determined using western blotting. Briefly, samples were resolved using 15% SDS‐PAGE gel and then electrotransferred onto PVDF membranes (Invitrogen). After sealing with 5% fat‐free milk for 2 h, the membranes were added with the first Ab (rabbit anti‐AGR2 [1:1000, ab76473; Abcam]) or control GAPDH (1:10,000, ab181602; Abcam) overnight at 4°C and then added with HRP‐conjugated secondary Ab (1:10,000, abs20040ss; Absin).
2.9. Cell proliferation assays
Approximately 5000 cells per well were seeded into a 96‐well plate, and incubated at 37°C for 12, 24, 36, 48, or 72 h. At these time points, 10 μL CCK‐8 (Biosharp Biotechnology) was added to the medium and incubation was continued for an additional 2 h. The optical density was read at 450 nm.
2.10. Wound healing and Transwell invasion assays
For wound healing assays, the cells were cultured in serum‐free medium for 24 h. Then, a linear wound was generated by scratching the cell monolayer with an aseptic 200 μL pipette tip. Cell migration capacity was analyzed by calculating the wound closure percentage. For Transwell invasion assays, the cells were seeded on a Matrigel‐coated Transwell plate with serum‐free medium, and medium with 10% FBS was placed in the bottom chambers. Following incubation for 24 h, cells were fixed with 4% paraformaldehyde and stained with 0.1% crystal violet (Meilunbio).
2.11. Apoptosis and clone formation assays
We detected apoptotic cells using an Annexin V‐FITC/PI Apoptosis Kit (Absin), following the manufacturer's protocol. The colony‐forming ability of cells was determined using colony forming assays. Cells were seeded into dishes at a density of 103 cells per well, and incubated for 14 days. Cell colonies were then fixed with 4% paraformaldehyde for 15 min, and then stained with 0.1% crystal violet (Meilunbio) for 30 min, and finally photographed and counted.
2.12. Statistical analysis
In the in vitro experiment, GraphPad Prism 8 software (GraphPad Software, www.graphpad.com) was used for statistical analysis. Experiments were repeated three times, and all results were shown as mean ± SD.
3. RESULTS
3.1. Promoter methylation regulates AGR2 expression
To determine the expression pattern of AGR2, we first compared the expression levels of AGR2 in different human tissues. The expression levels of AGR2 were higher in glandular tissues than in nonglandular tissues (Figure 1A), and the levels in tumor tissues were markedly higher than in normal tissues for adenocarcinomas (Figure 1B). Using the 12 paired breast cancer and adjacent nontumor tissues, the high levels of AGR2 expression in tumor tissues was confirmed (Figure 1C). Subsequent analysis of DNA methylation indicated that the methylation levels of the AGR2 promoter in glandular tissues were lower than those in nonglandular tissues (Figure 1D,E), and tumor tissues have significantly decreased methylation levels of the AGR2 promoter compared with normal tissues (Figure 1F). Therefore, the extent of methylation of the promoter was inversely associated with the expression of AGR2. In vitro treatment of MDA‐MB‐231 cells with 5‐azacytidine, a DNA methyltransferase inhibitor, enhanced the expression of AGR2 (Figure 1G), revealing that promoter methylation regulated the AGR2 expression. Collectively, these data indicate that AGR2 expression was tissue‐specific, and was higher in adenocarcinoma, and that this expression pattern was regulated by promoter methylation.
FIGURE 1.
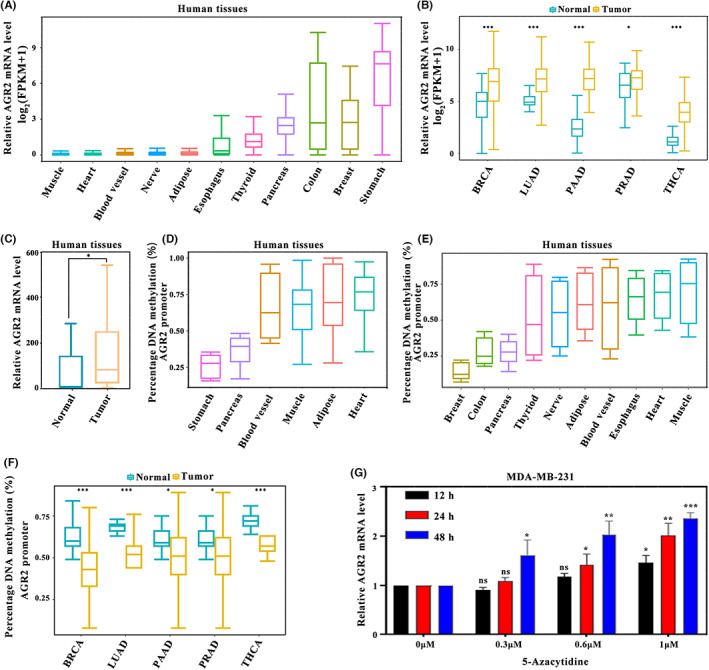
Inverse association between the levels of anterior gradient‐2 (AGR2) expression and its promoter methylation. (A) AGR2 expression levels in glandular tissues and nonglandular tissues (muscle, n = 478; heart, n = 493; blood vessel, n = 753; nerve, n = 335; adipose, n = 621; esophagus, n = 805; thyroid, n = 366; pancreas, n = 203; colon, n = 384, breast, n = 221; and stomach, n = 209). (B) AGR2 expression levels in cancer and normal tissues of multiple adenocarcinoma types retrieved from The Cancer Genome Atlas (breast carcinoma [BRCA]: normal, n = 113; tumor, n = 1109; lung adenocarcinoma [LUAD]: normal, n = 59; tumor, n = 535; pancreatic adenocarcinoma [PAAD]: normal, n = 4; tumor, n = 178; prostate adenocarcinoma [PRAD]: normal, n = 52; tumor, n = 499; and thyroid carcinoma [THCA]: normal, n = 58; tumor, n = 510; Wilcoxon test). (C) Difference in AGR2 expression between paired tumor tissues and normal breast tissues (normal, n = 12; tumor, n = 12; Student's t‐test). (D,E) AGR2 methylation levels in normal human tissues collected from the (D) Gene Expression Omnibus (stomach [GSM 1120333], n = 1; pancreas [GSM 1010966], n = 1; blood vessel [GSM 1120329], n = 1; muscle [GSM 1010986], n = 1; adipose tissues [GSM 1120331], n = 1; and heart [GSM 1120335], n = 1) and (E) Encyclopedia of DNA elements databases (n = 2). (F) AGR2 methylation levels in cancer and normal tissues of five adenocarcinoma types (BRCA: normal, n = 5; tumor, n = 5; LUAD: normal, n = 5; tumor, n = 5; PAAD: normal, n = 5; tumor, n = 5; PRAD: normal, n = 5; tumor, n = 5; and THCA: normal, n = 5; tumor, n = 5; Wilcoxon test). (G) Treatment of MDA‐MB‐231 cells with 5‐azacytidine, a DNA methyltransferase inhibitor, enhanced AGR2 expression (Student's t‐test). *p < 0.05; **p < 0.01; ***p < 0.001. FPKM, fragments per kilobase million
3.2. Relationship between AGR2 and clinicopathologic features and signaling pathways
In TCGA‐BRCA samples, tumor patients with survival times of less than 90 days were excluded. A total of 1026 samples were obtained. Subsequently, these samples were divided into high‐expression and low‐expression subgroups based on the cut‐off value (66.84912). To investigate the clinical relevance of AGR2, samples with incomplete clinical information were further removed. As shown in Figure 2A, differences in PR status, TNBC status, HER status, ER status, N stage, and age were apparent between the two subgroups. Expression of AGR2 was significantly associated with the clinical indicators. A heatmap of the top 23 differentially expressed genes in a comparison of high‐expression and low‐expression subgroups is also displayed in Figure 2A. To further identify differentially abundant pathways in these two groups, GSVA was carried out. The AGR2 low‐expression samples were mainly enriched in immune‐related pathways (NOD‐like receptor signaling pathway, Toll‐like receptor signaling pathway, natural killer cell‐mediated cytotoxicity pathway, T‐cell receptor signaling pathway, B‐cell receptor signaling pathway, antigen processing and presentation, and RIG‐I‐like receptor signaling pathway) and P53 tumor suppressor pathways, whereas AGR2 high‐expression samples were significantly enriched in signaling pathways involved in cancer‐related metabolic reprogramming (MAPK signaling pathway, nitrogen metabolism, tyrosine metabolism, metabolism of xenobiotics by cytochrome P450, drug metabolism‐cytochrome P450, porphyrin and chlorophyll metabolism, and ascorbate and aldarate metabolism) (Figure 2B).
FIGURE 2.
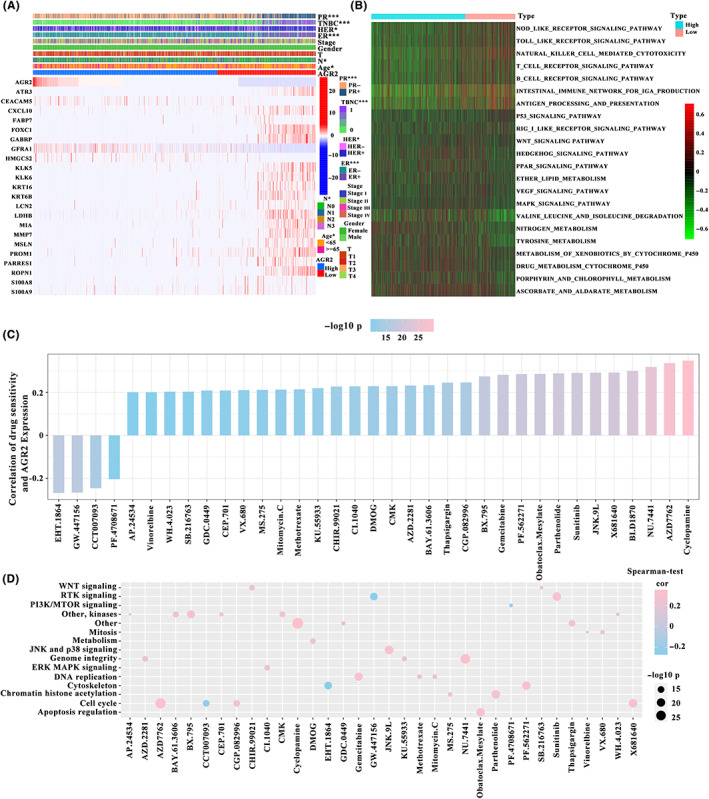
Correlation of anterior gradient‐2 (AGR2) expression with clinicopathologic features and chemotherapeutic drugs. (A) Progesterone receptor (PR), triple negative breast cancer (TNBC), human epidermal growth factor receptor (HER), and estrogen receptor (ER) status, N stage, and age were significantly associated with AGR2 expression (The Cancer Genome Atlas – breast carcinoma [TCGA‐BRCA], n = 982; χ2‐test). (B) Gene set variation analysis enrichment analysis showing the differences between AGR2 high‐ and low‐expression tumors (TCGA‐BRCA, n = 1026). (C) Relationship between AGR2 expression and drug sensitivity (TCGA‐BRCA, n = 1026; Spearman's correlation analysis). (D) Relationship between signaling pathways targeted by drugs and drugs (TCGA‐BRCA, n = 1026; Spearman's correlation analysis). Drug names are listed on the horizontal axis and the signaling pathway targeted by the drug on the vertical axis. Bar graph on the right shows the number of drugs targeting each signaling pathway. Size of the point indicates the significance of the correlation
3.3. Association between AGR2 expression and sensitivity to chemotherapeutic drugs
Using data from the GDSC database, the effects of AGR2 expression on drug response were evaluated. A total of 35 strongly associated pairings between AGR2 expression and drug sensitivity or resistance were identified. Of these, overexpression of AGR2 was significantly positively correlated with sensitivity to four drugs (Figure 2C). Thirty‐one drugs showed resistance associated with the high expression of AGR2. Pathway enrichment analysis of the genes targeted by these drugs suggested that AGR2 expression was strongly associated with drug‐related signaling pathways, such as the PTK signaling pathway, the JNK and p38 signaling pathways, and the cell cycle signaling pathway (Figure 2D). These results indicate that AGR2 expression was linked to drug sensitivity, and AGR2 could be a target gene for the development of personalized therapeutic approaches.
3.4. Correlation between AGR2 expression and TME characteristics
Given that the efficacy of immune therapy relies on the tumor immune status, the immune cell components in the AGR2 high‐ and low‐expression subgroups were characterized by calculating the infiltration scores of 28 immune cells. 21 , 22 We found that the proportions of immune cell components were significantly different between these two subgroups (Figure 3A). The low‐expression subgroup showed high levels of tumor infiltrating immune cells, such as memory B cells, CD8+ T cells, and CD4+ memory activated T cells, in the TCGA cohort, as it did in the GEO cohort (Figure S1A). Consequently, cancers with low expression of AGR2 were regarded as the immune “hot” tumors, enriched in infiltrative immune cells, whereas cancers with high AGR2 expression were termed the immune “cold” tumors, with a lack of immune cell infiltration. We analyzed the correlation between the two subgroups and 58 previously reported immune‐related molecular features. 29 , 30 A significant difference between the high‐ and low‐expression subgroups in the enrichment scores of immune‐related signaling pathways was observed. The low‐expression group displayed high enrichment scores in almost all molecular signatures in data from both TCGA and GEO databases (Figures 3B and S1B), confirming the reliability of the above results. We also observed that the low‐expression subgroup was accompanied by activation of the pan‐fibroblast TGF‐β response, EMT, and WNT pathways, indicating that patients with low AGR2 expression were characterized by the immune “hot” and immunosuppressive phenotype. Therefore, AGR2 expression can reflect the immune status of breast cancer, facilitating the use of tailored immunotherapy strategies.
FIGURE 3.
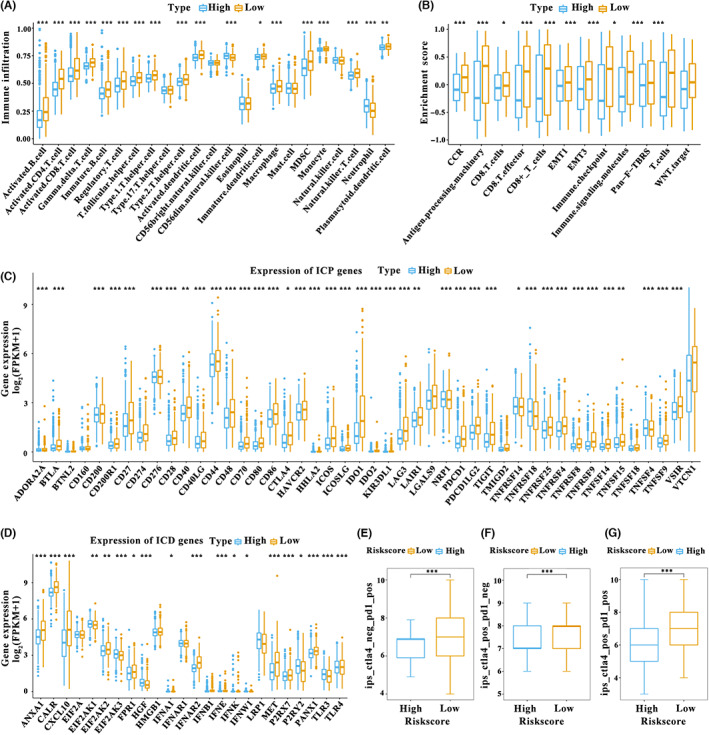
Tumor microenvironment characteristics of patients with distinct anterior gradient‐2 (AGR2) expression patterns. (A) Assessing the abundance of each tumor infiltrating immune cell in the AGR2 high‐ and low‐expression subgroups using single‐sample gene set enrichment analysis (The Cancer Genome Atlas – breast carcinoma [TCGA‐BRCA, n = 1026). (B) Difference in immune‐related signaling pathways between the two subgroups (TCGA‐BRCA, n = 1026) (C,D) Difference in the expression of (C) immune checkpoint (ICP) genes and (D) immunogenic cell death (ICD) modulators in the two subgroups (TCGA‐BRCA, n = 1026). (E–G) Relationship of AGR2 expression with the co‐expression of CTLA‐4 and programmed death‐ligand 1 (PD‐L1) (expression datasets of ICP genes in breast cancer patients from The Cancer Immunome Database, n = 1013), including (E) CTLA‐4 negative and programmed death‐1 (PD‐1) positive, (F) CTLA‐4 positive and PD‐1 negative, and (G) CTLA‐4 positive and PD‐1 positive. Wilcoxon test; *p < 0.05, **p < 0.01, ***p < 0.001. FPKM, fragments per kilobase million
3.5. Relationship between AGR2 expression and immunomodulators
Because the ICP genes and ICD modulators are crucial in the response to immunotherapy, 30 their expression levels in the AGR2 high‐ and low‐expression subgroups were evaluated. We first obtained the immune checkpoint genes and immunogenic cell death modulators based on previous studies. 30 Expression differences between two subgroups for each immune gene were then analyzed using Wilcoxon test. A total of 46 ICP genes were detected in the TCGA cohort, of which 39 (84.78%) had significantly different expression in the two subgroups (Figure 3C). Almost all differently expressed genes, including PD‐1, PD‐L1, and CTLA‐4, were significantly elevated in the AGR2 low‐expression subgroup. In the GEO cohort, 20 ICP genes were differently expressed in the high‐ and low expression subgroups, and the low‐expression subgroup displayed marked upregulation of these genes (Figure S1C). Twenty‐four ICD modulators in the TCGA cohort were analyzed, and 19 (76.00%) exhibited different expression patterns in the two subgroups. For instance, the low‐expression subgroup showed a strong upregulation of ANXIA1, CALR, CXCL10, EIF2AK2, FPR1, IFNAR2, IFNB1, IFNE, IFNK, MET, P2RY2, and PANX1 (Figure 3D). In the GEO cohort, eight ICD modulators were differently expressed in the two subgroups, and the low‐expression subgroup had high levels of ANXA1, CALR, CXCL10, FPR1, IFNA1, P2RX7.1, and TLR4 (Figure S1D). The immune cell proportion score of CTLA‐4 and PD‐1 also revealed that low expression of AGR2 was related to high expression of PD‐L1 and/or CTLA‐4 in immune cells (Figure 3E–G). The AGR2 expression patterns can therefore reflect the expression levels of ICP genes and ICD modulators, and AGR2 might therefore be a valuable biomarker for predicting response to immunotherapy. We speculated that patients with low AGR2 expression could benefit from immunotherapy using ICP inhibitors.
3.6. Single‐cell analysis of AGR2 expression in breast tumors
As cellular diversity in tumors is a critical factor influencing the efficacy of therapy of solid malignancies, the expression patterns of AGR2 in malignant cells and nonmalignant cells were evaluated using the single‐cell transcriptomic data (GSE176078). Figure 4A shows the distribution of malignant and nonmalignant cells, and it is apparent that these cells aggregated separately. The majority of malignant cells had a significantly high expression of AGR2, whereas AGR2 was barely expressed in other cell types (Figure 4B). To further reveal the pattern of heterogeneity among malignant cells, 24,489 malignant cells were analyzed using UMAP. A total of 22 subgroups were identified (Figure 4C), of which 11 showed high expression of AGR2 (Figure 4D). We further observed both inter‐ and intratumoral heterogeneity in AGR2 expression (Figure 4D,E). These findings indicate that AGR2 expression was not only cell type‐specific but also significantly heterogeneous.
FIGURE 4.
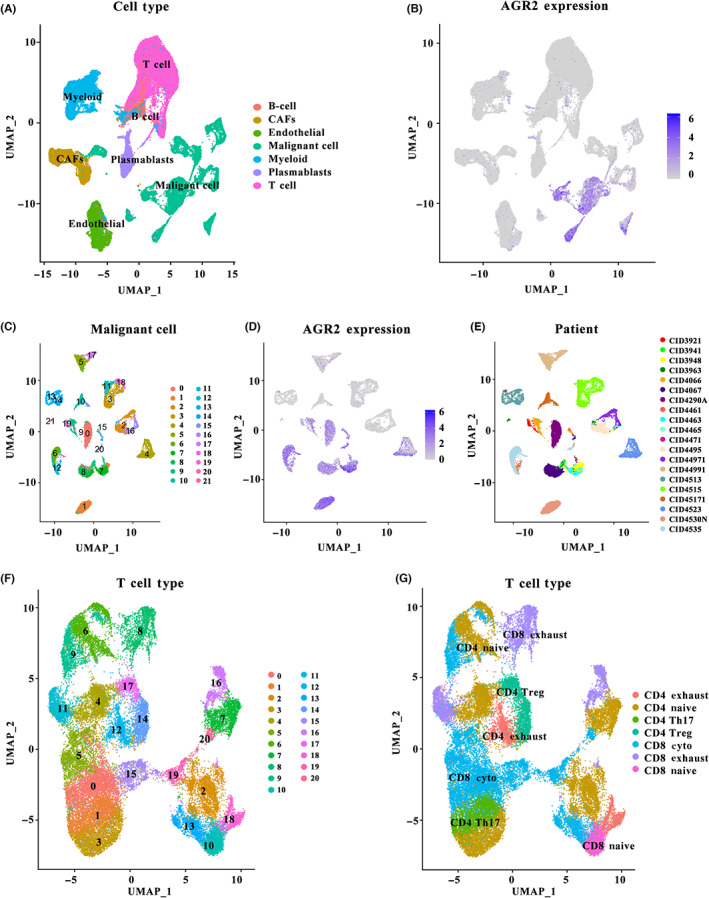
Single‐cell analysis of anterior gradient‐2 (AGR2) expression in breast tumors. (A) Uniform manifold approximation and projection (UMAP) plot of the seven identified cell types, including malignant cells and nonmalignant cells. (B) AGR2 expression patterns in the seven cell types. (C) UMAP plot of the 22 identified subgroups from malignant cells. (D) AGR2 expression patterns in the 22 subgroups. (E) UMAP of malignant cells is colored in terms of individual patients. (F) UMAP plot of the 21 identified subgroups from T cells. (G) Subpopulations of T cells identified. CAF, cancer‐associated fibroblast
3.7. Remodeling of intercellular interactions and cytokine signaling activity by AGR2 in TME
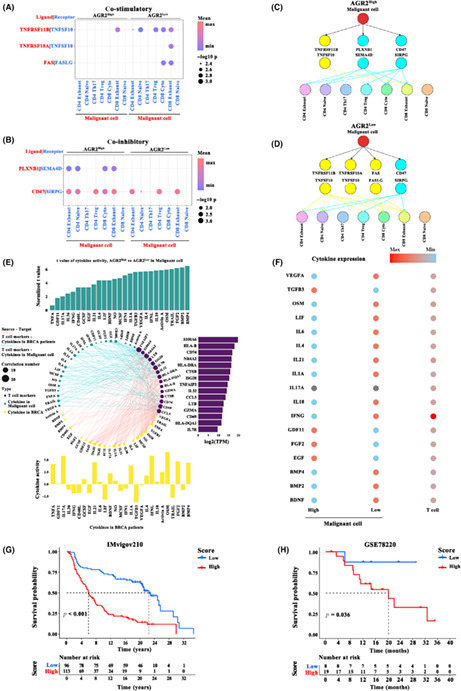
Because the interaction between malignant cells and T cells is a crucial prerequisite for effective anticancer therapy, cell communication analysis was carried out. We first annotated T cell subtypes with known cell type marker genes (Table S1), 24 and only observed seven subclusters of T cells: CD4 exhaust, CD4 native, CD4 Th17, CD4 Treg, CD8 cyto, CD8 exhaust, and CD8 native (Figure 4F,G). Cell–cell communication was evaluated using CellPhoneDB. High expression of AGR2 markedly repressed the co‐stimulatory signals TNFRSF11B, TNFRSF10A, and FAS generated by malignant cells (Figure 5A), while the co‐inhibitory cytokines PLXNB1 and CD47 were markedly increased in the cells with high AGR2 expression (Figure 5B). The difference in the malignant cell–T cell communication between AGR2 high‐ and low‐expression groups is shown in Figure 5C,D. Considering the functionally important roles of cytokines for cell–cell communication in tumor progression, we investigated whether AGR2 modulated the activity of cytokine signaling at the single‐cell level, using CytoSig. A total of 27 activated cytokine‐associated pathways were identified in malignant cells with a high expression of AGR2, and their levels were positively related to the marker genes from T cells (Figure 5E). In particular, the differences in the expression of cytokines (e.g., VEGFA, TGFB3, and OSM) in AGR2 high‐ and low‐expression malignant cells were correlated with distinct communication behaviors in T cells and malignant cells (Figure 5F). In general, AGR2 could play important roles in remodeling the interactions between malignant cells and T cells, as well as cytokine signaling activity in TME, and AGR2 might be a master regulator of communication between T cells and malignant cells in breast cancer. Given that the function of AGR2‐associated cellular programs in immunotherapy, the top 100 AGR2‐related genes (i.e., AGR2‐coexpressed genes) in malignant cells were extracted (Table S2). We then constructed a prognostic prediction model based on the expression levels of these AGR2‐related genes to evaluate the power of these genes for predicting response to ICP therapy in tumor patients. Significant differences in survival were observed in both cohorts, an anti‐PD‐L1 cohort (IMvigor210; advanced urothelial cancer), and an anti‐PD‐1 cohort (GSE78220; metastatic melanoma) (Figure 5F).
FIGURE 5.
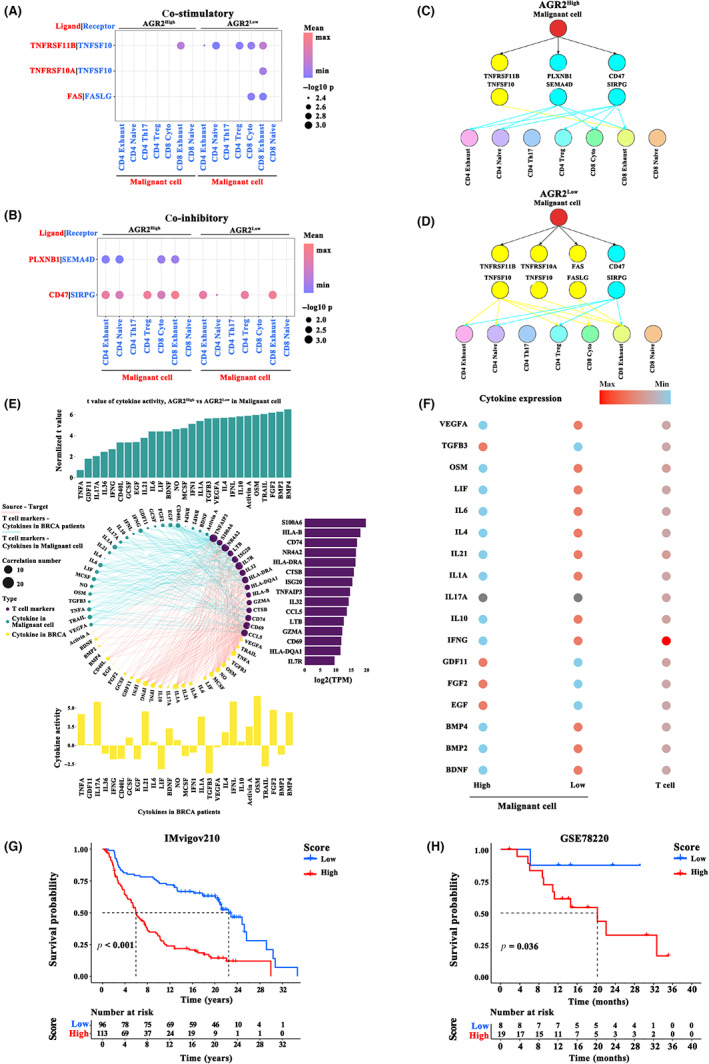
Cell–cell communication analysis. (A,B) Cell interaction between malignant cells and T cell subtypes through ligand‐receptor factors, including (A) co‐stimulatory factors and (B) co‐inhibitory factors, in anterior gradient‐2 (AGR2) high‐ and low‐expression groups. (C,D) Ligand‐receptor connections between malignant cells and T cell subsets, calculated under (C) AGR2 high expression or (D) AGR2 low expression conditions. (E) Interaction of cytokine pathway activity with malignant cells and T cell marker genes. The 27 cytokine pathways activated in malignant cells with high AGR2 expression (upper panel, blue bars) or breast cancer samples (bottom panel, yellow bars) positively related (r > 0.2 and p < 0.01) to T cell marker genes (right panel, purple bars). (F) Summary of cytokine expression in multiple cell types. (G,H) Kaplan–Meier curve showing overall survival of breast cancer patients in the AGR2‐related gene high‐ and low expression groups in the (G) anti‐programmed death‐ligand 1 (PD‐L1) immunotherapy cohort (IMvigor210; χ2‐test) and (H) anti‐programmed death‐1 (PD‐1) immunotherapy cohort (GSE78220; χ2‐test)
3.8. Function of AGR2 in breast tumor progression
To identify the role of AGR2 in breast tumor progression, a series of functional experiments were designed and carried out in vitro using MCF‐7 and MDA‐MB‐231 cells. Short hairpin RNAs targeting AGR2 were separately transfected into MCF‐7 and MDA‐MB‐231 cells, with scrambled shRNA as the control (shRNA‐Con), leading to a sharp drop in AGR2 mRNA (Figure 6A) and protein levels (Figure 6B). Using the CCK‐8 assay, we found that AGR2 knockdown significantly suppressed the proliferation of the MCF‐7 and MDA‐MB‐231 cells (Figure 6C). Knockdown of AGR2 attenuated the colony formation capacity of these cells (Figure 6D), an observation which supported the cell proliferation results. Silencing AGR2 strongly reduced the migration ability of the MCF‐7 and MDA‐MB‐231 cells (Figure 7A). We then determined the effects of AGR2 on cell invasion using Matrigel invasion assays. Consistent with the results of the cell proliferation and migration experiments, AGR2 depletion weakened the cell invasion ability (Figure 7B). Apoptosis was detected using annexin V‐FITC/PI apoptosis detection kits, and the percentage of PI‐positive cells reflected the proportion of apoptotic cells in all numbered cells. AGR2 shRNA significantly promoted apoptosis in MCF‐7 and MDA‐MB‐231 cells (Figure 7C). Interestingly, we observed that AGR2 knockdown did not affect the expression of E‐cadherin, N‐cadherin, or vimentin (Figure S2A), but it decreased the activity of AKT, IKK, and ERK in breast cancer cells (Figure S2B). Overall, these findings revealed that AGR2 had a critical role in promoting breast cancer progression and metastasis.
FIGURE 6.
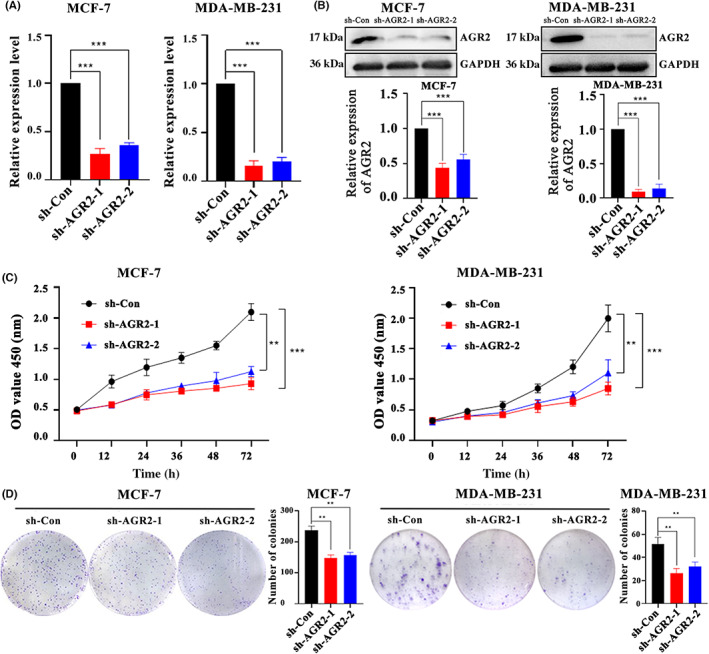
Knockdown of anterior gradient‐2 (AGR2) suppressed cell proliferation and colony formation. (A,B) AGR2 knockdown by shRNAs reduced (A) AGR2 mRNA levels and (B) protein levels in both MCF and MDA‐MB‐231 cells. (C) AGR2 knockdown significantly suppressing the (C) proliferation and (D) colony formation ability of the MCF‐7 and MDA‐MB‐231 cells. Student's t‐test; *p < 0.05; **p < 0.01; ***p < 0.001. OD, optical density; sh‐Con, control
FIGURE 7.
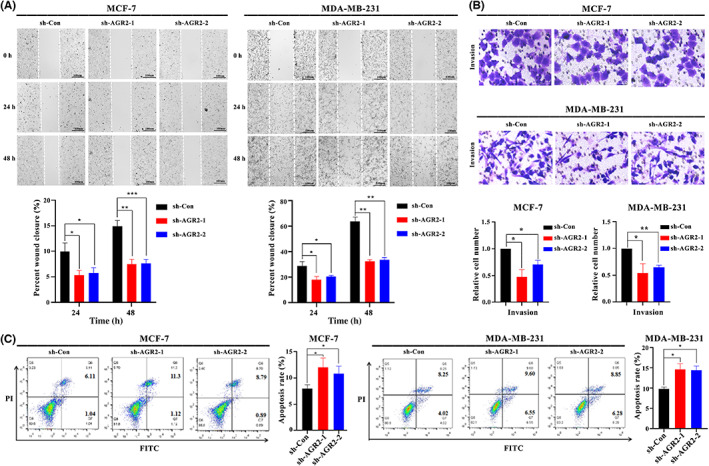
Knockdown of anterior gradient‐2 (AGR2) suppressed cell migration and invasion and promoted cell apoptosis. (A–C) AGR2 knockdown inhibited (A) migration and (B) invasion, and (C) promoted apoptosis of MCF and MDA‐MB‐231 cells. Student's t‐test, *p < 0.05; **p < 0.01; ***p < 0.001. PI, propidium iodide; sh‐Con, control
To further explore the role of AGR2 in immunity regulation, we evaluated the relationship between AGR2 and immune molecule expression. As shown in Figure S3, AGR2 knockdown significantly promoted the expression of co‐stimulatory molecules, such as TNFRSF11B, TNFRSF10A, and FAS, as well as the expression of MHC molecules, while it suppressed expression of co‐inhibitory cytokines, such as CD47 and PLXNB1. Thus, AGR2 could contribute to tumor immune escape.
4. DISCUSSION
In recent years, personalized treatment for breast cancer has markedly improved the prognoses of patients. Numerous studies indicate that AGR2 serves as a therapeutic, diagnostic, and prognostic target in patients with breast cancer. 12 , 13 However, the functional role of AGR2 in the breast cancer TME remains unclear.
Our study showed that the AGR2 was specifically expressed in glandular tissues, and its increased expression displayed in tumor tissues, including breast cancer. DNA methylation could be a powerful regulatory mechanism for controlling the expression of AGR2. Experiments in vitro further indicated that AGR2 silencing caused noticeably impaired proliferation, migration, invasion, and metastasis of breast cancer cells, implying that AGR2 overexpression promoted tumor progression. AGR2 is a potential therapeutic target gene, a finding that is consistent with those of previous studies. 13 Moreover, we found that AGR2 expression was closely related to the tumor immune microenvironment. Low AGR2 expression was associated with markedly increased infiltration of immune cells and expression of ICP genes, together with the enrichment of immune‐related signaling pathways, suggesting that AGR2, as an immune‐related gene, could be a biomarker for breast cancer immunotherapy. Current research has revealed that AGR2 plays an important role in tumor immunity. For instance, AGR2 inhibited steroid metabolism‐dependent humoral immune responses with interferon‐coupled cytoskeleton, thus resulting in lung adenocarcinoma metastasis. 14 The upregulated expression of MHC class I‐related chains A/B induced by AGR2 enhanced the susceptibility of hepatocellular carcinoma to natural killer cells. 31 To summarize, these findings highlight that the design of individualized therapeutic strategies for combating breast cancer based on AGR2 holds considerable promise.
Recently published studies indicate that the cellular diversity of tumors is responsible for treatment failure and lethal outcomes in patients with solid tumors. 32 Single‐cell transcriptomic data can provide an excellent resolution across cell types. 33 Therefore, based on single‐cell transcriptomics, we investigated the expression patterns of AGR2 in different cell types from breast tumor‐derived samples and provided a comprehensive view of AGR2‐mediated changes in cellular programs. Anterior gradient‐2 was expressed specifically in malignant cells, revealing that AGR2 expression in breast cancer influenced cell physiology in a cell‐specific manner. Expression of AGR2 in malignant cells also displayed high heterogeneity. High expression of AGR2 significantly repressed the co‐stimulatory signals and enhanced the co‐inhibitory cytokine signals between malignant cells and T cells, indicating that AGR2 could contribute to the regulation of cell–cell communication. Previous studies have also shown that inhibiting the co‐stimulatory signal FAS/FASLG results in compromised activation of T cells. 34 These findings indicate that AGR2 could contribute to guiding the stratification of patients for personalized treatment. The differences in survival in both immunotherapy cohorts also revealed that AGR2 might play a critical role in cancer immunotherapy.
Considering that only a subset of patients can respond to targeted therapy or immunotherapy, stratifying patients for personalized treatments is an effective strategy. Based on the expression level of AGR2, patients with breast cancer were divided into high‐ and low‐expression subgroups. The two groups showed remarkably different cellular, molecular, and clinical features, and different characteristics of the tumor immune microenvironment, suggesting that they might respond to different treatment strategies. Patients with low AGR2 expression showed immune “hot” tumors, and had an immunosuppressive phenotype, which were characterized by a high abundance of tumor immune cell infiltration and increased enrichment scores for the TGF‐β, and EMT pathways. However, patients with high AGR2 expression showed opposite immunologic features, with a lack of immune cell infiltration, suggestive of immune “cold” tumors, and thus represents a noninflammatory TME. 35 , 36
The immune “hot” tumors were correlated with a highly complex TME. 37 Generally, increased expression of ICP genes in the low‐expression subgroup implies an increased sensitivity to immunotherapy targeting ICPs in these patients. However, ICP blockade therapy is less effective for patients characterized by an immunosuppressive microenvironment. 28 Previous research suggests that increased EMT promoted tumor cell migration and invasion in an immunosuppressive microenvironment. 38 Elevated TGF‐β signaling induced cell proliferation and the EMT, as well as repressing immune function, leading to tumor progression. 39 Blocking TGF‐β could reshape the immunosuppressive microenvironment by enhancing the antitumor response of T cells, and finally restoring antitumor immunity. 40 Accordingly, patients with low AGR2 expression could be suitable for combination treatment with ICP inhibitor agents and TGF‐β blockers. Recent studies revealed that this combination therapy was remarkably effective across multiple tumor types with the immune “hot” and immunosuppressive phenotype. 41 The immune “cold” tumors corresponded to a TME with an absence of abundant infiltration of lymphocytes and low scores of TGF‐β response. This observation implies that inhibiting AGR2 expression could convert poorly immunogenic (cold) tumors into highly immunogenic and well‐infiltrated (hot) tumors. For tumor cells, suppressing AGR2 expression promoted apoptosis and repressed cell proliferation, migration, invasion, and metastasis.
An interesting phenomenon observed in this study was that AGR2 KO hampered the migration ability of tumor cells in vitro, but low AGR2 expression instead promoted EMT in human tumor data. Numerous studies show that EMT pertains to the migration and invasion of cancerous cells. Recent studies indicate that AGR2 was responsible for maintaining the epithelial phenotype, thereby interfering with the induction of mesenchymal phenotype cells. 42 , 43 , 44 However, in vitro data reveal that silencing AGR2 strongly reduced the migration ability of tumor cells. 45 , 46 , 47 Thus, we analyzed the mRNA levels of epithelial surface marker (e.g., E‐cadherin) and mesenchymal markers (e.g., N‐cadherin and vimentin), and found that AGR2 knockdown did not affect the expression of E‐cadherin, N‐cadherin, or vimentin. The results suggest that AGR2 was not associated with the EMT phenotype in vitro, which was supported by a previous work. 48 Epithelial–mesenchymal transition is an extremely complex and dynamic process, and EMT induction and post‐EMT maintenance rely on the microenvironment and cytokines. 49 , 50 Although in vitro experiments help us understand the role of AGR2 in tumor, there are certain limitations. Given that constitutive activation of the MEK‐ERK, PI3K‐AKT, and/or PI3K‐AKT‐NF‐κβ pathways plays a key role in promoting the migration and invasion of cancer cells, 51 , 52 , 53 the activity of AKT, IKK, and ERK in breast cancer cells was evaluated. We observed that depletion of AGR2 decreased the activity of AKT, IKK, and ERK in breast cancer cells. Therefore, depletion of AGR2 led to a decrease in the migration ability MDA‐MB‐231 cells due to decreased activity of AKT, IKK, and ERK.
In malignant cells, AGR2 can modulate intercellular communication by coordinating cytokine–chemokine signaling and immune infiltration, affecting the tumor immune microenvironment. Patients with low AGR2 expression could benefit from combination treatment with ICP inhibitor agents and TGF‐β blockers. This study provides a theoretical foundation for developing a strategy for personalized immunotherapy based on AGR2.
AUTHOR CONTRIBUTIONS
F.T. and S.Z. designed the study. Q.L., Y.O., Y.W., and Y.X. performed the bioinformatics analysis and prepared the figures. Y.G., Y.H., and S.Z. participated in data collection and analysis. Q.L., F.T., S.Z., and Y.O. interpreted the results and wrote and revised the manuscript. All authors read and approved the final manuscript.
FUNDING INFORMATION
This work was supported by the Science and Technology Foundation of Guizhou Province (grant nos. [2020]1Z016, [2019]1275, [2021]172, ZK[2021]025, [2021]431, [2020]1Y087, and 19NSP002), the National Natural Science Foundation of China (grant nos. 31860244, 32260234, 32100442, 31960139, and 31760264, and the Excellent Young Talents Plan of Guizhou Medical University (grant no. [2020]105).
CONFLICT OF INTEREST STATEMENT
The authors have no conflict of interest.
ETHICS STATEMENT
Approval of the research protocol by an institutional review board: This protocol was approved by the Ethics Committee of Guizhou Medical University [2022(105)].
Informed consent: Informed consent was obtained from the subject(s) and/or guardian(s).
Registry and registration no. of the study/trial: N/A.
Animal studies: N/A
Supporting information
Figure S1.
Figure S2.
Figure S3.
Table S1.
Table S2.
Table S3.
Supplementary Code S1.
ACKNOWLEDGMENTS
We would like to thank the staff members involved in the The Cancer Genome Atlas Research Network.
Zhang S, Liu Q, Wei Y, et al. Anterior gradient‐2 regulates cell communication by coordinating cytokine–chemokine signaling and immune infiltration in breast cancer. Cancer Sci. 2023;114:2238‐2253. doi: 10.1111/cas.15775
Shichao Zhang and Qin Liu contributed equally to this work and share first authorship.
Contributor Information
Fuzhou Tang, Email: tangfuzhou@163.com.
Yan Ouyang, Email: ouyangyan@gmc.edu.cn.
REFERENCES
- 1. Sung H, Ferlay J, Siegel RL, et al. Global cancer statistics 2020: GLOBOCAN estimates of incidence and mortality worldwide for 36 cancers in 185 countries. CA Cancer J Clin. 2021;71(3):209‐249. [DOI] [PubMed] [Google Scholar]
- 2. Oskarsson T, Batlle E, Massagué J. Metastatic stem cells: sources, niches, and vital pathways. Cell Stem Cell. 2014;14(3):306‐321. [DOI] [PMC free article] [PubMed] [Google Scholar]
- 3. Mates M, Fletcher GG, Freedman OC, et al. Systemic targeted therapy for her2‐positive early female breast cancer: a systematic review of the evidence for the 2014 Cancer Care Ontario systemic therapy guideline. Curr Oncol. 2015;22(1):114‐122. [DOI] [PMC free article] [PubMed] [Google Scholar]
- 4. Demény MA, Virág L. The PARP enzyme family and the hallmarks of cancer part 1: cell intrinsic hallmarks. Cancers (Basel). 2021;13(9):2042. [DOI] [PMC free article] [PubMed] [Google Scholar]
- 5. Roither B, Oostenbrink C, Pfeiler G, Koelbl H, Schreiner W. Pembrolizumab induces an unexpected conformational change in the CC'‐loop of PD‐1. Cancers (Basel). 2020;13(1):5. [DOI] [PMC free article] [PubMed] [Google Scholar]
- 6. Esteva FJ, Hubbard‐Lucey VM, Tang J, Pusztai L. Immunotherapy and targeted therapy combinations in metastatic breast cancer. Lancet Oncol. 2019;20(3):175‐186. [DOI] [PubMed] [Google Scholar]
- 7. Basu A, Ramamoorthi G, Jia Y, et al. Immunotherapy in breast cancer: current status and future directions. Adv Cancer Res. 2019;143:295‐349. [DOI] [PubMed] [Google Scholar]
- 8. Demaree B, Delley CL, Vasudevan HN, et al. Joint profiling of DNA and proteins in single cells to dissect genotype‐phenotype associations in leukemia. Nat Commun. 2021;12(1):1583. [DOI] [PMC free article] [PubMed] [Google Scholar]
- 9. Alsereihi R, Schulten HJ, Bakhashab S, Saini K, Al‐Hejin AM, Hussein D. Leveraging the role of the metastatic associated protein anterior gradient homologue 2 in unfolded protein degradation: a novel therapeutic biomarker for cancer. Cancers (Basel). 2019;11(7):890. [DOI] [PMC free article] [PubMed] [Google Scholar]
- 10. Lee HJ, Hong CY, Jin CJ, et al. Identification of novel HLA‐A*0201‐restricted epitopes from anterior gradient‐2 as a tumor‐associated antigen against colorectal cancer. Cell Mol Immunol. 2012;9(2):175‐183. [DOI] [PMC free article] [PubMed] [Google Scholar]
- 11. Li J, Hu J, Luo Z, et al. AGR2 is controlled by DNMT3a‐centered signaling module and mediates tumor resistance to 5‐Aza in colorectal cancer. Exp Cell Res. 2019;385(1):111644. [DOI] [PubMed] [Google Scholar]
- 12. Chevet E, Fessart D, Delom F, et al. Emerging roles for the pro‐oncogenic anterior gradient‐2 in cancer development. Oncogene. 2013;32(20):2499‐2509. [DOI] [PubMed] [Google Scholar]
- 13. Tian SB, Tao KX, Hu J, et al. The prognostic value of AGR2 expression in solid tumours: a systematic review and meta‐analysis. Sci Rep. 2017;7(1):15500. [DOI] [PMC free article] [PubMed] [Google Scholar]
- 14. Huang J, Wang L, Jiang M, Chen Q, Jiang Z, Feng H. AGR2‐mediated lung adenocarcinoma metastasis novel mechanism network through repression with interferon coupling cytoskeleton to steroid metabolism‐dependent humoral immune response. Cell Immunol. 2014;290(1):102‐106. [DOI] [PubMed] [Google Scholar]
- 15. Wu Z, Li S, Zhu X. The mechanism of stimulating and mobilizing the immune system enhancing the anti‐tumor immunity. Front Immunol. 2021;12:682435. [DOI] [PMC free article] [PubMed] [Google Scholar]
- 16. Quail DF, Joyce JA. Microenvironmental regulation of tumor progression and metastasis. Nat Med. 2013;19(11):1423‐1437. [DOI] [PMC free article] [PubMed] [Google Scholar]
- 17. Wang P, Yuan D, Zhang C, et al. High fibrinogen‐to‐albumin ratio with type 2 diabetes mellitus is associated with poor prognosis in patients undergoing percutaneous coronary intervention: 5‐year findings from a large cohort. Cardiovasc Diabetol. 2022;21(1):46. [DOI] [PMC free article] [PubMed] [Google Scholar]
- 18. Yang W, Soares J, Greninger P, et al. Genomics of drug sensitivity in cancer (GDSC): a resource for therapeutic biomarker discovery in cancer cells. Nucleic Acids Res. 2013;41:955‐961. [DOI] [PMC free article] [PubMed] [Google Scholar]
- 19. Kanehisa M, Goto S. KEGG: Kyoto encyclopedia of genes and genomes. Nucleic Acids Res. 2000;28(1):27‐30. [DOI] [PMC free article] [PubMed] [Google Scholar]
- 20. Liberzon A, Subramanian A, Pinchback R, Thorvaldsdóttir H, Tamayo P, Mesirov JP. Molecular signatures database (MSigDB) 3.0. Bioinformatics. 2011;27(12):1739‐1740. [DOI] [PMC free article] [PubMed] [Google Scholar]
- 21. Charoentong P, Finotello F, Angelova M, et al. Pan‐cancer immunogenomic analyses reveal genotype‐immunophenotype relationships and predictors of response to checkpoint blockade. Cell Rep. 2017;18(1):248‐262. [DOI] [PubMed] [Google Scholar]
- 22. Medrano M, Communal L, Brown KR, et al. Interrogation of functional cell‐surface markers identifies CD151 dependency in high‐grade serous ovarian cancer. Cell Rep. 2017;18(10):2343‐2358. [DOI] [PubMed] [Google Scholar]
- 23. Zhou Y, Yang D, Yang Q, et al. Single‐cell RNA landscape of intratumoral heterogeneity and immunosuppressive microenvironment in advanced osteosarcoma. Nat Commun. 2020;11(1):6322. [DOI] [PMC free article] [PubMed] [Google Scholar]
- 24. He L, Fan Y, Zhang Y, et al. Single‐cell transcriptomic analysis reveals circadian rhythm disruption associated with poor prognosis and drug‐resistance in lung adenocarcinoma. J Pineal Res. 2022;73(1):e12803. [DOI] [PubMed] [Google Scholar]
- 25. Sotiriou C, Wirapati P, Loi S, et al. Gene expression profiling in breast cancer: understanding the molecular basis of histologic grade to improve prognosis. J Natl Cancer Inst. 2006;98(4):262‐272. [DOI] [PubMed] [Google Scholar]
- 26. Efremova M, Vento‐Tormo M, Teichmann SA, Vento‐Tormo R. CellPhoneDB: inferring cell‐cell communication from combined expression of multi‐subunit ligand‐receptor complexes. Nat Protoc. 2020;15(4):1484‐1506. [DOI] [PubMed] [Google Scholar]
- 27. Szklarczyk D, Gable AL, Lyon D, et al. STRING v11: protein‐protein association networks with increased coverage, supporting functional discovery in genome‐wide experimental datasets. Nucleic Acids Res. 2019;47:607‐613. [DOI] [PMC free article] [PubMed] [Google Scholar]
- 28. Jiang P, Zhang Y, Ru B, et al. Systematic investigation of cytokine signaling activity at the tissue and single‐cell levels. Nat Methods. 2021;18(10):1181‐1191. [DOI] [PMC free article] [PubMed] [Google Scholar]
- 29. Zhang B, Wu Q, Li B, Wang D, Wang L, Zhou YL. m6A regulator‐mediated methylation modification patterns and tumor microenvironment infiltration characterization in gastric cancer. Mol Cancer. 2020;19(1):53. [DOI] [PMC free article] [PubMed] [Google Scholar]
- 30. Huang X, Zhang G, Tang T, Liang T. Identification of tumor antigens and immune subtypes of pancreatic adenocarcinoma for mRNA vaccine development. Mol Cancer. 2021;20(1):44. [DOI] [PMC free article] [PubMed] [Google Scholar]
- 31. Bian J, He L, Wu Y, et al. Anterior gradient 2‐derived peptide upregulates major histocompatibility complex class I‐related chains a/B in hepatocellular carcinoma cells. Life Sci. 2020;246:117396. [DOI] [PubMed] [Google Scholar]
- 32. Ma L, Hernandez MO, Zhao Y, et al. Tumor cell biodiversity drives microenvironmental reprogramming in liver cancer. Cancer Cell. 2019;36(4):418‐430. [DOI] [PMC free article] [PubMed] [Google Scholar]
- 33. Wong HS, Chang WC. Single‐cell melanoma transcriptomes depicting functional versatility and clinical implications of STIM1 in the tumor microenvironment. Theranostics. 2021;11(11):5092‐5106. [DOI] [PMC free article] [PubMed] [Google Scholar]
- 34. Villa‐Morales M, Cobos MA, González‐Gugel E, et al. FAS system deregulation in T‐cell lymphoblastic lymphoma. Cell Death Dis. 2014;5(3):e1110. [DOI] [PMC free article] [PubMed] [Google Scholar]
- 35. Zhong H, Liu S, Cao F, et al. Dissecting tumor antigens and immune subtypes of glioma to develop mRNA vaccine. Front Immunol. 2021;12:709986. [DOI] [PMC free article] [PubMed] [Google Scholar]
- 36. Lin H, Wang K, Xiong Y, et al. Identification of tumor antigens and immune subtypes of glioblastoma for mRNA vaccine development. Front Immunol. 2022;13:773264. [DOI] [PMC free article] [PubMed] [Google Scholar]
- 37. Huang X, Tang T, Zhang G, Liang T. Identification of tumor antigens and immune subtypes of cholangiocarcinoma for mRNA vaccine development. Mol Cancer. 2021;20(1):50. [DOI] [PMC free article] [PubMed] [Google Scholar]
- 38. Gonzalez DM, Medici D. Signaling mechanisms of the epithelial‐mesenchymal transition. Sci Signal. 2014;7(344):8. [DOI] [PMC free article] [PubMed] [Google Scholar]
- 39. David CJ, Huang YH, Chen M, et al. TGF‐β tumor suppression through a lethal EMT. Cell. 2016;164(5):1015‐1030. [DOI] [PMC free article] [PubMed] [Google Scholar]
- 40. Peng DH, Rodriguez BL, Diao L, et al. Collagen promotes anti‐PD‐1/PD‐L1 resistance in cancer through LAIR1‐dependent CD8+ T cell exhaustion. Nat Commun. 2020;11(1):4520. [DOI] [PMC free article] [PubMed] [Google Scholar]
- 41. Kumari S, Advani D, Sharma S, Ambasta RK, Kumar P. Combinatorial therapy in tumor microenvironment: where do we stand? Biochim Biophys Acta Rev Cancer. 2021;1876(2):188585. [DOI] [PubMed] [Google Scholar]
- 42. Martisova A, Sommerova L, Krejci A, et al. Identification of AGR2 gene‐specific expression patterns associated with epithelial‐mesenchymal transition. Int J Mol Sci. 2022;23(18):10845. [DOI] [PMC free article] [PubMed] [Google Scholar]
- 43. Sommerova L, Ondrouskova E, Martisova A, Zoumpourlis V, Galtsidis S, Hrstka R. ZEB1/miR‐200c/AGR2: a new regulatory loop modulating the epithelial‐mesenchymal transition in lung adenocarcinomas. Cancers (Basel). 2020;12(6):1614. [DOI] [PMC free article] [PubMed] [Google Scholar]
- 44. Sommerova L, Ondrouskova E, Vojtesek B, Hrstka R. Suppression of AGR2 in a TGF‐β‐induced Smad regulatory pathway mediates epithelial‐mesenchymal transition. BMC Cancer. 2017;17(1):546. [DOI] [PMC free article] [PubMed] [Google Scholar]
- 45. Wang Z, Hao Y, Lowe AW. The adenocarcinoma‐associated antigen, AGR2, promotes tumor growth, cell migration, and cellular transformation. Cancer Res. 2008;68(2):492‐497. [DOI] [PubMed] [Google Scholar]
- 46. Vanderlaag KE, Hudak S, Bald L, et al. Anterior gradient‐2 plays a critical role in breast cancer cell growth and survival by modulating cyclin D1, estrogen receptor‐alpha and survivin. Breast Cancer Res. 2010;12(3):R32. [DOI] [PMC free article] [PubMed] [Google Scholar]
- 47. Park K, Chung YJ, So H, et al. AGR2, a mucinous ovarian cancer marker, promotes cell proliferation and migration. Exp Mol Med. 2011;43(2):91‐100. [DOI] [PMC free article] [PubMed] [Google Scholar]
- 48. Mizuuchi Y, Aishima S, Ohuchida K, et al. Anterior gradient 2 downregulation in a subset of pancreatic ductal adenocarcinoma is a prognostic factor indicative of epithelial‐mesenchymal transition. Lab Invest. 2015;95(2):193‐206. [DOI] [PubMed] [Google Scholar]
- 49. Sullivan NJ, Sasser AK, Axel AE, et al. Interleukin‐6 induces an epithelial‐mesenchymal transition phenotype in human breast cancer cells. Oncogene. 2009;28:2940‐2947. [DOI] [PMC free article] [PubMed] [Google Scholar]
- 50. Scheel C, Eaton EN, Li SH, et al. Paracrine and autocrine signals induce and maintain mesenchymal and stem cell states in the breast. Cell. 2011;145:926‐940. [DOI] [PMC free article] [PubMed] [Google Scholar]
- 51. Nigro E, Imperlini E, Scudiero O, et al. Differentially expressed and activated proteins associated with non small cell lung cancer tissues. Respir Res. 2015;16(1):74. [DOI] [PMC free article] [PubMed] [Google Scholar]
- 52. Li W, Du Q, Li X, et al. Eriodictyol inhibits proliferation, metastasis and induces apoptosis of glioma cells via PI3K/Akt/NF‐κB signaling pathway. Front Pharmacol. 2020;11:114. [DOI] [PMC free article] [PubMed] [Google Scholar]
- 53. Yodkeeree S, Ampasavate C, Sung B, Aggarwal BB, Limtrakul P. Demethoxycurcumin suppresses migration and invasion of MDA‐MB‐231 human breast cancer cell line. Eur J Pharmacol. 2010;627(1–3):8‐15. [DOI] [PubMed] [Google Scholar]
Associated Data
This section collects any data citations, data availability statements, or supplementary materials included in this article.
Supplementary Materials
Figure S1.
Figure S2.
Figure S3.
Table S1.
Table S2.
Table S3.
Supplementary Code S1.