Abstract
Hepatocellular carcinoma (HCC) is one of the most lethal malignancies, whose initiation and development are driven by alterations in driver genes. In this study, we identified four driver genes (TP53, PTEN, CTNNB1, and KRAS) that show a high frequency of somatic mutations or copy number variations (CNVs) in patients with HCC. Four different spontaneous HCC mouse models were constructed to screen for changes in various kinase signaling pathways. The sgTrp53 + sgPten tumor upregulated mTOR and noncanonical nuclear factor‐κB signaling, which was shown to be strongly inhibited by rapamycin (an mTOR inhibitor) in vitro and in vivo. The JAK‐signal transducer and activator of transcription (STAT) signaling was activated in Ctnnb1 mut + sgPten tumor, the proliferation of which was strongly inhibited by napabucasin (a STAT3 inhibitor). Additionally, mTOR, cytoskeleton, and AMPK signaling were upregulated while rapamycin and ezrin inhibitors exerted potent antiproliferative effects in sgPten + Kras G12D tumor. We found that JAK‐STAT, MAPK, and cytoskeleton signaling were activated in sgTrp53 + Kras G12D tumor and the combination of sorafenib and napabucasin led to the complete inhibition of tumor growth in vivo. In patients with HCC who had the same molecular classification as our mouse models, the downstream signaling pathway landscapes associated with genomic alterations were identical. Our research provides novel targeted therapeutic options for the clinical treatment of HCC, based on the presence of specific genetic alterations within the tumor.
Keywords: driver gene, hepatocellular carcinoma, intratumoral heterogeneity, sorafenib resistance, targeted therapy
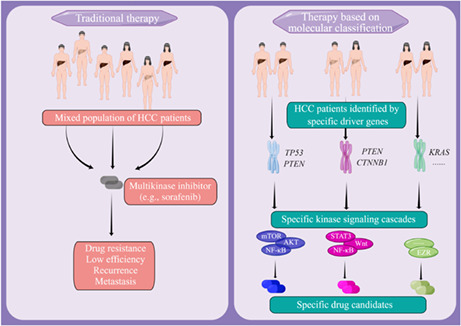
Hepatocellular carcinoma (HCC) is one of the most lethal and fastest growing malignancies worldwide. The authors aimed to investigate the differences between patients with HCC based on tumor molecular classification and provide targeted therapeutic options for them. The authors elucidated the cooperation between certain driver genes that leads to different transcriptomic and proteomic profiles, reflecting the intertumor complexity observed in HCC patients and screened out targeted inhibitors of sorafenib‐resistant tumors with different molecular classifications.
Abbreviations
- AMPK
AMP kinase
- CNV
copy number variation
- CTNNB1
catenin beta 1
- HCC
hepatocellular carcinoma
- OD
optical density
- PTEN
phosphatase and tensin homolog
- STAT
signal transducer and activator of transcription
- VEGFR
vascular endothelial growth factor receptor
- WES
whole‐exome sequencing
1. INTRODUCTION
Hepatocellular carcinoma remains a major global health challenge. 1 , 2 , 3 Several drugs have been approved for the treatment of patients with HCC to date. 4 , 5 However, patient response rates continue to fall below 20%, which can be partially explained by high tumor heterogeneity. 6 The highly heterogeneous pattern of genetic alterations present in tumors is believed to contribute to the high diversity of HCC. 7 , 8 , 9
Molecular classification has provided a basis for the prognosis and treatment of certain types of tumors (e.g., human epidermal growth factor receptor 2 status in breast cancer and epidermal growth factor receptor status in lung cancer). 10 Deep‐sequencing studies have confirmed that TP53 and CTNNB1 are frequently mutated in HCC tumors. 11 , 12 In addition, RAS and mTOR signaling pathways are highly enriched in a considerable number of patients with HCC. 13 Although our understanding of the drivers of the disease has improved, this knowledge is yet to be translated into clinical practice. 14 Indeed, dominant mutational drivers in HCC have yet to be effectively targeted by drugs. 15 It has been recently shown how different combinations of driver genes affect tumor heterogeneity. 16 , 17 Despite this, the question of whether different combinations of mutations affecting driver genes can upregulate specific kinase cascades and provide directions for targeted therapeutic interventions, remains unanswered.
Here, we established four distinct mouse models of HCC, each with mutations affecting two distinct driver genes, and demonstrated that the cooperation between certain driver genes leads to different transcriptomic and proteomic profiles, reflecting the intertumor complexity observed in patients with HCC. Our results provide a targeted therapeutic approach for the treatment of patients with specific molecular subclasses of HCC.
2. MATERIALS AND METHODS
2.1. Human samples
The study was approved by the Ethics Committee of the University of Science and Technology of China (USTCEC201600004). Tissues from patients with liver cancer (n = 6) or benign disorders (hemangioma; n = 1) were collected from the First Affiliated Hospital of Anhui Medical University. Written informed consent was obtained from all patients. The clinical characteristics of all patients are shown in Table S1.
2.2. Mice
Male B6.129S4‐Kras tm4Tyj/JNju (Kras) mice were purchased from the Model Animal Research Center of Nanjing University. Wild‐type mice were purchased from GemPharmatech and the Shanghai SLAC Laboratory Animal Co., Ltd. All experimental procedures involving mice were carried out as prescribed by the National Guidelines for Animal Usage in Research (China) and were approved by the Ethics Committee at the University of Science and Technology of China (reference: USTCACUC1701038).
2.3. Cell line establishment
All the fresh cancer tissues were resected from mouse liver tumor tissues. The tumor tissues were finely chopped with scissors into small fragments and digested using the Tumor Dissociation Kit (Miltenyi Biotec). Next, cell suspensions were filtered using a 70 μm cell strainer. The culture medium was composed of DMEM (Cytiva), supplemented with 10% FBS (Gibco), 100 U/mL penicillin, 100 μg/mL streptomycin (Solarbio), sodium pyruvate, insulin, and transferrin (Procell). All the cell lines were cultured continuously from passage 10 onwards and cells that had undergone 20 or more passages were regarded as cell lines. Any potential mycoplasma contamination was removed using the Mycoplasma Removal Kit (TransGen).
2.4. Plasmids
The pCDH‐CMV‐MCS‐EF1‐copGFP (Addgene, RRID:Addgene_99730) plasmid was used to construct the Lenti‐Ctnnb1 vector. We synthesized a full‐length CTNNB1 gene containing four alanine point mutations, which abolished the phosphorylation of Ser33, Ser37, Thr41, and Ser45 in β‐catenin. 18 sgPten and sgTp53 sequences were inserted into an empty pX330 plasmid using the U6 promoter and the following primers: sgPten‐F: 5′‐CACCGAGATCGTTAGCAGAAACAAA‐3′; sgPten‐R: 5′‐TTTGTTTCTGCTAACGATCTCCAAA‐3′; sgTp53‐F: 5′‐CACCGCCTCGAGCTCCCTCTGAGCC‐3′; and sgTp53‐R: 5′‐GGCTCAGAGGGAGCTCGAGGCCAAA‐3′.
2.5. Hydrodynamic injection
For hydrodynamic liver injection, plasmid DNA suspended in 2 mL saline was injected into the tail vein of 9‐week‐old male B6 mice over a 5–7 s period. The amount of injected DNA was 60 μg for sgPten, 60 μg for sgp53, and 10 μg for Cas9. All mice were dosed with carbon tetrachloride as previously described. 18
2.6. Immunohistochemistry
The mouse tumor tissue was fixed in 4% paraformaldehyde solution overnight and 4 μm tissue sections were obtained for immunohistochemical staining. A list of the Abs used is provided in Table S2.
2.7. Plate colony formation assay
Cells (1 × 10⁶/well) were seeded into 6‐well plates. The cells were incubated at 37°C and 5% CO2 until visible colonies appeared. The colonies were fixed and stained with crystal violet staining solution. Next, the OD value was measured at 562 nm using a microplate reader (Model 680; Bio‐Rad). All of the experiments were repeated three times, and the average values were adopted.
2.8. Impedance‐based label‐free test of toxicity (xCELLigence for cellular proliferation)
All compounds were tested in three independent experiments in quadruplicate using the xCELLigence platform (RTCA; ACEA Biosciences). Data from each well were normalized to the time point just before compound addition using the RTCA software, which generated the normalized cell index.
2.9. Immunoblotting
Lysates of normal liver and tumor tissue were extracted using the Lysis and Extraction Buffer (Thermo Fisher Scientific) supplemented with the Halt Protease Inhibitor Cocktail (Thermo Fisher Scientific) and the phosphodiesterase inhibitor (APExBIO). A list of the Abs used is provided in Table S2.
2.10. Cell proliferation assay
Cells (5000 /well) were seeded into 96‐well plates. Ten microliters of CCK‐8 was added to each well, and the cells were then incubated at 37°C for 45 min. The OD value was measured at 450 nm using a microplate reader (Model 680; Bio‐Rad). All of the experiments were repeated three times, and the average values were adopted. A list of small molecule inhibitors targeting specific kinase signaling cascades is provided in Table S3.
2.11. Whole‐exome sequencing
Fresh tumor or control (adjacent to the tumor tissue) tissue samples were isolated from patients with liver cancer (n = 6) and sequenced using commercial DNA sequencing services (Guangzhou Gene Denovo Biotechnology). Whole‐exome sequencing was carried out using a targeted capture approach with the SureSelect Human All Exon V6 Kit (Agilent Technologies). The captured sequences were further amplified for 150 bp paired‐end sequencing on Illumina X Ten system (Illumina). Tumor and control tissue adjacent to tumor DNA samples had an average sequencing depth of the target exonic region of 100×.The data generated in this study are publicly available through the Sequence Read Archive using the SUB12086982 reference.
2.12. RNA sequencing
Total RNA was extracted from normal liver or tumor tissues by TRIzol reagent (Invitrogen). Samples were library‐prepped and sequenced using Illumina NextSeq (GeneWiz). The data generated in this study are publicly available through the Gene Expression Omnibus using the GSE208279 reference. Gene set enrichment analyses were carried out using the clusterProfiler R package (Guangchuang Yu) version 4.0.4.
2.13. Cancer signaling phosphoprotein profiling using an Ab array
Tissue lysates were applied to the Phospho Explorer Antibody Array, which was designed and manufactured by Full Moon Biosystems. Data were collected and analyzed by Wayen Biotechnologies. The array images were scanned with the SureScan Dx Microarray Scanner at 532 nm and the fluorescence intensity was quantified using GenePix Pro (Axon Instruments) version 6.0 software. The proteome array data are shown in Table S4.
2.14. Statistical analyses
Statistical significance was determined using Prism 9.0 software (GraphPad). Two‐tailed unpaired or paired Student's t‐tests between two groups and two‐way ANOVA across multiple groups were used to determine significance.
3. RESULTS
3.1. Construction of four primary mouse HCC models, guided by driver gene mutation analysis
To identify driver gene alterations in HCC, we analyzed the results of exon sequencing undertaken on 358 samples derived from The Cancer Genome Atlas database. The OncoPrint plots showed that TP53 (31%) was the most frequently mutated gene following by CTNNB1 (26%) (Figure 1A). Regardless of early or advanced liver cancer, TP53 and CTNNB1 have consistently been shown to have the highest mutation frequency. 19 More than 75% of TP53 gene mutations could induce loss‐of‐function effect in HCC. 11 , 20 In our study, we used the inactivation of the p53 protein by CRISPR/Cas9 strategy to simulate tumors. We refer to previous work for further details of model establishment. 18 Missense mutations of CTNNB1 in HCC patients often lead to the aberrant activation of the Wnt/β‐catenin pathway. 21
FIGURE 1.
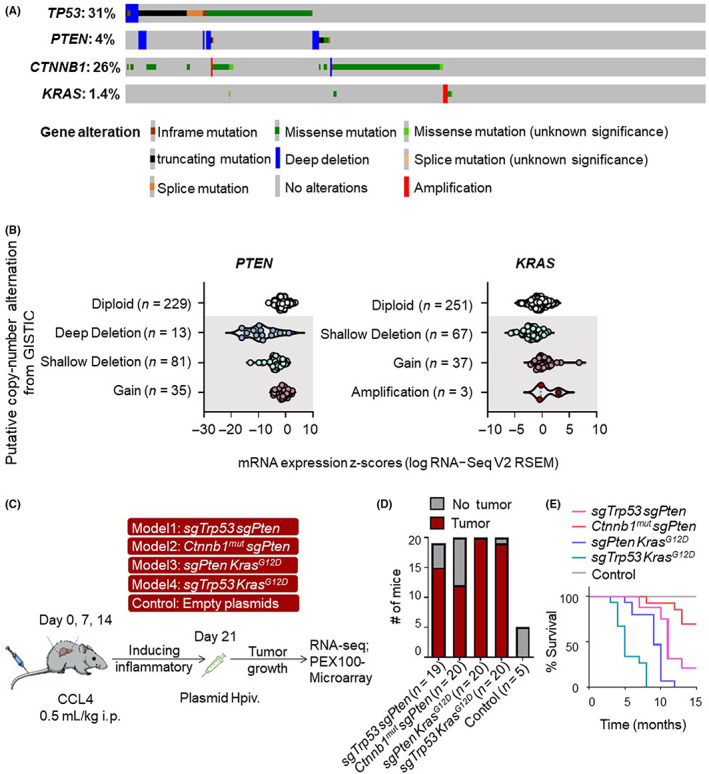
Putative copy number alterations and DNA sequence changes within driver genes in hepatocellular carcinoma (HCC). (A) Distribution of TP53‐, PTEN‐, KRAS‐ and CTNNB1‐specific genomic alterations in The Cancer Genome Atlas HCC database is shown on a cBioPortal OncoPrint plot. (B) Associations between copy number and mRNA expression of PTEN and KRAS are shown in a cBioPortal dot plot. (C) Experimental scheme for the induction of liver tumors into Kras G12D and WT mice with four rounds of carbon tetrachloride (CCl4) treatment followed by plasmid DNA hydrodynamic injection (Hpiv). Empty pX330 plasmid suspended in 2 mL saline was injected into WT mice as a control. (D) Number of mice that developed tumors within 8 months after hydrodynamic injection. (E) Survival graph of the corresponding conditions in tumor‐bearing mice. GISTIC, Genomic Identification of Significant Targets in Cancer; RNA‐seq, RNA sequencing.
We also analyzed the copy numbers of driver genes. We found that 27% of all HCC samples had a PTEN deletion (Figure 1B). The HCC samples with a PTEN deletion showed lower levels of mRNA expression than those that had diploid PTEN. 45 These data indicate that the reduction in PTEN copy number is likely to be one of the main mechanisms that contributed to the downregulation of PTEN in HCC patients. Although the mutation rate of the KRAS gene in liver cancer is only 1.4% (Figure 1A), the frequency of KRAS with DNA copy number gain or amplification (which correlates with increased mRNA expression) in CNV was 11% (Figure 1B). Moreover, the mutation rate of the RAS/RTK signaling pathway where the KRAS gene is located is as high as 22%–37%. 10 In conclusion, we identified four key driver genes commonly found in HCC.
A pan‐cancer analysis of whole genomes found that cancer is frequently driven by multiple oncogenic drivers, while a single gene mutation often fails to cause tumor growth. 22 We further explored the combination of the driver genes mentioned above. However, because mutations in TP53 and CTNNB1 are considered to occur in a mutually exclusive manner 23 and the CTNNB1 + KRAS combination rarely developed tumors at 8 months, in this study, we only focused on the following four driver gene combinations: TP53 + PTEN; CTNNB1 + PTEN; PTEN + KRAS; and TP53 + KRAS. Among these individuals, a significant proportion of the population had dual gene copy number changes (Figure S1A). Each mutation combination accounted for 16%–31% of all the patients with HCC. The types of CNV present in each two gene combinations is presented in a Sankey diagram (Figure S1B).
To elucidate the cooperation between the driver genes and their combined impact on intertumor heterogeneity, we established mouse models based on the hydrodynamic tail‐vein delivery of genetic elements (Figure 1C). Tumor incidence was over 70% within 8 months. (Figure 1D). In subsequent validation studies, we observed the survival curves relating to the four models (Figure 1E). To evaluate the tumor growth within the mouse models, we analyzed liver morphological changes at different time points. Physical images and B‐ultrasound results showed significant growth in the advanced stages of the tumor models (Figure S2A,B).
Immunohistochemical staining of liver sections from sgTrp53 + sgPten, Ctnnb1 mut + sgPten, and sgPten + Kras G12D tumors at an early stage revealed few hepatocytes with negative Pten staining, surrounded by Pten‐positive cells (Figure S2C). Liver specimens taken from all the models showed positive staining for hepatocyte nuclear factor 4α, a hepatocyte marker, and negative staining for cytokeratin 19, a marker of cholangiocyte differentiation (Figure S2D,E). Proliferating cell nuclear antigen staining showed rapid cell proliferation in the advanced tumor tissues of all four mouse models (Figure S2F). Editing of the Trp53 and Pten locus was confirmed by genomic DNA sequencing (Figure S2G). Taken together, these results demonstrate that the genomic and copy numbers of the four driver genes and their combination are essentially ubiquitous in HCC, which led us to construct the four mouse models.
3.2. Cooperation between distinct driver genes activated complex downstream signals
Most often, changes in driver genes lead to the activation of complex multiple tumorigenic signaling pathways. 24 Here, we used RNA and protein microarray techniques to identify the major signaling pathways triggered by different driver gene combinations in our HCC models. Principal component analysis of transcriptomic profiles showed a clear separation between tumors and normal tissues (Figure 2A). A heatmap (Figure S3) and principal component analysis (Figure 2B) of proteomic profiles showed that there were differences in protein phosphorylation levels between the models. Volcano plots were used to exhibit differential gene expression among the HCC models (Figure S4A). Gene set enrichment analysis of RNA sequencing data revealed that our four HCC models were enriched for different pathways (Figure 2C). Phosphoproteome array analysis of the changes in the expression of phosphoproteins was carried out to search for differences between our HCC models, specifically focusing on signaling pathways important for tumorigenesis (Figure 2D). The phosphorylation levels of key molecules in each signaling pathway are shown in the form of volcano plots (Figure S4B). Pathway analysis showed differences in pathway gene expression among different HCC models and normal liver tissues (Figure S4C).
FIGURE 2.
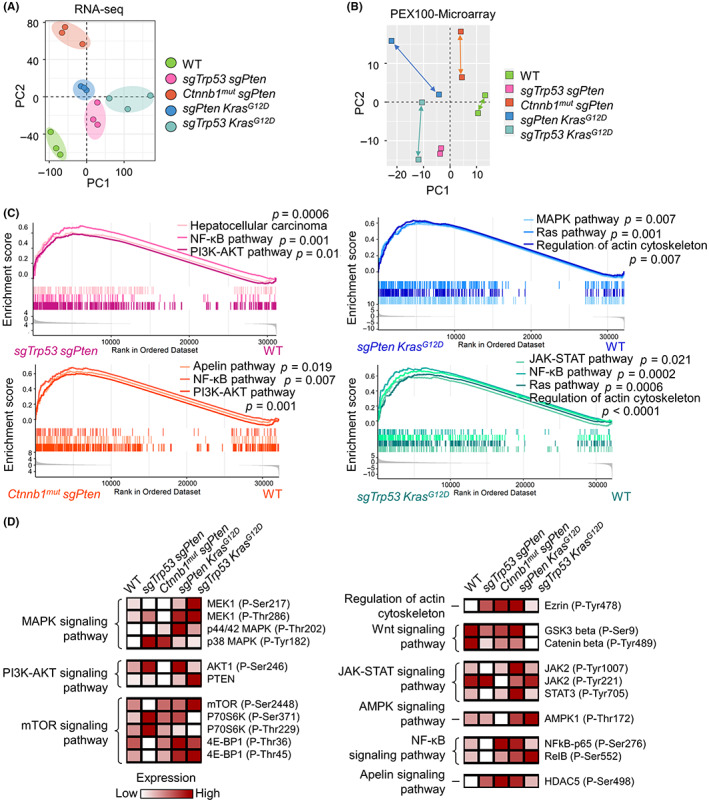
Different hepatocellular carcinoma (HCC) models generate divergent combinations of downstream signaling activation states. (A) Principal component analysis (PCA) of the mRNA expression profiles of normal murine livers (n = 3) and four murine HCC models (n = 3 for each model). (B) PCA of phosphoproteomic profiles of normal murine livers and four murine HCC tissues. (C) Gene set enrichment analysis of differentially expressed mRNAs. (D) Heatmap of the differentially expressed proteins and their phosphorylation levels within normal murine livers and murine HCC tissues. Results standardized by minimum–maximum normalization. GSK3, glycogen synthase kinase 3; HDAC, histone deacetylase; mut, mutant; NF‐κB, nuclear factor‐κB; PTEN, phosphatase and tensin homolog; RNA‐seq, RNA sequencing; STAT3, signal transducer and activator of transcription 3.
To verify the results of RNA sequencing and the protein phosphorylation microarray, we used western blot analyses to directly detect the expression and phosphorylation levels of key molecules in the aforementioned kinase signaling cascades in tumors and normal liver tissues (Figure 3A). The results are summarized in a dendrogram (Figure 3B). These results show that the combination of driver genes with specific genetic alterations differentially promotes liver tumorigenesis.
FIGURE 3.
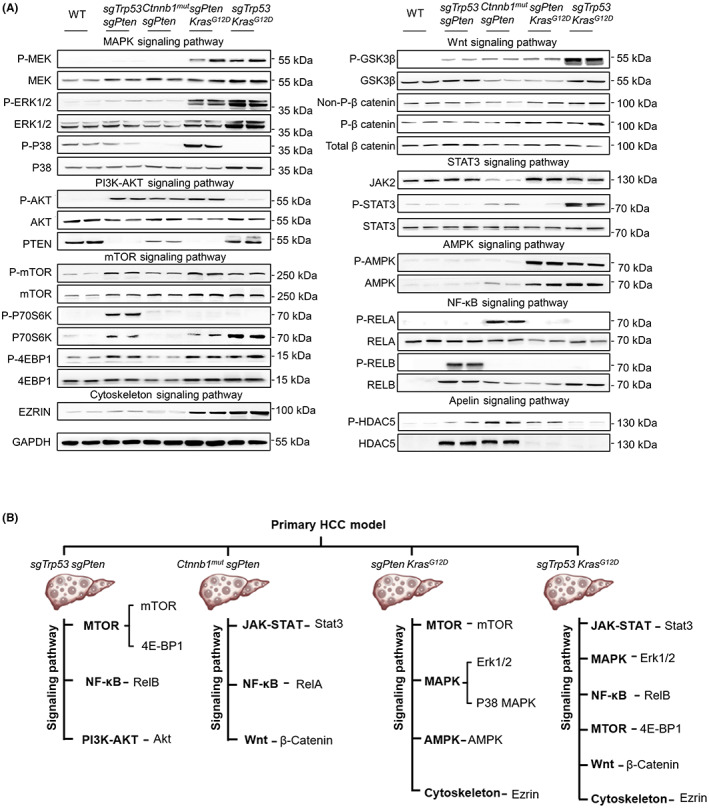
Four typical oncogenic kinase cascades activated in hepatocellular carcinoma (HCC) mouse models. (A) Whole‐tissue lysates from littermate control and advanced murine HCC specimens were analyzed by western blotting using the indicated Abs. GAPDH is shown as a loading control. The experiments were repeated three times. (B) Schematic summary of the protein expression profile for each tumor model. GSK3β, glycogen synthase kinase 3β; HDAC, histone deacetylase; NF‐κB, nuclear factor‐κB; P‐, phosphorylated; PTEN, phosphatase and tensin homolog; STAT3, signal transducer and activator of transcription 3.
3.3. Mouse models mimic the signaling pathway landscape of human subjects with HCC harboring the same mutation type
In the hydrodynamic model, downstream signaling activation states could be influenced by alterations in driver genes. Therefore, we wondered whether there were similarities between the genomic alteration‐associated downstream signaling pathways in our mouse models and in patients with HCC. In order to explore the changes in somatic genomes and the downstream kinase signaling cascades activated by genomic alterations in individuals with HCC, WES was carried out on six paired tumor/normal samples. The number of single nucleotide polymorphism and insertion/deletion variants is shown in Figure 4A. A total of 2443 somatic mutations were identified in the six patients with HCC; their mutational distribution is displayed in Figure 4B. Of these mutations, 1148 were in exonic regions and 1295 were in nonexonic regions. The clinical features of the six individuals with HCC are shown in Figure 4C. The overall number of CNVs was 22,286 and the CNV gain/loss varied considerably from patient to patient (Figure 4D). Frequently mutated genes in the TP53, PTEN, CTNNB1, and RAS pathways were identified by WES (Figure 4C). Patient 1 possessed TP53 and RAS pathway mutations, patient 2 concomitantly harbored PTEN, WNT, and RAS pathway mutations, patients 3 and 4 had TP53 and PTEN pathway mutations, patient 5 had mutations in the WNT and PTEN pathways, and patient 6 had a triple mutation affecting the TP53, PTEN, and RAS pathways.
FIGURE 4.

Similarities between signaling pathways in human hepatocellular carcinoma (HCC) samples and HCC mouse models. (A, D) Number of (A) single nucleotide polymorphism (SNP)–insertion/deletion (indel) mutations and (D) copy number variants (CNVs) in specific genes of each HCC sample. Blue, indel mutation; green, CNV loss; orange, CNV gain; red, SNP mutation. (B) Stacked bar chart showing the percentages of mutation distribution for each HCC sample. (C) Genes that were altered in the HCC samples. Blue, SNP‐indel; dual‐color filled lattice, two types of genetic changes occurring simultaneously; gray, no variation; orange, CNV. Pathways to which each of the genes belong are shown below the heatmap. (E) Lysates of tissues from human HCC samples, tumor‐adjacent (adj) normal liver, and benign tissue specimens (Benign pat) were analyzed by western blotting using the indicated Abs. GSK3β, glycogen synthase kinase 3β; HDAC, histone deacetylase; NF‐κB, nuclear factor‐κB; P‐, phosphorylated; Pat, patient; PTEN, phosphatase and tensin homolog; STAT3, signal transducer and activator of transcription 3.
To determine whether the murine HCC tumors recapitulate downstream signaling activation features that are concordant with those of human HCC tumors, protein phosphorylation levels in the cancer tissues of the six patients with HCC were measured using cancer‐adjacent normal tissues and benign tumor tissues as controls (Figure 4E). Overall, the mouse models of HCC translationally recapitulate the pathways that are found in human subjects with HCCs, thus validating our mouse models for the screening of targeted drugs for the treatment of HCC.
3.4. Inhibitors targeting specific kinase signaling cascades can inhibit tumor cell growth in vitro
To screen for inhibitors against the most important signaling pathways in each model, murine cell lines from tumor‐bearing model mice were first isolated and cultured in vitro. Sorafenib is an oral multikinase inhibitor that inhibits BRAF, CRAF, VEGFR2, VEGFR3, platelet‐derived growth factor receptor β, KIT, and RET. 25 A phase III clinical trial randomizing patients to sorafenib versus placebo showed no benefit in recurrence‐free survival, 26 highlighting the need to identify combination therapies that improve the clinical benefits of the sorafenib‐based treatment of HCC.
Here, we observed the significant activation (phosphorylation) of the downstream targets of sorafenib in the sgTrp53 + sgPten model (Figure 5A). Moreover, the viability of sgTrp53 + sgPten cells decreased significantly with increasing concentrations of sorafenib in vitro. However, the remaining three murine models did not respond well to sorafenib in a plate colony formation assay (Figure 5B).
FIGURE 5.
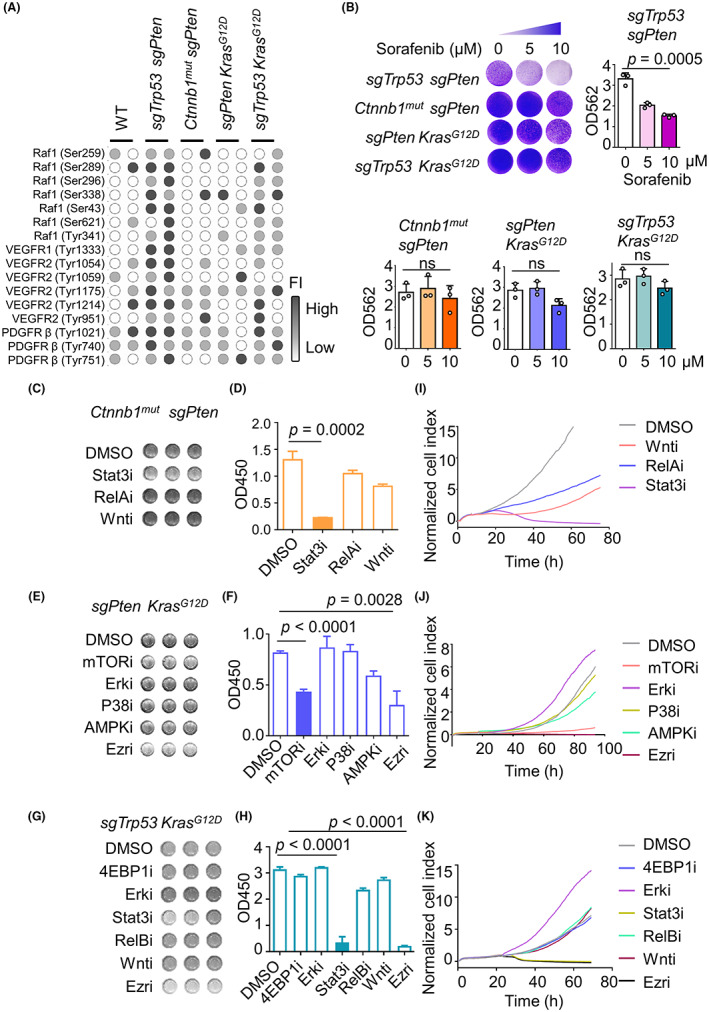
Inhibition of specific kinase signaling cascades can inhibit hepatocellular carcinoma (HCC) tumor cell growth. (A) Heatmap shows the phosphorylation levels of proteins pharmacologically inhibited by sorafenib in normal liver and advanced murine HCC specimens. Results standardized by minimum–maximum normalization. (B) Mouse primary HCC cells are resistant to sorafenib treatment in vitro. Plate colony formation assay results for four mouse primary HCC cell lines. Cells were grown in the absence or presence of sorafenib at the indicated concentrations for 3 days, prior to fixing and staining. (C–K) Cell lines were treated with small molecule inhibitors of specific kinase signaling cascades, as indicated. (C, F, I) Representative CCK‐8 assay, (D, G, J) mean values of quantitative CCK‐8 results, and (E, H, K) RTCA assay of four mouse primary HCC cell lines. Experiments were repeated three times. Ezri, ezrin inhibitor; ns, not significant; OD, optical density; PDGFRβ, platelet‐derived growth factor receptor β; VEGFR, vascular endothelial growth factor receptor.
In order to solve the problem of sorafenib resistance, we undertook inhibition experiments for the remaining three models that did not respond to sorafenib. Targeted inhibitors of kinase cascades were screened out based on our previous results. Treatment with STAT3 inhibitor efficiently inhibited the proliferation of Ctnnb1 mut + sgPten tumor cells (Figure 5C,D). In sgPten + Kras G12D tumor cells, P38 and AMPK inhibitors had little to no effect, while the Erk inhibitor actually facilitated tumor cell growth (Figure 5E,F). This might be because the inhibition of Erk triggers the negative feedback loops of Erk signaling, leading to Erk inhibitor resistance. 27 , 28 Of the various inhibitors tested, the mTOR inhibitor almost completely suppressed sgPten + Kras G12D tumor cell proliferation (Figure 5G,H). The STAT3 inhibitor had a stronger effect on sgTrp53 + Kras G12D tumor cells, while the ezrin inhibition significantly suppressed the growth of sgPten + Kras G12D and sgTrp53 + Kras G12D tumor cells to the same extent. These experiments were further validated using an RTCA migration assay (Figure 5I–K). In summary, we screened out an effective inhibitor for each model by monitoring the downstream signaling pathways activated by each combination of driver genes in vitro.
3.5. In vivo experiments showing how a selection of screened drugs could significantly inhibit HCC tumor growth
It has been reported that combinations of targeted agents are likely to be synergistic. 29 Thus, we implanted tumor cells isolated from the primary mouse models into healthy mice and performed experiments with either a single targeted agent or used it in combination with sorafenib. Generation of subcutaneous tumors using Ctnnb1 mut + sgPten tumor cells proved unsuccessful so we did not use these cells in in vivo assays.
Although the key roles of mTOR in HCC have been reported, 30 the results from clinical trials have remained negative as most of the clinical trials to date have been undertaken on an unselected patient population. Therefore, it is critical to identify biomarkers to allow for the selection of patients with HCC who might benefit from mTOR targeted suppression. 31 Treatment with rapamycin or sorafenib alone resulted in only a slight shrinkage of the sgPten + Kras G12D tumor volume (Figure 6A). The combination of rapamycin and sorafenib, however, resulted in a significant increase in survival of these mice (Figure 6B). In accordance, the subcutaneous tumors were significantly reduced in size when rapamycin and sorafenib were given simultaneously (Figure 6C,D). Our results indicate that the development of liver tumors driven by PTEN and KRAS mutation responded well to a combination of rapamycin and sorafenib.
FIGURE 6.
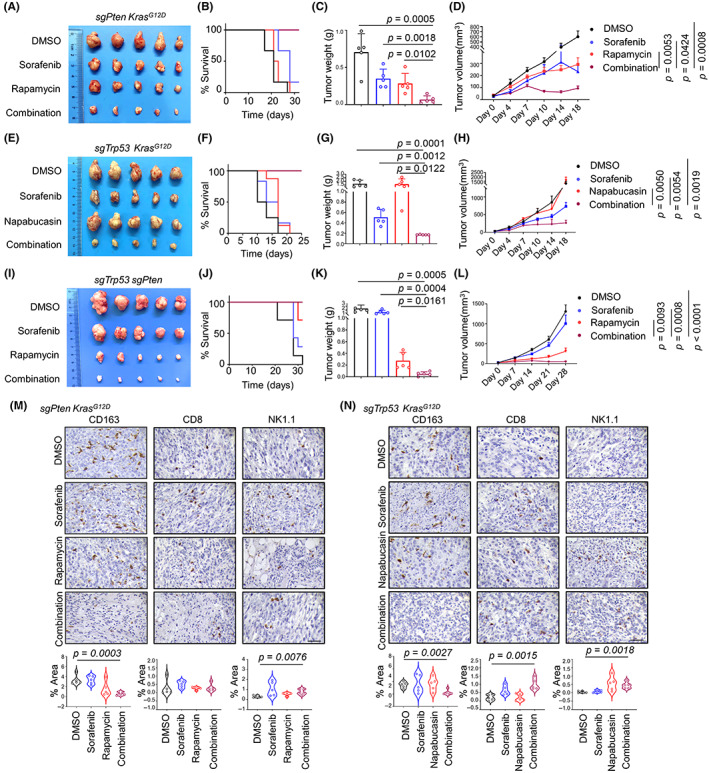
Targeted therapy alters immune infiltration and significantly reduces tumor burden in mice. (A–K) Inhibitors targeting specific signaling pathways in combination with sorafenib significantly suppressed tumor growth in subcutaneous tumor models constructed from mouse primary cell lines. (A, E, I), Representative tumor images, (B, F, J), Kaplan–Meier curves of overall survival, (C, G, K), tumor weight, and (D, H, L) growth curves of each group. Experiments were repeated three times. Scale bar, 1 cm. (M, N) Representative images and quantification for the area of positive CD163, CD8, and NK1.1 staining in subcutaneous tumor models. Scale bar, 50 μm.
Signal transducer and activator of transcription 3 has been reported to be critical in HCC tumorigenesis and postsurgical recurrence. 32 Although the treatment of HCC tumors with napabucasin alone was ineffective (Figure 6E,F), the combination of sorafenib and napabucasin (both STAT3 inhibitors) completely inhibited the growth of subcutaneous tumors in mice injected with sgTrp53 + Kras G12D tumor cells. In comparison, sorafenib treatment alone had little effect on tumor growth (Figure 6G,H).
Although the sgTrp53 + sgPten tumor cells were significantly inhibited by sorafenib in vitro, tumor growth suppression was not as efficient in vivo (Figure 6I). The results relating to the action of sorafenib in vitro and in vivo might be inconsistent because of the complex in vivo tumor microenvironment. Based on our previous findings, we identified that the mTOR signaling pathway was aberrantly activated in sgTrp53 + sgPten tumors (Figure 3A,B). Therefore, we chose to perform in vivo experiments with rapamycin. Our results indicate that the combination of rapamycin and sorafenib significantly increase survival and had a strong oncorepressing activity in sgTrp53 + sgPten tumors in vivo (Figure 6J–L).
It has been reported that the activation of the PI3K/Akt/mTOR signaling pathway promoted glycolytic metabolism in HCC and was related to immunosuppression in this context. 33 We also observed similar results in our in vivo experiments. Immunohistochemistry analyses revealed a decrease in the expression of the immunosuppressive myeloid cell marker CD163 after combination treatment in sgPten + Kras G12D tumors (Figure 6M). An increase in immune infiltration markers (CD8 and NK1.1) and a decrease in CD163+ macrophages were observed after combination treatment in sgTrp53 + Kras G12D tumors (Figure 6N), raising the possibility that this remodeling of the immune landscape could further improve the therapeutic effect of the combination treatment. This observation could be explained by the implication of STAT3 signaling in immunoregulation. 34 It has been reported that the inhibition of STAT3 in HCC can reduce regulatory T cell infiltration and inhibit tumor macrophage differentiation. 35 , 36 Taken together, our results indicate that the combination of sorafenib with other kinase signaling pathway inhibitors might especially benefit patients with specific driver gene combinations (Figure 7).
FIGURE 7.
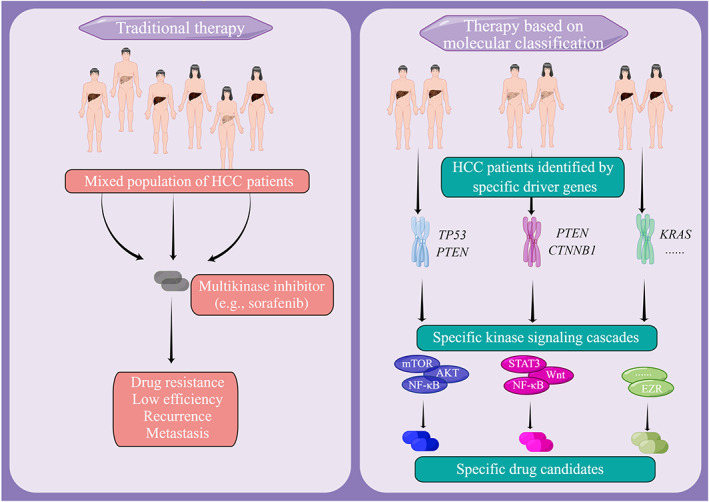
Hepatocellular carcinoma (HCC) is one of the most lethal and fastest growing malignancies worldwide. The authors aimed to investigate the differences between patients with HCC based on tumor molecular classification and provide targeted therapeutic options for them. The authors elucidated the cooperation between certain driver genes that leads to different transcriptomic and proteomic profiles, reflecting the intertumor complexity observed in HCC patients and screened out targeted inhibitors of sorafenib‐resistant tumors with different molecular classifications. EZR, ezrin; HCC, hepatocellular carcinoma; NF‐κB, nuclear factor‐κB; STAT3, signal transducer and activator of transcription 3.
4. DISCUSSION
We have generated four mouse models of HCC to investigate the heterogeneity of HCC tumors and identify targeted therapies for HCC patients with specific molecular subclasses.
So far, no molecular subclass has been reported as responding to a specific targeted therapy in HCC. 37 Such research tells us that the molecular characterization of HCC tumors is urgently needed. 38 , 39 Here, we propose that the construction of mouse models based on the mutation of different driver genes is a promising approach for the preclinical testing of HCC‐specific drug candidates.
Although comprehensive transcriptomic data have provided valuable information to guide tumor prediction and treatment selection, this method has limitations (e.g., mRNA expression does not reflect the true protein expression, the regulatory processes, or posttranscriptional modifications). 40 , 41 Proteomics could help us to identify clinically meaningful new treatments, particularly when applied to heterogeneous and genomically complex cancers like HCC. Therefore, our study focused more on evaluating protein rather than mRNA expression. We found that different combinations of genetic alterations contributed uniquely to tumorigenic protein kinase signaling cascades and HCC progression. These alterations affected not only the mutated genes but also their downstream signaling pathways. The sgTrp53 + sgPten tumor upregulated mTOR and noncanonical nuclear factor‐κB signaling, Ctnnb1 mut + sgPten tumor upregulated JAK‐STAT signaling, sgPten + Kras G12D tumor upregulated mTOR, cytoskeleton, and AMPK signaling, and sgTrp53 + Kras G12D tumor upregulated JAK‐STAT, MAPK, and cytoskeleton pathways. Importantly, we identified the signaling pathway that most strongly inhibited tumor growth in each model. Such information could guide the development of future precision therapies for specific groups of HCC patients.
Ezrin is a critical structural protein involved in stabilizing membrane receptor complexes. 42 , 43 , 44 Ezrin is highly expressed and reflects an unfavorable prognosis in a number of tumors. 45 , 46 , 47 Our research has shown that NSC305787 inhibits the phosphorylation of ezrin‐T567, resulting in a marked reduction in cell growth (Figure 5F–K). However, we noted a failure of the ezrin inhibitor to inhibit subcutaneous tumors in mice (data not shown). The failure could be explained by drug metabolism or solubility. Nevertheless, our research into ezrin inhibitions has revealed a novel promising target for HCC tumor development and progression.
Taken together, our models represent an approach towards HCC treatment, whereby we dissect the regulatory mechanisms linking different driver genes and target the complex downstream networks to develop potent personalized therapies.
AUTHOR CONTRIBUTIONS
S.Y.Q. designed and performed the experiments and analyzed and interpreted the data. Z.X.H. and Q.Y.B. helped to design the experiments and analyze the data. L.M.T. and N.Z.G. helped to perform the experiments. Z.Y.G. and F.B.Q. contributed to the imaging analysis and interpreted the data. C.Q.W. collected tissue samples and information from patients. S.R. established techniques of immunohistochemistry. T.Z.G. provided strategic planning, conceived the project, and interpreted some data. W.H.M. supervised the project, provided crucial ideas, and assisted with data interpretation. S.Y.Q. wrote the manuscript with W.H.M. All authors read and approved the final manuscript.
FUNDING INFORMATION
This work was supported by the Chinese Academy of Medical Sciences (#2019‐I2M‐5‐073).
CONFLICT OF INTEREST STATEMENT
The authors declare no conflict of interest.
ETHICS STATEMENTS
Approval of the research protocol by an Institutional Review Board: All human tissues used in the present study were obtained under the approval of the Ethics Committee of the University of Science and Technology of China (USTCEC201600004).
Informed consent: N/A.
Registry and the registration no. of the study/trial: N/A.
Animal studies: All experimental procedures involving mice were carried out as prescribed by the National Guidelines for Animal Usage in Research (China) and were approved by the Ethics Committee at the University of Science and Technology of China (reference: USTCACUC1701038).
Supporting information
Figure S1.
Figure S2.
Figure S3.
Figure S4.
Table S1.
Table S2.
Table S3.
Table S4.
List of Supporting Information‐revised
Supplementary figure legends‐final
Acknowledgements
We wish to thank all the patients, healthy donors and doctors for their participation in this study.
Shen Y, Zheng X, Qian Y, et al. Interactions between driver genes shape the signaling pathway landscape and direct hepatocellular carcinoma therapy. Cancer Sci. 2023;114:2386‐2399. doi: 10.1111/cas.15788
Contributor Information
Rui Sun, Email: sunr@ustc.edu.cn.
Zhigang Tian, Email: tzg@ustc.edu.cn.
Haiming Wei, Email: ustcwhm@ustc.edu.cn.
REFERENCES
- 1. Zhang Y, Zhang L, Li R, et al. Genetic variations in cancer‐related significantly mutated genes and lung cancer susceptibility. Ann Oncol. 2017;28(7):1625‐1630. [DOI] [PMC free article] [PubMed] [Google Scholar]
- 2. Pfister D, Nunez NG, Pinyol R, et al. NASH limits anti‐tumour surveillance in immunotherapy‐treated HCC. Nature. 2021;592(7854):450‐456. [DOI] [PMC free article] [PubMed] [Google Scholar]
- 3. Hamdane N, Juhling F, Crouchet E, et al. HCV‐induced epigenetic changes associated with liver cancer risk persist after sustained virologic response. Gastroenterology. 2019;156(8):2313‐2329. [DOI] [PMC free article] [PubMed] [Google Scholar]
- 4. Rahib L, Smith BD, Aizenberg R, Rosenzweig AB, Fleshman JM, Matrisian LM. Projecting cancer incidence and deaths to 2030: the unexpected burden of thyroid, liver, and pancreas cancers in the United States. Cancer Res. 2014;74(11):2913‐2921. [DOI] [PubMed] [Google Scholar]
- 5. Takeda H, Takai A, Iguchi E, et al. Oncogenic transcriptomic profile is sustained in the liver after the eradication of the hepatitis C virus. Carcinogenesis. 2021;42(5):672‐684. [DOI] [PubMed] [Google Scholar]
- 6. Schulze K, Imbeaud S, Letouze E, et al. Exome sequencing of hepatocellular carcinomas identifies new mutational signatures and potential therapeutic targets. Nat Genet. 2015;47(5):505‐511. [DOI] [PMC free article] [PubMed] [Google Scholar]
- 7. Guichard C, Amaddeo G, Imbeaud S, et al. Integrated analysis of somatic mutations and focal copy‐number changes identifies key genes and pathways in hepatocellular carcinoma. Nat Genet. 2012;44(6):694‐698. [DOI] [PMC free article] [PubMed] [Google Scholar]
- 8. Soneson C, Love MI, Robinson MD. Differential analyses for RNA‐seq: transcript‐level estimates improve gene‐level inferences. F1000Res. 2015;4:1521. [DOI] [PMC free article] [PubMed] [Google Scholar]
- 9. Durinck S, Moreau Y, Kasprzyk A, et al. BioMart and Bioconductor: a powerful link between biological databases and microarray data analysis. Bioinformatics. 2005;21(16):3439‐3440. [DOI] [PubMed] [Google Scholar]
- 10. Molina‐Sanchez P, Ruiz de Galarreta M, Yao MA, et al. Cooperation between distinct cancer driver genes underlies Intertumor heterogeneity in hepatocellular carcinoma. Gastroenterology. 2020;159(6):2203‐2220. [DOI] [PMC free article] [PubMed] [Google Scholar]
- 11. Cancer Genome Atlas Research Network . Electronic address wbe, cancer genome atlas research N. comprehensive and integrative genomic characterization of hepatocellular carcinoma. Cell. 2017;169(7):1327‐1341. [DOI] [PMC free article] [PubMed] [Google Scholar]
- 12. Villanueva A, Llovet JM. Liver cancer in 2013: mutational landscape of HCC–the end of the beginning. Nat Rev Clin Oncol. 2014;11(2):73‐74. [DOI] [PubMed] [Google Scholar]
- 13. Chiang DY, Villanueva A, Hoshida Y, et al. Focal gains of VEGFA and molecular classification of hepatocellular carcinoma. Cancer Res. 2008;68(16):6779‐6788. [DOI] [PMC free article] [PubMed] [Google Scholar]
- 14. Llovet JM, Kelley RK, Villanueva A, et al. Hepatocellular carcinoma. Nat Rev Dis Primers. 2021;7(1):6. [DOI] [PubMed] [Google Scholar]
- 15. Patro R, Duggal G, Love MI, Irizarry RA, Kingsford C. Salmon provides fast and bias‐aware quantification of transcript expression. Nat Methods. 2017;14(4):417‐419. [DOI] [PMC free article] [PubMed] [Google Scholar]
- 16. Llovet JM, Hernandez‐Gea V. Hepatocellular carcinoma: reasons for phase III failure and novel perspectives on trial design. Clin Cancer Res. 2014;20(8):2072‐2079. [DOI] [PubMed] [Google Scholar]
- 17. Tang M, Zhao Y, Zhao J, et al. Liver cancer heterogeneity modeled by in situ genome editing of hepatocytes. Sci Adv. 2022;8(25):eabn5683. [DOI] [PMC free article] [PubMed] [Google Scholar]
- 18. Xue W, Chen S, Yin H, et al. CRISPR‐mediated direct mutation of cancer genes in the mouse liver. Nature. 2014;514(7522):380‐384. [DOI] [PMC free article] [PubMed] [Google Scholar]
- 19. von Felden J, Craig AJ, Garcia‐Lezana T, et al. Mutations in circulating tumor DNA predict primary resistance to systemic therapies in advanced hepatocellular carcinoma. Oncogene. 2021;40(1):140‐151. [DOI] [PubMed] [Google Scholar]
- 20. Kato S, Han SY, Liu W, et al. Understanding the function‐structure and function‐mutation relationships of p53 tumor suppressor protein by high‐resolution missense mutation analysis. Proc Natl Acad Sci U S A. 2003;100(14):8424‐8429. [DOI] [PMC free article] [PubMed] [Google Scholar]
- 21. Kuechler A, Willemsen MH, Albrecht B, et al. De novo mutations in beta‐catenin (CTNNB1) appear to be a frequent cause of intellectual disability: expanding the mutational and clinical spectrum. Hum Genet. 2015;134(1):97‐109. [DOI] [PubMed] [Google Scholar]
- 22. Consortium ITP‐CAoWG . Pan‐cancer analysis of whole genomes. Nature. 2020;578(7793):82‐93. [DOI] [PMC free article] [PubMed] [Google Scholar]
- 23. Laurent‐Puig P, Legoix P, Bluteau O, et al. Genetic alterations associated with hepatocellular carcinomas define distinct pathways of hepatocarcinogenesis. Gastroenterology. 2001;120(7):1763‐1773. [DOI] [PubMed] [Google Scholar]
- 24. Huang L, Garrett Injac S, Cui K, et al. Systems biology‐based drug repositioning identifies digoxin as a potential therapy for groups 3 and 4 medulloblastoma. Sci Transl Med. 2018;10(464):eaat0150. [DOI] [PMC free article] [PubMed] [Google Scholar]
- 25. Keating GM, Santoro A. Sorafenib: a review of its use in advanced hepatocellular carcinoma. Drugs. 2009;69(2):223‐240. [DOI] [PubMed] [Google Scholar]
- 26. Bruix J, Takayama T, Mazzaferro V, et al. Adjuvant sorafenib for hepatocellular carcinoma after resection or ablation (STORM): a phase 3, randomised, double‐blind, placebo‐controlled trial. Lancet Oncol. 2015;16(13):1344‐1354. [DOI] [PubMed] [Google Scholar]
- 27. Jin H, Shi Y, Lv Y, et al. EGFR activation limits the response of liver cancer to lenvatinib. Nature. 2021;595(7869):730‐734. [DOI] [PubMed] [Google Scholar]
- 28. Lito P, Pratilas CA, Joseph EW, et al. Relief of profound feedback inhibition of mitogenic signaling by RAF inhibitors attenuates their activity in BRAFV600E melanomas. Cancer Cell. 2012;22(5):668‐682. [DOI] [PMC free article] [PubMed] [Google Scholar]
- 29. Jaaks P, Coker EA, Vis DJ, et al. Effective drug combinations in breast, colon and pancreatic cancer cells. Nature. 2022;603(7899):166‐173. [DOI] [PMC free article] [PubMed] [Google Scholar]
- 30. Matter MS, Decaens T, Andersen JB, Thorgeirsson SS. Targeting the mTOR pathway in hepatocellular carcinoma: current state and future trends. J Hepatol. 2014;60(4):855‐865. [DOI] [PMC free article] [PubMed] [Google Scholar]
- 31. Lu X, Paliogiannis P, Calvisi DF, Chen X. Role of the mammalian target of rapamycin pathway in liver cancer: from molecular genetics to targeted therapies. Hepatology. 2021;73(Suppl 1):49‐61. [DOI] [PMC free article] [PubMed] [Google Scholar]
- 32. Wang D, Zheng X, Fu B, et al. Hepatectomy promotes recurrence of liver cancer by enhancing IL‐11‐STAT3 signaling. EBioMedicine. 2019;46:119‐132. [DOI] [PMC free article] [PubMed] [Google Scholar]
- 33. Li X, Zhang Y, Ma W, et al. Enhanced glucose metabolism mediated by CD147 contributes to immunosuppression in hepatocellular carcinoma. Cancer Immunol Immunother. 2020;69(4):535‐548. [DOI] [PMC free article] [PubMed] [Google Scholar]
- 34. Yin Z, Ma T, Lin Y, et al. IL‐6/STAT3 pathway intermediates M1/M2 macrophage polarization during the development of hepatocellular carcinoma. J Cell Biochem. 2018;119(11):9419‐9432. [DOI] [PubMed] [Google Scholar]
- 35. Zhou YF, Song SS, Tian MX, et al. Cystathionine beta‐synthase mediated PRRX2/IL‐6/STAT3 inactivation suppresses Tregs infiltration and induces apoptosis to inhibit HCC carcinogenesis. J Immunother Cancer. 2021;9(8):e003031. [DOI] [PMC free article] [PubMed] [Google Scholar]
- 36. Hou PP, Luo LJ, Chen HZ, et al. Ectosomal PKM2 promotes HCC by inducing macrophage differentiation and remodeling the tumor microenvironment. Mol Cell. 2020;78(6):1192‐1206. [DOI] [PubMed] [Google Scholar]
- 37. European Association For The Study Of The Liver , European Organisation For Research And Treatment Of Cancer . EASL‐EORTC clinical practice guidelines: management of hepatocellular carcinoma. J Hepatol. 2012;56(4):908‐943. [DOI] [PubMed] [Google Scholar]
- 38. European Association for the Study of the Liver . EASL clinical practice guidelines: management of hepatocellular carcinoma. J Hepatol. 2018;69(1):182‐236. [DOI] [PubMed] [Google Scholar]
- 39. Marrero JA, Kulik LM, Sirlin CB, et al. Diagnosis, staging, and Management of Hepatocellular Carcinoma: 2018 practice guidance by the American Association for the Study of Liver Diseases. Hepatology. 2018;68(2):723‐750. [DOI] [PubMed] [Google Scholar]
- 40. Evans TG. Considerations for the use of transcriptomics in identifying the ‘genes that matter’ for environmental adaptation. J Exp Biol. 2015;218(Pt 12):1925‐1935. [DOI] [PubMed] [Google Scholar]
- 41. Xu Y, Poggio M, Jin HY, et al. Translation control of the immune checkpoint in cancer and its therapeutic targeting. Nat Med. 2019;25(2):301‐311. [DOI] [PMC free article] [PubMed] [Google Scholar]
- 42. Yin LM, Duan TT, Ulloa L, Yang YQ. Ezrin orchestrates signal transduction in airway cells. Rev Physiol Biochem Pharmacol. 2018;174:1‐23. [DOI] [PMC free article] [PubMed] [Google Scholar]
- 43. Neisch AL, Fehon RG. Ezrin, radixin and Moesin: key regulators of membrane‐cortex interactions and signaling. Curr Opin Cell Biol. 2011;23(4):377‐382. [DOI] [PMC free article] [PubMed] [Google Scholar]
- 44. Fehon RG, McClatchey AI, Bretscher A. Organizing the cell cortex: the role of ERM proteins. Nat Rev Mol Cell Biol. 2010;11(4):276‐287. [DOI] [PMC free article] [PubMed] [Google Scholar]
- 45. Lipreri da Silva JC, Carvalho MFL, de Miranda LBL, de Almeida BO, Lima K, Machado‐Neto JA. NSC305787, a pharmacological ezrin inhibitor, exhibits antineoplastic activity in pancreatic cancer cells. Invest New Drugs. 2022;40:728‐737. [DOI] [PubMed] [Google Scholar]
- 46. Lipreri da Silva JC, Coelho‐Silva JL, Lima K, et al. Comprehensive analysis of cytoskeleton regulatory genes identifies ezrin as a prognostic marker and molecular target in acute myeloid leukemia. Cell Oncol (Dordr). 2021;44(5):1105‐1117. [DOI] [PubMed] [Google Scholar]
- 47. Chen C, Ye C, Xia J, Zhou Y, Wu R. Ezrin T567 phosphorylation regulates migration and invasion of ectopic endometrial stromal cells by changing Actin cytoskeleton. Life Sci. 2020;254:117681. [DOI] [PubMed] [Google Scholar]
Associated Data
This section collects any data citations, data availability statements, or supplementary materials included in this article.
Supplementary Materials
Figure S1.
Figure S2.
Figure S3.
Figure S4.
Table S1.
Table S2.
Table S3.
Table S4.
List of Supporting Information‐revised
Supplementary figure legends‐final


