Abstract
Extracellular vesicles (EVs) bearing biomolecules from parental cells can represent a novel source of disease biomarkers and are under intensive study for their clinical potential. Tunable resistive pulse sensing (TRPS) quantifies the magnitude of a small ionic resistive pulse current to determine the size, concentration, and zeta potential of EVs. Environmental noise is a common limiting factor that affects the precision of sensing devices. TRPS is particularly vulnerable to environmental noise, including both mechanical and electrical. The upper detection limit of the TRPS relies on the physical size of the elastomeric tunable nanopore. The lower limit relies on the electrical signal-to-noise ratio. Guided by simulation, we designed an external device to suppress environmental noise for TRPS measurement. Both mechanical and electrical environmental noise reductions were observed after using the shield. The study also validated the noise reduction function of the shield by quantifying EVs from different cell origins. Detection of EVs smaller than 200 nm was improved by using the shield; which was reported challenging for conventional quantification methods. The study highlighted a feasible approach to solve environmental noise challenges for TRPS based EV quantification.
Keywords: Tunable resistive pulse sensing, Extracellular vesicles, Nanopore, Translocation, Events, Ionic current, Signal to noise ratio
1. Introduction
Particle size determination is essential for the investigation of bio-molecular analytes.[1] There are bioparticles in biological fluids that influence physiological function and can serve as biomarkers for disease. Cells encapsulate intracellular biomolecules into vesicles and release them to the extracellular environment. The term extracellular vesicle (EV) is typically used as a generic reference to all types of secreted vesicles. With a phospholipid bilayer closure, the diameter of EVs range between 50 nm and 5 μm.[2] EVs involved in exocytosis have many potentials for translational applications as biomarkers and drug delivery vehicles.[3] Understanding the colloidal properties of EVs is crucial for effectively using EVs for clinical applications such as diagnostics, therapeutics, and devices.[4] EVs containing proteins, nucleic acids, and lipids have seen an exponential increase in their use in biomarker discovery.
There are different methods for the quantification of EVs, such as nanoparticle tracking analyses[5], flow cytometry[6], ELISA[7], electrochemical detection, microfluidics[8,9], and dynamic light scattering [10] Tunable.
(TRPS) is one method that quantifies small ionic resistive pulse current to determine the size, concentration, and zeta potential of EVs. [11] The Izon qNano system from Izon sciences (Oxford, UK) uses TRPS to determine the size of nanoparticles with a diameter ranging between approximately 50 nm to 10 μm [12]. Size and quantification of biological colloidal particles is determined using polyurethane nanopores for sensing.[13] In the field of biosensing, elastic size-tunable pores are relatively new and are fabricated by puncturing an elastic polyurethane membrane using a micron-sized tungsten needle [14].
TRPS technology applies a trans-membrane DC voltage to drive electrophoresis.[15] Applying a voltage across the membrane causes ions to drive through the nanopore and establish an ionic baseline current across the nanopore (schemed in Fig. 1). When a target particle moves through a nanopore, it blocks the path of ions flow. The blockade causes a dip in the magnitude of ionic baseline current and is revealed as a small resistive pulse current. This blockade current is very important to sense and characterize the analyte of interest. The lower limit detection of the nanopore is determined by the smallest particle size that can produce detectable blockade current compared to the background noise current [14].
Fig. 1.
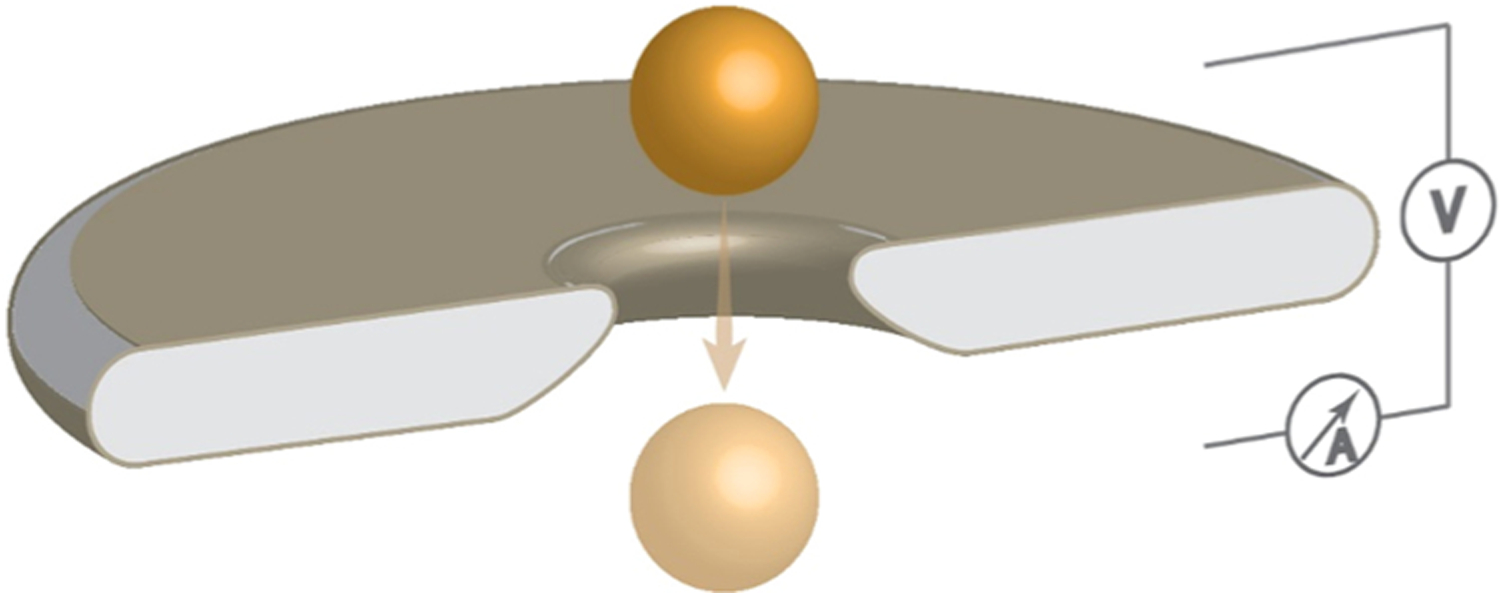
Schematic diagram of the TRPS nanopore setup.
TRPS technology is an emerging technology for EV quantification and can be used in parallel with dynamic light scattering (DLS), particle tracking analysis, scanning electron microscopy, and transmission electron microscopy.[12,16] However, these methods all have their limitations. Quantification of EVs is challenging because the sizes of many vesicles are less than 100 nm, heterogeneous in size and composition, and their refractive indexes are low.[18,19] Light scattering detection relies on a high reflective index of scattered light and monodisperse distribution of vesicles.[20,21] Flow cytometry is applicable for high throughput EV detection, but the weak scattered light from EVs with sizes less than 100 nm makes accurate quantification challenging. [22] DLS method, based on the Brownian motion of vesicles, is more applicable to vesicles of similar size, but limited to monodisperse distribution.
Although EVs have clinical potential as biomarkers in early disease diagnosis and prognosis, lacking a sensitive analytical system for EV analysis created barriers for clinical translation. Quantification methods such as electrochemical, fluorescence, and microfluidic have been introduced to improve sensitivity. [23,24] The TRPS method provides improved sensitivity and high-resolution, but faces challenges related to the lower size range.[12] Several studies have revealed that fluctuating noise levels in the TRPS system cause the quantification of smaller EVs to be cut off near the noise level.[25] Although challenging, TRPS is expected to evolve with its potential to study complex conditions with biological fluids [12].
Practical challenges that need to be addressed for nanopore-based sensors include noise, repeatability in detecting signals, controllability, and large-scale fabrication.[26] Nanopore-based TRPS technology allows pore size variation by applying a macroscopic axial stretching force to the elastic membrane. Thus increasing sensitivity for a broader range of particle size quantification. Nanoparticle quantification using the TRPS method is subjected to ionic current fluctuations (noise). Past studies have mainly addressed the ionic noise presence by comparing pH values, coating the nanopore to increase translocation speed, changing nanopore composition, using a CMOS preampliflyer, and post measurement signal processing.[27–32] However, environmental mechanical noise was not addressed in these studies and can cause variation in the quantification of smaller particles close to the lower pulse limit. The qNano device’s TRPS method has a lower pulse limit of 0.05 nA. This environmental noise interferes with the magnitude of the baseline current, resulting in a deviation of the relative blockade magnitude (ratio of blockade magnitude to baseline current). The applied electric field also affects this ratio. Other parameters that affect the sensitivity of the measuring device are applied bias voltage and the size of the nanopore. System optimization for precise quantification requires adjusting voltage across the nanopore, selecting the appropriate nanopore size for the target nanoparticle size, and controlling pore size by adjusting the strain. Finding a consistent noise reduction strategy is the challenging part of using TRPS for the quantification of EVs. The noise current across the nanopore follows a Gaussian distribution and is defined as the root mean square (RMS) of the trans-membrane current. The RMS value is calculated as the standard deviation of all current points over the intervals of 100 ms.[33] Noise in the time domain mathematically can be calculated using the formula,
| (1) |
Where ΔI(t) indicates the fluctuation of a small ionic current that deviates from its mean value.[34,35] Signal to noise ratio (SNR) can be evaluated as,
| (2) |
where ΔIionic stands for the signal current amplitude and Irms indicates the magnitude of noise.[36] The nanopore sensing method is very sensitive, and therefore the influence of external noise on the sensor’s response cannot be ignored.[37] The detectable size range and sensitivity rely on the particle to pore size ratio, amplitude of small ionic resistive pulse signal compared to the magnitude of noise, and off-axial translocation events. The device often fails to sample data when fast translocation events occur. This leads to sensitivity decreasing due to the resistive pulse signal being cut off. The resolution of the nanopore sensor can be enhanced either by slowing the particle translocation or by increasing the data acquisition frequency of the measurement system. Enhancement in temporal resolution is closely related to the reduction in electrical noise in nanopore devices. The upper detection limit relies on the physical size of the pore, and the lower limit relies on the electrical SNR.[38] To solve the environmental noise challenge, a simulation-guided enclosure was designed. The external shielding device reduces external noise using a metamaterial shielding enclosure. Three different shielded enclosure models were proposed to reduce external noise. Based on the simulation result, model two shielding cage’s performance was found to be the most efficient. In addition, a spectrum analyzer was used to analyze electromagnetic interference inside and outside the shielding cage. To evaluate the effect of shielding the TRPS system on the lower detection limit, size quantification was performed under shielded and unshielded conditions. The minimum size detection limit has shown improvement in quantification while shielded.
2. Materials and methods
2.1. Simulation and assembly of the shielding enclosure
Electromagnetic interference and mechanical vibrations are external noise sources that affect quantification while using the TRPS method. Acoustic insulation was the strategy chosen to reduce noise coming from vibration. Also, an aluminum sheet was used to laminate the internal structure of the shielded cage to give the enclosure a Faraday cage feature that can reduce electromagnetic interference. The selected shielded cage was built to reduce external noise using furring stripboard, acoustic foam soundproofing, tempered hardboard, black foam boards, and aluminum sheet. Acoustic metamaterial has been used to reduce acoustic noise.[39] To reduce low frequency noise in this study, three different foam resonator patterns, for the metasurface of the shielded enclosure, were designed.[40] From the three different proposed acoustic foam resonator structures models, model two was chosen based on simulation results.
Literature reports have shown that system noise in the TRPS at the trans-membrane current noise appeared to follow a Gaussian distribution.[33,41] For this Gaussian noise, flow simulation tools were used to simulate the effect of shielding on the TRPS system. Three different panel structure designs were proposed for sound absorption capability and acoustical performances to reduce acoustic noise. The designed acoustic metasurface consists of an array of multiple absorption unit cells. The simulation was conducted using the flow simulation package of SolidWorks 2020, which enabled the prediction of broadband noise. The sound-absorbing acoustic performance of the acoustic foam metasurface was simulated using acoustic polyurethane conglomerate metamaterial. In the simulation, 30-unit cells were selected to evaluate the acoustic power level of polyurethane metasurface under the shielded condition. The unshielded condition was simulated by removing the front panel.
2.2. Electromagnetic and acoustic noise evaluation
To evaluate electromagnetic interference, Agilent technologies E4407B ESA-E series spectrum analyzer was used to measure power spectral density (PSD) within the shielded and unshielded conditions. Electrical and magnetic probes were connected to the spectrum analyzer in the PSD measurement, and measurement data was recorded. A noise level meter that could display noise data was used to record acoustic noise. Input transducer in the microphone converted environmental noise data to an electrical signal. After recording the noise data, MAT-LAB was used to obtain amplitude impulse response over time and spectrum level over frequency.
2.3. Preparation of polystyrene beads nanoparticle suspensions
Colloid particle suspension was prepared using polystyrene beads that have a mean diameter of 210 nm. The stock concentration of polystyrene beads consisted of 7.3 × 10¹¹ particles/mL. The stock solution was diluted to a dilution factor of 250 using measuring electrolyte. The measuring electrolyte was prepared using 15 mL PBS and 45 μL wetting solution (Izon Science).
2.4. Cell culture, extracellular vesicle collection, and sample preparation
Malignant cells were seeded approximately at a density of 4 × 10⁴ cells/mL onto 100 mm tissue culture plates. [42,43] These plates contained 10 mL high glucose DMEM medium supplemented with 10 % FBS. The plates were incubated at 37 °C under 5 % CO2 for 48 h or until the cells reached 80 % confluency. When the cells reached 80 % confluency, culture media was discarded, and the cells were washed twice with PBS. 10 mL of DMEM medium containing 10 % exosomes depleted FBS was added to the plates. The plates were incubated at 37 °C under 5 % CO2 for 48 h. After the incubation period, the culture medium was collected and filtered through a 0.22 μm filter. Following filtration, the culture medium was ultracentrifugation at 49,000 rpm for 70 min. The EVs were collected by discarding the supernatant and resuspending the pellet in 100 μL PBS.
2.5. TRPS instrument setup
The TRPS device (qNano, Izon sciences) was connected to the computer that has been installed with analysis software (Control Suite V3.4) via a USB port. The control suite software allows users to adjust different voltage settings to get optimal baseline current. The signal trace window displayed the magnitude of baseline and noise current.
The nanopore and the upper fluid cell was washed with deionized water, and the lower fluid cell was wetted with measuring electrolyte followed by quickly removing the electrolyte. The nanopore was then mounted on the device and stretched to the experimental conditions. To establish a baseline current, a solution of 70 μL PBS was dispensed carefully in the lower fluid cell without introducing air bubbles that could cause a spike in noise current. Subsequently, 30 μL of PBS was added carefully into the upper fluid cell without introducing air bubbles. The solution in the upper fluid cell was adjusted by repetitive pipetting until a stable baseline current was established. Optimization of baseline current was done by selecting different DC bias voltages, stretching the nanopore at different lengths, and applying pressure at different ranges until the baseline current reached around 120 nA. The Polystyrene beads calibration particle was then aspirated into the upper fluid cell to begin the translocation event. Translocation events of 500 calibration particles were measured under the set conditions. After measurement, the upper fluid cell was washed with deionized water. Upon washing, 30 μL of EVs samples from malignant cells and nonmalignant cells were diluted appropriately using PBS and 0.05 % of Tween 20. Then a 30 μL sample was dispensed into the upper fluid cell to measure the magnitude of blockade current. The blockade current was recorded by the control Suite V3.4 software for further analysis.
3. Results and discussion
3.1. Shielding effect on mechanical noise reduction
3.1.1. Metacage design and simulation
Major noise sources of the TRPS system are external electrical sources, mechanical sources, and intrinsic noise of electronic circuits (Hz to MHz).[44] Three different panel structure designs were proposed to reduce acoustic noise. The three differing façade systems were compared to the unshielded control and simulated to show deviation (Fig. 2a–c). The sound-absorbing acoustic performance of foam acoustic metasurface was simulated using polyurethane conglomerate acoustic metamaterial, which was acquired from the flow simulation package (SolidWorks). The acoustic power levels (APL) were calculated to predict noise. The difference in APL, between the shielded and unshielded conditions, was used to forecast soundproof performance. According to the simulation result, the average APL achieved a 70 dB difference for model one design, 71 dB difference in the second model, and 65 dB difference in the third model. All three models revealed the capability of the metastructure design to reduce acoustic noise. As shown in Fig. 2e, the model two acoustic foam pattern showed more difference in acoustic power level compared to the difference obtained in the other two proposed models, and thus was selected for assembly.
Fig. 2.
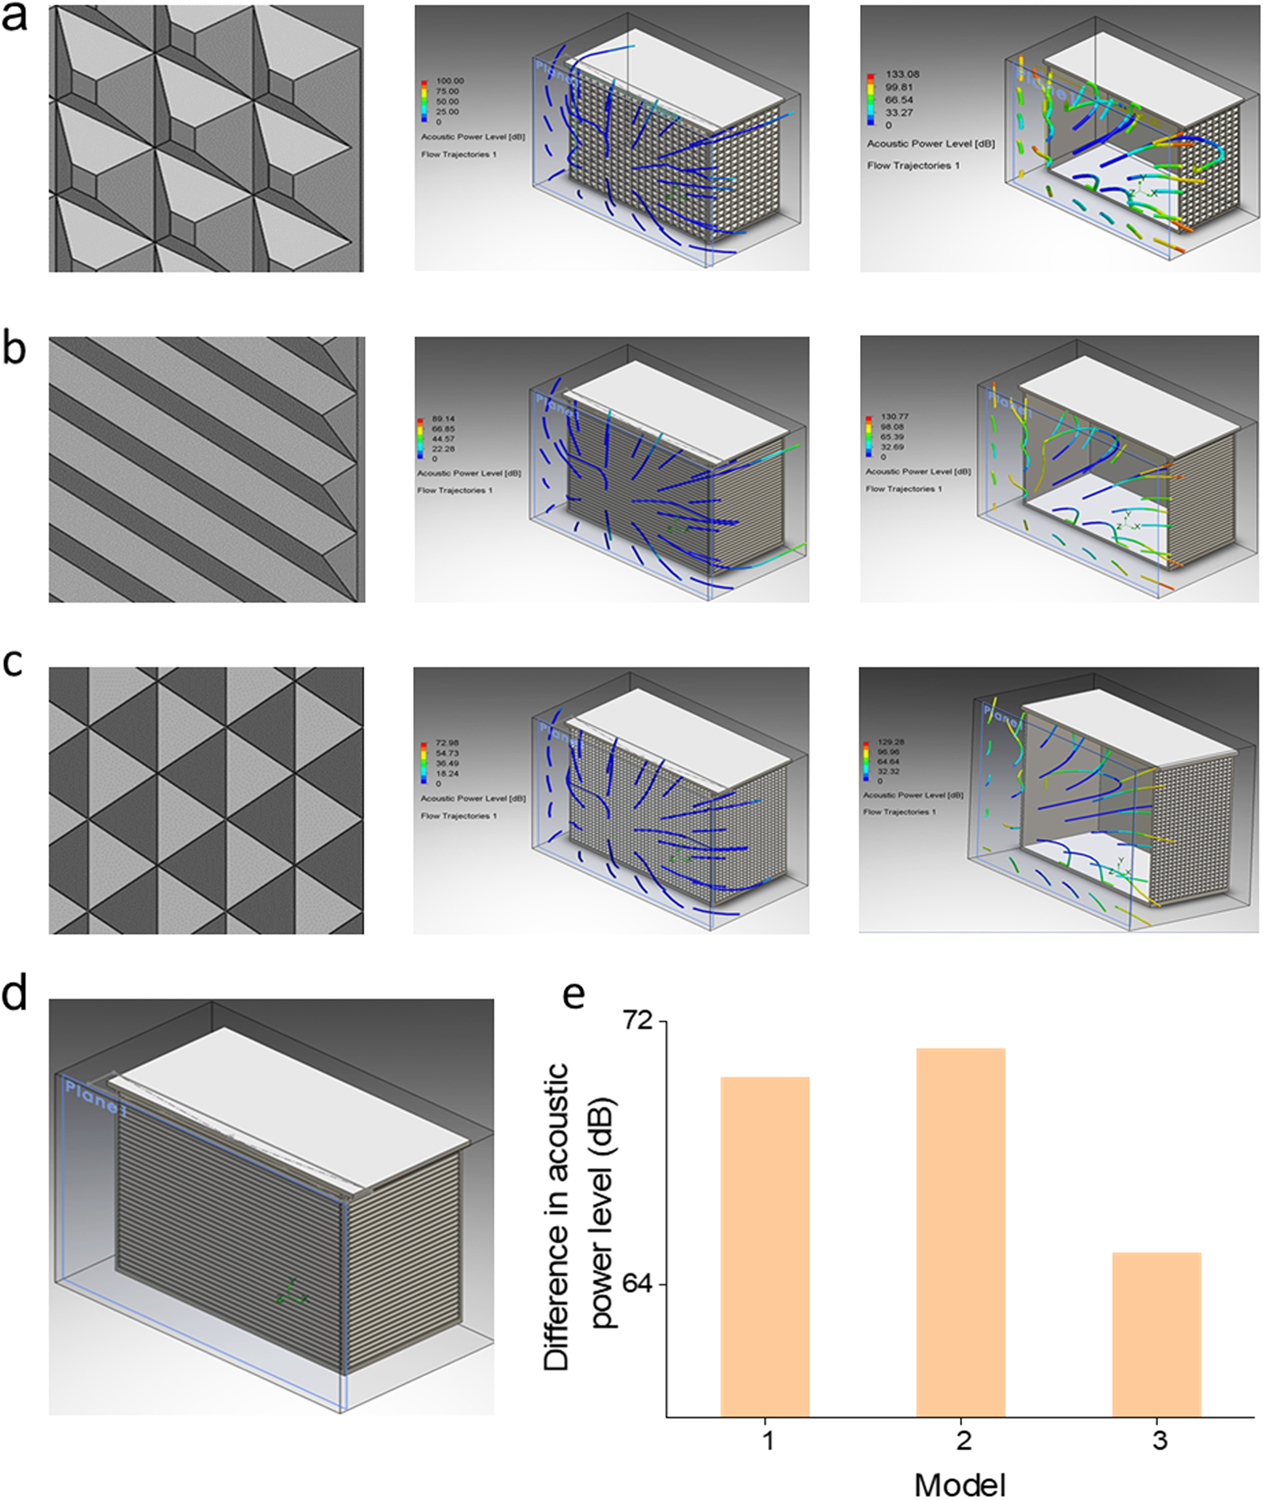
Metacage design and acoustic power level (APL) simulation results. (a-c) The metastructures and APL simulation results for model 1–3. (d) 3D design of model 2. (e) The differences in APL for the three models between shielded and unshielded conditions.
3.1.2. Shielding effect on external acoustic interference
Numerical simulation to understand factors that influence the current response during translocation events, such as nanoparticle analyte surface charge, non-uniform electric fields, forces on individual particles, is crucial for accurate nanoparticle analysis. The ability to obtain accurate nanoparticle characterization is crucial in applications such as the analysis of viruses and nanoparticles. Focusing on reducing external noise in a TRPS setup using flow simulation computational fluid dynamics tools, different models have been reported in published studies, including the Multiple Ion Model (MIM) using finite element analysis. Our shielding simulation’s performance is based on the metamaterials’ ability to reduce external electric field noise. Among the three abovementioned design models, model two (Fig. 2d), with the highest sound insulation performance in the simulation, was used to build the wrapper enclosure. The noise reduction performance of the shielding enclosure was tested. Sound levels, a logarithmic measure of effective sound pressure relative to a reference noise value, were recorded and evaluated. The data in the time domain and the spectral analysis result were plotted in Fig. 3.
Fig. 3.
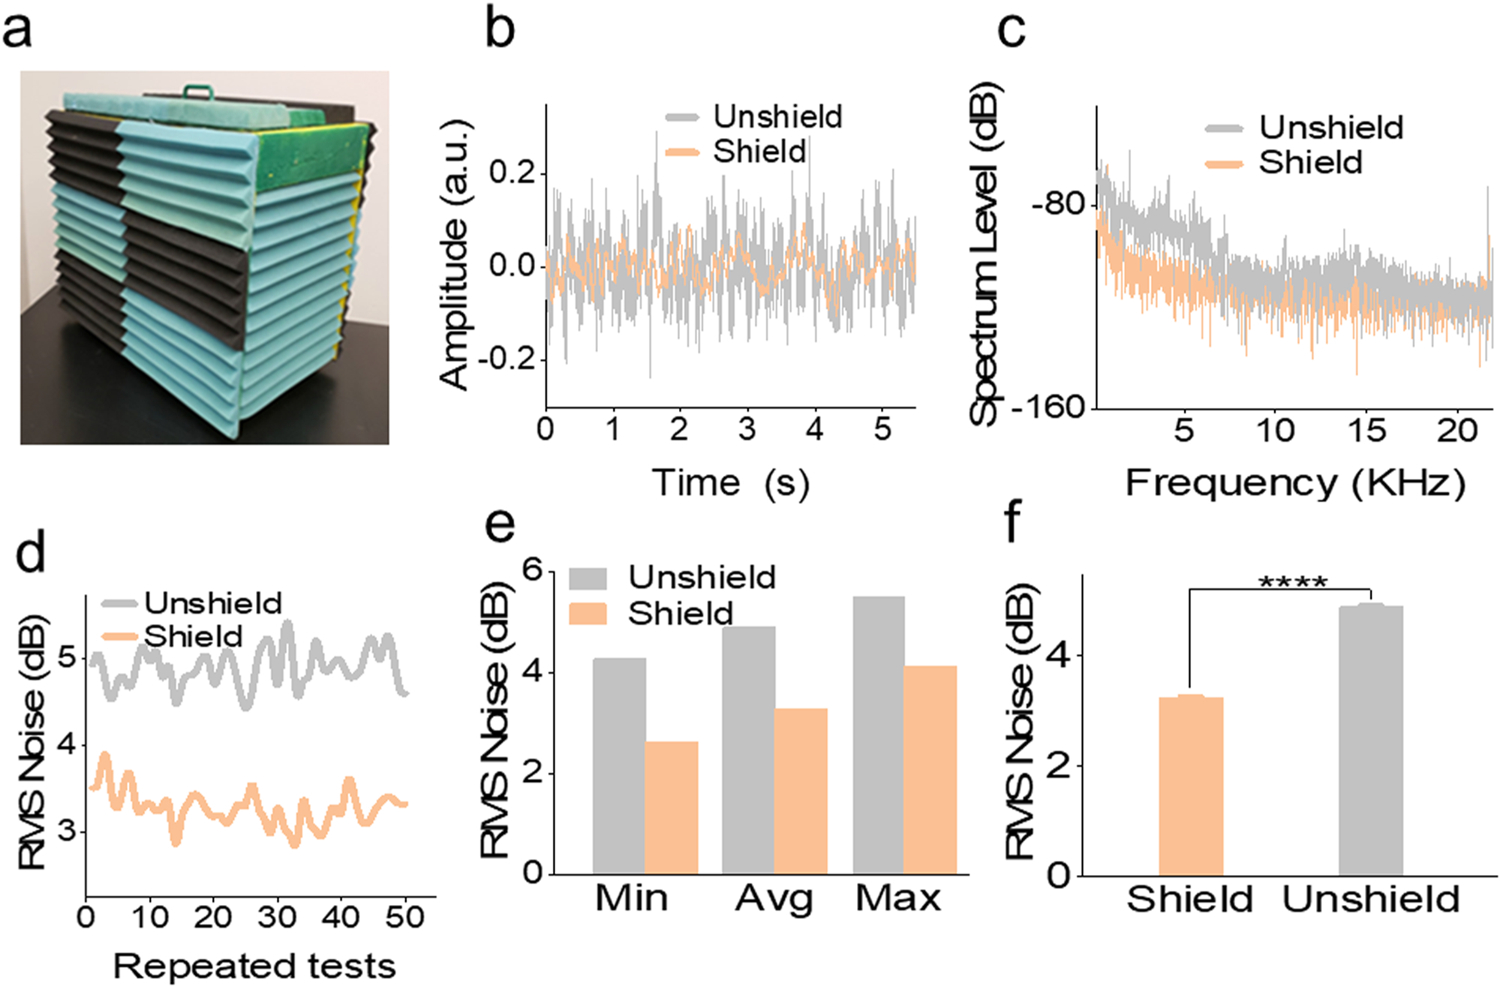
Sound shielding test result. (a) Wrapper enclosure. (b) Time-domain representation of measured sound signals under the shielded and unshielded conditions. (c) Frequency response of measured sound signals under the shielded and unshielded conditions. (d) RMS noise (dB) of 50 repeated measurements. (e) Comparison of the mean, average, maximum value of measured RMS noise. (f) The statistical test result of RMS noise level under shielded and unshielded conditions. **** P < 0.0001. a.u.: arbitrary units.
The sampled time-domain sound levels under the shielded and unshielded conditions were compared in Fig. 3b. The sound levels measured inside the shielded enclosure showed a reduction compared to the unshielded condition. Frequency response analysis was conducted, and the spectrum periodograms were given in Fig. 3c. Reduced spectrum levels were observed when comparing the shielded enclosure to the unshielded enclosure. Particularly, at the low-frequency range, 0–6.6 kHz, the spectrum level of the shielded condition was significantly lower than the unshielded condition. However, the spectrum level difference at other frequency ranges was relatively constant in comparison. This suggests that the enclosure selectively filtered low-frequency noise. To confirm the reproducibility of the soundproof effect, 50 random recordings (5 s each, Fig. 3d) were analyzed for root mean square (RMS) noise level. The minimum, maximum, and average of the 50 RMS values suggested that the shielded condition had lower RMS noise levels (Fig. 3e). The mean value of RMS noise inside the shielded enclosure shows a reduction compared to the unshielded condition (3.236 v.s. 4.886 dB), which can be considered statistically significant by t-test (Fig. 3f). These results validated the soundproof effect of the enclosure as expected in the simulation.
3.1.3. Shielding effect on external electrical interference
The external electromagnetic field can directly interact with ions in the electrolyte during translocation events, thus affecting the TRPS system noise. When the RMS noise level exceeds 20 nA, the possible cause is due to electrical interference.[45] To reduce interference of external electromagnetic fields, the enclosure was laminated with grounded conductive aluminum sheet inside. A spectrum analyzer was used to investigate electromagnetic noise inside and outside the shielding environment. Lower power spectral density was observed under the shielded condition over the tested frequency (Fig. 4a). The power spectral density difference between the shielded and unshielded conditions varied with the frequency range (Fig. 4b). The two frequency ranges, 400–600 MHz and 900–1200 MHz showed significant differences. Wireless communication carriers are operating near the two frequency ranges. Therefore, the shielding cage can be used to reduce external noise coming from a device working at 600 MHz and 900 MHz frequency range.
Fig. 4.
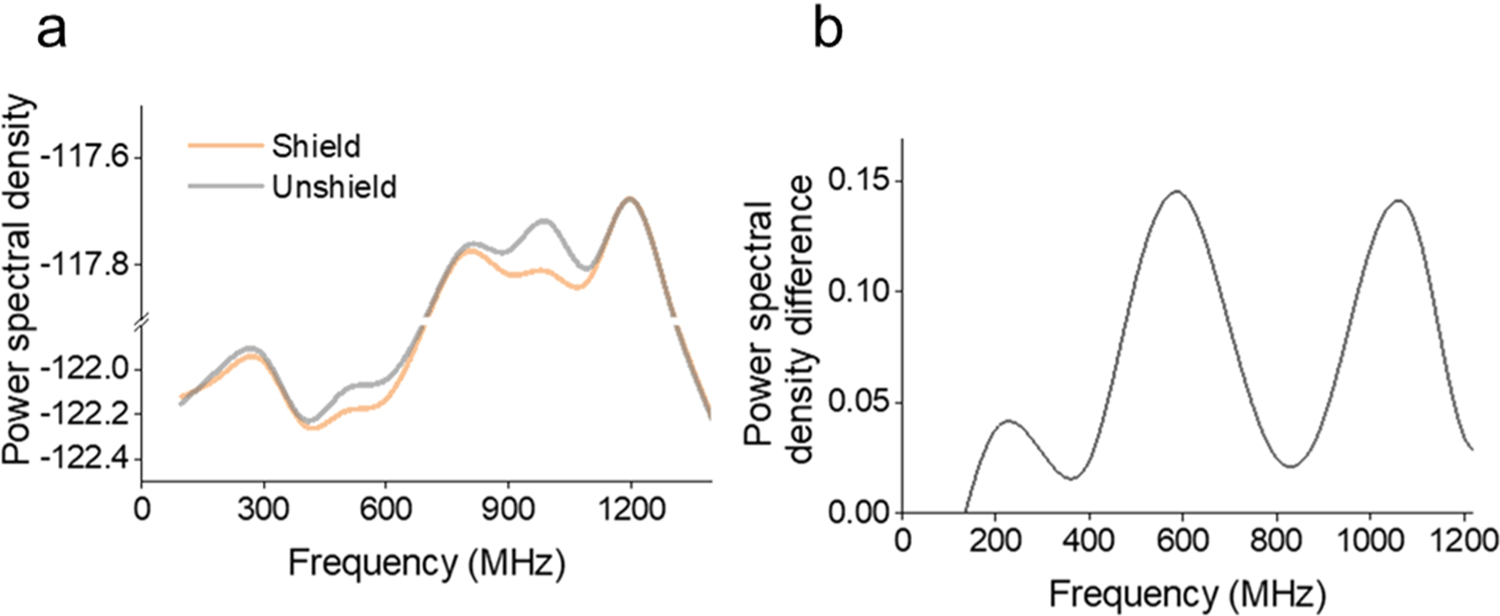
Electromagnetic interference test result. (a) Power spectral density of noise within and outside the shielded enclosure. (b) The change in power spectral density between the shielded and unshielded conditions, suggests a reduction of external noise at the 600 MHz and 900 MHz frequency range.
3.2. Shielding effect on the quantification
3.2.1. Shielding effect on the quantification of polystyrene beads
The shielding effect on the TRPS quantification method was first evaluated by testing standard nanoparticles, known as polystyrene beads, commonly used as a quantification and characterization reference.[46] The RMS value of translocation current (nA) was then recorded for noise assessment. In Fig. 5a, the RMS noise was significantly reduced (> 30 %) with the shielded enclosure when using TRPS to quantify polystyrene beads. The impact of the noise reduction on the quantification was analyzed through the size profiling of the standard polystyrene beads with a mean diameter of 210 nm. The beads were quantified using TRPS with and without the shielding. The size distribution curve exhibited a downward (left) shift from the unshielded to the shielded condition (Fig. 5b). The center of distribution under the shielded condition was proximate to the actual diameter of the standard polystyrene beads used for the test, suggesting the shield ensured precise quantification. Together with the abovementioned noise reduction result (mechanical and electromagnetic), the reduction of low-level noise current led to better quantification performance for lower-sized nanoparticles, which affirmed the benefit of using the shielded enclosure for TRPS based particle quantification.
Fig. 5.
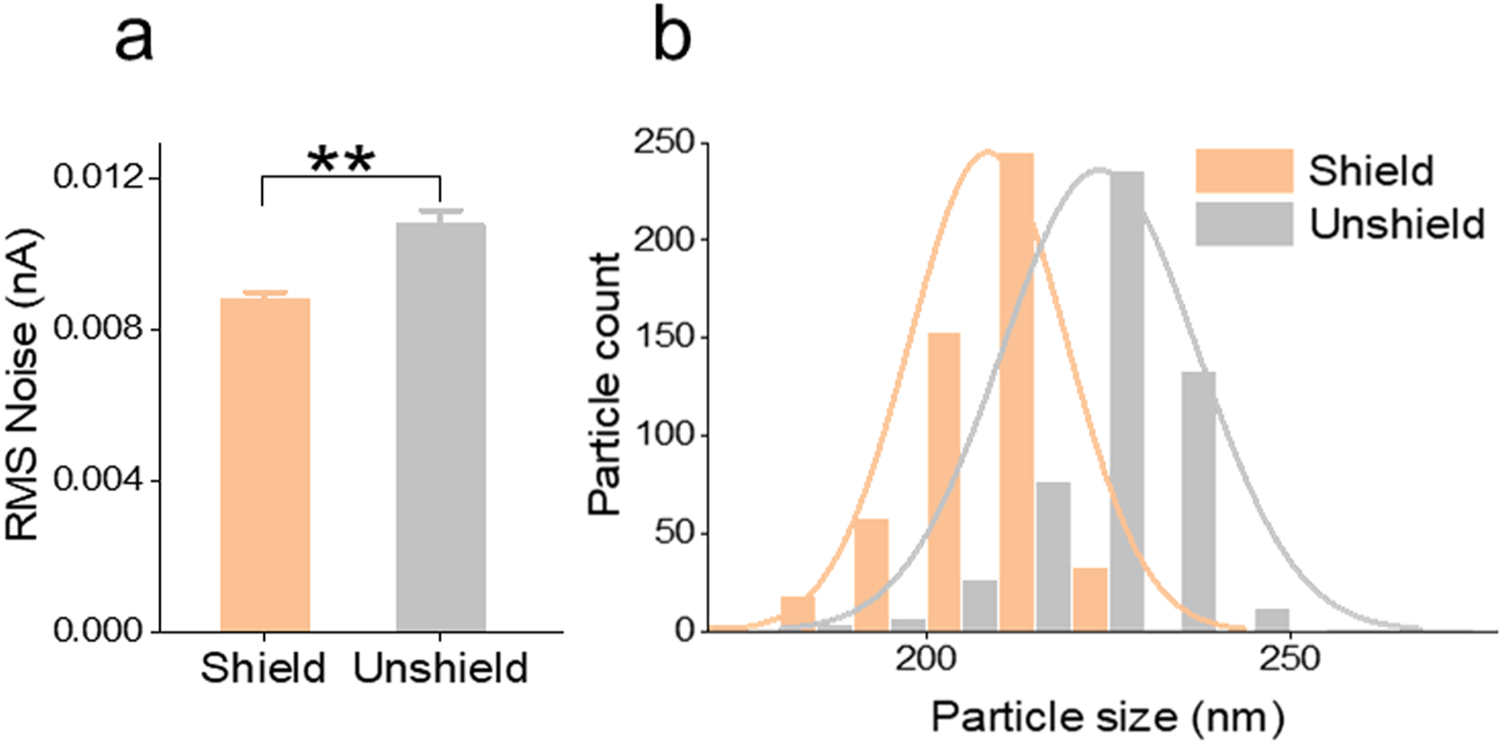
Shielding effect on the noise reduction and size measurement of TRPS. (a) RMS noise of TRPS measurement inside and outside the shielded enclosure. (b) Size distribution of polystyrene beads when quantification is performed inside and outside the shielded enclosure. Data points represent mean ± SE (n = 5). ** P < 0.01.
3.2.2. Shielding effect on the quantification of EVs
To evaluate the impact of shielding on the quantification of bio-originated particles, EVs from malignant (Mia PaCa-2) and nonmalignant (HPNE) cells were profiled by TRPS with and without the shielding. Like the polystyrene beads (Fig. 5a), the RMS noise was significantly reduced with the shielding cage when using TRPS to quantify the EVs from both cells (Fig. 6a and c). However, the RMS change from the shielded to unshielded condition of the nonmalignant EVs is more dramatic (>30 %). Correspondingly, the size distribution curve exhibited a downward (left) shift from the unshielded to the shielded condition (Fig. 5b and d). Nevertheless, consistent with the RMS change, the distribution shift of nonmalignant EVs is more observable.
Fig. 6.
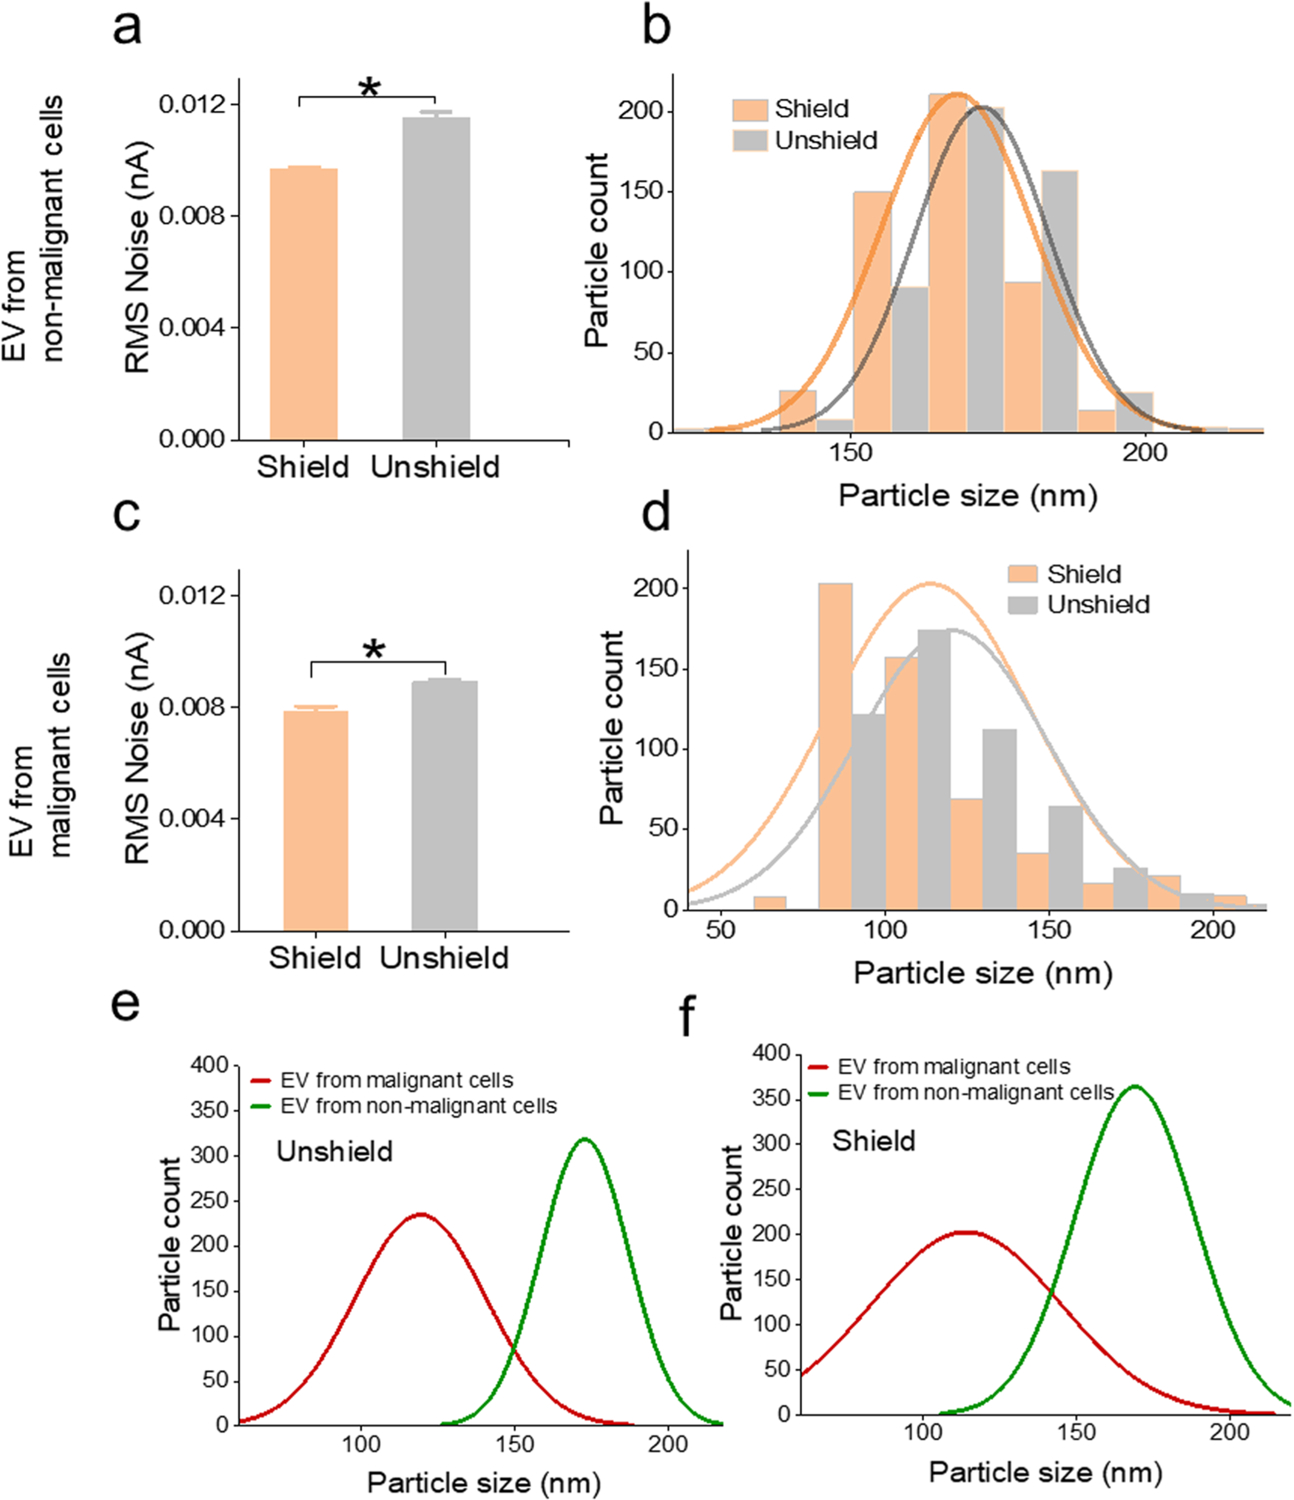
Shielding effect on the noise reduction and size measurement of EVs collected from malignant and nonmalignant cells. (a, b) RMS noise and size distribution of EVs from nonmalignant cells inside and outside the shielded enclosure. (c, d) RMS noise and size distribution of EVs from malignant cells inside and outside the shielded enclosure. (e, f) Size distribution of EVs collected from the malignant and nonmalignant cells with and without the shielded enclosure. Data points represent mean ± SE (n = 4). * P < 0.05.
Quantifying EVs within the shielded enclosure reduced the noise, which enhanced the minimum size detection limit. The advanced detection limit of minimum-sized particles, therefore, enabled a broader size range of the TRPS profiling. The ability to quantify minimum-size particles in the sample improves the precision of TRPS, and thus empowers a more accurate size comparison of EVs from malignant and nonmalignant cells. The advanced size profiling facilitates the diagnostic application of TRPS in discriminating tumor-derived EVs from other EVs. For EV quantification, nanopore has substantially more application and accuracy than other methods such as dynamic light scatter (DLS). The range of nanoparticles that DLS and nanopore overlap in is 20–250 nm. DLS relies on the scattering of light from these nanoparticles and fails to identify nanoparticles near the lower spectrum range while larger nanoparticles are present.[47] Nanopore measurement is more accurate at differentiating nanoparticles and has a much wider range of quantification. Through the application of a known voltage and pore stretch, nanoparticles can be measured in concentration by size through a change in current [48].
3.2.3. Shielding effect on translocation events
In the TRPS system, when a target analyte passes through a pore with a focused electric field, a drop of ionic current reveals itself as a resistive pulse signal in an event known as translocation or blockage. For size profiling, at least 500 translocation events must be recorded to obtain a statistically meaningful size evaluation of the particles. A resistive pulse signal can be covered by noise when the resistive pulse magnitude of the small particle is less than the magnitude of noise. To observe blockade events in the TRPS system, a noise level less than 10 pA is required.[49] The shielding cage reduced the noise and in turn filtered unintended translocation events from being counted due to noise. This led to a longer recording time to reach the minimum statistical count. The recording time was compared with and without the shield on polystyrene beads and EVs (Fig. 7). All shielded conditions manifested longer recording time, which is consistent with the aforesaid.
Fig. 7.
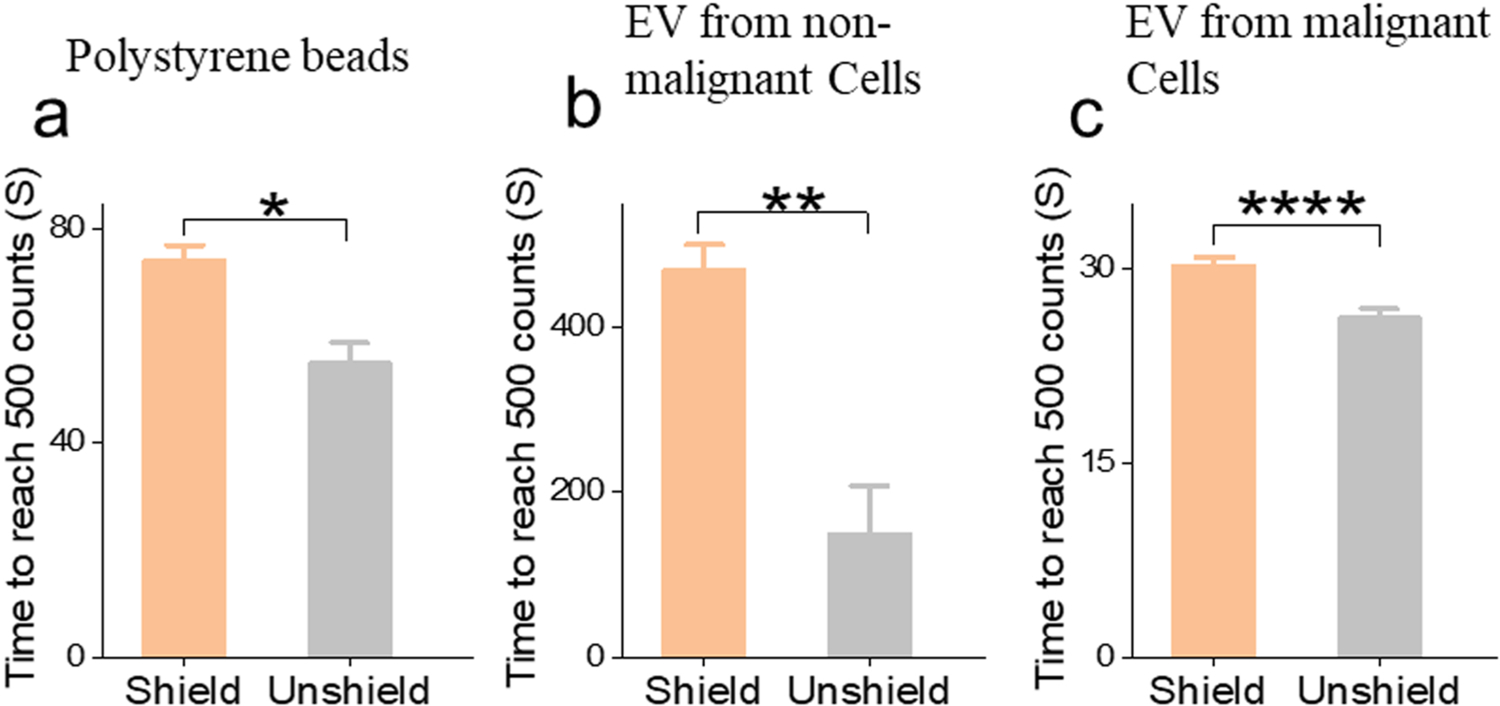
Recording time of translocation events. (a) Polystyrene beads. (b) EVs from nonmalignant cells. (c) EVs from malignant cells. Data points represent mean ± SE (n = 4). * P < 0.05; ** P < 0.01; **** P < 0.0001.
Literature reports have shown that the electric field intensity is an important parameter for controlling the particle transport velocity and the current fluctuation amplitude. [50] To accurately profile the particle size, it requires the particle to pass through the Z-axis in the nanopore. Off-axial particle translocation event is a phenomenon where particles do not traverse through the center of the pore. This results in a deviation from the expected resistive pulse magnitude. Reducing the influence of unwanted fluctuating external electric field noise in the vicinity of the nanopore device retains particle translocation to the center of the pore’s Z-axis. Enclosing TRPS with the shielded cage reduces the coupling of external electric field noise to the non-uniform electric field established due to electrophoresis. This facilitates the passage of particles through the center of the pore.
Varying environmental parameters such as ionicity and applied voltage (or equivalently direction of the externally applied E-field) affect translocation.[51] Translocation events per minute decreases when the analyte concentration increases.[52] However, in our experiment, the same concentration was maintained when quantification was performed within and outside the shielded cage. The voltage was manipulated to achieve a baseline current of 120 nA for analysis. The range in the voltage was due to pore stretch, pore size, pressure applied, electrolyte used, and was within a range of 0.2–1.0 V. All other conditions were set identical, thus ruling out the impact of parameters other than noise.
4. Conclusion
Maintaining a noise-free setup is essential for elaborated analysis equipment. However, inevitable environmental noise is a common challenge deteriorating the precision of analysis. In this study, we designed a shielded enclosure to reduce the impact of environmental noise (mechanical and electromagnetic) on the TRPS measurement. The sound insulation function of the enclosure was achieved using a patterned metasurface façade insulation structure which was optimized by simulation. Electromagnetic noise was weakened by coating grounded conductive aluminum sheet inside the enclosure. The external noise was reduced, and the signal-to-noise ratio was improved when using the shielded enclosure, thus improving the lower detection limit of TRPS. The precision improvement was validated by using standard polystyrene beads. To validate the advanced detected limit on bio-originated particles, EVs from malignant and nonmalignant cells were profiled using TRPS with and without the shielded enclosure. The ability to determine the minimum size particles in the sample improved the precision of TRPS. This enables a more accurate comparison of the size of EVs derived from malignant and non-malignant cells, which aids the search for analytical systems for diagnostic applications.
Acknowledgments
This work was financially supported by grants from the National Cancer Institute (R03CA252783, R21CA270748) and the National Institute of General Medical Sciences (U54GM128729) of National In-stitutes of Health to D.S., NDSU EPSCoR STEM Research and Education fund (FAR0032086) to D.S., ND EPSCoR: Advancing Science Excellence in ND (FAR0030554) to D.S., National Science Foundation (NSF) under NSF EPSCoR Track-1 Cooperative Agreement (OIA #1355466) to D.S., NDSU Foundation and Alumni Association to D.S.
Biographies
Nega Ejjigu Biomedical Engineering Program, North Dakota State University, ND 58102 United States. Nega Ejjigu is a graduate student in Biomedical Engineering Program at North Dakota State University. He received his B.E. degree in 2012 from Bahir Dar University Institute Of Technology in electrical engineering. He is a research assistant in the biosensing laboratory and a teaching assistant in the Electrical and Computer Engineering department at North Dakota State University.
Dali Sun Department of Electrical and Computer Engineering, Biomedical Engineering Program, North Dakota State University, 1411 Centennial Blvd., 101 M Fargo, ND 58102Dr. Dali Sun obtained his Ph.D. degree in Bioengineering from The University Of Tokyo, Tokyo, Japan. Science 2018, he became an assistant professor in the Department of Electrical and Computer Engineering, Biomedical Engineering Program at North Dakota State University. His research focused on developing translational cancer detection and treatment methods, integrating multidisciplinary approaches. When facing a clinical problem, he tends to solve it with a novel integrated solution taking advantage of each technique (bioengineering, optical, electrical, electrochemical, biochemical, and mechanical). Most of his research was inspired and generated during the cross-disciplinary attempts.
Footnotes
CRediT authorship contribution statement
Dali Sun: Conceptualization, Methodology, Resources, Writing – review & editing, Supervision, Project administration, Funding acquisition. Nega Ejjigu: Formal analysis, Visualization, Investigation, Writing – original draft. Khalid Abdelgadir: Investigation, Validation. Zachariah Flaten: Investigation, Writing – review & editing. Cameron Hoff: Investigation, Writing – review & editing. Chen-Zhong Li: Writing – review & editing.
Declaration of Competing Interest
The authors declare that they have no known competing financial interests or personal relationships that could have appeared to influence the work reported in this paper.
Data Availability
Data will be made available on request.
References
- [1].Vogel R, Willmott G, Kozak D, Roberts GS, Anderson W, Groenewegen L, Glossop B, Barnett A, Turner A, Trau M, Quantitative sizing of nano/microparticles with a tunable elastomeric pore sensor, Anal. Chem 83 (2011), 10.1021/ac200195n. [DOI] [PubMed] [Google Scholar]
- [2].van der Pol E, Böing AN, Harrison P, Sturk A, Nieuwland R, Classification, functions, and clinical relevance of extracellular vesicles, Pharmacol. Rev 64 (2012) 676–705, 10.1124/pr.112.005983. [DOI] [PubMed] [Google Scholar]
- [3].van der Pol E, Coumans F, Varga Z, Krumrey M, Nieuwland R, Innovation in detection of microparticles and exosomes, J. Thromb. Haemost 11 (2013) 36–45, 10.1111/jth.12254. [DOI] [PubMed] [Google Scholar]
- [4].Sowerby SJ, Broom MF, Petersen GB, Dynamically resizable nanometre-scale apertures for molecular sensing, Sens. Actuators B: Chem 123 (2007), 10.1016/j.snb.2006.08.031. [DOI] [Google Scholar]
- [5].Vestad B, Llorente A, Neurauter A, Phuyal S, Kierulf B, Kierulf P, Skotland T, Sandvig K, Haug KBF, Øvstebø R, Size and concentration analyses of extracellular vesicles by nanoparticle tracking analysis: a variation study, J. Extracell. Vesicles 6 (2017) 1344087, 10.1080/20013078.2017.1344087. [DOI] [PMC free article] [PubMed] [Google Scholar]
- [6].Nolan JP, Duggan E, Analysis of individual extracellular vesicles by flow cytometry, Methods Mol. Biol (2018) 79–92, 10.1007/978-1-4939-7346-0_5. [DOI] [PubMed] [Google Scholar]
- [7].Tan X, Day KC, Li X, Broses LJ, Xue W, Wu W, Wang WY, Lo T-W, Purcell E, Wang S, Sun Y-L, Khaing Oo MK, Baker BM, Nagrath S, Day ML, Fan X, Quantification and immunoprofiling of bladder cancer cell-derived extracellular vesicles with microfluidic chemiluminescent ELISA, Biosens. Bioelectron.: X 8 (2021), 100066, 10.1016/j.biosx.2021.100066. [DOI] [Google Scholar]
- [8].Guo S-C, Tao S-C, Dawn H, Microfluidics-based on-a-chip systems for isolating and analysing extracellular vesicles, J. Extracell. Vesicles 7 (2018) 1508271, 10.1080/20013078.2018.1508271. [DOI] [PMC free article] [PubMed] [Google Scholar]
- [9].Su L, Shu T, Wang Z, Cheng J, Xue F, Li C, Zhang X, Immobilization of bovine serum albumin-protected gold nanoclusters by using polyelectrolytes of opposite charges for the development of the reusable fluorescent Cu2+-sensor, Biosens. Bioelectron 44 (2013) 16–20, 10.1016/J.BIOS.2013.01.005. [DOI] [PubMed] [Google Scholar]
- [10].Anderson W, Kozak D, Coleman VA, Jämting ÅK, Trau M, A comparative study of submicron particle sizing platforms: Accuracy, precision and resolution analysis of polydisperse particle size distributions, J. Colloid Interface Sci 405 (2013) 322–330, 10.1016/j.jcis.2013.02.030. [DOI] [PubMed] [Google Scholar]
- [11].Montis C, Zendrini A, Valle F, Busatto S, Paolini L, Radeghieri A, Salvatore A, Berti D, Bergese P, Size distribution of extracellular vesicles by optical correlation techniques, Colloids Surf. B: Biointerfaces 158 (2017), 10.1016/j.colsurfb.2017.06.047. [DOI] [PubMed] [Google Scholar]
- [12].Hodoroaba Vasile-Dan, Unger Wolfgang E.S., Shard Alexander G. (Eds.), Characterization of Nanoparticles, Elsevier, 2020, 10.1016/C2017-0-00312-9. [DOI] [Google Scholar]
- [13].Sivakumaran M, Platt M, Tunable resistive pulse sensing: potential applications in nanomedicine, Nanomedicine 11 (2016), 10.2217/nnm-2016-0097. [DOI] [PubMed] [Google Scholar]
- [14].Weatherall E, Willmott GR, Applications of tunable resistive pulse sensing, Analyst 140 (2015), 10.1039/C4AN02270J. [DOI] [PubMed] [Google Scholar]
- [15].Garza-Licudine E, Deo D, Yu S, Uz-Zaman A, Dunbar WB, Portable nanoparticle quantization using a resizable nanopore instrument - The IZON qNano™, in: 2010 Annual International Conference of the IEEE Engineering in Medicine and Biology, IEEE, 2010. 10.1109/IEMBS.2010.5627861. [DOI] [PubMed] [Google Scholar]
- [16].Serrano-Pertierra E, Oliveira-Rodríguez M, Matos M, Gutíerrez G, Moyano A, Salvador M, Rivas M, Blanco-López MC, Extracellular vesicles: current analytical techniques for detection and quantification, Biomolecules 10 (2020) 824, 10.3390/biom10060824. [DOI] [PMC free article] [PubMed] [Google Scholar]
- [18].Chandler WL, Yeung W, Tait JF, A new microparticle size calibration standard for use in measuring smaller microparticles using a new flow cytometer, J. Thromb. Haemost 9 (2011) 1216–1224, 10.1111/j.1538-7836.2011.04283.x. [DOI] [PubMed] [Google Scholar]
- [19].Erdbrügger U, Lannigan J, Analytical challenges of extracellular vesicle detection: a comparison of different techniques, Cytom. Part A 89 (2016) 123–134, 10.1002/cyto.a.22795. [DOI] [PubMed] [Google Scholar]
- [20].Hoo CM, Starostin N, West P, Mecartney ML, A comparison of atomic force microscopy (AFM) and dynamic light scattering (DLS) methods to characterize nanoparticle size distributions, J. Nanopart. Res 10 (2008) 89–96, 10.1007/s11051-008-9435-7. [DOI] [Google Scholar]
- [21].Anderson W, Kozak D, Coleman VA, Jämting ÅK, Trau M, A comparative study of submicron particle sizing platforms: accuracy, precision and resolution analysis of polydisperse particle size distributions, J. Colloid Interface Sci 405 (2013) 322–330, 10.1016/j.jcis.2013.02.030. [DOI] [PubMed] [Google Scholar]
- [22].Yu Y, Li Y-T, Jin D, Yang F, Wu D, Xiao M-M, Zhang H, Zhang Z-Y, Zhang G-J, Electrical and label-free quantification of exosomes with a reduced graphene oxide field effect transistor biosensor, Anal. Chem 91 (2019) 10679–10686, 10.1021/acs.analchem.9b01950. [DOI] [PubMed] [Google Scholar]
- [23].Wang S, Zhang L, Wan S, Cansiz S, Cui C, Liu Y, Cai R, Hong C, Teng I-T, Shi M, Wu Y, Dong Y, Tan W, Aptasensor with expanded nucleotide using DNA nanotetrahedra for electrochemical detection of cancerous exosomes, ACS Nano 11 (2017) 3943–3949, 10.1021/acsnano.7b00373. [DOI] [PMC free article] [PubMed] [Google Scholar]
- [24].Guerrini L, Alvarez-Puebla RA, Surface-enhanced raman spectroscopy in cancer diagnosis, prognosis and monitoring, Cancers (Basel) 11 (2019) 748, 10.3390/cancers11060748. [DOI] [PMC free article] [PubMed] [Google Scholar]
- [25].Vogel R, Coumans FAW, Maltesen RG, Böing AN, Bonnington KE, Broekman ML, Broom MF, Buzás EI, Christiansen G, Hajji N, Kristensen SR, Kuehn MJ, Lund SM, Maas SLN, Nieuwland R, Osteikoetxea X, Schnoor R, Scicluna BJ, Shambrook M, de Vrij J, Mann SI, Hill AF, Pedersen S,A standardized method to determine the concentration of extracellular vesicles using tunable resistive pulse sensing, J. Extracell. Vesicles 5 (2016), 10.3402/jev.v5.31242. [DOI] [PMC free article] [PubMed] [Google Scholar]
- [26].Wen C, Li S, Zeng S, Zhang Z, Zhang S-L, Autogenic analyte translocation in nanopores, Nano Energy 60 (2019), 10.1016/j.nanoen.2019.03.092. [DOI] [Google Scholar]
- [27].Hoogerheide DP, Garaj S, Golovchenko JA, Probing Surface Charge Fluctuations with Solid-State Nanopores, 2009. [DOI] [PMC free article] [PubMed]
- [28].Tsutsui M, Yokota K, Arima A, Tonomura W, Taniguchi M, Washio T, Kawai T, Temporal response of ionic current blockade in solid-state nanopores, ACS Appl. Mater. Interfaces 10 (2018) 34751–34757, 10.1021/acsami.8b11819. [DOI] [PubMed] [Google Scholar]
- [29].Lee MH, Kumar A, Park KB, Cho SY, Kim HM, Lim MC, Kim YR, Kim KB, A low-noise solid-state nanopore platform based on a highly insulating substrate, Sci. Rep 4 (2014), 10.1038/srep07448. [DOI] [PMC free article] [PubMed] [Google Scholar]
- [30].Rosenstein JK, Wanunu M, Merchant CA, Drndic M, Shepard KL, Integrated nanopore sensing platform with sub-microsecond temporal resolution, Nat. Methods 9 (2012) 487–492, 10.1038/nmeth.1932. [DOI] [PMC free article] [PubMed] [Google Scholar]
- [31].Shekar S, Chien CC, Hartel A, Ong P, Clarke OB, Marks A, Drndic M, Shepard KL, Wavelet denoising of high-bandwidth nanopore and ion-channel signals, Nano Lett. 19 (2019) 1090–1097, 10.1021/acs.nanolett.8b04388. [DOI] [PMC free article] [PubMed] [Google Scholar]
- [32].Tsutsui M, Takaai T, Yokota K, Kawai T, Washio T, Deep learning-enhanced nanopore sensing of single-nanoparticle translocation dynamics, Small Methods (2021), 10.1002/smtd.202100191. [DOI] [PubMed] [Google Scholar]
- [33].Anderson W, Lane R, Korbie D, Trau M, Observations of tunable resistive pulse sensing for exosome analysis: improving system sensitivity and stability, Langmuir 31 (2015), 10.1021/acs.langmuir.5b01402. [DOI] [PubMed] [Google Scholar]
- [34].Parkin WM, Drndić M, Signal and noise in FET-nanopore devices, ACS Sens. 3 (2018), 10.1021/acssensors.7b00708. [DOI] [PubMed] [Google Scholar]
- [35].Dutta P, Horn PM, Low-frequency fluctuations in solids: 1/f noise, Rev. Mod. Phys 53 (1981), 10.1103/RevModPhys.53.497. [DOI] [Google Scholar]
- [36].Hartel AJW, Shekar S, Ong P, Schroeder I, Thiel G, Shepard KL, High bandwidth approaches in nanopore and ion channel recordings - a tutorial review, Anal. Chim. Acta 1061 (2019), 10.1016/j.aca.2019.01.034. [DOI] [PMC free article] [PubMed] [Google Scholar]
- [37].Akhtarian S, Miri S, Doostmohammadi A, Brar SK, Rezai P, Nanopore sensors for viral particle quantification: current progress and future prospects, Bioengineered 12 (2021) 9189–9215, 10.1080/21655979.2021.1995991. [DOI] [PMC free article] [PubMed] [Google Scholar]
- [38].Kozak D, Anderson W, Vogel R, Trau M, Advances in resistive pulse sensors: Devices bridging the void between molecular and microscopic detection, Nano Today 6 (2011), 10.1016/j.nantod.2011.08.012. [DOI] [PMC free article] [PubMed] [Google Scholar]
- [39].Kumar S, Lee HP, Labyrinthine acoustic metastructures enabling broadband sound absorption and ventilation, Appl. Phys. Lett 116 (2020), 134103, 10.1063/5.0004520. [DOI] [Google Scholar]
- [40].Kumar S, Lee HP, Recent advances in acoustic metamaterials for simultaneous sound attenuation and air ventilation performances, Cryst. (Basel) 10 (2020) 686, 10.3390/cryst10080686. [DOI] [Google Scholar]
- [41].Anderson W, Lane R, Korbie D, Trau M, Observations of tunable resistive pulse sensing for exosome analysis: improving system sensitivity and stability, Langmuir 31 (2015), 10.1021/acs.langmuir.5b01402. [DOI] [PubMed] [Google Scholar]
- [42].Rasuleva K, Elamurugan S, Bauer A, Khan M, Wen Q, Li Z, Steen P, Guo A, Xia W, Mathew S, Jansen R, Sun D, β-sheet richness of the circulating tumor-derived extracellular vesicles for noninvasive pancreatic cancer screening, ACS Sensors (2021), 10.1021/ACSSENSORS.1C02022/SUPPL_FILE/SE1C02022_SI_001.PDF. [DOI] [PMC free article] [PubMed] [Google Scholar]
- [43].Sun D, Zhao Z, Spiegel S, Liu Y, Fan J, Amrollahi P, Hu J, Lyon CJ, Wan M, Hu TY, Dye-free spectrophotometric measurement of nucleic acid-to-protein ratio for cell-selective extracellular vesicle discrimination, Biosens. Bioelectron 179 (2021), 113058, 10.1016/j.bios.2021.113058. [DOI] [PMC free article] [PubMed] [Google Scholar]
- [44].Wu X, Kang Y, Wang Y-N, Xu D, Li D, Li D, Microfluidic differential resistive pulse sensors, Electrophoresis (2008), 10.1002/elps.200700912. [DOI] [PubMed] [Google Scholar]
- [45].Pei Y, Vogel R, Minelli C, Tunable resistive pulse sensing (TRPS). Characterization of Nanoparticles, Elsevier, 2020, pp. 117–136, 10.1016/B978-0-12-814182-3.00009-2. [DOI] [Google Scholar]
- [46].Maas SLN, Broekman MLD, de Vrij J, Tunable resistive pulse sensing for the characterization of extracellular vesicles, Methods Mol. Biol 1545 (2017) 21–33, 10.1007/978-1-4939-6728-5_2. [DOI] [PubMed] [Google Scholar]
- [47].Hoo CM, Starostin N, West P, Mecartney ML, A comparison of atomic force microscopy (AFM) and dynamic light scattering (DLS) methods to characterize nanoparticle size distributions, J. Nanopart. Res 10 (2008) 89–96, 10.1007/s11051-008-9435-7. [DOI] [Google Scholar]
- [48].Vogel R, Coumans FAW, Maltesen RG, Böing AN, Bonnington KE, Broekman ML, Broom MF, Buzás EI, Christiansen G, Hajji N, Kristensen SR, Kuehn MJ, Lund SM, Maas SLN, Nieuwland R, Osteikoetxea X, Schnoor R, Scicluna BJ, Shambrook M, de Vrij J, Mann SI, Hill AF, Pedersen S,A standardized method to determine the concentration of extracellular vesicles using tunable resistive pulse sensing, J. Extracell. Vesicles 5 (2016) 1–13, 10.3402/jev.v5.31242. [DOI] [PMC free article] [PubMed] [Google Scholar]
- [49].Billinge ER, Platt M, Multiplexed, label-free detection of biomarkers using aptamers and tunable resistive pulse sensing (AptaTRPS), Biosens. Bioelectron 68 (2015) 741–748, 10.1016/j.bios.2015.02.011. [DOI] [PubMed] [Google Scholar]
- [50].Shi L, He X, Ge J, Zhou T, Li T, Joo SW, The influence of electric field intensity and particle length on the electrokinetic transport of cylindrical particles passing through nanopore, Micro (Basel) 11 (2020) 722, 10.3390/mi11080722. [DOI] [PMC free article] [PubMed] [Google Scholar]
- [51].Rempfer G, Ehrhardt S, Holm C, de Graaf J, Nanoparticle translocation through conical nanopores: a finite element study of electrokinetic transport, Macromol. Theory Simul 26 (2017) 1600051, 10.1002/mats.201600051. [DOI] [Google Scholar]
- [52].Billinge ER, Platt M, Multiplexed, label-free detection of biomarkers using aptamers and tunable resistive pulse sensing (AptaTRPS), Biosens. Bioelectron 68 (2015) 741–748, 10.1016/j.bios.2015.02.011. [DOI] [PubMed] [Google Scholar]
Associated Data
This section collects any data citations, data availability statements, or supplementary materials included in this article.
Data Availability Statement
Data will be made available on request.


