

Abstract
Current theories propose that anxiety adversely impacts working memory (WM) by restricting WM capacity and interfering with efficient filtering of task-irrelevant information. The current study investigated the effect of shock-induced state anxiety on WM capacity and the ability to filter task-irrelevant neutral stimuli. We measured the contralateral delay activity (CDA), an event-related potential that indexes the number of items maintained in WM, while participants completed a lateralized change detection task. The task included low and high WM loads, as well as a low load plus distracter condition. This design was used to assess WM capacity for low and high loads and investigate an individual’s ability to filter neutral task-irrelevant stimuli. Participants completed the task under two conditions, threat of shock and safe. We observed a reduced CDA in the threat compared to the safe condition that was specific for high memory load. However, we did not find any differences in CDA filtering cost between threat and safe conditions. In addition, we did not find any differences in behavioral performance between the threat and safe conditions. These findings suggest that being in an anxious state reduces the neural representation for large amounts of information in WM, but have little effect on the filtering of neutral distracters.
Keywords: anxiety, contralateral delay activity (CDA), filtering cost, working memory capacity
1 |. INTRODUCTION
Anxiety disorders are one of the most prevalent mental health disorders (Bandelow & Michaelis, 2015) and are associated with substantial social, emotional, and economic costs (Collins et al., 2011; Kessler, Petukhova, Sampson, Zaslavsky, & Wittchen, 2012). These costs likely come, at least in part, as the result of alterations in cognitive functioning in anxious individuals (Johnston, Westerfield, Momin, Phillippi, & Naidoo, 2009; Lépine, 2002; Robinson, Vytal, Cornwell, & Grillon, 2013; Vytal, Cornwell, Arkin, Letkiewicz, & Grillon, 2013). Indeed, cognitive disruptions have been shown to play a causal role in anxiety (Bar-Haim, Lamy, Pergamin, Bakermans-Kranenburg, & Van Ijzendoorn, 2007). Thus, clarifying the neurocognitive mechanisms underlying the relationship between anxiety and cognition may enhance understanding of this key risk factor for the development and maintenance of anxiety (Beck & Clark, 1997; Mathews & MacLeod, 2005; Ouimet, Gawronski, & Dozois, 2009).
One cognitive domain that has received considerable attention regarding its relationship with anxiety is working memory (WM; Moran, 2016; Vytal et al., 2013). WM is a limited-capacity system that allows for the active representation and manipulation of information over a brief interval of time (Baddeley, 2012; Cowan, 2010, 2017). Because the capacity of this system is finite, it is critical that individuals maintain sufficient WM store needed to complete ongoing tasks. Competition for access to WM occupies this finite reserve and thus may impair performance on tasks requiring WM.
Prominent theories have posited that anxiety restricts WM capacity, and may thus impair cognitive performance (see Moran, 2016). This restriction of WM capacity can be explained by the interference between anxiety and task-related processes (Berggren & Derakshan, 2013; Derakshan & Eysenck, 2009; Eysenck & Derakshan, 2011; Eysenck, Derakshan, Santos, & Calvo, 2007). For instance, Eysenck’s Attentional Control Theory (ACT), and an earlier theory by Sarason (1988), proposes that worrisome thoughts, a hallmark feature of anxiety (Barlow, 2004; Borkovec, Robinson, Pruzinsky, & DePree, 1983; Moran, 2016; Nitschke, Heller, Imig, McDonald, & Miller, 2001), consume WM resources. This reduces the WM cache available to dedicate to current goal-directed tasks. In addition, this reduction in WM store due to anxious worry reduces the ability to actively inhibit distracting information (Berggren & Derakshan, 2013; Derakshan & Eysenck, 2009; Eysenck & Derakshan, 2011; Eysenck et al., 2007). Thus, anxious thoughts gain access to WM, restricting the capacity of cognitive resources that would normally be committed to the completion of tasks (Moran, 2016). This reduction in resources also affects attentional inhibition, reducing one’s ability to effectively filter distracters, particularly for task-irrelevant threatening information.
In accordance with this theoretical framework, an abundance of behavioral and neurological evidence indicates that anxiety reduces WM capacity for task-relevant information (Ashcraft & Kirk, 2001; Darke, 1988; Hayes, Hirsch, & Mathews, 2008; Leigh & Hirsch, 2011; Moran, 2016; Qi, Chen, et al., 2014; Sari, Koster, & Derakshan, 2017; Stout & Rokke, 2010; Yao, Chen, & Qian, 2018; Yoon, LeMoult, Hamedani, & McCabe, 2018). Although some have proposed that low WM loads are more likely to be disrupted by anxiety (i.e., Two-Component Model; Vytal, Cornwell, Arkin, & Grillon, 2012), others have found that high loads are more likely to be impacted by anxiety (Ashcraft & Kirk, 2001; Eysenck & Calvo, 1992; Eysenck et al., 2007; Lavric, Rippon, & Gray, 2003; Qi, Zeng, et al., 2014; Shackman et al., 2006). These findings suggest that anxiety is more likely to affect more effortful and cognitively demanding tasks. In addition to disrupted WM capacity, others have also found that anxiety is associated with deficits in the filtering of both threatening (Stout, Shackman, Johnson, & Larson, 2015; Stout, Shackman, & Larson, 2013; Stout, Shackman, Pedersen, Miskovich, & Larson, 2017) and neutral (Berggren, Curtis, & Derakshan, 2017; Moriya & Sugiura, 2012; Qi, Ding, & Li, 2014; Stout & Rokke, 2010) distracters from gaining access to WM. Although anxiety’s disruptive effects on WM have been well demonstrated on WM tasks involving spatial and phonological modalities, the evidence regarding anxiety’s effect on visual WM capacity is inconsistent (see Moran, 2016). Although previously mentioned work identified deficits in visual WM associated with anxiety (Qi, Chen, et al., 2014; Sari et al., 2017; Stout & Rokke, 2010; Yao et al., 2018), others have found that anxiety, specifically social anxiety, improved visual WM capacity (Moriya & Sugiura, 2012). However, it should be noted that Moriya and Sugiura’s (2012) work included socially anxious university students in East Asia and that their findings may instead reflect an interaction between culture and type of anxiety. Alternatively, as Moran (2016) pointed out, it is possible that the measures used to assess social anxiety are not psychometrically valid across cultures, and thus reflect different constructs.
To complicate the findings regarding anxiety and visual WM further, much of this work has focused on dispositional trait anxiety (Bishop, 2007; Eysenck, Payne, Derakshan, 2005; Moran, 2016; Stout et al., 2015), while little to no work has investigated how an anxious state impacts these processes. This is critical given that state anxiety may differentially impact these cognitive processes compared to trait anxiety (Bishop, Jenkins, & Lawrence, 2006; Mathews & MacLeod, 1985; Mogg, Mathews, & Weinman, 1989; Pacheco-Unguetti, Acosta, Callejas, & Lupiáñez, 2010; Rutherford, MacLeod, & Campbell, 2004). For example, Bishop and colleagues (2006) found that different neural circuits were implicated in response to threat distracters in association with state versus trait anxiety. Thus, the mechanisms underlying efficient filtering may differ between trait and state anxiety. In addition, understanding how visual WM capacity and distracter filtering are impacted by state anxiety may inform how WM deficits in trait anxiety are further amplified when state anxiety is activated. Last, the impact of state anxiety may have deleterious consequences on cognitive performance even among those without high trait anxiety. Thus, it is important to understand not just relations between trait anxiety and WM performance, but the impact of actively being in an anxious state has on these cognitive processes.
The few studies that have examined the effects of state anxiety on WM capacity and distracter filtering have yielded contradictory findings (Lapointe et al., 2013; Moriya & Sugiura, 2012; Stout & Rokke, 2010). For instance, two studies found that state anxiety was related to inefficient distracter filtering and reduced WM capacity (Lapointe et al., 2013; Stout & Rokke, 2010). In contrast, Moriya and Sugiura (2012) demonstrated that state anxiety had no association with WM capacity. Of note, none of these studies induced state anxiety, rather they examined relations between WM performance and self-reported state anxiety. Thus, at this juncture, it is unclear how an active state of current anxiety impacts WM capacity, specifically in the visual domain, or the filtering of task-irrelevant information.
The current study aimed to address this gap in knowledge by inducing an anxious state and investigating the effect this manipulation has on visual WM capacity and the ability to filter task-irrelevant neutral stimuli. State anxiety was manipulated using the threat of unpredictable shock, which is a well-validated translational method for inducing anxiety that mimics the symptoms of anxiety disorders (Aylward & Robinson, 2017; Robinson, Charney, Overstreet, Vytal, & Grillon, 2012; Robinson et al., 2013, 2014). We recorded event-related potentials (ERPs) during a lateralized change detention task in order to measure neural activity associated with visual WM capacity and the filtering of neutral distracters. Specifically, we focused on the contralateral delay activity (CDA), an ERP component that indexes the number of visual items stored in WM and reaches asymptote at the maximum number of items able to be stored (Vogel & Machizawa, 2004). Thus, the CDA serves as a measure of visual WM capacity (Gao, Yin, Xu, Shui, & Shen, 2011; Ikkai, McCollough, & Vogel, 2010; McCollough, Machizawa, & Vogel, 2007). The CDA can also be used to assess whether task-irrelevant distracters gain access to WM, which is indicative of inefficient filtering (Vogel, McCollough, & Machizawa, 2005).
We hypothesized that state anxiety would restrict visual WM capacity, particularly for high WM loads, indicated by a reduced CDA amplitude for larger loads. This is based on prior work indicating that anxiety is more likely to impact cognitively demanding tasks (Ashcraft & Kirk, 2001; Eysenck & Calvo, 1992; Eysenck et al., 2007; Lavric et al., 2003; Qi, Zeng, et al., 2014; Shackman et al., 2006). In addition, we expected to find that state anxiety filtering, resulting in enhanced unnecessary storage of distracters during the threat of shock (Lapointe et al., 2013; Stout & Rokke, 2010). These findings would be consistent with ACT, which argues that anxiety is associated with inefficient inhibition of task-irrelevant information (Berggren & Derakshan, 2013; Derakshan & Eysenck, 2009; Eysenck & Derakshan, 2011; Eysenck et al., 2007). Overall, these findings would suggest that anxiety associated with anticipating an unpredictable threat impairs the ability to filter distracting information and store task-relevant memoranda (Moran, 2016).
Our behavioral hypotheses were driven by another tenet of ACT, that anxious individuals are more likely to demonstrate processing efficiency alterations than impaired task performance (Berggren & Derakshan, 2013; Derakshan & Eysenck, 2009; Eysenck & Derakshan, 2011; Eysenck et al., 2007). Specifically, ACT posits that anxious individuals engage in greater recruitment of cognitive resources in order to maintain task performance. Therefore, behaviorally, we hypothesized that performance efficiency, indexed by response time (RT), would be impaired due to the threat of shock. This is because the shock-induced anxious state is expected to impair processing efficiency, or the speed to make a response. This finding would be consistent with prior work showing increased response times associated with anxiety on a variety of WM tasks (Ashcraft & Kirk, 2001; Lavric et al., 2003; Richards, French, Keogh, & Carter, 2000). In contrast, we predicted that performance effectiveness, reflected by task accuracy and WM capacity for targets (measured with Pashler’s K, Pashler, 1988; Rouder, Morey, Morey, & Cowan, 2011), would be similar for the threat of shock and safe conditions. However, it is also possible that we would also observe deficits in accuracy and Pashler’s K score for larger loads in the threat of shock condition, as seen in some previous work (Lavric et al., 2003; Shackman et al., 2006).
2 |. METHOD
2.1 |. Power analysis
We conducted a power analysis using G*Power (Faul, Erdfelder, Buchner, & Lang, 2009; Faul, Erdfelder, Lang, & Buchner, 2007) to ensure that we obtained a sample size that was adequately powered to detect predicted differences between our conditions. Briefly, our experimental design was a 2 (Threat or Safe) × 3 (Low Load, Distracter Load, High Load) within-subjects design. As our main analytic approach, we used repeated-measures ANOVA, in which we predicted interaction of condition and load for the CDA. We used a conservative estimate and assumed a small effect size for this interaction. Using this effect size, power of .8, and an of .05, the power analysis indicated a required sample size of 54.
2.2 |. Participants
Seventy-five undergraduates (50 Female; Mage = 23.00, SE = 0.65) were recruited from the University of Wisconsin-Milwaukee to complete the study in exchange for course extra credit and a $15 Amazon gift card. Participants were at least 18 years old, proficient in English, and had no visual impairments. Participants gave written informed consent prior to the start of the experiment in accordance with procedures approved by the university’s Institutional Review Board. Fifteen participants were excluded from data analyses due to experiment withdrawal (three), technical difficulties (three), or because more than 20% of ERP epochs (trials) were unusable due to artifact (nine). This resulted in a sample size of 60 participants for final analyses (38 Female; Mage = 22.86, SE = 0.59).
2.3 |. Materials and procedure
2.3.1 |. Lateralized change detection task
Participants completed a lateralized change detection task analogous to that used by Vogel and colleagues (2005). We used this task to assess the quantity of visual content maintained in WM and examine the impact task-irrelevant neutral distracters had on filtering efficiency under threat of shock (i.e., threat) and safe conditions. The task was lateralized (i.e., set of stimuli in the left and right visual fields) to allow us to measure the CDA, which requires taking a difference score for activity contralateral versus ipsilateral to the memoranda array (Vogel & Machizawa, 2004; Vogel et al., 2005).
Participants were presented with a display consisting of these two lateralized stimulus arrays within 4.1° × 7.72° rectangular regions, and 3° to the left and right from the center fixation point. Participants were cued to attend to one side of the array of colored bars (each 0.41° × 1.42°), which were randomly presented in any of four orientations (vertical, horizontal, left 45°, and right 45°). They were required to remember the orientation of the red rectangular bars presented, while ignoring the blue rectangular bars in the cued hemifield, and ignoring all bars on the non-cued hemifield, similar to previous change detection task designs (Qi, Ding, et al., 2014; Vogel et al., 2005). The number of target and distracter stimuli was equal in both hemifields. The location and orientation of the rectangles were randomized, but were at least 2° from one another center to center. All rectangle colors were matched for luminosity (Red & Blue = 120 each for L in the HSL color model). Each trial (total time of 5 s; Figure 1) began with a fixation cross and an arrow above indicating the side of the display to attend to for that trial, followed by fixation for 200–400 ms (jittered).
FIGURE 1.
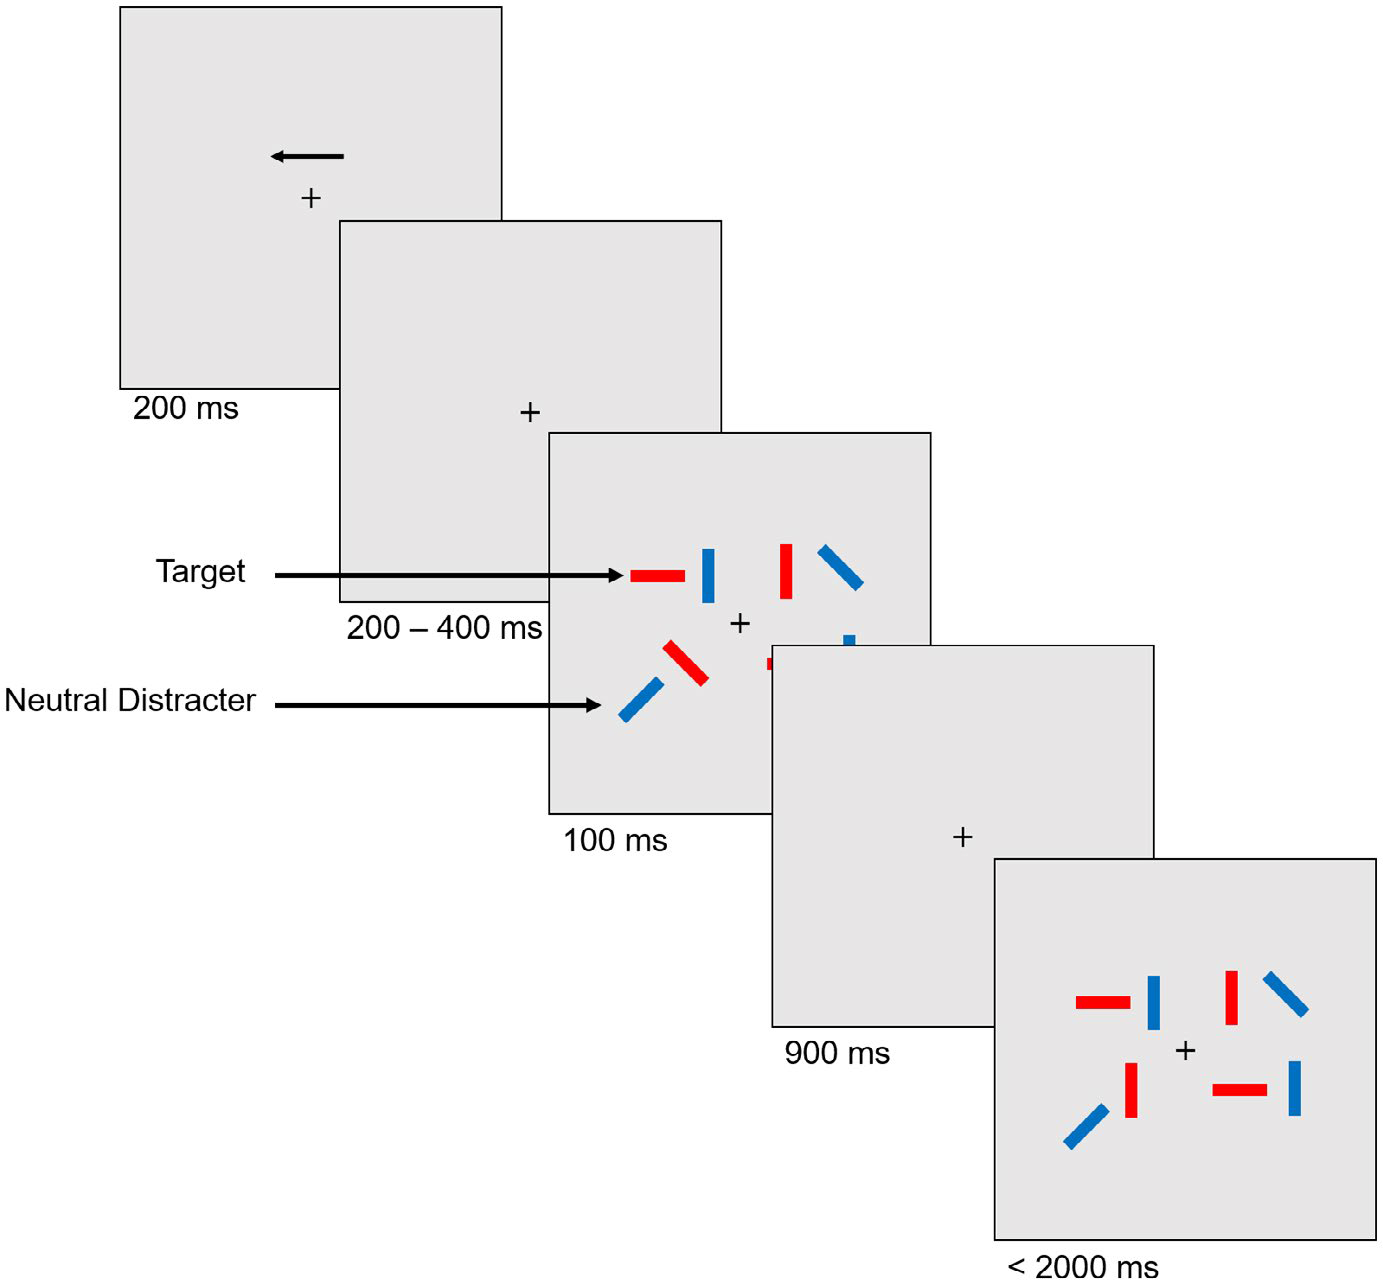
Lateralized change detection task requiring participants to attend to the orientation of target bars (red) in the cued hemifield while ignoring other colored distracter bars (blue). Loads varied with two targets, two targets and two distracters (example shown here), and four targets
Next, the stimulus array was presented for 100 ms, followed by a 900 ms maintenance delay period, and lastly the probe display for 2,000 ms (or until response). During the probe display participants indicated on a keyboard with their right hand whether or not there was a 45° change in orientation within one of the target rectangles (“1” for no change, and “2” for a change). Trials were separated by a 1,500 ms inter-trial interval.
The lateralized change detection task consisted of three loads: Two targets (NT2), two targets and two distracters (ND), and four targets (NT4). The presentation of these different loads and whether a change occurred or not between the array and probe was randomized throughout the task. The task was completed under two separate conditions: threat of shock and safe. Participants first completed a practice session consisting of 15 trials (5 trials per load), with instructions and feedback regarding performance. Prior to continuing to the test phase of the task, participants were assessed to ensure they understand how to perform the task. No shocks were administered during the practice phase of the study. During the test phase, there were 160 trials for each load for both threat and safe conditions, yielding a total of 960 trials (480 trials in the threat of shock and 480 trials in the safe conditions). Half of the trials consisted of a change in orientation between the initial array and the probe, and for the other half, there was no change. Trials were segmented into 60 trials per block for a total of 16 blocks, 8 blocks in the threat, and 8 blocks in the safe conditions. Threat and safe blocks occurred sequentially (i.e., participants completed all eight blocks under threat of shock before completing eight safe blocks, or vice versa), order counterbalanced across subjects. This design was used to prevent potential repeated carry-over effects from the threat condition that may be present in a randomized block design (see Pedersen & Larson, 2016).
2.3.2 |. Shock administration
Participants were attached to the shock stimulation device only during the threat condition blocks, and the equipment was removed prior to the completion of the safe condition blocks. Shocks were administered at random and unpredictable time points across each block (3 shocks per block, 24 total shocks). Trials containing shocks were removed prior to data analysis.
Shocks were administered using Psychlab’s SHK1 Pain Stimulation Shocker (Contact Precision Instruments, Cambridge, MA). Stimulation was delivered through two electrodes placed approximately 2 inches above the participants’ right ankle using double-sided tape and conductive gel. Before completing the threat condition, participants were attached to the shock stimulation equipment, and completed an initial shock work-up to identify individual levels of electrical stimulation (i.e., shock) that they categorized as “painful, but tolerable.” During the shock work-up participants were informed that they would receive a mild electrical shock, and were asked to rate it on a scale from one to seven (“1 meaning you can’t feel it at all” and “7 meaning that it is painful, but tolerable”). After a participant’s ideal level seven of shock was identified, that shock level was set for the duration of the threat condition during the change detection task. In order to prevent habituation to the shocks, and ensure that the threat of shock remained aversive throughout the eight shock blocks, the experimenter asked the participant after each block if they still rated the shock at the ideal level of 7, and if not then the shock intensity was adjusted accordingly. Every participant increased their shock at least once and by 10 units (each unit approximately 0.2 mA).
2.3.3 |. Subjective ratings
At the end of each block, participants completed a short self-report rating to gauge their level of anxiety throughout the task. They were asked to indicate, on a scale of one to seven (“1 being not at all anxious” and “7 being very much anxious”) how anxious they felt during the preceding block of trials. An additional one to seven (“1 being not at all aversive” and “7 being very much aversive”) self-report rating was included at the end of the threat condition blocks to assess how aversive the shocks felt during that set of blocks.
2.3.4 |. Behavioral data
Our primary behavioral variables included response time (RT) in ms, accuracy (percentage correct), and Pashler’s K scores. Pashler’s K is an estimate of WM capacity for target stimuli (Pashler, 1988). We used Pashler’s formula instead of Cowan’s (2001) K formula due to the use of whole-probe versus single-probe displays in our change detection task (see Rouder et al., 2011). Pashler’s formula for K is as follows: K = N × (HR − FA)/(1 − FA). In this formula K represents WM capacity, N is the number of to-be-remembered target items, HR is the hit rate (i.e., the proportion of correct responses made when a change occurs), and FA is the false alarm rate (i.e., the proportion of incorrect responses made when no change occurs).
Trials with RTs below 150 ms were removed from further analysis, and only correct trials were used to calculate RT. This was done to remove potential random responding (e.g., simply pressing a response without trying) and trials in which no response was made (i.e., trials with RTs of 0 ms).
In addition to K scores for each condition, we also used Pashler’s K scores to examine behavioral indices of filtering cost, or the unnecessary storage of distracters. Specifically, we calculated K filtering cost (K FC) with the following formula: K FC = K ND – K NT2. As such, a higher K FC value would indicate greater unnecessary storage of distracters, and thus greater filtering cost.
2.3.5 |. Electroencephalography data acquisition and processing
Electroencephalographic (EEG) data were recorded using an asalab™ EEG system with a 32 Ag-AgCl electrode fitted nylon cap (Advanced Neuro Technologies B.V., Netherlands) referenced to the left mastoid. Impedances were kept below 10 kΩ, and data were notch filtered (50 Hz). The antialiasing low pass filter was set at 102.4 Hz, with no high pass filter as this system uses a true DC amplifier. The slope for online filtering was 24 dB/oct, and all signals were digitized at 512 Hz. Horizontal and vertical electrooculogram (EOG) activity was recorded from electrodes placed on the left and right outer canthi and above and below the left eye, respectively. ERP analyses were conducted using EEGLAB (Delorme & Makeig, 2004) and ERPLAB (Lopez-Calderon & Luck, 2014). Raw EEG data were cleaned to remove non-task-related data and interpolate faulty channels. Data were then re-referenced to the mean of the left and right mastoids and filtered with a Butterworth band-pass of 0.01–30 Hz (24 db/octave). Independent component analyses were run using EEGLAB’s runica routine. Components representing blink artifacts were identified based on the visual inspection and removed from the EEG data. ERP data were segmented at −200 to 1,200 ms from the onset of the target array with a 200 ms baseline correction. Trials with residual eye blink f(VEOG exceeding ±70 μV) and saccades (HEOG exceeding ±40 μV) from −50 to 150 ms from the onset of the array were discarded. In addition, channels showing excessive movement (all channels exceeding ±70 μV) across the entire trial were removed from further processing. Prior to removing participants exceeding the artifact rejection threshold, an average of 119.34 (M = 12.41%, SE = 1.43) of the total 960 trials (160 trials per condition) were rejected. Following participant removal due to artifact rejection, an average of 85.82 (M = 8.94%, SE = 0.63) of the total 960 trials were rejected. Final analyses included an average of 125.77 (SE = 1.907) trials for the ND load in the safe condition, 116.90 (SE = 2.45) trials for the ND load in the threat condition, 130.18 (SE = 1.71) trials for the NT2 load in the safe condition, 120.25 (SE = 2.27) trials for the NT2 load in the threat condition, 108.82 (SE = 1.96) trials for the NT4 load in the safe condition, and 110 (SE = 2.12) trials for the NT4 load in the threat condition.
2.3.6 |. CDA quantification
The CDA component was calculated by taking the difference between contralateral and ipsilateral waveforms at parietal-occipital channel clusters (O1/O2, P3/P4, and P7/P8), as seen in prior work (McCollough et al., 2007; Qi, Chen, et al., 2014; Qi, Ding, et al., 2014; Vogel & Machizawa, 2004; Vogel et al., 2005). Specifically, the difference between waveforms contralateral to the display (i.e., right hemisphere waveforms when the stimuli are in the left visual field) and waveforms ipsilateral to the display (i.e., left hemisphere waveforms when the stimuli are in the left visual field) was computed over these channels of interest (Figure 2).
FIGURE 2.

Contralateral and ipsilateral waveforms across set-sizes for both threat and safe condition
Contralateral minus ipsilateral difference scores were first calculated for each channel pair (e.g., O1/O2) and then averaged across the three electrode pairs to create the final CDA values used for analyses. These CDA values were quantified as the mean amplitude between 400 and 900 ms following the onset of the array for each condition, representative of the WM retention interval (Vogel & Machizawa, 2004; Vogel et al., 2005). Only correct trials were used to calculate CDA.
CDA filtering cost was calculated in a similar manner as K score filtering cost: ND – NT2. Because this formula considers the difference between two negative values (i.e., distracter load CDA – low load CDA), more positive values reflect less filtering cost while more negative values reflect greater filtering cost.
2.3.7 |. Statistical analyses
The dependent variables were RT, accuracy, Pashler’s K, CDA, and CDA filtering efficiency. The impact of state anxiety on CDA, RT, accuracy, and Pashler’s K was tested using a multiple 2 (threat and safe conditions) × 3 (NT2, ND, and NT4 loads) repeated-measures ANOVAs with Greenhouse-Geisser adjustments. A separate ANOVA was conducted for each dependent variable. Significant interactions and main effects were decomposed using Bonferroni corrected pairwise comparisons. Paired samples t-tests were conducted to analyze differences in subjective anxiety ratings and examine differences in CDA filtering efficiency scores across the threat and safe conditions.
3 |. RESULTS
3.1 |. Subjective anxiety & shock ratings
Paired sample t-tests revealed that anxiety ratings were higher in the threat condition compared to the safe condition, (Figure 3a). Average shock aversiveness ratings were approximately 5.04 (SE = 0.02; Figure 3b).
FIGURE 3.

Lateralized change detection task behavioral results. Error bars represent standard error. (a) Anxiety ratings were greater in the threat condition compared to the safe condition. (b) Average shock intensity ratings across the threat condition. (c) Accuracy was greater for participants in the NT2 load compared to the ND and NT4 loads, regardless of condition. (d) RT was fastest for participants in the NT2 load compared to the ND and NT4 loads, regardless of condition. RTs in ND and NT4 did not differ. Change in RT across loads (e.g., NT2 to ND, and NT2 to NT4) significantly differed between conditions. (e) Pashler’s K scores were greatest in the NT4 load compared to the NT2 and ND loads, regardless of condition. K scores in the ND load were significantly lower than the NT2 load
Using a Pearson’s correlation test, we found that higher shock aversiveness ratings were correlated with higher anxiety ratings in the threat condition, .
3.2 |. Behavioral results
3.2.1 |. Accuracy
The repeated-measures ANOVA for accuracy revealed a significant main effect of load, (Figure 3c). Follow-up pairwise comparisons showed that accuracy for NT2 was significantly greater than for ND and NT4 . NT4 performance was significantly worse than ND performance . Thus, accuracy was worse at higher loads and in the presence of distracters. There was no significant main effect of condition , nor condition by load interaction,
3.2.2 |. Response time
As would be expected the ANOVA for RT revealed a main effect of load, .Follow-up pairwise comparisons demonstrated that RT in NT2 was faster than in the ND and NT4 loads. However, RT did not differ between ND and NT4 loads, , . As with accuracy, response times were adversely affected by higher load and distracters. There was no main effect for condition, . There was, however, a significant interaction between condition and load, (Figure 3d). In decomposing this interaction we found a significant main effect of load in the safe condition, . Pairwise comparisons within the safe condition found that RTs were significantly faster in NT2 than ND and NT4, . However, RTs did not differ between ND and NT4 in the safe condition. The same pattern held for the threat condition. There was a main effect of load, , that was driven by significantly faster RTs for NT2 than ND and NT4 . As with the safe condition, there was no difference in RT between ND and NT4 . Post-hoc analyses indicated that although RTs did not differ between safe and threat conditions in the NT2 , nor NT4 loads, the change in RT across these loads differed by condition. Specifically, there was a larger difference in RT between the low load (NT2) compared to ND and NT4 in the safe condition compared to the threat condition.
3.2.3 |. Pashler’s K
The repeated-measures ANOVA for Pashler’s K scores yielded a significant main effect of load, (Figure 3e), such that K scores for NT4 were significantly greater than NT2 , and ND . In addition, K scores were greater for NT2 compared to ND . Thus, as would be expected, distracters impaired the storage of target items. There was no main effect of condition , nor condition by load interaction, .
3.2.4 |. Pashler’s K filtering cost
Paired sample t-tests revealed that K filtering cost (K ND – K NT2) did not differ between the safe and threat conditions, . Follow-up Bayesian analyses revealed considerable evidence for the null hypothesis. Thus, behaviorally we did not find any differences in filtering cost between conditions.
3.3 |. EEG results
3.3.1 |. CDA amplitude
CDA waveforms for all loads for both the threat and safe conditions are presented in Figure 4.
FIGURE 4.

Lateralized change detection task CDA waveforms. (a) Safe condition, and (b) threat condition
In order to verify that we obtained a valid CDA representative of different loads, we conducted an initial repeated-measures ANOVA on the safe condition CDA amplitudes for NT2, ND, and NT4 loads. Results revealed a significant main effect, . The NT4 load was significantly more negative than the NT2 load. However, ND did not differ from NT2 , nor NT4 loads. An additional Pearson’s r correlation coefficient found a negative correlation between Pashler’s K scores and CDA amplitudes in the safe condition for the NT4 load, . As the CDA values become increasingly negative, individual Pashler’s K scores increased. Thus, we recaptured the common CDA effect in that greater visual loads corresponded to increased negative amplitude. However, K scores and CDA amplitudes in the NT4 load for the threat condition were not correlated, .
Next, we examined the effect the threat condition had on the CDA waveforms with a Condition (threat, safe) × Load (NT2, ND, NT4) repeated-measures ANOVA. The ANOVA revealed a main effect of load, (Figure 5a). Average (i.e., across both threat of shock and safe conditions) NT2 CDA amplitude was significantly lower than that for ND , and approached significance for being lower than that for NT4 CDA (t(59) = 2.392 p = .060). ND and NT4 loads did not differ in CDA amplitude (t(59) = 0.292, p > .99).
FIGURE 5.

Lateralized change detection task EEG results. Error bars represent standard error. (a) CDA amplitudes show a condition by load interaction, in which NT4 load CDA is significantly reduced in the threat condition compared to the safe condition. (b) CDA filtering cost did not differ between safe and threat conditions
We also identified a main effect of Condition , in which CDA amplitude was significantly reduced in the threat condition. This effect was further explained by the significant condition by load interaction, . Additional analyses found that this interaction was driven by differences in the NT4 load, in which the threat condition CDA amplitude was significantly reduced compared to the CDA amplitude in the safe condition, . There were no significant differences between threat and safe conditions for NT2 or ND .
3.3.2 |. CDA filtering cost
Paired sample t-tests revealed that CDA filtering cost (ND – NT2) did not differ between the safe and threat conditions, t(59) = 0.891, p = .377, d < .001 (Figure 5b). Follow-up Bayesian analyses (BF10 = .206) revealed considerable evidence for the null hypothesis. Thus, the CDA filtering cost does not appear to be significantly impacted by the threat of shock.
3.4 |. Exploratory post-hoc analyses: Magnitude of attenuation in threat condition
As noted above CDA and K scores for NT4 were not correlated in the threat condition. We conducted an additional exploratory analysis to examine if the magnitude of CDA attenuation under threat was related to the reduction in Pashler’s K score in the threat condition. This was calculated by taking the difference between safe and threat condition NT4 for both CDA and K scores (e.g., NT4 CDA Safe – NT4 CDA Threat). The resulting CDA value was then multiplied by −1 so that larger difference scores for both CDA and K would reflect more reduced WM capacity in the threat compared to safe condition (i.e., greater attenuation of behavioral and CDA estimates of WM capacity). We then conducted a Pearson’s r correlation between these two variables (Pashler’s K attenuation score and CDA attenuation score), which indicated a significant association between the attenuation scores, r(58) = .454, p < .001 (Figure 6). This suggests that as CDA amplitude is reduced for the higher load during the threat condition, behavioral estimates of WM capacity (i.e., Pashler’s K scores) also decrease.
FIGURE 6.

Attenuation correlation between decreases in CDA amplitude and Pashler’s K score from the safe to threat condition in NT4
4 |. DISCUSSION
Despite prior work showing that anxiety restricts WM capacity for task-relevant information (Ashcraft & Kirk, 2001; Darke, 1988; Hayes et al., 2008; Leigh & Hirsch, 2011; Moran, 2016; Qi, Chen, et al., 2014; Sari et al., 2017; Stout & Rokke, 2010; Yao et al., 2018; Yoon et al., 2018) and can produce deficits in distracter filtering (Berggren et al., 2017; Moriya & Sugiura, 2012; Qi, Ding, et al., 2014; Stout & Rokke, 2010; Stout et al., 2013, 2015, 2017), little is known of the effects an anxious state has on these mechanisms, in particular for visual WM. Thus, we sought to address this gap in the literature by investigating the effects shock-induced state anxiety has on visual WM capacity, and filtering efficiency of neutral distracters.
Consistent with our hypotheses concerning CDA amplitudes, we observed a significant reduction in CDA during the threat compared to the safe condition that was specific for the more demanding load (i.e., NT4). This reduction in visual WM capacity is consistent with others who have shown reduced CDA amplitudes in anxiety and related processes, albeit for high trait anxious individuals (Qi, Chen, et al., 2014), individuals experiencing an unpleasant emotional state (Fig ueira et al., 2017), and individuals with lower WM capacity experiencing negative emotionality (Zhang, Zhang, & Liu, 2017). Given that the CDA reflects the active maintenance of visual information across a WM delay period (Gao et al., 2011; Ikkai et al., 2010; McCollough et al., 2007; Vogel & Machizawa, 2004), this reduction in CDA amplitude suggests that the quantity of items maintained in WM is reduced for larger loads (i.e., NT4) in the threat condition. However, CDA amplitudes for the low load (i.e., NT2) and distracter load (i.e., ND) did not significantly differ between the threat and safe conditions. Our findings are consistent with others who have also found reduced WM capacity in anxious individuals (Berggren, Koster, & Derakshan, 2012; Ng & Lee, 2015; Owens, Derakshan, & Richards, 2015; Qi, Chen, et al., 2014; Qi, Zeng, et al., 2014), and support the notion that anxiety is most disruptive when WM load is high (Ashcraft & Kirk, 2001; Eysenck & Calvo, 1992; Eysenck et al., 2007; Lavric et al., 2003; Qi, Zeng, et al., 2014; Shackman et al., 2006). This reduction in WM capacity for larger amounts of information may be due to difficulties focusing on a larger number of items (Luck & Vogel, 2013), possibly reflecting attentional control deficits (Barrett, Tugade, & Engle, 2004). This effect is likely due to anxious thoughts, such as worry, occupying WM storage, diminishing the availability of WM to maintain information (Berggren & Derakshan, 2013; Derakshan & Eysenck, 2009; Eysenck & Derakshan, 2011; Eysenck et al., 2007). Therefore, our results support current views proposing that an anxious state impacts WM by restricting one’s overall WM capacity (Moran, 2016).
Alternatively, it is also possible that this reduced CDA for the higher load during threat, along with the lack of effect of anxiety on Pashler’s K scores reflects more efficient WM processes, specifically for high loads in anxious individuals. This pair of findings may suggest that individuals in the threat condition require less sustained visual representation in order to attain the same behavioral outcomes as those in a safe condition. Furthermore, we did not observe an association between Pashler’s K scores and CDA amplitude in the threat condition. However, it is also important to consider that we did observe a significant relationship between the degree of attenuation in behavioral and neural measures of WM capacity in the threat condition (relative to safe) for the larger load. Specifically, although we failed to observe significant behavioral differences in Pashler’s K scores between threat and safe conditions, as CDA indices of capacity decreased as a function of threat for the high load so did behavioral indices (K scores). This suggests that the group analyses of behavior were not sensitive in detecting individual differences in threat’s influence on WM capacity.
Surprisingly, we did not observe any differences in the CDA filtering cost between the threat and safe conditions. This contradicts prior behavioral (Berggren et al., 2017; Moriya & Sugiura, 2012; Stout & Rokke, 2010) and EEG (Qi, Ding, et al., 2014) reports showing deficits in the filtering of neutral distracters in anxious individuals. It is also important to note that many of the studies examining neutral filtering abilities (Berggren et al., 2017; Moriya & Sugiura, 2012; Stout & Rokke, 2010) examined this ability in association with self-reported state anxiety, whereas we manipulated state anxiety using the threat of shock. Furthermore, the sample collected by Qi, Ding, et al. (2014) consisted of individuals scoring in the upper percentiles of high trait anxiety, not state anxious individuals. It is possible that state anxiety would more substantially impact filtering among individuals higher in trait anxiety, who are likely to experience inhibition deficits (Derakshan & Eysenck, 2009; Eysenck & Derakshan, 2011; Eysenck et al., 2007). Although trait and state anxiety are related, prior reports have indicated that they may impact various neurocognitive mechanisms differentially (Bishop et al., 2006; Mathews & MacLeod, 1985; Mogg et al., 1989; Pacheco-Unquetti et al., 2010; Rutherford et al., 2004). Therefore, we conclude that state anxiety, induced through direct and unpredictable electrical shocks, does not significantly impair one’s ability to filter task-irrelevant neutral distracters from gaining access to WM, at least with the loads used in this study.
Another important consideration concerning our null CDA filtering cost results involves the methodological and conceptual differences between a temporally unpredictable external environmental threat, such as the threat of shock, and a direct threatening stimulus, such as an angry face. For example, many studies examining the influence of threatening stimuli impose threat associations with specific task materials (e.g., angry faces; Bar-Haim et al., 2007; Bishop, 2007; Cisler & Koster, 2010; Cox, Christensen, & Goodhew, 2018; Fox, Dutton, Yates, Georgiou, & Mouchlianitis, 2015; Kim et al., 2018; Klumpp et al., 2018; Morriss, McSorley, & Van Reekum, 2018; Raeder et al., 2018; Wieser, Hambach, & Weymar, 2018). WM tasks that have examined distracter filtering also measured the filtering of threat-related stimuli (Stout et al., 2013, 2015, 2017). However, threat-related stimuli likely impact CDA and behavioral indices of storage and filtering differently than an ongoing threatening context or situation, such as the threat of shock manipulation used here. The CDA may reveal unnecessary storage, or poor filtering, of threatening stimuli because of its specific sensitivity to the maintenance of visual stimuli (e.g., Gao et al., 2011; Ikkai, McCollough, & Vogel, 2010; McCollough et al., 2007). In contrast, a contextual threat, such as the sustained threat of random electrical shock, does not contain visual features, and thus the CDA is not a sensitive index of storage of this information. This may explain the lack of filtering effects observed during the anxious state in the current study. Future research should further investigate this interaction between an anxious state and the filtering of neutral versus anxiety-related stimuli.
Consistent with our ERP results, we found null results for the effect of anxiety on our behavioral filtering measure, Pashler’s K score filtering cost, which is inconsistent with prior behavioral work (Berggren et al., 2017; Moriya & Sugiura, 2012; Stout & Rokke, 2010). It is important to note that many of the studies examining neutral distracter filtering (Berggren et al., 2017; Moriya & Sugiura, 2012; Stout & Rokke, 2010) examined this ability in association with self-reported state anxiety, whereas we manipulated state anxiety using the threat of shock. It also may be the case that behavioral filtering deficits are only observed under larger target loads than that used in the current study. In addition, it is also possible that state anxiety would more substantially impact behavioral filtering measures among individuals higher in trait anxiety, who are likely to experience inhibition deficits (Derakshan & Eysenck, 2009; Eysenck & Derakshan, 2011; Eysenck et al., 2007).
Previous work has found that visually threatening stimuli are difficult to filter (Bar-Haim et al., 2007; Bishop, 2007; Cisler & Koster, 2010; Kim et al., 2018; Klumpp et al., 2018; Morriss et al., 2018; Raeder et al., 2018), and this deficit is enhanced in anxious individuals. The ability of threatening information to attract attention away from current tasks is sometimes advantageous. This is because threatening stimuli present important information regarding an organism’s environment (Ekman, 1992; LeDoux, 2003; Öhman, Lundqvist, & Esteves, 2001). Therefore, it is crucial that individuals focus on non-task relevant threatening information, as detection of this information may increase their chances of survival. However, the ability to filter out neutral distracters in state anxiety is likely beneficial, as these stimuli do not present any motivationally relevant information. Thus, efficiently ignoring neutral distracters allows individuals in an anxious state to continue to dedicate cognitive resources to ongoing goal-directed tasks (Cowan, 2001; Kane, Bleckley, Engle, 2001; March, Gaertner, & Olson, 2017; Plebanek & Sloutsky, 2019; Vogel et al., 2005; Vogt, De Houwer, Crombez, & Van Damme, 2013.)
Behaviorally, state anxiety did not affect our primary behavioral measures (i.e., accuracy, Pashler’s K scores, and RTs). However, we did find that state anxiety impacted the slowing of responses in the threat condition relative to the more demanding loads. Specifically, we found a smaller difference for RT in the low versus high load in the threat compared to the safe condition. Furthermore, we did not observe any differences between conditions in each load. This finding is somewhat consistent with others who found increased RTs associated with greater anxiety in WM tasks (Ashcraft & Kirk, 2001; Lavric et al., 2003; Richards et al., 2000). However, our effects were not isolated to specific load differences per se. Furthermore, these results are somewhat in contrast to others that have found no differences in WM task RTs resulting from anxiety (Qi, Chen, et al., 2014; Qi, Ding, et al., 2014; Shackman et al., 2006; Vytal et al., 2013). In addition, we observed no differences between conditions for behavioral measures indexing performance effectiveness, in this case, accuracy and Pashler’s K scores. Individuals with varying levels of WM capacity may engage in different processing strategies during demanding tasks that help alleviate their behavioral deficits (Barrett et al., 2004; Conway, Tuholski, Shisler, & Engle, 1999; Gruszka & Nęcka, 2017; Kane & Engle, 2000; Rosen & Engle, 1997). For example, individuals lower in WM capacity can overcome these limitations and improve their performance through rehearsal (Baddeley, 1983) or chunking (Bor, Duncan, Wiseman, & Owen, 2003; Cowan, 2001; Ericcson, Chase, & Faloon, 1980) of presented task-relevant material. Taken into consideration our CDA findings, we interpret this to mean that an anxious state has a greater effect on the underlying neurocognitive mechanisms (e.g., CDA) than specific behavioral outcome measures, such as accuracy or Pashler’s K scores. This notion is consistent with others who have found neurocognitive alterations on WM tasks with no behavioral differences in anxious individuals (Basten, Stelzel, & Fiebach, 2012; Qi et al., 2014b; Qi, Ding, et al., 2014). As proposed in ACT, it is likely that anxious individuals utilize compensatory mechanisms to perform specific cognitive tasks to the same degree as their less anxious peers (Berggren & Derakshan, 2013; Derakshan & Eysenck, 2009; Eysenck & Derakshan, 2011; Eysenck et al., 2007). Therefore, we interpret these inconsistencies between behavioral and EEG findings as being reflective of a change in cognitive processing strategy occurring during the probe phase of the WM task that allows individuals in an anxious state to preserve performance.
Although we found that state anxiety impaired neural representations of WM capacity for larger loads, we are unable to directly compare these outcomes with those that result from trait anxiety. For example, it may be the case that interaction between state and trait anxiety exists such that trait anxiety may moderate the effects of state anxiety on WM capacity and filtering efficiency. However, because we did not examine trait anxiety in the current study, we are limited in the conclusions that can be drawn in terms of examining state versus trait anxiety’s impact on these cognitive functions or their potential interactions. Future work should incorporate designs that directly examine both state and trait anxiety to examine how the interactions between these variables impact WM capacity and filtering efficiency.
In conclusion, given the prevalence and increased costs associated with anxiety disorders (Bandelow & Michaelis, 2015; Collins et al., 2011; Kessler et al., 2012) it is critical to investigate and further understand potential risk factors associated with anxiety. Cognitive functioning has garnered considerable attention as a risk factor for the development and maintenance of anxiety disorders (Beck & Clark, 1997; Mathews & MacLeod, 2005; Ouimet et al., 2009). Here we add to the growing body of literature identifying the underlying neurocognitive mechanisms associated with the relationship between anxiety and WM processes. Specifically, we demonstrated a reduction in an ERP index of WM capacity, but a lack of filtering cost for neutral distracters in state anxious individuals. These findings add to the theory that anxiety restricts WM capacity (Moran, 2016), and extend this finding to state anxiety specifically. Future work should consider examining potential interactions between state and trait anxiety, and how this influences WM capacity and filtering of task-irrelevant distracters, both neutral and threatening.
ACKNOWLEDGMENTS
The authors thank Carter Ginter, Kylee Karzen, Morganne Sendek, Amberly Krause, Sofia Mattson, Serafima Grimm, Joseph Kornkven, Brittany Ramczyk, Callen Shaw, Aime Skrober, Isabella Schaefer, and Sara Hagen for their diligent work in helping to collect data.
Footnotes
CONFLICT OF INTEREST
The authors have declared no conflicts of interest for this article.
REFERENCES
- Ashcraft MH, & Kirk EP (2001). The relationships among working memory, math anxiety, and performance. Journal of Experimental Psychology: General, 130, 224–237. 10.1037//0096-3445.130.2.224 [DOI] [PubMed] [Google Scholar]
- Aylward J, & Robinson OJ (2017). Towards an emotional “stress test”: A reliable, non-subjective cognitive measure of anxious responding. Scientific Reports, 7, 40094. 10.1038/srep40094 [DOI] [PMC free article] [PubMed] [Google Scholar]
- Baddeley AD (1983). Working memory. Philosophical Transactions of the Royal Society of London B, Biological Sciences, 302, 311–324. 10.1098/rstb.1983.0057 [DOI] [Google Scholar]
- Baddeley A (2012). Working memory: Theories, models, and controversies. Annual Review of Psychology, 63, 1–29. 10.1146/annurev-psych-120710-100422 [DOI] [PubMed] [Google Scholar]
- Bandelow B, & Michaelis S (2015). Epidemiology of anxiety disorders in the 21st century. Dialogues in Clinical Neuroscience, 17, 327–335. [DOI] [PMC free article] [PubMed] [Google Scholar]
- Bar-Haim Y, Lamy D, Pergamin L, Bakermans-Kranenburg MJ, & Van Ijzendoorn MH (2007). Threat-related attentional bias in anxious and nonanxious individuals: A meta-analytic study. Psychological Bulletin, 133, 1–24. 10.1037/0033-2909.133.1.1 [DOI] [PubMed] [Google Scholar]
- Barlow DH (2004). The nature of anxious apprehension. In Barlow DH (Ed.), Anxiety and its disorders: The nature and treatment of anxiety and panic (pp. 64–104). New York, NY: Guilford Press. [Google Scholar]
- Barrett LF, Tugade MM, & Engle RW (2004). Individual differences in working memory capacity and dual-process theories of the mind. Psychological Bulletin, 130, 553–573. 10.1037/0033-2909.130.4.553 [DOI] [PMC free article] [PubMed] [Google Scholar]
- Basten U, Stelzel C, & Fiebach CJ (2012). Trait anxiety and the neural efficiency of manipulation in working memory. Cognitive, Affective, & Behavioral Neuroscience, 12, 571–588. 10.3758/s13415-012-0100-3 [DOI] [PMC free article] [PubMed] [Google Scholar]
- Beck AT, & Clark DA (1997). An information processing model of anxiety: Automatic and strategic processes. Behaviour Research and Therapy, 35, 49–58. 10.1016/S0005-7967(96)00069-1 [DOI] [PubMed] [Google Scholar]
- Berggren N, Curtis HM, & Derakshan N (2017). Interactions of emotion and anxiety on visual working memory performance. Psychonomic Bulletin & Review, 24, 1274–1281. 10.3758/s13423-016-1213-4 [DOI] [PubMed] [Google Scholar]
- Berggren N, & Derakshan N (2013). Attentional control deficits in trait anxiety: Why you see them and why you don’t. Biological Psychology, 92, 440–446. 10.1016/j.biopsycho.2012.03.007 [DOI] [PubMed] [Google Scholar]
- Berggren N, Koster EH, & Derakshan N (2012). The effect of cognitive load in emotional attention and trait anxiety: An eye movement study. Journal of Cognitive Psychology, 24, 79–91. 10.1080/20445911.2011.618450 [DOI] [Google Scholar]
- Bishop SJ (2007). Neurocognitive mechanisms of anxiety: An integrative account. Trends in Cognitive Sciences, 11, 307–316. 10.1016/j.tics.2007.05.008 [DOI] [PubMed] [Google Scholar]
- Bishop SJ, Jenkins R, & Lawrence AD (2006). Neural processing of fearful faces: Effects of anxiety are gated by perceptual capacity limitations. Cerebral Cortex, 17, 1595–1603. 10.1093/cercor/bhl070 [DOI] [PubMed] [Google Scholar]
- Bor D, Duncan J, Wiseman RJ, & Owen AM (2003). Encoding strategies dissociate prefrontal activity from working memory demand. Neuron, 37, 361–367. 10.1016/S0896-6273(02)01171-6 [DOI] [PubMed] [Google Scholar]
- Borkovec TD, Robinson E, Pruzinsky T, & DePree JA (1983). Preliminary exploration of worry: Some characteristics and processes. Behaviour Research and Therapy, 21, 9–16. 10.1016/0005-7967(83)90121-3 [DOI] [PubMed] [Google Scholar]
- Cisler JM, & Koster EH (2010). Mechanisms of attentional biases towards threat in anxiety disorders: An integrative review. Clinical Psychology Review, 30, 203–216. 10.1016/j.cpr.2009.11.003 [DOI] [PMC free article] [PubMed] [Google Scholar]
- Collins PY, Patel V, Joestl SS, March D, Insel TR, Daar AS, … Walport M (2011). Grand challenges in global mental health. Nature, 475, 27–30. 10.1038/475027a [DOI] [PMC free article] [PubMed] [Google Scholar]
- Conway AR, Tuholski SW, Shisler RJ, & Engle RW (1999). The effect of memory load on negative priming: An individual differences investigation . Memory & Cognition, 27, 1042–1050. 10.3758/BF03201233 [DOI] [PubMed] [Google Scholar]
- Cowan N (2001). The magical number 4 in short-term memory: A reconsideration of mental storage capacity. Behavioral and Brain Sciences, 24, 87–114. 10.1017/S0140525X01003922 [DOI] [PubMed] [Google Scholar]
- Cowan N (2010). The magical mystery four: How is working memory capacity limited, and why? Current Directions in Psychological Science, 19, 51–57. 10.1177/0963721409359277 [DOI] [PMC free article] [PubMed] [Google Scholar]
- Cowan N (2017). The many faces of working memory and short-term storage. Psychonomic Bulletin & Review, 24, 1158–1170. 10.3758/s13423-016-1191-6 [DOI] [PubMed] [Google Scholar]
- Cox JA, Christensen BK, & Goodhew SC (2018). Temporal dynamics of anxiety-related attentional bias: Is affective context a missing piece of the puzzle? Cognition and Emotion, 32, 1329–1338. 10.1080/02699931.2017.1386619 [DOI] [PubMed] [Google Scholar]
- Darke S (1988). Anxiety and working memory capacity. Cognition and Emotion, 2, 145–154. 10.1080/02699938808408071 [DOI] [Google Scholar]
- Delorme A, & Makeig S (2004). EEGLAB: An open source toolbox for analysis of single-trial EEG dynamics including independent component analysis. Journal of Neuroscience Methods, 134, 9–21. 10.1016/j.jneumeth.2003.10.009 [DOI] [PubMed] [Google Scholar]
- Derakshan N, & Eysenck MW (2009). Anxiety, processing efficiency, and cognitive performance: New developments from attentional control theory. European Psychologist, 14, 168–176. 10.1027/1016-9040.14.2.168 [DOI] [Google Scholar]
- Ekman P (1992). An argument for basic emotions . Cognition & Emotion, 6, 169–200. 10.1037/0033-295X.99.3.550 [DOI] [Google Scholar]
- Ericcson KA, Chase WG, & Faloon S (1980). Acquisition of a memory skill. Science, 208, 1181–1182. 10.1126/science.7375930 [DOI] [PubMed] [Google Scholar]
- Eysenck MW, & Calvo MG (1992). Anxiety and performance: The processing efficiency theory. Cognition & Emotion, 6, 409–434. 10.1080/02699939208409696 [DOI] [Google Scholar]
- Eysenck MW, & Derakshan N (2011). New perspectives in attentional control theory. Personality and Individual Differences, 50, 955–960. 10.1016/j.paid.2010.08.019 [DOI] [Google Scholar]
- Eysenck MW, Derakshan N, Santos R, & Calvo MG (2007). Anxiety and cognitive performance: Attentional control theory. Emotion, 7, 336–353. 10.1037/1528-3542.7.2.336 [DOI] [PubMed] [Google Scholar]
- Eysenck M, Payne S, & Derakshan N (2005). Trait anxiety, visuospatial processing, and working memory. Cognition & Emotion, 19, 1214–1228. 10.1080/02699930500260245. [DOI] [Google Scholar]
- Faul F, Erdfelder E, Buchner A, & Lang AG (2009). Statistical power analyses using G* Power 3.1: Tests for correlation and regression analyses. Behavior Research Methods, 41, 1149–1160. 10.3758/BRM.41.4.1149 [DOI] [PubMed] [Google Scholar]
- Faul F, Erdfelder E, Lang AG, & Buchner A (2007). G* Power 3: A flexible statistical power analysis program for the social, behavioral, and biomedical sciences. Behavior Research Methods, 39, 175–191. 10.3758/BF03193146 [DOI] [PubMed] [Google Scholar]
- Figueira JSB, Oliveira L, Pereira MG, Pacheco LB, Lobo I, Motta-Ribeiro GC, & David IA (2017). An unpleasant emotional state reduces working memory capacity: Electrophysiological evidence. Social Cognitive and Affective Neuroscience, 12, 984–992. 10.1093/scan/nsx030 [DOI] [PMC free article] [PubMed] [Google Scholar]
- Fox E, Dutton K, Yates A, Georgiou GA, & Mouchlianitis E (2015). Attentional control and suppressing negative thought intrusions in pathological worry. Clinical Psychological Science, 3, 593–606. 10.1177/2167702615575878 [DOI] [PMC free article] [PubMed] [Google Scholar]
- Gao Z, Yin J, Xu H, Shui R, & Shen M (2011). Tracking object number or information load in visual working memory: Revisiting the cognitive implication of contralateral delay activity. Biological Psychology, 87, 296–302. 10.1016/j.biopsycho.2011.03.013 [DOI] [PubMed] [Google Scholar]
- Gruszka A, & Nęcka E (2017). Limitations of working memory capacity: The cognitive and social consequences. European Management Journal, 35, 776–784. 10.1016/j.emj.2017.07.001 [DOI] [Google Scholar]
- Hayes S, Hirsch C, & Mathews A (2008). Restriction of working memory capacity during worry. Journal of Abnormal Psychology, 117, 712–717. 10.1037/a0012908 [DOI] [PubMed] [Google Scholar]
- Ikkai A, McCollough AW, & Vogel E (2010). Contralateral delay activity provides a neural measure of the number of representations in visual working memory. Journal of Neurophysiology, 103, 1963–1968. 10.1152/jn.00978.2009 [DOI] [PMC free article] [PubMed] [Google Scholar]
- Johnston K, Westerfield W, Momin S, Phillippi R, & Naidoo A (2009). The direct and indirect costs of employee depression, anxiety, and emotional disorders—An employer case study. Journal of Occupational and Environmental Medicine, 51, 564–577. 10.1097/JOM.0b013e3181a1f5c8 [DOI] [PubMed] [Google Scholar]
- Kane M, Bleckley MK, & Engle RW (2001). A controlled-attention view of working-memory capacity. Journal of Experimental Psychology: General, 130, 169–193. 10.1037/0096-3445.130.2.169 [DOI] [PubMed] [Google Scholar]
- Kane MJ, & Engle RW (2000). Working-memory capacity, proactive interference, and divided attention: Limits on long-term memory retrieval. Journal of Experimental Psychology: Learning, Memory, and Cognition, 26, 336–358. 10.10371/0278-7393.26.2.336 [DOI] [PubMed] [Google Scholar]
- Kessler RC, Petukhova M, Sampson NA, Zaslavsky AM, & Wittchen HU (2012). Twelve-month and lifetime prevalence and lifetime morbid risk of anxiety and mood disorders in the United States. International Journal of Methods in Psychiatric Research, 21, 169–184. 10.1002/mpr.1359 [DOI] [PMC free article] [PubMed] [Google Scholar]
- Kim SY, Shin JE, Lee YI, Kim H, Jo HJ, & Choi SH (2018). Neural evidence for persistent attentional bias to threats in patients with social anxiety disorder. Social Cognitive and Affective Neuroscience, 13, 1327–1336. 10.1093/scan/nsy115 [DOI] [PMC free article] [PubMed] [Google Scholar]
- Klumpp H, Kinney KL, Kennedy AE, Shankman SA, Langenecker SA, Kumar A, & Phan KL (2018). Trait attentional control modulates neurofunctional response to threat distractors in anxiety and depression. Journal of Psychiatric Research, 102, 87–95. 10.1016/j.jpsychires.2018.03.011 [DOI] [PubMed] [Google Scholar]
- Lapointe MLB, Blanchette I, Duclos M, Langlois F, Provencher MD, & Tremblay S (2013). Attentional bias, distractibility and short-term memory in anxiety. Anxiety, Stress & Coping, 26, 293–313. 10.1080/10615806.2012.687722 [DOI] [PubMed] [Google Scholar]
- Lavric A, Rippon G, & Gray JR (2003). Threat-evoked anxiety disrupts spatial working memory performance: An attentional account. Cognitive Therapy and Research, 27, 489–504. 10.1023/A:1026300619569 [DOI] [Google Scholar]
- LeDoux J (2003). The emotional brain, fear, and the amygdala. Cellular and Molecular Neurobiology, 23, 727–738. 10.1023/A:1025048802629 [DOI] [PMC free article] [PubMed] [Google Scholar]
- Leigh E, & Hirsch CR (2011). Worry in imagery and verbal form: Effect on residual working memory capacity. Behaviour Research and Therapy, 49, 99–105. 10.1016/j.brat.2010.11.005 [DOI] [PMC free article] [PubMed] [Google Scholar]
- Lépine JP (2002). The epidemiology of anxiety disorders: Prevalence and societal costs. The Journal of Clinical Psychiatry, 63, 4–8. [PubMed] [Google Scholar]
- Lopez-Calderon J, & Luck SJ (2014). ERPLAB: An open-source toolbox for the analysis of event-related potentials. Frontiers in Human Neuroscience, 8, 213. 10.3389/fnhum.2014.00213 [DOI] [PMC free article] [PubMed] [Google Scholar]
- Luck SJ, & Vogel EK (2013). Visual working memory capacity: From psychophysics and neurobiology to individual differences. Trends in Cognitive Sciences, 17, 391–400. 10.1016/j.tics.2013.06.006 [DOI] [PMC free article] [PubMed] [Google Scholar]
- March DS, Gaertner L, & Olson MA (2017). In harm’s way: On preferential response to threatening stimuli. Personality and Social Psychology Bulletin, 43, 1519–1529. 10.1177/0146167217722558. [DOI] [PubMed] [Google Scholar]
- Mathews A, & MacLeod C (1985). Selective processing of threat cues in anxiety states. Behaviour Research and Therapy, 23, 563–569. 10.1016/0005-7967(85)90104-4 [DOI] [PubMed] [Google Scholar]
- Mathews A, & MacLeod C (2005). Cognitive vulnerability to emotional disorders. Annual Reviews of Clinical Psychology, 1, 167–195. 10.1146/annurev.clinpsy.1.102803.143916 [DOI] [PubMed] [Google Scholar]
- McCollough AW, Machizawa MG, & Vogel EK (2007). Electrophysiological measures of maintaining representations in visual working memory. Cortex, 43, 77–94. 10.1016/S0010-9452(08)70447-7 [DOI] [PubMed] [Google Scholar]
- Mogg K, Mathews A, & Weinman J (1989). Selective processing of threat cues in anxiety states: A replication. Behaviour Research and Therapy, 27, 317–323. 10.1016/0005-7967(89)90001-6 [DOI] [PubMed] [Google Scholar]
- Moran TP (2016). Anxiety and working memory capacity: A meta-analysis and narrative review. Psychological Bulletin, 142, 831–864. 10.1037/bul0000051 [DOI] [PubMed] [Google Scholar]
- Moriya J, & Sugiura Y (2012). High visual working memory capacity in trait social anxiety. PLoS One, 7, e34244. 10.1371/journal.pone.0034244 [DOI] [PMC free article] [PubMed] [Google Scholar]
- Morriss J, McSorley E, & Van Reekum CM (2018). I don’t know where to look: The impact of intolerance of uncertainty on saccades towards non-predictive emotional face distractors. Cognition and Emotion, 32, 953–962. 10.1080/02699931.2017.1370418 [DOI] [PubMed] [Google Scholar]
- Ng E, & Lee K (2015). Effects of trait test anxiety and state anxiety on children’s working memory task performance. Learning and Individual Differences, 40, 141–148. 10.1016/j.lindif.2015.04.007 [DOI] [Google Scholar]
- Nitschke JB, Heller W, Imig JC, McDonald RP, & Miller GA (2001). Distinguishing dimensions of anxiety and depression. Cognitive Therapy and Research, 25, 1–22. 10.1023/A:1026485530405 [DOI] [Google Scholar]
- Öhman A, Lundqvist D, & Esteves F (2001). The face in the crowd revisited: A threat advantage with schematic stimuli. Journal of Personality and Social Psychology, 80, 381–396. 10.1037/0022-3514.80.3.381 [DOI] [PubMed] [Google Scholar]
- Ouimet AJ, Gawronski B, & Dozois DJ (2009). Cognitive vulnerability to anxiety: A review and an integrative model. Clinical Psychology Review, 29, 459–470. 10.1016/j.cpr.2009.05.004 [DOI] [PubMed] [Google Scholar]
- Owens M, Derakshan N, & Richards A (2015). Trait susceptibility to worry modulates the effects of cognitive load on cognitive control: An ERP study. Emotion, 15, 544–549. 10.1037/emo0000052 [DOI] [PubMed] [Google Scholar]
- Pacheco-Unguetti AP, Acosta A, Callejas A, & Lupiáñez J (2010). Attention and anxiety: Different attentional functioning under state and trait anxiety. Psychological Science, 21, 298–304. 10.1177/0956797609359624 [DOI] [PubMed] [Google Scholar]
- Pashler H (1988). Familiarity and visual change detection. Perception & Psychophysics, 44, 369–378. 10.3758/BF03210419 [DOI] [PubMed] [Google Scholar]
- Pedersen WS, & Larson CL (2016). State anxiety carried over from prior threat increases late positive potential amplitude during an instructed emotion regulation task. Emotion, 16, 719–729. 10.1037/emo0000154 [DOI] [PMC free article] [PubMed] [Google Scholar]
- Plebanek DJ, & Sloutsky VM (2019). Selective attention, filtering, and the development of working memory. Developmental Science, 22, e12727. 10.1111/desc.12727. [DOI] [PMC free article] [PubMed] [Google Scholar]
- Qi S, Chen J, Hitchman G, Zeng Q, Ding C, Li H, & Hu W (2014). Reduced representations capacity in visual working memory in trait anxiety. Biological Psychology, 103, 92–99. 10.1016/j.biopsycho.2014.08.010 [DOI] [PubMed] [Google Scholar]
- Qi S, Ding C, & Li H (2014). Neural correlates of inefficient filtering of emotionally neutral distractors from working memory in trait anxiety . Cognitive, Affective, & Behavioral Neuroscience, 14, 253–265. 10.3758/s13415-013-0203-5 [DOI] [PubMed] [Google Scholar]
- Qi S, Zeng Q, Luo Y, Duan H, Ding C, Hu W, & Li H (2014). Impact of working memory load on cognitive control in trait anxiety: An ERP study. PLoS One, 9, e111791. 10.1371/journal.pone.0111791 [DOI] [PMC free article] [PubMed] [Google Scholar]
- Raeder SM, Bone JK, Patai EZ, Holmes E, Nobre AC, & Murphy S (2018). Emotional distraction in the context of memory-based orienting of attention. Emotion, 10.1037/emo0000506 [DOI] [PMC free article] [PubMed] [Google Scholar]
- Richards A, French CC, Keogh E, & Carter C (2000). Test-anxiety, inferential reasoning and working memory load . Anxiety, Stress and Coping, 13, 87–109. 10.1080/10615800008248335 [DOI] [Google Scholar]
- Robinson OJ, Charney DR, Overstreet C, Vytal K, & Grillon C (2012). The adaptive threat bias in anxiety: Amygdala–dorsomedial prefrontal cortex coupling and aversive amplification. NeuroImage, 60, 523–529. 10.1016/j.neuroimage.2011.11.096 [DOI] [PMC free article] [PubMed] [Google Scholar]
- Robinson OJ, Krimsky M, Lieberman L, Allen P, Vytal K, & Grillon C (2014). Towards a mechanistic understanding of pathological anxiety: The dorsal medial prefrontal-amygdala ‘aversive amplification’circuit in unmedicated generalized and social anxiety disorders. The Lancet Psychiatry, 1, 294–302. 10.1016/S2215-0366(14)70305-0 [DOI] [PMC free article] [PubMed] [Google Scholar]
- Robinson OJ, Vytal K, Cornwell BR, & Grillon C (2013). The impact of anxiety upon cognition: Perspectives from human threat of shock studies. Frontiers in Human Neuroscience, 7, 203. 10.3389/fnhum.2013.00203 [DOI] [PMC free article] [PubMed] [Google Scholar]
- Rosen VM, & Engle RW (1997). The role of working memory capacity in retrieval. Journal of Experimental Psychology: General, 126, 211–227. 10.1037/0096-3445.126.3.211 [DOI] [PubMed] [Google Scholar]
- Rouder JN, Morey RD, Morey CC, & Cowan N (2011). How to measure working memory capacity in the change detection paradigm . Psychonomic Bulletin & Review, 18, 324–330. 10.3758/s13423-011-0055-3 [DOI] [PMC free article] [PubMed] [Google Scholar]
- Rutherford E, MacLeod C, & Campbell L (2004). Negative selectivity effects and emotional selectivity effects in anxiety: Differential attentional correlates of state and trait variables. Cognition and Emotion, 18, 711–720. 10.1080/02699930341000121 [DOI] [Google Scholar]
- Sarason IG (1988). Anxiety, self-preoccupation and attention. Anxiety Research, 1, 3–7. 10.1080/10615808808248215 [DOI] [Google Scholar]
- Sari BA, Koster EH, & Derakshan N (2017). The effects of active worrying on working memory capacity. Cognition and Emotion, 31, 995–1003. 10.1080/02699931.2016.1170668 [DOI] [PubMed] [Google Scholar]
- Shackman AJ, Sarinopoulos I, Maxwell JS, Pizzagalli DA, Lavric A, & Davidson RJ (2006). Anxiety selectively disrupts visuospatial working memory. Emotion, 6(1), 40–61. 10.1037/1528-3542.6.1.40 [DOI] [PubMed] [Google Scholar]
- Stout DM, & Rokke PD (2010). Components of working memory predict symptoms of distress. Cognition and Emotion, 24, 1293–1303. 10.1080/02699930903309334 [DOI] [Google Scholar]
- Stout DM, Shackman AJ, Johnson JS, & Larson CL (2015). Worry is associated with impaired gating of threat from working memory. Emotion, 15, 6–11. 10.1037/emo0000015 [DOI] [PMC free article] [PubMed] [Google Scholar]
- Stout DM, Shackman AJ, & Larson CL (2013). Failure to filter: Anxious individuals show inefficient gating of threat from working memory. Frontiers in Human Neuroscience, 7, 58. 10.3389/fnhum.2013.00058 [DOI] [PMC free article] [PubMed] [Google Scholar]
- Stout DM, Shackman AJ, Pedersen WS, Miskovich TA, & Larson CL (2017). Neural circuitry governing anxious individuals’ mis-allocation of working memory to threat. Scientific Reports, 7, 8742. 10.1038/s41598-017-08443-7 [DOI] [PMC free article] [PubMed] [Google Scholar]
- Vogel EK, & Machizawa MG (2004). Neural activity predicts individual differences in visual working memory capacity. Nature, 428, 748–751. 10.1038/nature02447 [DOI] [PubMed] [Google Scholar]
- Vogel EK, McCollough AW, & Machizawa MG (2005). Neural measures reveal individual differences in controlling access to working memory. Nature, 438, 500–503. 10.1038/nature04171 [DOI] [PubMed] [Google Scholar]
- Vogt J, De Houwer J, Crombez G, & Van Damme S (2013). Competing for attentional priority: Temporary goals versus threats. Emotion, 13, 587–598. 10.1037/a0027204 [DOI] [PubMed] [Google Scholar]
- Vytal K, Cornwell B, Arkin N, & Grillon C (2012). Describing the interplay between anxiety and cognition: From impaired performance under low cognitive load to reduced anxiety under high load. Psychophysiology, 49, 842–852. 10.1111/j.1469-8986.2012.01358.x [DOI] [PMC free article] [PubMed] [Google Scholar]
- Vytal KE, Cornwell BR, Arkin NE, Letkiewicz AM, & Grillon C (2013). The complex interaction between anxiety and cognition: Insight from spatial and verbal working memory. Frontiers in Human Neuroscience, 7, 93. 10.3389/fnhum.2013.00093 [DOI] [PMC free article] [PubMed] [Google Scholar]
- Wieser MJ, Hambach A, & Weymar M (2018). Neurophysiological correlates of attentional bias for emotional faces in socially anxious individuals–Evidence from a visual search task and N2pc. Biological Psychology, 132, 192–201. 10.1016/j.biopsycho.2018.01.004 [DOI] [PubMed] [Google Scholar]
- Yao N, Chen S, & Qian M (2018). Trait anxiety is associated with a decreased visual working memory capacity for faces. Psychiatry Research, 270, 474–482. 10.1016/j.psychres.2018.10.018 [DOI] [PubMed] [Google Scholar]
- Yoon KL, LeMoult J, Hamedani A, & McCabe R (2018). Working memory capacity and spontaneous emotion regulation in generalised anxiety disorder. Cognition and Emotion, 32, 215–221. 10.1080/02699931.2017.1282854 [DOI] [PubMed] [Google Scholar]
- Zhang Y, Zhang G, & Liu B (2017). Investigation of the influence of emotions on working memory capacity using ERP and ERSP. Neuroscience, 357, 338–348. 10.1016/j.neuroscience.2017.06.016 [DOI] [PubMed] [Google Scholar]