

Abstract
Diffuse optics (DO) is a light-based technique used to study the human brain, but it suffers from low brain specificity. Interferometric diffuse optics (iDO) promises to improve the quantitative accuracy and depth specificity of DO, and particularly, coherent light fluctuations (CLFs) arising from blood flow. iDO techniques have alternatively achieved either time-of-flight (TOF) discrimination or highly parallel detection, but not both at once. Here, we break this barrier with a single iDO instrument. Specifically, we show that rapid tuning of a temporally coherent laser during the sensor integration time increases the effective linewidth seen by a highly parallel interferometer. Using this concept to create a continuously variable and user-specified TOF filter, we demonstrate a solution to the canonical problem of DO, measuring optical properties. Then, with a deep TOF filter, we reduce scalp sensitivity of CLFs by 2.7 times at 1 cm source-collector separation. With this unique combination of desirable features, i.e., TOF-discrimination, spatial localization, and highly parallel CLF detection, we perform multiparametric imaging of light intensities and CLFs via the human forehead.
1. INTRODUCTION
Diffuse optics (DO) is an impactful tool to monitor the human brain [1]. The functional near-infrared spectroscopy (fNIRS) absorption signal is based on blood hemodynamics similar to functional magnetic resonance imaging (fMRI) [2]. Yet, fNIRS can monitor brain signals noninvasively, via optodes coupled to the scalp. As a result, fNIRS can operate continuously in settings where fMRI cannot [3]. However, the convenience of fNIRS comes with a price: light must traverse vascularized extracerebral tissues, with blood that fluctuates according to systemic physiology that is unrelated to brain activation. The resulting poor brain specificity is a major challenge for fNIRS [4]. Short distance channels and signal processing can somewhat mitigate this issue, with added expense and complexity [5]. Also, fNIRS is usually a continuous wave (CW) technique, and cannot achieve robust baseline measurements, though time-domain [6], frequency-domain [7], and spectral derivative [8] methods are more quantitative.
The most common strategies to improve brain specificity of fNIRS are to increase source-collector separation (S-C) or to employ time-of-flight (TOF) discrimination to filter out the early photons [9,10]. Both strategies incur a compromise between photon counts and brain-to-scalp sensitivity (brain specificity). In other words, more brain specificity is exchanged for fewer photon counts as the S-C separation is increased, or as later TOFs are isolated [11]. Late TOF discrimination achieves a more favorable compromise between these competing factors than large S-C separation, as it attains more photon counts for a given brain specificity [12]. TOF discrimination at shorter S-C separation also improves spatial localization [12].
Within DO, the subfield of diffuse correlation spectroscopy (DCS) or diffusing wave spectroscopy (DWS) has discovered a brain blood flow index (BFI) signal [13,14] that arises from the coherent light fluctuations (CLFs) after multiple scattering from red blood cells (RBCs). BFI increases with the number of RBCs and RBC motion [15], and is thus akin to blood flow. BFI also correlates with blood flow across subjects [16]. Thus, BFI is widely considered to be a useful surrogate for blood flow. Critically, BFI was shown to be inherently at least three times more brain specific than fNIRS absorption signals, for the same S-C separation [17,18]. CLFs also afford more approaches to improve brain specificity, including ultrasonic modulation [19] and multilayer models [20–22] with probe pressure [20,23]. However, DCS benefits from spatial coherence, limiting the number of modes that can be sent to a single detector [24,25]. Consequently, DCS typically uses NIR photon counting, which has historically limited S-C separation and brain specificity [26–28]. Single-photon avalanche diode arrays have potential, but to date S-C separations remain restricted [29,30]. Diffuse speckle contrast imaging can boost photon count with 2D cameras [31–34]; however, short exposures lower the signal-to-noise ratio (SNR), and millisecond exposure times may compromise depth specificity.
Recent advances have enabled detecting CLFs at larger S-C separation using interferometric diffusing wave spectroscopy (iDWS) [35] and 1064 nm DCS [36]. While larger S-C separations yield more brain-specific CLFs, spatial localization is poor, and photon counts are reduced. TOF discrimination would be a preferable strategy to achieve brain specificity. Yet existing techniques to discriminate CLFs according to TOF are not suitable for scaling to hundreds of detectors. Interferometric diffuse optics (iDO) techniques have achieved time-of-flight (TOF) resolution of CLFs [37,38], but not simultaneously with highly parallel detection [39–43]. For instance, interferometric near-infrared spectroscopy (iNIRS) can achieve fine TOF resolution [38] but requires a high sampling bandwidth that is not conducive to scaling the number of detectors economically. Time-domain DCS achieves TOF discrimination, but the cost of parallelizing single-photon avalanche diodes [11,44,45] or superconducting nanowire single photon detectors [46–48] with time-correlated single photon counting remains high. Though promising candidate technologies exist [49–51], thus far no scalable approach for TOF-resolved CLF measurements has emerged.
Here, we present an interferometric DWS method that measures parallel CLFs of over 200 channels with TOF discrimination. By tuning a narrowband laser rapidly in wavelength during the exposure time, we reduce the effective coherence length of the source, creating a flexible and variable TOF filter. With this concept [52], we introduce a new way to solve one of the canonical problems in the field, optical property quantification [7,53], using a variable TOF filter to parametrically determine absorption and scattering. Then, we employ a deep TOF filter to reduce scalp sensitivity and selectively detect CLFs at more deeply penetrating TOFs. In contrast to direct TOF discrimination [11], our approach modifies the source light and not the detector. This allows us to achieve TOF discrimination with inexpensive CMOS pixel detectors, yielding a highly scalable CLF approach that provides information-rich, multiparametric images.
2. METHODS
Our theory (Supplement 1 S4, S5, and S6) shows that an instantaneously narrowband (temporally coherent) laser can be made to appear temporally incoherent by introducing light fluctuations during the exposure time. In this work, we theoretically and experimentally characterize this effect, optimize it, and demonstrate its utility for TOF filtering to improve brain specificity.
A. System for Effective Coherence Control
Here, we sinusoidally tune an instantaneously narrowband 852 nm distributed Bragg reflector (DBR) laser (D2–100-DBR-852-HP1, Vescent Photonics) rapidly in optical frequency during the sensor exposure time [Fig. 1(a)] [54]. Thus, the effective linewidth of the power spectrum seen by the sensor is increased [Fig. 1(b)], and effective temporal coherence is decreased [Fig. 1(c)].
Fig. 1.

(a) Rapid RF laser drive current modulation leads to carrier density modulation [54], inducing optical frequency modulation. (b)–(c) This broadens the effective power spectrum (lineshape) of a DBR laser to , while decreasing the effective temporal coherence to , thus enabling TOF filtering. (d) Schematic of TOF-filtered iDWS for the human brain (interferometer diagram in Supplement 1 S2), and comparison of unfiltered CW (blue) and TOF-filtered (red) measurements. (e)–(i) TOF filtering shifts the distribution to later TOF (e), affording a higher brain sensitivity [55] (f) (relative BFI sensitivity coded in transparency as described in Supplement 1 S3). TOF filtering also leads to a smaller interference amplitude and faster fluctuations (g), reducing the magnitude of the field autocorrelation (h), and increasing its decay rate (i). Note that panel (g) shows simulated (noise free) interference signals consistent with the magnitudes and decay rates in panel (h) and (i), while panels (h) and (i) show in vivo human forehead autocorrelations at 1 cm S-C separation. FT: Fourier transform; : TOF filter; : TOF mismatch between reference and sample arms excluding the sample; : TOF through the head; SMF: single-mode fiber; MMF: multimode fiber; L1: lens; VOA: variable fiber-optic attenuator; FPC: fiber polarization controller; DTOF: distribution of TOFs. : un-normalized field autocorrelation; : normalized field autocorrelation.
In conventional, continuous wave (CW) iDWS, the weak optical field returning from the brain is boosted by coherent amplification with a much stronger reference field. Thus, a nonscientific CMOS sensor can parallelize measurements of weak CLFs [41]. Laser tuning breaks this coherence, endowing the iDWS system with TOF filtering capabilities [Fig. 1(d)]. The reference field still instantaneously amplifies the sample field. However, unlike conventional iDWS, TOF-dependent loss of the interference signal, as described by the coherence function [Fig. 1(c)], must be considered. Coherence is maximal with matched reference and sample paths, and reduces with larger TOF mismatch [Fig. 1(c)], realizing a TOF filter. By varying the tuning waveform, we vary the effective power spectrum (Supplement 1 S6) and the filter width. Such an approach is applicable to any iDWS system with an appropriate source and a single mode reference arm. The interferometer in this work was similar to our previously reported free space CW iDWS interferometer (Supplement 1 S2) [35] but differed from earlier fiber-based interferometers [38,41,42,56].
TOF filtering has secondary benefits. Relative to earlier work [41], back reflections were found to be less problematic, because the TOF filter also helped guard against unwanted interference between paths that were separated by more than the nominal coherence time. We also added a fiber polarization controller [FPC, Fig. 1(d)] to the reference arm to reduce polarization-dependent back reflection, which also served to stabilize the reference arm.
B. Laser Tuning Creates Variable TOF Filter
In this study, TOF filtering arises from rapid light fluctuations integrated over the sensor exposure time (Supplement 1 S4 and S5). Neglecting power modulation (Supplement 1 S5) and system TOF dispersion, for sinusoidal tuning [Fig. 1(a)] with an optical frequency tuning range [Fig. 1(b)], the TOF filter is
| (1) |
where is the TOF through the head, is the TOF mismatch between reference and sample arms excluding the head, and is a Bessel function of the first kind. The TOF resolution is [half of TOF filter main lobe width in Fig. 1(c)]. The TOF filter can be varied by changing and . As the line scan camera (spL 4096–140 km, Basler) is run asynchronously with laser tuning, to ensure a consistent effective power spectrum for each exposure; the sensor exposure window (, Supplement 1 S7) should cover an integer number of tuning cycles of the laser. Practically, we select the laser tuning speed to minimize aliased digital oscillations (Supplement 1 S7). In this work, we tune the laser at 9.7959 or 5.1635MHz.
We used our TOF filtering strategy on a modified iDWS interferometer [35] [Fig. 1(d)], aligned here to achieve over 200 channels, estimated as previous described [35]. When we apply the TOF filter to a brain measurement, practically, is fixed by the system, while the sample TOF depends on the light path [Fig. 1(d)]. If the sample path length balances the intrinsic system path length mismatch, , coherence and the TOF filter are maximal. Note that to reject early TOFs, the reference arm should be longer than the sample arm excluding the sample (i.e., ) [Fig. 1(e)]. In practice, we found values of a few nanoseconds, which could be achieved via reference arm fibers of several tens of centimeters, to be suitable for S-C separations of interest. As TOF filtering attenuates early paths, the sensitivity to relative blood flow changes in the brain is increased [Fig. 1(f), Supplement 1 S3] compared to CW detection. However, TOF filtering drastically reduces the interference signal compared to CW detection [Fig. 1(g)], in turn reducing the amplitude of the un-normalized field autocorrelation [Fig. 1(h)]. The shift in the TOF-filtered distribution to later TOFs [Fig. 1(e)] leads to more dynamic scattering events and faster sample field fluctuations [Fig. 1(g)], increasing the normalized field autocorrelation decay rate [Fig. 1(i)].
The TOF filter, , was experimentally determined with a thin reflective dynamic scattering phantom (Fig. 2), analogous to the way an IRF is determined in time-domain NIRS [53]. We start with Eq. (S16) (Supplement 1 S4) at zero lag, or [57],
| (2) |
where is the true sample autocorrelation. DTOF is the true photon distribution across TOFs. If the , where is the Dirac delta function, can be sampled by changing , the TOF mismatch between sample and reference arms. Specifically,
| (3) |
Fig. 2.
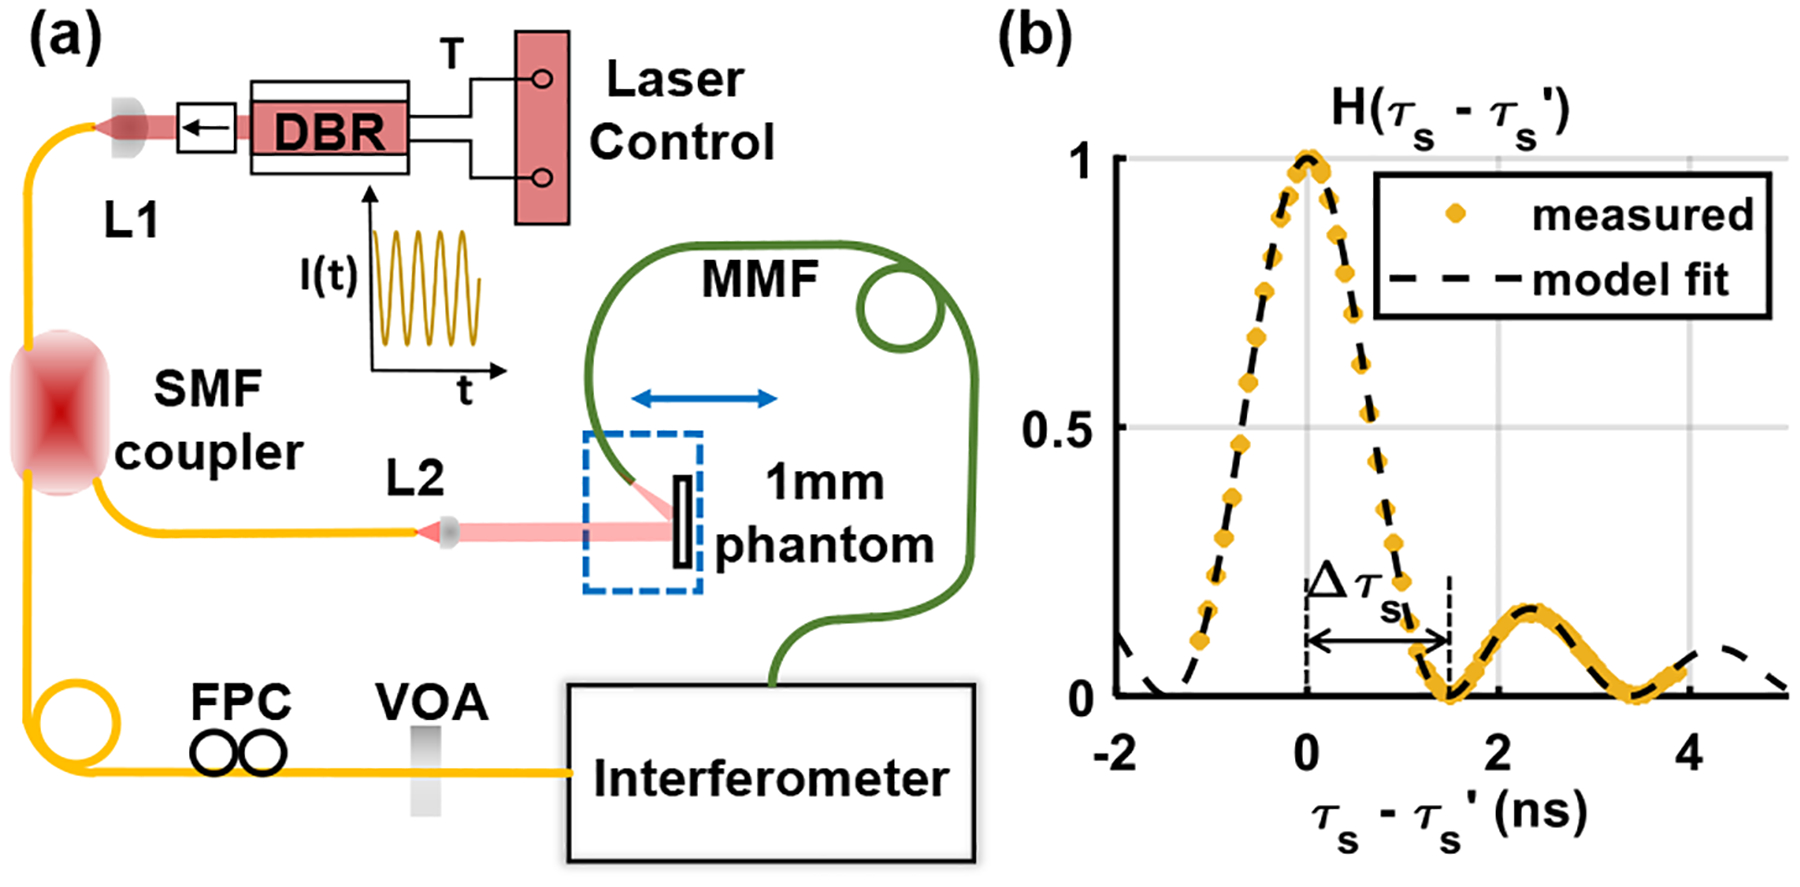
(a) Schematic for TOF-filtered iDWS system characterization. A 1 mm thick liquid phantom was employed in reflectance mode as the sample. The distance between the phantom and illumination was varied to achieve different values (Interferometer diagram in Supplement 1 S2.). (b) Measured with theoretical model fit, neglecting power modulation (Supplement 1 S5).
To realize a dynamic scattering response approximating a delta function, a 1 mm thick cuvette was filled with a dilution of intralipid in distilled water with . The sample illumination light was delivered perpendicular to the cuvette through a collimator [Fig. 2(a)]. The cuvette and multimode fiber reflectance collector were translated together relative to the illumination fiber [Fig. 2(a) dashed blue box] to achieve 61 different values (1 in. translation per step, corresponding to 0.085 ns resolution in ). The collection fiber was angled [Fig. 2(a)] to avoid specular reflections, so all collected light was dynamically scattered from the phantom.
At each location, data were acquired without (CW) and with a fixed TOF filter. The narrowband DBR laser has a long coherence length on the order of 100 m, thus effectively for CW operation and should not depend on . Hence, estimates of were used for normalization, to account for differences in light collection at various path lengths.
In summary, we estimate the TOF filter by
| (4) |
where denotes the TOF-filtered autocorrelation estimate at zero lag, and denotes the CW autocorrelation estimate at zero lag, after background and shot noise correction, followed by reference normalization [35]. A tuning range of (5.1635 MHz tuning rate) was extracted by fitting the measured data to Eq. (1) [, Fig. 2(b)].
Direct determination of the TOF filter in this manner was cumbersome and time-consuming. Therefore, we also independently validated the tuning range using a Mach–Zehnder interferometer with a known TOF mismatch as described in Supplement 1 S8 [58]. This alternative approach also yielded a tuning range of 0.52 GHz for the filter described in the previous paragraph. First, this cross validation bolsters confidence in the theory underlying the TOF filter (Supplement 1 S5 and S6). Second, measurement of at one current controller drive voltage yields the transfer coefficient and predicts for all other drive voltages (Supplement 1 S8), facilitating quantitative measurements, as described next. Third, along with the TOF mismatch, fully specifies the TOF filter. Thus, we could fully specify a family of TOF filters without explicitly measuring each one.
C. Human Experiments
For this study, three healthy adult human subjects (aged 28–41 years) were recruited for pressure modulation and baseline measurements. Informed consent was obtained from all subjects. All experimental procedures and protocols involving human subject research were reviewed and approved by New York University Institutional Review Board (IRB) and UC Davis IRB, and safety precautions (e.g., laser safety goggles and beam blocks) were implemented to avoid accidental eye exposure from laser.
D. Variable TOF Filter Reveals Optical Properties
The electronically variable TOF filter was a unique feature of our approach that enabled us to determine optical properties. Briefly, a family of TOF filters is applied in rapid succession, with each filter weighting the TOF distribution differently [Fig. 3(a), Visualization 1]. This novel IRF modulation approach operates in the time-domain [53], and yet, unlike TD-NIRS, seeks to determine optical properties parametrically without recovering the full TOF distribution. Mathematically, we vary and to vary weighting of the TOF distribution. Updating Eq. (2) to describe the measured effective photon counts after TOF filtering, ,
| (5) |
Fig. 3.

Continuously variable TOF filter can recover medium optical properties. (a) Variable TOF filtering (see also Visualization 1). (b) Phantom validation demonstration. (c) Model fitting of to extract and for phantom at 2 cm S-C separation (solid color curves: experimental data; dash-dotted curves: model fit). (d)–(f) Fitted parameters at multiple S-C separations. (g)–(i) Fitted parameters from ink titration test at 2 cm S-C separation, validated against iNIRS. Dash-dotted lines in (d), (e), and (h) denote theoretical optical properties. (j) Human forehead measurement geometry. (k) Model fitting of to extract and in vivo at 2 cm S-C separation in subject #1. (l)–(n) Fitted parameters from 2 subjects. Error bars: 95% confidence intervals.
To parametrically determine and , we approximate the TOF-filtered light intensity with a homogeneous semi-infinite diffusion model [59]:
| (6) |
We fit the measured data to the theoretical model to determine and by minimizing the penalty term, defined as
| (7) |
Here, indexes values, indexes values, and is a constant that accounts for probe coupling variations. Note that was normalized by reference intensity for each integration window (see detail in next paragraph) before fitting and , so only reflects sample power changes.
We first validated this method experimentally on a phantom with intralipid and distilled water, with theoretical and [Figs. 3(b)–3(f)]. was sampled at S-C separations from 1–2.5 cm. At each S-C separation and value, we continuously acquired data while ramping linearly over 10 s from 0–0.52GHz ( from ). was calculated at 100 Hz, then digitally convolved with a 0.5 s integration window to produce the colored curves in Fig. 3(c). Both and were fitted with the diffusion model at each S-C separation [Figs. 3(d) and 3(e). Better agreement with theoretical values was achieved towards S-C separations of 2 cm and longer.
We then validated this method at 2 cm S-C separation against TOF-resolved iNIRS [38,56] at 1.1 cm S-C separation on an intralipid phantom with theoretical , varying via ink titration [Figs. 3(g)–3(i)]. was measured and processed as described above. Both and were determined by fitting with a diffusion model and compared with iNIRS measurements [Figs. 3(g) and 3(h)]. A linear relationship between recovered by the two methods was observed .
We also tested the method on the human head in vivo at 2 cm S-C [, Figs. 3(j)–3(n)]. For each subject, we continuously took data while ramping linearly over two consecutive 10 s cycles from 0–0.978 GHz ( from ) at each value. was calculated at 100 Hz, then digitally convolved with an integration window equal to the heartbeat period (heart rate determined from 100 Hz time course) to suppress pulsatile variations, and finally averaged over repeated cycles to produce the colored curves in Fig. 3(k). Both and were fitted [Figs. 3(l) and 3(m)]. Optical properties are reasonable given the Chinese and Indian ancestry of subjects 1 and 2, respectively [60–62].
E. Choosing a TOF Filter to Optimize Brain-to-Scalp Sensitivity
Next, we investigated the potential of a TOF filter to improve brain specificity. Recent works have defined optimality of TOF filters using figures-of-merit [63]. Here, to investigate optimality, Monte Carlo simulations [64] of a three-layer head model [Fig. 4(a)] were performed to assess benefits of TOF filtering. (; ; .) Scalp optical properties agree with values determined experimentally in the section above. Sixteen S-C separations (0.5–3.5 cm, with 0.2 cm increments) were tested. The simulation saved the partial path length in each layer and the total TOF for each received photon. Various (, corresponding to from 0–6GHz) and were applied to study effects of TOF filtering.
Fig. 4.

TOF filtering improves the tradeoff between photon count and brain specificity. (a)–(d) By applying different TOF filters (i.e., varying and ) with a simulated three-layer model (a), photon number and brain specificity of the zero-lag derivative (b), proportional to the ratio according to Eqs. (11) and (12), vary accordingly (c). Some combinations of and yield higher photon count and higher brain specificity than CW (yellow line). Such combinations are depicted as the gray shaded region in (d). (e) Zero lag derivative, , is negatively correlated with ratio at 0.9 cm S-C, making it a good surrogate for brain specificity. Other S-C separations showed a similar correlation (data not shown).
The filtered photon count for each combination of and was calculated as
| (8) |
where denotes the index of each collected simulated photon with a total of collected photons, and is an attenuation factor for each photon that accounts for absorption [15]. For each tissue layer, the partial path length for layer was determined as
| (9) |
Equations (8) and (9) are valid both with and without TOF filtering, where in the CW case and there is no dependence on and . To evaluate blood flow indices, we used the decay rate or slope of the autocorrelation at zero [Fig. 4(b)] [35], given by
| (10) |
where is the time lag of is the wavenumber, and indexes layers. This simple expression states that the contribution of each layer to depends on its BFI, , and scattering . Sensitivity is defined as the relative change in the zero lag slope per relative BFI change in layer :
| (11) |
This definition of sensitivity differs slightly from our previous ones, which did not normalize to the zero lag slope [35,65]. As skull BFI was assumed to be zero, brain specificity was taken as the ratio of the brain and scalp sensitivities [35]:
| (12) |
For these simulations, we assumed , and . Filtered photon count, brain specificity, and were calculated for all simulated S-C separations, using either CW or TOF-filtered with variable and .
The simulations reveal the benefits of TOF filtering. Every point above the yellow curve in Figs. 4(c) and 4(d) represents an improvement over CW. Some TOF filters achieve brain specificity of CW at longer S-C separation, but with more photon counts and better localization. Stated another way, these TOF filters achieve identical photon counts to CW at longer S-C separation, but with better brain specificity and localization. Yet, many TOF filters perform worse than CW, falling below the yellow curve in Fig. 4(c). We conclude that TOF discrimination can achieve a more favorable compromise between photon counts and brain specificity, provided that the TOF filter is carefully chosen.
How can we find an optimal or near-optimal TOF filter in vivo where an accurate anatomical model and layer may not be available? Figure 4(e) shows that is negatively correlated with ratio, or brain specificity, serving as an experimental surrogate. In other words, a TOF filter that maximizes the zero lag decay rate should also (approximately) maximize brain specificity. We employed this strategy for human measurements, described next.
3. RESULTS
A. Optimal TOF Filtering
We begin by describing determination of the optimal TOF filter in vivo. We placed the probe on an adult forehead with 1 cm S-C separation [Fig. 5(a)]. We first collected data at various (1.79, 2.28, 3.25 ns), ramping linearly from ( from ) at each . As justified in Fig. 4(d), we used as a surrogate for brain specificity. To estimate was calculated at various by digitally convolving over one heartbeat to eliminate pulsatile variations, and averaging over two ramping cycles. was then fit to a modified exponential model that accounted for decorrelation during finite exposure time of the camera (Supplement 1 S9), with fitting range of . Then [Fig. 5(b)] was determined analytically from fit parameters (Supplement 1 S9) [35]. The optimal TOF filter was determined by selecting and that yielded the fastest [Fig. 5(b)]. Note that this choice nearly coincided with the minimum filtered photon count [Fig. 5(c)].
Fig. 5.

TOF filter optimization. (a) A fiber-optic probe with 1 cm S-C separation was fixed on the human forehead. According to Fig. 4(d), the and combination that maximized the initial decay, , defines the optimal TOF filter. (b)–(c) At a single location, for various (1.79,2.28,3.25 ns), (b) and TOF-filtered light intensity (c) change with , showing a clear optimum. (d)–(e) At different locations, the ratio of the optimally TOF-filtered and correlates with the (d), but not with the locally optimal (e).
We next investigated spatial variability in the change in decay rate achieved by TOF filtering. We locally optimized the TOF filter as shown in Figs. 5(b) and 5(c) at 20 different locations [Figs. 5(d) and 5(e)] on the forehead of one subject with 1 cm S-C separation. For each location, we calculated both without TOF filtering (CW) and with the locally optimal TOF filter. We found that the ratio of optimally TOF-filtered and CW measurements of is correlated with CW [, Fig. 5(d)], but not with the locally optimal [, Fig. 5(e)]. Assuming that 1 cm S-C CW is due mainly to superficial BFI, Fig. 5(d) suggests that TOF filtering results in better brain specificity where superficial BFI is lower, in agreement with previous work [65].
B. Pressure Modulation
Next, we investigated the reduction in scalp sensitivity achieved by TOF filtering. Picking the optimal TOF filter for each subject and location , we collected data during application of increased external pressure on the forehead, where a decrease in scalp blood flow is expected [20,23] (baseline: 20 s, applying pressure: ~10 s, steady pressure: 20 s [shaded in Figs. 6(b) and 6(c)], and recovery after pressure release: 30 s). A stable measurement during external pressure would indicate scalp insensitivity, a positive attribute. We placed the probe on the forehead with 1 cm S-C separation, and switched TOF filtering on and off at the heart rate to collect CW and TOF-filtered time courses quasi-concurrently [Fig. 6(a)]. CW and TOF-filtered were calculated by fitting the measured (integrated over one heartbeat to suppress pulsatile variations) to a modified biexponential model (Supplement 1 S9), with fitting range of .
Fig. 6.

TOF filtering reduces sensitivity to scalp pressure modulation. (a) A fiber-optic probe with 1 cm S-C separation was fixed on the forehead. CW and TOF-filtered data were measured quasi-concurrently, by switching laser tuning off and on at heart rate measured pulsatile blood flow traces at 100 Hz sampling rate and 0.03 s integration time). (b)–(c) Typical single trial CW and TOF-filtered raw and normalized decay rate time courses during pressure modulation. (d) Group means of normalized CW and TOF-filtered decay (baseline = 1) rates during increased forehead pressure. Error bars: standard deviations. (e) Baseline versus normalized decay rates during increased forehead pressure, for CW and TOF-filtering, with pairs from the same trial linked via a dashed line.
With increased forehead pressure, CW decreased relatively more than TOF-filtered in a single trial [Figs. 6(b) and 6(c)] and across all trials [Figs. 6(d) and 6(e)]. The baseline-normalized CW () was significantly lower than the baseline-normalized TOF-filtered during increased forehead pressure (; paired t-test: ). In summary, TOF filtering achieves just of the scalp sensitivity of CW measurements, a 2.7-fold reduction.
C. High Density Forehead Mapping
Because TOF filtering at 1 cm S-C separation improves spatial localization by nearly two-fold compared to CW measurements at 3 cm S-C separation [Fig. 1(f) and Supplement 1 S3], we measured the human forehead with high density, without (CW) and with TOF filtering, across symmetric bilateral areas with 5 mm sampling [Fig. 7(a)]. A 1 cm S-C separation contact probe was manually translated across different locations on the forehead [Fig. 7(a) inset]. At each of the 176 locations [Fig. 7(a)], CW and TOF-filtered ( and ) data were collected for 3 s each. was calculated at 100 Hz, with background and shot noise correction, as well as reference normalization [35]. To determine decay rate [Figs. 7(b) and 7(c)], was integrated over three full heartbeats to suppress pulsatile variations, then fitted to a modified biexponential model (Supplement 1 S9), with a fitting range of . CW and TOF-filtered measurements show a weak correlation , consistent with partially overlapping but distinct information content.
Fig. 7.

(a) Spatial localization and brain specificity enable imaging of multiple parameters via forehead mapping. (b) CW decay rate (biexponential fitting from ), (c) TOF-filtered decay rate (biexponential fitting from ), (d) CW light intensity , (e) TOF-filtered light intensity , (f) ratio of TOF-filtered to CW light intensity, (g) CW pulsatility of the fundamental frequency, (h) TOF-filtered pulsatility of the fundamental frequency, and (i) pulsatility difference between TOF-filtering and CW.
To determine CW light intensity [Fig. 7(d)], we integrated over three full heartbeats. Due to low SNR, TOF-filtered light intensity was determined from the fit of described in the last paragraph [Fig. 7(e)]. As individual intensity images showed asymmetric artifacts [Figs. 7(d) and 7(e)], likely related to probe coupling variations, we formed a ratio image of the TOF-filtered to CW intensity [Fig. 7(f)]. Despite the asymmetries in CW and TOF-filtered intensity images, the intensity ratio [Fig. 7(f)] showed a symmetric superior-medial to inferior-lateral gradient on both sides (after mirroring, the contralateral correlation was ). This pattern is most likely related to gradual geometry changes across the forehead that lead to changes in DTOF shape.
To determine pulsatility [66] [Figs. 7(g) and 7(h)], BFI time courses were calculated over three full heart beats by fitting (100 Hz resolution) to an exponential model with a fitting range of . Pulsatility was then calculated as twice the amplitude of the fundamental Fourier component of the BFI time course divided by the average value. Interestingly, TOF-filtered pulsatility [Fig. 7(h)], but not CW pulsatility [Fig. 7(g)] or their difference [Fig. 7(i)], showed a contralateral correlation after mirroring (TOF-filtered pulsatility: ; CW pulsatility: ; difference: ).
4. DISCUSSION
To date, CLF methods have achieved TOF discrimination [11,38,44,46,47,67] or parallelization [29,30,35,39–42] but not both at once. Our method of TOF discrimination in iDWS is compatible with highly parallel detection, thus adding a unique and accessible approach to the growing arsenal of iDO technologies.
When comparing this approach to previous interferometric approaches [68], we must distinguish between TOF (path length) resolution and TOF (path length) discrimination. Previously iNIRS used subcentimeter path length filters to resolve the temporal point spread function (TPSF) [38], yet our present approach uses a broad coherence gate of tens of centimeters. Instead of trying to resolve the full path length distribution, our approach is best described as discriminating late paths by reducing coherence for early paths. Our approach is compatible with highly parallel multimode collection at a low cost per channel, dramatically improving upon the signal-to-noise ratio of iNIRS, which uses just one or a few single mode collection channels [65]. Path length discrimination enables the use of shorter source-collector separations than previous iDWS approaches [41], with higher light levels and better spatial localization. We achieved a reduction in scalp sensitivity of 2.7-fold by TOF filtering at 1 cm S-C separation. With CW iDWS [35] we must increase the S-C separation to 3 cm to achieve a similar reduction in scalp sensitivity. However, 3 cm S-C separation CW iDWS yields just 15% of the effective photon counts (signal-to-noise ratio) and sacrifices brain spatial localization by an estimated factor of nearly two compared to the TOF-filtered approach presented here (Supplement 1 S3, Table S2). The higher effective photon count rate could be particularly enabling in applications such as noninvasive intracranial pressure monitoring [69,70], which requires short integration times.
In this work, we assumed that the optimal TOF filter maximized the zero-lag autocorrelation derivative. This assumption is somewhat validated by the dramatically reduced filtered photon count [Fig. 5(b)], which suggests that early photons are attenuated, and by the reduced scalp sensitivity achieved by our chosen TOF filter [Fig. 6(e)]. Yet, our chosen TOF filter could be suboptimal in the presence of heterogeneities in superficial or brain blood flow.
With the unique capabilities of brain-specificity and spatial localization, we performed imaging of multiple CLF and intensity parameters across the human forehead, with and without TOF-discrimination (Fig. 7). Such multiparametric imaging was not feasible with our previous iDWS approach [35], which required a larger S-C separation and did not provide TOF-discrimination. Though a thorough analysis of these information-rich data sets is beyond the scope of this work, our preliminary analysis clearly shows the artifacts of CW measurements [Fig. 7(d)], with better robustness achieved by considering TOF-discriminated and CW measurements together [Fig. 7(f)].
Our approach also contrasts with conventional time-domain (TD-) DCS. TD-DCS requires time-resolved detectors for TOF resolution, and thus is limited by the detector temporal response [63,71]. Instead, by shaping the coherence function (TOF filter) via controlled light source fluctuations, our approach achieves TOF filtering without modifying the detector. This feature further enables a new DO paradigm where we parametrically vary a TOF filter to probe the medium TOF distribution. We do not acquire a full TPSF in the conventional sense, and therefore our approach is different from conventional time-domain NIRS [53]. Yet, we are still able to recover parametric information about the medium. Our approach accurately recovers scattering, while absorption recovered by our approach correlates well with that recovered by TOF-resolved iNIRS. The lack of absolute agreement [Fig. 3(g)] is a common issue in diffuse optics [72], but could easily be corrected in this case by an affine transformation.
It is instructive to compare our variable interferometric TOF filter approach to more conventional ones. It is certainly possible to achieve interferometric TOF filtering with an intrinsically low coherence light source [73]. However, the GHz linewidths, needed here for nanosecond-scale TOF filters, exceed those of single mode lasers. Broadband luminescent sources are limited in power. Multimode lasers diodes such as a nonstabilized HeNe [37] have undesirable features in the coherence function and low stability. Our approach of laser tuning during the integration time [74] provides a flexible way to achieve desirable coherence properties needed for an effective nanosecond-scale path length filter. We envision that higher-order harmonics of the fundamental frequency, nonsinusoidal tuning approaches, or alternative methods of line broadening such as phase modulation could further tailor the coherence profile to increase the brain specificity for a given photon count level [63], and further improve upon the results in Fig. 6(e).
For years a central dogma of diffuse optics was that CW NIRS achieves high photon counts and low brain specificity, while CLF methods like DCS achieve high brain specificity and low photon counts [18]. Recent innovations of highly parallel interferometric detection [35] and longer wavelength DCS [36,75] have dramatically improved the signal-to-noise ratio of the CLF signal. Now, photon counts can be traded for brain specificity by increasing S-C separation up to 3.5 cm or more. However, such an approach sacrifices spatial localization and wastes photons. Here, we advance the field by introducing a parallelizable TOF-discriminated CLF approach to greatly improve brain specificity at 1 cm S-C separation, moving closer to the ultimate goal of brain-specific, spatially-localized, and scalable diffuse optics.
Supplementary Material
Funding.
National Institutes of Health (EB029747, EB032840, EY031469, NS094681); National Natural Science Foundation of China (62105315).
Footnotes
Disclosures. The authors declare no conflicts of interest.
Supplemental document. See Supplement 1 for supporting content.
Data availability.
Data underlying the results presented in this paper are not publicly available at this time but may be obtained from the authors upon reasonable request.
REFERENCES
- 1.Irani F, Platek SM, Bunce S, Ruocco AC, and Chute D, “Functional near infrared spectroscopy (fNIRS): an emerging neuroimaging technology with important applications for the study of brain disorders,” Clin. Neuropsychol 21, 9–37 (2007). [DOI] [PubMed] [Google Scholar]
- 2.Belliveau JW, Kennedy DN Jr., McKinstry RC, Buchbinder BR, Weisskoff RM, Cohen MS, Vevea JM, Brady TJ, and Rosen BR, “Functional mapping of the human visual cortex by magnetic resonance imaging,” Science 254, 716–719 (1991). [DOI] [PubMed] [Google Scholar]
- 3.Pinti P, Aichelburg C, Gilbert S, Hamilton A, Hirsch J, Burgess P, and Tachtsidis I, “A review on the use of wearable functional near-infrared spectroscopy in naturalistic environments,” Jpn. Psychol. Res 60, 347–373 (2018). [DOI] [PMC free article] [PubMed] [Google Scholar]
- 4.Zhang Q, Brown EN, and Strangman GE, “Adaptive filtering to reduce global interference in evoked brain activity detection: a human subject case study,” J. Biomed. Opt 12, 064009 (2007). [DOI] [PubMed] [Google Scholar]
- 5.Wyser D, Mattille M, Wolf M, Lambercy O, Scholkmann F, and Gassert R, “Short-channel regression in functional near-infrared spectroscopy is more effective when considering heterogeneous scalp hemodynamics,” Neurophotonics 7, 035011 (2020). [DOI] [PMC free article] [PubMed] [Google Scholar]
- 6.Yamada Y, Suzuki H, and Yamashita Y, “Time-domain near-infrared spectroscopy and imaging: a review,” Appl. Sci 9, 1127 (2019). [Google Scholar]
- 7.Pogue BW and Patterson MS, “Frequency-domain optical-absorption spectroscopy of finite tissue volumes using diffusion-theory,” Phys. Med. Biol 39, 1157–1180 (1994). [DOI] [PubMed] [Google Scholar]
- 8.Hebden JC, “Exploring the feasibility of wavelength modulated near-infrared spectroscopy,” J. Biomed. Opt 25, 110501 (2020). [DOI] [PMC free article] [PubMed] [Google Scholar]
- 9.Pifferi A, Contini D, Mora AD, Farina A, Spinelli L, and Torricelli A, “New frontiers in time-domain diffuse optics, a review,” J. Biomed. Opt 21, 091310 (2016). [DOI] [PubMed] [Google Scholar]
- 10.Selb J, Stott JJ, Franceschini MA, Sorensen AG, and Boas DA, “Improved sensitivity to cerebral hemodynamics during brain activation with a time-gated optical system: analytical model and experimental validation,” J. Biomed. Opt 10, 11013 (2005). [DOI] [PubMed] [Google Scholar]
- 11.Sutin J, Zimmerman B, Tyulmankov D, Tamborini D, Wu KC, Selb J, Gulinatti A, Rech I, Tosi A, Boas DA, and Franceschini MA, “Time-domain diffuse correlation spectroscopy,” Optica 3, 1006–1013 (2016). [DOI] [PMC free article] [PubMed] [Google Scholar]
- 12.Torricelli A, Pifferi A, Spinelli L, Cubeddu R, Martelli F, Del Bianco S, and Zaccanti G, “Time-resolved reflectance at null source-detector separation: improving contrast and resolution in diffuse optical imaging,” Phys. Rev. Lett 95, 078101 (2005). [DOI] [PubMed] [Google Scholar]
- 13.Durduran T and Yodh AG, “Diffuse correlation spectroscopy for non-invasive, micro-vascular cerebral blood flow measurement,” Neuroimage 85, 51–63 (2014). [DOI] [PMC free article] [PubMed] [Google Scholar]
- 14.Li J, Dietsche G, Iftime D, Skipetrov SE, Maret G, Elbert T, Rockstroh B, and Gisler T, “Noninvasive detection of functional brain activity with near-infrared diffusing-wave spectroscopy,” J. Biomed. Opt 10, 44002 (2005). [DOI] [PubMed] [Google Scholar]
- 15.Boas DA, Sakadzic S, Selb J, Farzam P, Franceschini MA, and Carp SA, “Establishing the diffuse correlation spectroscopy signal relationship with blood flow,” Neurophotonics 3, 031412 (2016). [DOI] [PMC free article] [PubMed] [Google Scholar]
- 16.He L, Baker WB, Milej D, Kavuri VC, Mesquita RC, Busch DR, Abramson K, Jiang JY, Diop M, Lawrence KS, Amendolia O, Quattrone F, Balu R, Kofke WA, and Yodh AG, “Noninvasive continuous optical monitoring of absolute cerebral blood flow in critically ill adults,” Neurophotonics 5, 045006 (2018). [DOI] [PMC free article] [PubMed] [Google Scholar]
- 17.Baker WB, Parthasarathy AB, Busch DR, Mesquita RC, Greenberg JH, and Yodh AG, “Modified Beer-Lambert law for blood flow,” Biomed. Opt. Express 5, 4053–4075 (2014). [DOI] [PMC free article] [PubMed] [Google Scholar]
- 18.Selb J, Boas DA, Chan ST, Evans KC, Buckley EM, and Carp SA, “Sensitivity of near-infrared spectroscopy and diffuse correlation spectroscopy to brain hemodynamics: simulations and experimental findings during hypercapnia,” Neurophotonics 1, 015005 (2014). [DOI] [PMC free article] [PubMed] [Google Scholar]
- 19.Hussain A, Steenbergen W, and Vellekoop IM, “Imaging blood flow inside highly scattering media using ultrasound modulated optical tomography,” J. Biophoton 11, e201700013 (2018). [DOI] [PubMed] [Google Scholar]
- 20.Milej D, Abdalmalak A, Rajaram A, and St Lawrence K, “Direct assessment of extracerebral signal contamination on optical measurements of cerebral blood flow, oxygenation, and metabolism,” Neurophotonics 7, 045002 (2020). [DOI] [PMC free article] [PubMed] [Google Scholar]
- 21.Wu MM, Chan ST, Mazumder D, Tamborini D, Stephens KA, Deng B, Farzam P, Chu JY, Franceschini MA, Qu JZ, and Carp SA, “Improved accuracy of cerebral blood flow quantification in the presence of systemic physiology cross-talk using multi-layer Monte Carlo modeling,” Neurophotonics 8, 015001 (2021). [DOI] [PMC free article] [PubMed] [Google Scholar]
- 22.Verdecchia K, Diop M, Lee A, Morrison LB, Lee TY, and St Lawrence K, “Assessment of a multi-layered diffuse correlation spectroscopy method for monitoring cerebral blood flow in adults,” Biomed. Opt. Express 7, 3659–3674 (2016). [DOI] [PMC free article] [PubMed] [Google Scholar]
- 23.Baker WB, Parthasarathy AB, Ko TS, Busch DR, Abramson K, Tzeng SY, Mesquita RC, Durduran T, Greenberg JH, Kung DK, and Yodh AG, “Pressure modulation algorithm to separate cerebral hemodynamic signals from extracerebral artifacts,” Neurophotonics 2, 035004 (2015). [DOI] [PMC free article] [PubMed] [Google Scholar]
- 24.He L, Lin Y, Shang Y, Shelton BJ, and Yu GQ, “Using optical fibers with different modes to improve the signal-to-noise ratio of diffuse correlation spectroscopy flow-oximeter measurements,” J. Biomed. Opt 18, 037001 (2013). [DOI] [PMC free article] [PubMed] [Google Scholar]
- 25.Carp SA, “Novel approaches for increased sensitivity to cerebral blood flow using diffuse correlation spectroscopy,” in Optics and the Brain (Optica Publishing Group, 2020), paper BTh3C.1. [Google Scholar]
- 26.Li J, Jaillon F, Dietsche G, Maret G, and Gisler T, “Pulsation-resolved deep tissue dynamics measured with diffusing-wave spectroscopy,” Opt. Express 14, 7841–7851 (2006). [DOI] [PubMed] [Google Scholar]
- 27.Wang D, Parthasarathy AB, Baker WB, Gannon K, Kavuri V, Ko T, Schenkel S, Li Z, Li Z, Mullen MT, Detre JA, and Yodh AG, “Fast blood flow monitoring in deep tissues with real-time software correlators,” Biomed. Opt. Express 7, 776–797 (2016). [DOI] [PMC free article] [PubMed] [Google Scholar]
- 28.Cheng R, Shang Y, Hayes D Jr., Saha SP, and Yu G, “Noninvasive optical evaluation of spontaneous low frequency oscillations in cerebral hemodynamics,” Neuroimage 62, 1445–1454 (2012). [DOI] [PubMed] [Google Scholar]
- 29.Liu WH, Qian RB, Xu SQ, Konda PC, Jonsson J, Harfouche M, Borycki D, Cooke C, Berrocal E, Dai QH, Wang HQ, and Horstmeyer R, “Fast and sensitive diffuse correlation spectroscopy with highly parallelized single photon detection,” APL Photon. 6, 026106 (2021). [Google Scholar]
- 30.Sie EJ, Chen H, Saung EF, Catoen R, Tiecke T, Chevillet MA, and Marsili F, “High-sensitivity multispeckle diffuse correlation spectroscopy,” Neurophotonics 7, 035010 (2020). [DOI] [PMC free article] [PubMed] [Google Scholar]
- 31.Dragojevic T, Hollmann JL, Tamborini D, Portaluppi D, Buttafava M, Culver JP, Villa F, and Durduran T, “Compact, multi-exposure speckle contrast optical spectroscopy (SCOS) device for measuring deep tissue blood flow,” Biomed. Opt. Express 9, 322–334 (2018). [DOI] [PMC free article] [PubMed] [Google Scholar]
- 32.Dragojević T, Hollmann J, Rosas EV, Pasquinelli K, Cusini I, Culver J, Villa F, and Durduran T, “Fast, high-density functional speckle contrast optical tomography of the adult brain,” in Optics and the Brain (Optical Society of America, 2020), paper BTh3C.3. [Google Scholar]
- 33.Bi RZ, Du Y, Singh G, Ho RJH, Zhang SY, Attia ABE, Li XT, and Olivo M, “Fast pulsatile blood flow measurement in deep tissue through a multimode detection fiber,” J. Biomed. Opt 25, 1–10 (2020). [DOI] [PMC free article] [PubMed] [Google Scholar]
- 34.Murali K and Varma HM, “Multi-speckle diffuse correlation spectroscopy to measure cerebral blood flow,” Biomed. Opt. Express 11, 6699–6709 (2020). [DOI] [PMC free article] [PubMed] [Google Scholar]
- 35.Zhou W, Kholiqov O, Zhu J, Zhao M, Zimmermann LL, Martin RM, Lyeth BG, and Srinivasan VJ, “Functional interferometric diffusing wave spectroscopy of the human brain,” Sci. Adv 7, eabe0150 (2021). [DOI] [PMC free article] [PubMed] [Google Scholar]
- 36.Ozana N, Zavriyev AI, Mazumder D, Robinson M, Kaya K, Blackwell M, Carp SA, and Franceschini MA, “Superconducting nanowire single-photon sensing of cerebral blood flow,” Neurophotonics 8, 035006 (2021). [DOI] [PMC free article] [PubMed] [Google Scholar]
- 37.Safi AM, Moka S, Harrah M, Cini S, and Parthasarathy AB, “Quantitative measurement of static and dynamic tissue optical properties with continuous wave pathlength resolved diffuse correlation spectroscopy,” in Biophotonics Congress, OSA Technical Digest (Optical Society of America, 2021), paper BTh1B.6. [Google Scholar]
- 38.Kholiqov O, Zhou W, Zhang T, Du Le VN, and Srinivasan VJ, “Time-of-flight resolved light field fluctuations reveal deep human tissue physiology,” Nat. Commun 11, 391 (2020). [DOI] [PMC free article] [PubMed] [Google Scholar]
- 39.James E and Powell S, “Fourier domain diffuse correlation spectroscopy with heterodyne holographic detection,” Biomed. Opt. Express 11, 6755–6779 (2020). [DOI] [PMC free article] [PubMed] [Google Scholar]
- 40.Xu J, Jahromi AK, Brake J, Robinson JE, and Yang C, “Interferometric speckle visibility spectroscopy (ISVS) for human cerebral blood flow monitoring,” APL Photon. 5, 126102 (2020). [Google Scholar]
- 41.Zhou W, Kholiqov O, Chong SP, and Srinivasan VJ, “Highly parallel, interferometric diffusing wave spectroscopy for monitoring cerebral blood flow dynamics,” Optica 5, 518–527 (2018). [DOI] [PMC free article] [PubMed] [Google Scholar]
- 42.Zhou W, Zhao M, Kholiqov O, and Srinivasan VJ, “Multi-exposure interferometric diffusing wave spectroscopy,” Opt. Lett 46, 4498–4501 (2021). [DOI] [PMC free article] [PubMed] [Google Scholar]
- 43.James E, Powell S, and Munro P, “Performance optimisation of a holographic Fourier domain diffuse correlation spectroscopy instrument,” Biomed. Opt. Express 13, 3836–3853 (2022). [DOI] [PMC free article] [PubMed] [Google Scholar]
- 44.Samaei S, Sawosz P, Kacprzak M, Pastuszak Z, Borycki D, and Liebert A, “Time-domain diffuse correlation spectroscopy (TD-DCS) for noninvasive, depth-dependent blood flow quantification in human tissue in vivo,” Sci. Rep 11, 1817 (2021). [DOI] [PMC free article] [PubMed] [Google Scholar]
- 45.Pagliazzi M, Colombo L, Vidal-Rosas EE, Dragojevic T, Parfentyeva V, Culver JP, Sekar SKV, Di Sieno L, Contini D, Torricelli A, Pifferi A, Dalla Mora A, and Durduran T, “Time resolved speckle contrast optical spectroscopy at quasi-null source-detector separation for non-invasive measurement of microvascular blood flow,” Biomed. Opt. Express 12, 1499–1511 (2021). [DOI] [PMC free article] [PubMed] [Google Scholar]
- 46.Poon CS, Langri DS, Rinehart B, Rambo TM, Miller AJ, Foreman B, and Sunar U, “First-in-clinical application of a time-gated diffuse correlation spectroscopy system at 1064 nm using superconducting nanowire single photon detectors in a neuro intensive care unit,” Biomed. Opt. Express 13, 1344–1356 (2022). [DOI] [PMC free article] [PubMed] [Google Scholar]
- 47.Parfentyeva V, Colombo L, Lanka P, Pagliazzi M, Brodu A, Noordzij N, Qin-Dregely J, Kolarczik M, Dalla Mora A, and Contini D, “Fast in-vivo time-domain diffuse correlation spectroscopy,” in Optical Tomography and Spectroscopy (Optica Publishing Group, 2022), paper OM4D.7. [Google Scholar]
- 48.Ozana N, Lue N, Renna M, Robinson M, Martin A, Zavriyev AI, Mazumder D, Blackwell M, Franceschini MA, and Carp S, “Functional time domain diffuse correlation spectroscopy,” Front. Neurosci 16, 932119 (2022). [DOI] [PMC free article] [PubMed] [Google Scholar]
- 49.Zarychta K, Tinet E, Azizi L, Avrillier S, Ettori D, and Tualle JM, “Time-resolved diffusing wave spectroscopy with a CCD camera,” Opt. Express 18, 16289–16301 (2010). [DOI] [PubMed] [Google Scholar]
- 50.Borycki D, Samaei S, and Nowacka K, “Parallel interferometric near-infrared spectroscopy (πIRS),” Proc. SPIE PC11959, PC119590C (2022). [DOI] [PMC free article] [PubMed] [Google Scholar]
- 51.Renna M, Richardson JM, Jordy G, Cheng T, Ringdahl E, Robinson M, Ozana N, Lue N, Aull B, and Carp S, “A novel 32 × 32 InP/InGaAs SPAD array for multi-channel time-gated diffuse correlation spectroscopy,” Proc. SPIE PC12089, PC120890E (2022). [Google Scholar]
- 52.Zhao M, Zhou W, Aparanji S, GhandiParsi S, and Srinivasan VJ, “Parallel interferometric diffusing wave spectroscopy (iDWS) with time-of-flight discrimination,” in Optics and the Brain (Optica Publishing Group, 2022), paper BW1C.3. [Google Scholar]
- 53.Patterson MS, Chance B, and Wilson BC, “Time resolved reflectance and transmittance for the non-invasive measurement of tissue optical properties,” Appl. Opt 28, 2331–2336 (1989). [DOI] [PubMed] [Google Scholar]
- 54.Coldren LA, Corzine SW, and Mashanovitch ML, Diode Lasers and Photonic Integrated Circuits (Wiley, 2012). [Google Scholar]
- 55.Strangman GE, Li Z, and Zhang Q, “Depth sensitivity and source-detector separations for near infrared spectroscopy based on the Colin27 brain template,” PLoS One 8, e66319 (2013). [DOI] [PMC free article] [PubMed] [Google Scholar]
- 56.Borycki D, Kholiqov O, Chong SP, and Srinivasan VJ, “Interferometric near-infrared spectroscopy (iNIRS) for determination of optical and dynamical properties of turbid media,” Opt. Express 24, 329–354 (2016). [DOI] [PMC free article] [PubMed] [Google Scholar]
- 57.Borycki D, Kholiqov O, and Srinivasan VJ, “Reflectance-mode interferometric near-infrared spectroscopy quantifies brain absorption, scattering, and blood flow index in vivo,” Opt. Lett 42, 591–594 (2017). [DOI] [PMC free article] [PubMed] [Google Scholar]
- 58.Kholiqov O, Borycki D, and Srinivasan VJ, “Interferometric near-infrared spectroscopy (iNIRS): performance tradeoffs and optimization,” Opt. Express 25, 28567–28588 (2017). [Google Scholar]
- 59.Contini D, Martelli F, and Zaccanti G, “Photon migration through a turbid slab described by a model based on diffusion approximation. 2. Theory,” Appl. Opt 36, 4587–4599 (1997). [DOI] [PubMed] [Google Scholar]
- 60.Choi J, Wolf M, Toronov V, Wolf U, Polzonetti C, Hueber D, Safonova LP, Gupta R, Michalos A, Mantulin W, and Gratton E, “Noninvasive determination of the optical properties of adult brain: near-infrared spectroscopy approach,” J. Biomed. Opt 9, 221–229 (2004). [DOI] [PubMed] [Google Scholar]
- 61.Karsten AE, Singh A, Karsten PA, and Braun MWH, “Diffuse reflectance spectroscopy as a tool to measure the absorption coefficient in skin: south African skin phototypes,” Photochem. Photobiol 89, 227–233 (2013). [DOI] [PubMed] [Google Scholar]
- 62.Jacques SL, “Optical properties of biological tissues: a review,” Phys. Med. Biol 58, R37–R61 (2013). [DOI] [PubMed] [Google Scholar]
- 63.Mazumder D, Wu MM, Ozana N, Tamborini D, Franceschini MA, and Carp SA, “Optimization of time domain diffuse correlation spectroscopy parameters for measuring brain blood flow,” Neurophotonics 8, 035005 (2021). [DOI] [PMC free article] [PubMed] [Google Scholar]
- 64.Yan S and Fang Q, “Hybrid mesh and voxel based Monte Carlo algorithm for accurate and efficient photon transport modeling in complex bio-tissues,” Biomed. Opt. Express 11, 6262–6270 (2020). [DOI] [PMC free article] [PubMed] [Google Scholar]
- 65.Kholiqov O, Zhou W, Zhang T, Zhao M, Ghandiparsi S, and Srinivasan VJ, “Scanning interferometric near-infrared spectroscopy for imaging of adult human forehead blood flow dynamics,” Opt. Lett 47, 110–113 (2021). [DOI] [PMC free article] [PubMed] [Google Scholar]
- 66.Wagshul ME, Eide PK, and Madsen JR, “The pulsating brain: a review of experimental and clinical studies of intracranial pulsatility,” Fluids Barriers CNS 8, 5 (2011). [DOI] [PMC free article] [PubMed] [Google Scholar]
- 67.Ozana N, Peruch A, Robinson M, Mazumder D, Blackwell M, Lue N, Carp S, and Franceschini MA, “Time-gated diffuse correlation spectroscopy for functional imaging via 1064 nm pulse laser shaping and superconducting nanowire single photon sensing,” Proc. SPIE 11629, 116292F (2021). [Google Scholar]
- 68.Tualle JM, Tinet E, and Avrillier S, “A new and easy way to perform time-resolved measurements of the light scattered by a turbid medium,” Opt. Commun 189, 211–220 (2001). [Google Scholar]
- 69.Ruesch A, Yang JS, Schmitt S, Acharya D, Smith MA, and Kainerstorfer JM, “Estimating intracranial pressure using pulsatile cerebral blood flow measured with diffuse correlation spectroscopy,” Biomed. Opt. Express 11, 1462–1476 (2020). [DOI] [PMC free article] [PubMed] [Google Scholar]
- 70.Flanders TM, Lang SS, Ko TS, Andersen KN, Jahnavi J, Flibotte JJ, Licht DJ, Tasian GE, Sotardi ST, Yodh AG, Lynch JM, Kennedy BC, Storm PB, White BR, Heuer GG, and Baker WB, “Optical detection of intracranial pressure and perfusion changes in neonates with hydrocephalus,” J. Pediatr 236, 54–61 (2021). [DOI] [PMC free article] [PubMed] [Google Scholar]
- 71.Cheng X, Chen H, Sie EJ, Marsili F, and Boas DA, “Development of a Monte Carlo-wave model to simulate time domain diffuse correlation spectroscopy measurements from first principles,” J. Biomed. Opt 27, 083009 (2022). [DOI] [PMC free article] [PubMed] [Google Scholar]
- 72.Fantini S and Sassaroli A, “Frequency-domain techniques for cerebral and functional near-infrared spectroscopy,” Front. Neurosci 14, 300 (2020). [DOI] [PMC free article] [PubMed] [Google Scholar]
- 73.Huang D, Swanson EA, Lin CP, Schuman JS, Stinson WG, Chang W, Hee MR, Flotte T, Gregory K, Puliafito CA, and Fujimoto JG, “Optical coherence tomography,” Science 254, 1178–1181 (1991). [DOI] [PMC free article] [PubMed] [Google Scholar]
- 74.McKinney JD, Webster MA, Webb KJ, and Weiner AM, “Characterization and imaging in optically scattering media by use of laser speckle and a variable-coherence source,” Opt. Lett 25, 4–6 (2000). [DOI] [PubMed] [Google Scholar]
- 75.Colombo L, Pagliazzi M, Konugolu Venkata Sekar S, Contini D, Durduran T, and Pifferi A, “In vivo time-domain diffuse correlation spectroscopy above the water absorption peak,” Opt. Lett 45, 3377–3380 (2020). [DOI] [PubMed] [Google Scholar]
Associated Data
This section collects any data citations, data availability statements, or supplementary materials included in this article.
Supplementary Materials
Data Availability Statement
Data underlying the results presented in this paper are not publicly available at this time but may be obtained from the authors upon reasonable request.