Abstract
Background and Objectives
Based on the Global Burden of Diseases, Injuries, and Risk Factors (GBD) study, neurologic disorders are a major cause of morbidity and mortality worldwide. However, there has been no comprehensive assessment of neurologic disorders in Asia. Data from the GBD 1990–2019 study were investigated to provide new details for neurologic disorders in Asia.
Methods
The burden of common neurologic disorders in Asia was calculated for 1990 and 2019 as incidence, prevalence, deaths, and disability-adjusted life-years (DALYs). Thirteen common neurologic disorders were analyzed. Data are presented as totals and by sex, age, year, location, risk factors, and sociodemographic index (SDI) and shown as counts and rates.
Results
In 2019, the most burdensome neurologic disorders in Asia for the absolute number of DALYs were stroke (98.8 million, 95% uncertainty interval [UI] 91.0–107.0), migraine (24.6 million, 95% UI 3.4–56.4), and Alzheimer disease (AD) and other dementias (13.5 million, 95% UI 5.9–29.8). From 1990 to 2019, the absolute number of DALYs and deaths caused by combined neurologic disorders (deaths by 60.7% and DALYs by 17.6%) increased, but the age-standardized rates (deaths by 34.1% and DALYs by 36.3%) decreased. The burden of neurologic disorders peaked among individuals aged 65–74 years and was higher among male than among female individuals; moreover, this burden varied considerably across Asian subregions and countries. Risk-attributable DALYs accounted for 86.9%, 28.5%, and 11.1% of DALYs for stroke, AD and other dementias, and multiple sclerosis, respectively. SDI was associated with both stroke and communicable neurological disorders. In terms of crude rate, the higher the SDI value, the higher the prevalence of stroke, and the lower all metrics of communicable neurological disorders.
Discussion
Neurologic disorders were the leading cause of DALYs and the second leading cause of deaths in Asia in 2019, and the burden may likely increase with the growth and aging of the Asian population. Urgent measures are needed for prevention, treatment, rehabilitation, and support services for common neurologic disorders regionally and nationally.
In 2016, globally, neurologic disorders were the leading cause of disability-adjusted life-years (DALYs) and the second leading cause of death.1 According to the Global Burden of Diseases, Injuries, and Risk Factors (GBD) study, neurologic disorders include communicable neurologic disorders, stroke, headache, neurodegenerative diseases, demyelinative diseases, brain and CNS cancers, and a residual category of other less common neurologic disorders.2-4 There is a need for comprehensive and up-to-date data regarding the prevalence, incidence, mortality, and disability rates of common neurologic disorders and their trends to facilitate the organization and allocation of health services. However, studies on the burden of neurologic diseases in Asia are limited. This study aimed to perform a comprehensive assessment of aggregated neurologic disorders and analysis of variations according to sex, age, year, and location.
Methods
Global Burden of Diseases Data Ascertainment
The GBD study is updated annually by the Institute for Health Metrics and Evaluation. Since the start of the GBD, the global health database has grown from 13,688 to 150,037 sources and now adds approximately 14,369 new information sources each year.1 Reported estimates span the period from 1990 to 2019. This analysis provided a more accurate representation of the overall effect of neurologic diseases on Asian health, including annual updates incorporate new data and methodological enhancements, to ensure that policymakers have access to the latest information to facilitate resource assignment decisions. The current report includes stroke, Alzheimer disease (AD), and other dementias, Parkinson disease (PD), motor neuron diseases (MNDs), multiple sclerosis (MS), idiopathic epilepsy, brain and other CNS cancers, migraine, tension-type headache (TTH), communicable conditions (tetanus, meningitis, and encephalitis), and a residual category of other less common neurologic disorders (eTables 1 and 2, links.lww.com/WNL/C729). Medication overuse headache is no longer included as a separate disorder; instead, it is considered a consequence of the underlying headache types.5
We excluded spinal cord injury and traumatic brain injury since, under the International Classification of Diseases rules, deaths from injury are categorized based on the cause of injury (including a fall or road injury) rather than the nature of the injury. Therefore, posttraumatic disorders were outside the scope of our study.6
Metric Estimates
Details about the methodology of nonfatal and mortality estimates, years lived with disability (YLDs), years of life lost (YLLs), and DALYs have been previously published.2,3 The GBD Results Tool provides online access to data sources for quantifying nonfatal and mortality outcomes, YLDs, and YLLs.7 DALYs are calculated as the sum of YLLs and YLDs, which is a specific indicator for within-disorder and between-disorder comparisons of mortality and nonfatal outcomes.3
Asian Subregions
The United Nations classifies 49 countries and territories into 5 geographic subregions based on epidemiologic similarity and geographical proximity, such as East Asia, Southeast Asia, Central Asia, South Asia, and West Asia.8 In this study, geographic differences in the epidemiologic characteristics of neurologic disorders were analyzed among Asian subregions.
Risk Factors
According to the GBD exposure definitions and statistical modeling, which were previously published, we used the GBD comparative risk assessment framework to estimate the exposure of risk factors related to neurologic disorders and their attributable disease burden.4 Relative risk data were pooled using meta-analyses of randomized control trials, prospective cohorts, and case-control studies. We calculated the risk factors attributable to the DALYs of each neurologic disorder by sex. We used mean risk factor exposure, strengthened by covariates, to calculate summary exposure values for each risk, a metric that ranged from 0% to 100% to describe the risk-weighted exposure for a population or risk-weighted prevalence of exposure.9
Sociodemographic Index
The sociodemographic index (SDI), which is expressed on a 0–10 scale, is a synthetic index of a country's lag-distributed income per capita, average years of schooling, and fertility rate among female individuals younger than 25 years.2 According to the degree of sociodemographic development, Asian countries and territories were classified into 5 quintiles based on their 2019 values: low, low-middle, middle, high-middle, and high SDI3 (eTables 3 and 4, links.lww.com/WNL/C729). The Pearson correlation analysis was used to assess correlations between all crude rates of neurologic disease burden and the SDI.
Data Analysis and Date Quality
The burden estimates are presented as absolute numbers and age-standardized rates of these metrics according to cause along with the corresponding 95% uncertainty intervals (UIs) and their changes or trends from 1990 to 2019.2 The estimates of absolute numbers indicate the actual situation and are thus useful for policy-makers, while age-standardized estimates allow comparisons over time and across countries and subregions, adjusting for the differences in the population age distribution. We adopted a simple star rating system from 0 to 5 to qualify the data available for a given country over the full time series used in GBD estimates. While stars are calculated for each 5-year time interval and the full-time series from 1980 to 2019, stars in the main text are presented for the full-time series only.7
Standard Protocol Approvals, Registrations, and Patient Consents
This study was approved by the medical ethics committee of Renmin Hospital of Wuhan University, China (WDRY2019-K028). Informed consent was not needed because no identifiable information was included in the analysis.
Results
Burden of Neurologic Disorders in Asia, 2019
In 2019, combined neurologic disorders included in this analysis were responsible for 167.4 million DALYs, comprising 12.2% of DALYs for all diseases in Asia. These neurologic disorders were the underlying cause of 5.79 million deaths, which comprised 18.5% of total Asian deaths in 2019. Based on the GBD Results Tool, neurologic disorders were the largest contributor to DALYs in 2019 in Asia, followed by neoplasms, and the second leading cause of death, behind only cardiovascular diseases (excluding stroke).
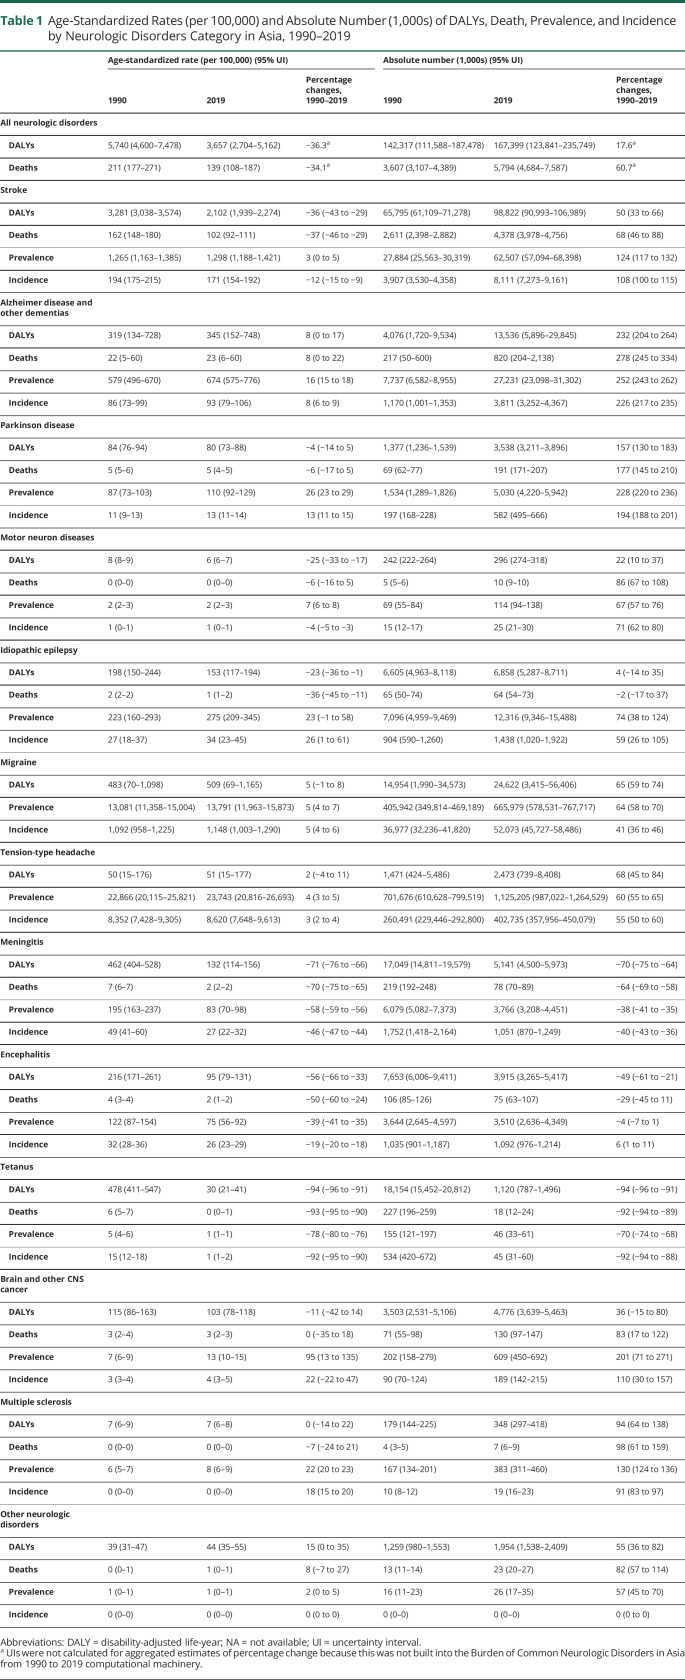
The details of the metrics of neurologic disorders in 2019 are summarized in Table 1. Among the neurologic disorders analyzed in Asia, the top 3 burdensome neurologic disorders, as measured by DALYs, were stroke (98.8 million, 95% UI 91.0–107.0), migraine (24.6 million, 95% UI 3.4–56.4), and AD and other dementias (13.5 million, 95% UI 5.9–29.8), while the 3 leading causes of death from neurologic disorders were stroke (4.4 million, 95% UI 4.0–4.8), followed by AD and other dementias (0.8 million, 95% UI 0.2–2.1) and PD (0.2 million, 95% UI 0.2–0.2). The 3 neurologic disorders with the highest prevalence and incidence were TTH (1,125.2 million, 95% UI 987.0–1,264.5; 402.7 million, 95% UI 358.0–450.1, respectively), migraine (666.0 million, 95% UI 578.5–767.7; 52.1 million, 95% UI 45.7–58.5, respectively), and stroke (62.5 million, 95% UI 57.1–68.4; 8.1 million, 95% UI 7.3–9.2, respectively).
Table 1.
Age-Standardized Rates (per 100,000) and Absolute Number (1,000s) of DALYs, Death, Prevalence, and Incidence by Neurologic Disorders Category in Asia, 1990–2019
Changes in the Burden of Neurologic Disorders in Asia, 1990–2019
The growing absolute metric numbers are likely to indicate the increasing burden of neurologic disorders in Asian populations, while the fall in age-standardized rates implies that the trend in absolute metric numbers was driven mainly by demographic changes. Since 1990, there has been an increase in the absolute number of deaths and DALYs in Asia by 60.7% and 17.6%, respectively, while over the same time, the age-standardized rates of deaths and DALYs have declined by 34.1% and 36.3%, respectively. Stroke remained the leading cause of DALYs and deaths in Asia, accounting for the largest proportion of total DALYs (46.2% in 1990 and 59.0% in 2019) and deaths (72.4% in 1990 and 75.5% in 2019) among all neurologic disorders analyzed in Asia (Table 1).
Overall, the burden of most noncommunicable neurologic disorders increased, while the burden of communicable neurologic disorders decreased from 1990 to 2019. For the absolute number of DALYs and deaths, the top 3 fastest growing causes were AD and other dementias, PD, and MS, while idiopathic epilepsy remained unchanged during this time. Regarding incidence and prevalence, the 3 largest growth rates observed were for AD and other dementias, PD, and brain and other CNS cancers. The only neurologic disorders that decreased in age-standardized rates and absolute numbers of all metrics were communicable neurologic disorders (tetanus, meningitis, and encephalitis) (Table 1).
The 49 Asian countries and territories are summarized in Table 2. There were remarkable geographic differences in age-standardized DALY rates of neurologic disorders among Asian countries and territories in 2019 (eTable 5, links.lww.com/WNL/C729). The age-standardized DALY rates of neurologic disorders substantially decreased in 44 Asian countries and territories, while they increased in Uzbekistan, the Philippines, Turkmenistan, Azerbaijan, and Tajikistan.
Table 2.
SDI Levels of Asian Countries in 2019 and Data Quality Rating From 1980 to 2019

Asian Burden of Neurologic Disorders by Age and Sex, 2019
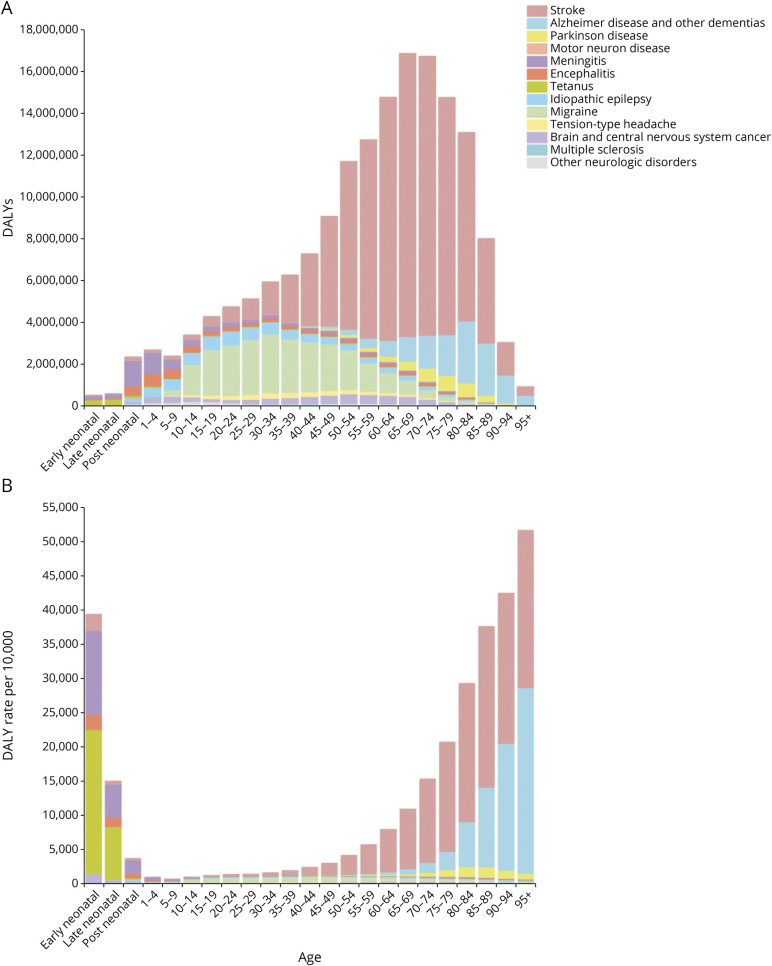
Different neurologic disorders had different age distributions and age-standardized DALY rates. The details of all-age and age-standardized DALY rates of neurologic disorders in 2019 are shown in Figure 1. Among children younger than 5 years, communicable neurologic disorders, mainly tetanus and meningitis, were the dominant causes of neurologic DALYs and age-standardized DALY rates for both sexes. Idiopathic epilepsy resulted in the most DALYs among people aged 5–9 years, followed by meningitis and encephalitis. Migraine was the leading contributor among individuals aged 10–39 years, with a female predominance. Stroke and AD and other dementias were the major contributors to the burden of neurologic conditions in adults, with their attributions sharply increasing with age for both the absolute numbers and DALYs. Stroke was the leading cause of neurologic burden among individuals aged 40–94 years, with a male predominance; furthermore, AD and other dementias were the major contributors to neurologic burden among individuals aged 95 years and older.
Figure 1. Asian Burden for Neurologic Disorders by Age Group Including Both Sexes in Asia, 2019.
(A) DALYs and (B) age-standardized DALY rates. Early neonatal is 0–7 days; late neonatal is 7–28 days; and postneonatal is 28 days to 1 year. DALY = disability-adjusted life-year.
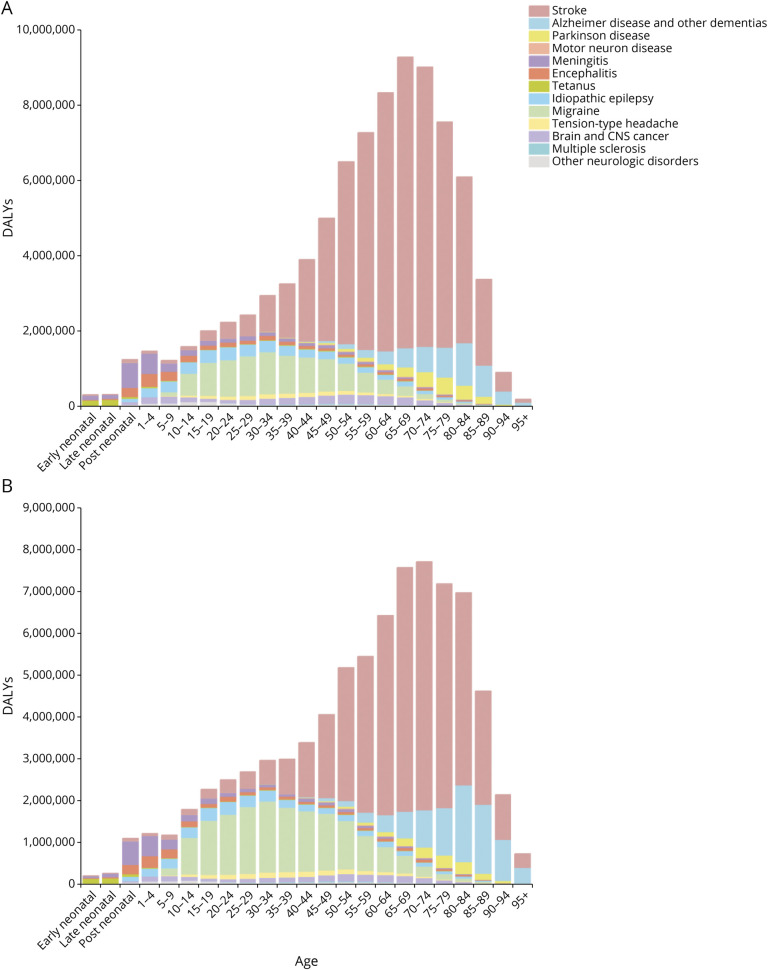
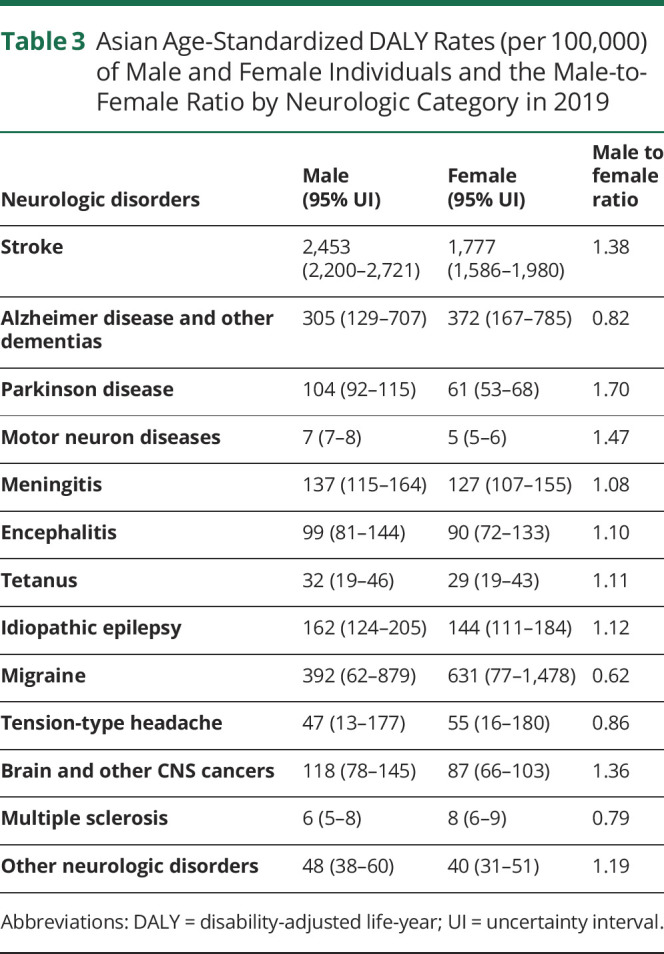
The observed sex differences in the burden of neurologic disorders in 2019 are shown in Figure 2 and summarized in Table 3. Across the 13 neurologic disorder categories, there was a substantially higher absolute number of DALYs among male (84.8 million) than among female individuals (79.2 million). In addition, the age-standardized DALY rates were higher among male than among female individuals (male-to-female ratio, 1.14). There was a considerably higher burden (based on the age-standardized DALY rates) among male than among female individuals for PD, MNDs, stroke, brain and other CNS cancers, and other neurologic disorders (male-to-female ratio, ≥1.19). By contrast, the male-to-female ratios of DALYs for migraine, MS, AD and other dementias, and TTH were <0.87. In Asia, the absolute number of stroke DALYs peaked at the age of 65–74 years for both sexes, with the DALYs for male and female reaching their peak at 65–69 and 70–74 years of age, respectively.
Figure 2. Asian DALYs for Neurologic Disorders by Sex Group, 2019.
DALY = disability-adjusted life-year.
Table 3.
Asian Age-Standardized DALY Rates (per 100,000) of Male and Female Individuals and the Male-to-Female Ratio by Neurologic Category in 2019
Asian Burden of Neurologic Disorders by Geographical Variations, 2019
As shown in eFigure 1 and listed in eTables 5–18 (links.lww.com/WNL/C729), the age-standardized rates for neurologic disorders varied widely in Asian countries and territories. We found numerous global extreme values in the Asian burden of neurologic disorders. There was the highest global age-standardized DALY rate of AD and other dementias in Afghanistan, but there was the lowest in India; there was the highest meningitis prevalence rate in Bhutan, even higher than in Africa; there was the highest global age-standardized DALY rate of idiopathic epilepsy in Tajikistan, but there was the lowest in Singapore; and there was the lowest global DALY rate of MS in the Maldives.
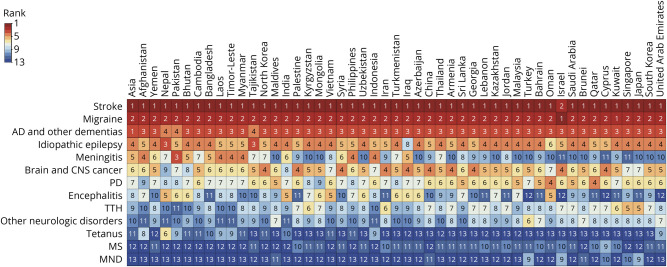
As shown in Figure 3, for the age-standardized DALY rates, noncommunicable diseases dominated in most Asian countries and territories, while the rankings of communicable diseases varied widely in a few countries. Stroke was the leading cause of neurologic disorders for age-standardized DALY rates in 48 of the 49 Asian countries and territories, followed by migraine, except in Israel, where migraine and stroke ranked first and second, respectively. AD and other dementias were ranked third or fourth in all countries and territories. There were large variations in the ranking for meningitis (ranked 3rd in Pakistan and 11th in Cyprus, Israel, and Singapore) and encephalitis (ranked 5th in Nepal, India, Vietnam, and Oman and 12th in Turkey, United Arab Emirates, Cyprus, and Israel).
Figure 3. Ranking of Age-Standardized DALY Rates for All Neurologic Disorders by Asian Countries, 2019.
AD = Alzheimer disease; DALY = disability-adjusted life-year; MND = motor neuron disease; MS = multiple sclerosis; PD = Parkinson disease; TTH = tension-type headache.
The contribution of each disease to the overall burden of neurologic disorders in the Asian subregions is shown in eFigure 2A (links.lww.com/WNL/C729). Although the age-standardized DALY rates varied among different countries within the same subregion, especially in West Asia, the contribution of stroke was generally higher in countries in East Asia (67%) than those in West Asia (47%) and South Asia (46%), while the contribution of migraine was higher in West Asia (23%) and Southeast Asia (19%) and lower in East Asia (11%). Meningitis remained prominent in South Asia (7%), ranking third.
Risk Factors for Neurologic Disorders in Asia, 2019
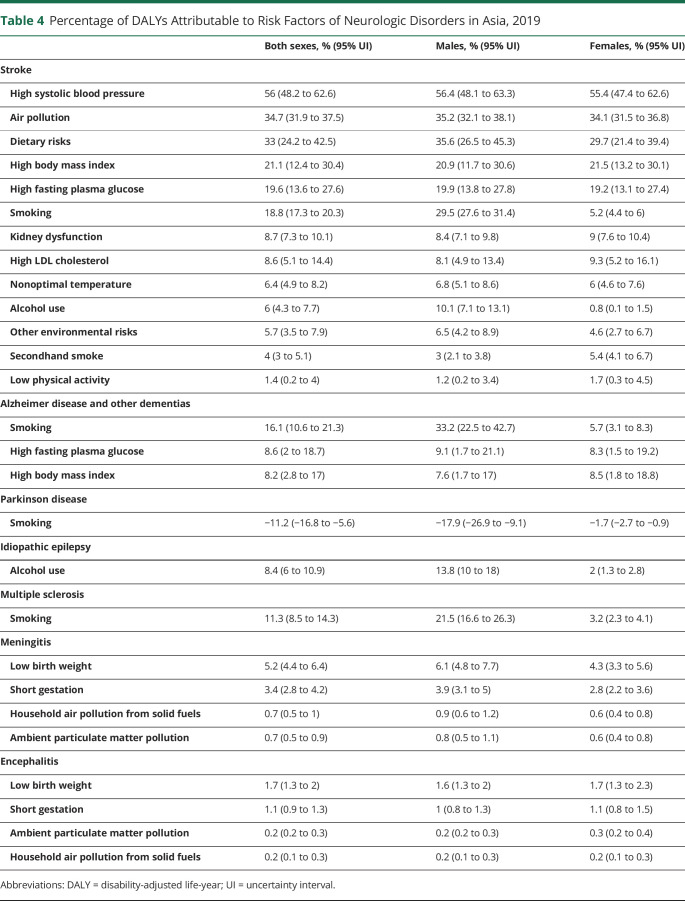
Only 3 of the 13 neurologic disorder categories had >10% of DALYs attributable to the 87 risks quantified in the GBD 2019: risk-attributable DALYs accounted for 86.9% of stroke DALYs, 28.5% of DALYs for AD and other dementias, and 11.1% of MS DALYs. Regarding the other neurologic disorders, the proportion of risk-attributable DALYs was either very small (idiopathic epilepsy, meningitis, encephalitis, and PD) or zero (tetanus, brain and other CNS cancers, migraine, TTH, and MNDs).
Table 4 summarizes risk factors attributable to specific neurologic disorders. In Asia, the 5 risk factors with the highest contribution to DALYs for stroke in both sexes were high systolic blood pressure (56%), air pollution (34.7%), dietary risks (33%), high body mass index (21.1%), and high fasting plasma glucose level (19.6%). For AD and other dementias and MS, smoking was the major risk factor of attributable DALYs (16.1% and 11.3%, respectively), while it was negatively associated with PD, with an estimated (−11.2%) reduction in DALYs. For smoking and alcohol use, the proportion of DALYs was significantly higher among male than among female individuals.
Table 4.
Percentage of DALYs Attributable to Risk Factors of Neurologic Disorders in Asia, 2019
Correlations Between the SDI and Disease Burden, 2019
Contribution of each disease to the overall burden of neurologic disorders in different SDI countries is shown in eFigure 2B (links.lww.com/WNL/C729). Stroke accounted for the highest proportion of age-standardized DALY rates in middle SDI Asian countries (68%) and the lowest in low SDI countries (42%) and high SDI countries (44%). For meningitis, the highest proportion was in low SDI countries (19%), while for AD and other dementias, the highest proportion was in high SDI countries (31%) and the lowest was in low SDI countries (3%).
The actual correlation between the SDI of Asian countries and burden of neurologic disorders is generally referred to as the crude data of metric rates. According to eTable 19 (links.lww.com/WNL/C729), for degenerative neurologic disorders (AD, PD, and MNDs), MS, and TTH, there was a positive correlation of most indicators of disease burden with the SDI in Asian countries. For communicable neurologic disorders, most metrics were moderately to strongly negatively correlated with the SDI. For stroke, the SDI showed a moderate positive correlation with the crude prevalence rate. Notably, the crude and age-standardized incidence rates and crude DALY and mortality rate of stroke were not significantly correlated with the SDI of the states, but age-standardized DALY and mortality rates had a weak significant negative correlation. For migraine, the crude incidence rate was moderately negatively correlated with the SDI. For brain and other CNS cancers, the SDI showed a strong positive correlation with the crude prevalence rate and moderate positive correlation with the crude incidence rate. For idiopathic epilepsy, the SDI showed negative correlations with the crude DALY and mortality rates and a weak positive correlation with the crude incidence rate.
Discussion
In 2019, combined neurologic disorders accounted for 12.2% and 18.5% of DALYs and all-cause mortality in Asia, respectively. Combined neurologic disorders were first reported in this study as the most common cause of DALYs and the second cause of deaths in Asia in 2019, which were the second contributor to DALYs and deaths in the global burden,1 and third to DALYs and deaths in Europe.6
From 1990 to 2019, there was a significant decrease in age-standardized mortality and DALY rates of combined neurologic disorders and a significant increase in the absolute numbers in Asia. Extended life expectancy, reduction of premature mortality and aging populations might be partly responsible for these findings. Notably, the absolute numbers and age-standardized mortality and DALY rates of tetanus, meningitis, and encephalitis sharply decreased. The advent of modern medicine and public health interventions, such as vaccines and antibiotics, may be a major contributor.10 These divergent trends in the decline of the burden of communicable diseases and the rise of noncommunicable diseases are consistent with the hypothesis in previous studies that the global burden is shifting from communicable to noncommunicable diseases.1
In 2019, among the neurologic disorders, the 3 largest contributors to DALYs across Asia were stroke, migraine, and AD and other dementias, similar to the global and European burdens.1,6 However, for geographical and socioeconomic variation, there were some heterogeneities within Asia between this study and the 2016 GBD study. Meningitis was the third contributor to the neurologic burden in South Asia and other low SDI countries, indicating a dual burden of communicable and noncommunicable neurologic disorders in these countries due to urbanization, growing income disparities, and health service inequalities.11
In Asia, the impact of demographic changes on the burden of neurologic disorders has its own characteristics. On one hand, the prevalence of noncommunicable neurologic disorders increased with the aging population, except for TTH, migraine, and idiopathic epilepsy. On the other hand, age-related diseases such as stroke, PD, and AD and other dementias showed varying degrees of earlier DALY peaks in Asia compared with the burden in Europe. For example, compared with the European burden (age 75–79 years) in 2017, the DALY peak of stroke was 10 years earlier in Asia.6 National and regional differences in age distribution, diets and lifestyles, prevention, and management are possible explanations.
There was a correlation between the SDI and health outcomes of most neurologic diseases, such as mortality and DALYs. Take stroke, for instance, as previously reported, most studies on stroke prevention and treatment were performed in developed countries and territories, yet more than 85% of stroke occurred in developing countries and territories.12 High and high-middle SDI countries performed better than low and low-middle SDI countries for health service delivery based on coverage indices, possibly due to having more and better resources and research productivity.13
In 2019, stroke was the most important cause of neurologic disorder burden in Asian countries and territories, except for Israel (migraine first, followed by stroke). Despite the decrease in age-standardized DALY rate, the proportion of stroke DALYs across Asia was still significantly higher than that in Western developed countries and even worldwide.1,6 Specifically, the situation among countries with different SDIs was dichotomized. The proportion of DALYs in middle SDI countries was much higher than that in high and low SDI countries. This condition may be influenced by many factors. Compared with the middle SDI countries, it may be attributed to the vigorous development of health undertakings in the high SDI countries, including updating stroke guidelines regularly, risk factor control, preventive medication, lifestyle changes, early intervention after acute stroke, and exercise after stroke.1,6,14 Based on the data quality rating in this study, insufficient or missing data may be one of the main reasons for the low DALY proportion in low SDI countries.
The burden of stroke was shown to be attributed to risk factors in previous studies and this study.15 The 5 top risk factors were similar to those in non-Asian populations.16 However, differing patterns of stroke risk factor profiles have been noted in Asian countries and territories over the past decades. High systolic blood pressure had the highest effect on stroke (particularly, hemorrhagic stroke) in Asia, with a 56% attribution of stroke-related DALYs, which was higher than the proportion reported in the United Kingdom (47.7%) and the United States (47.8%).17 By region, the Western Pacific region had the highest number of ischemic stroke–related deaths and DALYs in 2015, followed by Southeast Asia, reflecting the heavy industry and air pollution hotspots within the developing nations of these regions.18
For headache, TTH is the most prevalent and highest incidence neurologic disorder in Asia, followed by migraine. Conversely, the DALYs of migraine were substantially higher than those of TTH (up to 10-fold). The incidence of migraine and TTH peaked among young and middle-aged adults, so the increase in the prevalence of migraine and TTH is more likely due to population growth rather than the effects of aging. The chief cause for the slight increase in age-standardized prevalent rate of migraine is medication overuse headache, which was previously considered an isolated disorder. However, in the GBD 2019, it was considered a sequela of either migraine or TTH, with migraine accounting for >70% of the burden of medication overuse headache.5 The 2016 Lancet GBD study reported that China had the lowest age-standardized migraine prevalence; however, in this study, in 2019, China was one of the countries with the fastest growing age-standardized prevalence in Asia.5 The increased prevalence of migraine in China from the 2016 GBD study to this analysis can likely be attributed to improved diagnosis.19 Until now, most interventions have aimed at the management of symptoms. No risk factors have yet been established in GBD studies for migraine and TTH.
AD and other dementias were also a very common cause of burden attributable to neurologic disorders in Asia, ranking third in most countries and territories. For the absolute number of all metrics, due to the aging population, AD and other dementias were already the fastest growing diseases, with a nearly 2.5-fold increase from 1990 to 2019. In addition to cognitive decline, patients with AD and other dementias may also experience mental symptoms such as delusion and hallucination at advanced stages. Therefore, patients at advanced stages of AD and other dementias incur a considerable cost of care. The combination of the rising prevalence and increasing cost of care is leading to an increase in total societal costs of up to 10-fold from 2010 to 2050.20
Notably, PD showed a large increase in its burden, which almost doubled during the study period. The DALYs of PD increased with advanced age, wherein male individuals showed a higher level than female individuals (male-to-female ratio, 1.70). This difference could be attributed to occupational exposures among men.19 Underdiagnosis, comorbidity occurrence, or lack of care might explain the decline among individuals older than 90 years after the peak period of 85–89 years.21 Smoking was negatively correlated with PD, and there was a significant sex difference, with −17.9% and −1.7% of attributable DALYs among males and female individuals, respectively. A Korean study confirmed that male current smokers tended to have a lower risk of PD than female current smokers at equal smoking intensity and duration, which was consistent with our analysis.22 Notably, smoking should not be encouraged, although these data show that smoking may be beneficial for PD.
For MS, the increasing age-standardized prevalence and incidence rates between 1990 and 2019 were caused by substantial improvements in neuroimaging techniques and the identification of disease. Therefore, there may be an untrue increment in its incidence.23 Smoking was positively correlated with MS, and there was a significant sex difference, with attributable DALYs of 21.5% among male and 3.2% among female individuals. The mechanism by which smoking leads to MS is still unclear, but a community-based registry from Britain showed that smoking was associated with a dose-dependent worsening of motor function and that smokers experienced accelerated deterioration compared with nonsmokers.24
Despite the substantial increase in age-standardized rates of incidence and prevalence, idiopathic epilepsy showed a significant decrease in age-standardized DALYs and mortality rates from 1990 to 2019 in Asia. This result suggested that improved management and increased treatment opportunities reduced the mortality risk and disease severity, and the increased incidence might be partly due to more accurate case ascertainment. Although there was no significant sex difference in the incidence of epilepsy, alcohol use was positively correlated with idiopathic epilepsy, with male predominance.
Over the past 3 decades, Asian countries and territories have experienced rapid epidemiologic transitions for the burden of neurologic disorders. However, due to public health challenges and uneven economic development, healthcare reforms have had different rates of success across the Asian region. The age-standardized DALY rates of most neurologic disorders decreased, but they increased in only 5 countries (Azerbaijan, Philippines, Turkmenistan, Uzbekistan, and Tajikistan). On one hand, these 5 countries faced some basic public health challenges, including the dual burden of communicable and noncommunicable diseases, limited scientific productivity, and problems associated with the lack of treatment standardization.25 These Central and West Asian countries, Azerbaijan, Turkmenistan, Uzbekistan, and Tajikistan, inherited the centralized medical system practiced in the Soviet Union and have initiated wide-ranging reforms since the second half of the 1990s.25 However, the pace of healthcare reforms varied in these countries; for example, health reform failed in Turkmenistan in the 2000s and was delayed by civil war in Tajikistan.25 In Philippines, due to low health insurance coverage and health expenses that are largely financed out of pocket, individuals tend not to seek health care until they experience serious health problems.11 It seems that the results of the GBD were largely dependent on the consistency of government policy and the state of economic development.
The rapidly growing burden of neurologic disorders in Asia often results from the shortage of neurologists, insufficient preventive care, inadequate infrastructure for treatment, and a lack of education about the prevention and treatment of these diseases. Asia constitutes 60% of the world's population but contains only 20% of the world's neurologists. This disparity in the distribution of neurologists is particularly evident in South and Southeast Asia.26 For these low and low-middle SDI Asian countries with limited economic capacity, preventive care is more important than treatment. Therefore, for policy makers, in conjunction with neurologist training, public health education, primary prevention interventions, and early detection of neurologic disorders through strengthened healthcare systems can considerably reduce the burden of neurologic disorders.
Several limitations of this study should be noted. First, because original data were scarce or missing in many low-income and middle-income countries and territories, Bayesian statistical models were used to estimate disease prevalence and deaths for those countries and territories. In those countries and territories, estimates depended heavily on predictive covariates and geographical proximity; therefore, the estimates were uncertain. It is necessary to conduct high-quality epidemiologic studies in countries and territories where information was missing. Second, brain and other CNS cancers were not subclassified by etiology. Third, the disability weights used for the calculation of YLDs might not be uniform across populations and sociodemographic strata.
Neurologic disorders were the leading cause of DALYs and the second leading cause of death in Asia in 2019, and the burden may likely increase with the growth and aging of the Asian population. Urgent measures are needed for prevention, treatment, rehabilitation, and support services for common neurologic disorders nationally and regionally.
Acknowledgment
The authors sincerely acknowledge the Institute of Health Metrics and Evaluation for providing access to the open database of the GBD study for noncommercial purposes. The authors thank Zhentao Zhang, Jintai Yu, and Zhangyu Zou for professional advice of this manuscript.
Glossary
- AD
Alzheimer disease
- DALY
disability-adjusted life-year
- GBD
Global Burden of Diseases, Injuries, and Risk Factors
- MND
motor neuron disease
- MS
multiple sclerosis
- PD
Parkinson disease
- SDI
sociodemographic index
- TTH
tension-type headache
- YLD
year lived with disability
- YYL
year of life lost
Appendix. Authors
Footnotes
Editorial, page 989
Study Funding
The National Natural Science Foundation of China (No. 81971055, 81471133, 82101292, 81825007); Natural Science Foundation of Hubei Province (No.2020CFB226); Beijing Outstanding Young Scientist Program (No. BJJWZYJH01201910025030); Youth Beijing Scholar Program (No.010); Beijing Talent Project-Class A: Innovation and Development (No. 2018A12); “National Ten-Thousand Talent Plan”—Leadership of Scientific and Technological Innovation; National Key R&D Program of China (No. 2017YFC1307900, 2017YFC1307905).; the Interdisciplinary Innovative Talents Foundation from Renmin Hospital of Wuhan University (JCRCYG-2022-006) and Buchang Zhiyuan Public Welfare Projects for Heart and Brain Health (HIGHER2022094).
Disclosure
Yue Wang reports no disclosures relevant to the manuscript. J. Liang was supported by grants from the Natural Science Foundation of Hubei Province (No. 2020CFB226). Y. Fang, D. Yao, L. Zhang, Y. Zhou, Yajuan Wang, L. Hu, and Z. Lu report no disclosures relevant to the manuscript. Yilong Wang was supported by grants from the National Natural Science Foundation of China (No. 81825007), the National Natural Science Foundation Beijing Outstanding Young Scientist Program (No. BJJWZYJH01201910025030), Youth Beijing Scholar Program (No.010), Beijing Talent Project-Class A: Innovation and Development (No. 2018A12), “National Ten-Thousand Talent Plan”-Leadership of Scientific and Technological Innovation; and National Key R&D Program of China (No. 2017YFC1307900, 2017YFC1307905). Z. Xiao was supported by grants from the National Natural Science Foundation of China (No. 81971055, 81471133, 82101292), the Interdisciplinary Innovative Talents Foundation from Renmin Hospital of Wuhan University (JCRCYG-2022-006) and Buchang Zhiyuan Public Welfare Projects for Heart and Brain Health (HIGHER2022094). Go to Neurology.org/N for full disclosures.
References
- 1.GBD 2016 Neurology Collaborators. Global, regional, and national burden of neurological disorders, 1990-2016: a systematic analysis for the Global Burden of Disease Study 2016. Lancet Neurol. 2019;18(5):459-480. doi: 10.1016/S1474-4422(18)30499-X [DOI] [PMC free article] [PubMed] [Google Scholar]
- 2.GBD 2019 Diseases and Injuries Collaborators. Global burden of 369 diseases and injuries in 204 countries and territories, 1990-2019: a systematic analysis for the Global Burden of Disease Study 2019. Lancet. 2020;396(10258):1204-1222. doi: 10.1016/S0140-6736(20)30925-9 [DOI] [PMC free article] [PubMed] [Google Scholar]
- 3.GBD 2019 Demographics Collaborators. Global age-sex-specific fertility, mortality, healthy life expectancy (HALE), and population estimates in 204 countries and territories, 1950-2019: a comprehensive demographic analysis for the Global Burden of Disease Study 2019. Lancet. 2020;396(10258):1160-1203. doi: 10.1016/S0140-6736(20)30977-6 [DOI] [PMC free article] [PubMed] [Google Scholar]
- 4.GBD 2019 Risk Factors Collaborators. Global burden of 87 risk factors in 204 countries and territories, 1990-2019: a systematic analysis for the Global Burden of Disease Study 2019. Lancet. 2020;396(10258):1223-1249. doi: 10.1016/S0140-6736(20)30752-2 [DOI] [PMC free article] [PubMed] [Google Scholar]
- 5.GBD 2016 Headache Collaborators. Global, regional, and national burden of migraine and tension-type headache, 1990-2016: a systematic analysis for the Global Burden of Disease Study 2016. Lancet Neurol. 2018;17(11):954-976. doi: 10.1016/S1474-4422(18)30322-3 [DOI] [PMC free article] [PubMed] [Google Scholar]
- 6.Deuschl G, Beghi E, Fazekas F, et al. The burden of neurological diseases in Europe: an analysis for the Global Burden of Disease Study 2017. Lancet Public Health. 2020;5(10):E551-E567. doi: 10.1016/S2468-2667(20)30190-0 [DOI] [PubMed] [Google Scholar]
- 7.Nations SDDoEaSAU. GBD result tool [online]. Accessed November 25, 2022. ghdx.healthdata.org/gbd-results-tool.
- 8.Department of Economic and Social Affairs, Population Division, United Nations. World Population Prospects 2019. Accessed November 25, 2022. population.un.org/wpp/. [Google Scholar]
- 9.India State-Level Disease Burden Initiative Neurological Disorders Collaborators. The burden of neurological disorders across the states of India: the Global Burden of Disease Study 1990-2019. Lancet Glob Health. 2021;9(8):e1129-e1144. doi: 10.1016/S2214-109X(21)00164-9 [DOI] [PMC free article] [PubMed] [Google Scholar]
- 10.GBD 2016 Meningitis Collaborators. Global, regional, and national burden of meningitis, 1990-2016: a systematic analysis for the Global Burden of Disease Study 2016. Lancet Neurol. 2018;17(12):1061-1082. doi: 10.1016/S1474-4422(18)30387-9 [DOI] [PMC free article] [PubMed] [Google Scholar]
- 11.Fritz M, Fromell H. How to dampen the surge of non-communicable diseases in Southeast Asia: insights from a systematic review and meta-analysis. Health Policy Plan. 2022;37(1):152-167. doi: 10.1093/heapol/czab138 [DOI] [PMC free article] [PubMed] [Google Scholar]
- 12.Kulshreshtha A, Anderson LM, Goyal A, Keenan NL. Stroke in South Asia: a systematic review of epidemiologic literature from 1980 to 2010. Neuroepidemiology. 2012;38(3):123-129. doi: 10.1159/000336230 [DOI] [PubMed] [Google Scholar]
- 13.Ghaffar A, Reddy KS, Singhi M. Burden of non-communicable diseases in South Asia. BMJ. 2004;328(7443):807-810. doi: 10.1136/bmj.328.7443.807 [DOI] [PMC free article] [PubMed] [Google Scholar]
- 14.Koton S, Tanne D, Bornstein NM. Burden of stroke in Israel. Int J Stroke. 2008;3:207-209. doi: 10.1111/j.1747-4949.2008.00203.x [DOI] [PubMed] [Google Scholar]
- 15.GBD 2019 Stroke Collaborators. Global, regional, and national burden of stroke and its risk factors, 1990-2019: a systematic analysis for the Global Burden of Disease Study 2019. Lancet Neurol. 2021;20(10):795-820. doi: 10.1016/S1474-4422(21)00252-0 [DOI] [PMC free article] [PubMed] [Google Scholar]
- 16.Feigin VL, Brainin M, Norrving B, et al. World Stroke Organization (WSO): Global Stroke Fact Sheet 2022. Int J Stroke. 2022;17(1):18-29. doi: 10.1177/17474930211065917 [DOI] [PubMed] [Google Scholar]
- 17.Kim YD, Jung YH, Saposnik G. Traditional risk factors for stroke in East Asia. J Stroke. 2016;18(3):273-285. doi: 10.5853/jos.2016.00885 [DOI] [PMC free article] [PubMed] [Google Scholar]
- 18.Babatola SS. Global burden of diseases attributable to air pollution. J Public Health Africa. 2018;9(3):813. doi: 10.4081/jphia.2018.813 [DOI] [PMC free article] [PubMed] [Google Scholar]
- 19.Yu S, Steiner TJ. Lifting the burden of headache in China: managing migraine in a SMART way. J Headache Pain. 2017;18(1):79. doi: 10.1186/s10194-017-0790-6 [DOI] [PMC free article] [PubMed] [Google Scholar]
- 20.Tahami Monfared AA, Byrnes MJ, White LA, Zhang Q. The humanistic and economic burden of Alzheimer's disease. Neurol Ther. 2022;11(2):525-551. doi: 10.1007/s40120-022-00335-x [DOI] [PMC free article] [PubMed] [Google Scholar]
- 21.Dorsey ER, Elbaz A, Nichols E, et al. Global, regional, and national burden of Parkinson's disease, 1990-2016: a systematic analysis for the Global Burden of Disease Study 2016. Lancet Neurol. 2018;17(11):939-953. doi: 10.1016/S1474-4422(18)30295-3 [DOI] [PMC free article] [PubMed] [Google Scholar]
- 22.Kim R, Yoo D, Jung YJ, Han K, Lee JY. Sex differences in smoking, alcohol consumption, and risk of Parkinson's disease: a nationwide cohort study. Parkinsonism Relat Disord. 2020;71:60-65. doi: 10.1016/j.parkreldis.2019.12.006 [DOI] [PubMed] [Google Scholar]
- 23.Wallin MT, Culpepper WJ, Nichols E, et al. Global, regional, and national burden of multiple sclerosis 1990-2016: a systematic analysis for the Global Burden of Disease Study 2016. Lancet Neurol. 2019;18(3):269-285. doi: 10.1016/S1474-4422(18)30443-5 [DOI] [PMC free article] [PubMed] [Google Scholar]
- 24.Rodgers J, Friede T, Vonberg FW, et al. The impact of smoking cessation on multiple sclerosis disease progression. Brain. 2022;145(4):1368-1378. doi: 10.1093/brain/awab385 [DOI] [PMC free article] [PubMed] [Google Scholar]
- 25.Adambekov S, Kaiyrlykyzy A, Igissinov N, Linkov F. Health challenges in Kazakhstan and central Asia. J Epidemiol Commun Health. 2016;70(1):104-108. doi: 10.1136/jech-2015-206251 [DOI] [PubMed] [Google Scholar]
- 26.Tan CT. Neurology in Asia. Neurology. 2015;84(6):623-625. doi: 10.1212/WNL.0000000000001224 [DOI] [PubMed] [Google Scholar]


