

Abstract
Objective.
The synovial lymphatic system (SLS) removes catabolic factors from the joint. Vascular endothelial growth factor C (VEGF-C) and its receptor VEGFR3 are crucial for lymphangiogensis. However, their involvement in age-related osteoarthrits is unknown. We aim to determine whether the SLS and the VEGF-C/VEGFR3 pathway contribute to age-related osteoarthritis using a murine model of naturally occurring disease.
Methods.
SLS function was assessed in young (3-month) and aged (19~24-month) C57BL/6J male mice via a newly established in vivo IVIS-Dextran imaging approach, which was used to assess the effects of VEGF-C treatment on SLS function and OA pathology in aged mice in addition to histology. RNA sequencing was performed to explore molecular mechanisms.
Results.
Aged mice have impaired SLS function, including decreases in: joint clearance (T1/2 2.8hr vs. 0.5hr in young, p<0.0001), synovial influx (1.7±0.8% vs. 4.1±1.9% in young, p=0.0004), and lymph node draining capacity (1.4±0.8 vs. 3.7±1.2 signal intensity in young, p<0.0001). RNA sequencing of the synovial tissue showed Vegf-c and VEGFR3 signaling genes were decreased in aged synovium. VEGF-C treatment improved joint clearance (63±9% vs. 52±15% in vehicle, p=0.012), increased articular cartilage cross-sectional area (0.38±0.07 vs. 0.26±0.07 mm2 in vehicle, p<0.0001), and decreased MMP13+ staining area (7±2 % vs. 4±1 % in vehicle, p=0.0004) in aged mice.
Conclusion.
SLS function is reduced in aged knees due to decreased VEGF-C/VEGFR3 signaling. VEGF-C treatment attenuates osteoarthritic joint damage and improves synovial lymphatic drainage in aged mice. The SLS and VEGF-C/VEGFR3 signaling represent novel physio-pathological mechanisms and therapeutic targets for age-related osteoarthritis.
Keywords: osteoarthritis, synovium, lymphatic, VEGF-C, aging
Introduction
Osteoarthritis (OA) is the leading cause of disability in the elderly [1] without effective cures [2]. In OA joints, soluble factors, such as inflammatory cytokines [3] and matrix metallopeptidases [4] accumulate in the synovium and contribute to cartilage damage. The mechanism by which catabolic factors are normally cleared from healthy joints and whether this mechanism is impaired and contributes to the pathogenesis of OA in aging is unknown. Early studies to elucidate this mechanism in more than 100 OA patients reported that radiolabeled dextran (molecular weight-70,000 Daltons) was cleared to the draining lymph nodes (DLNs) after being injected into normal joints, while it accumulated in OA joints of the same patients [5, 6]. This suggests that the injected tracer is removed from the synovial space via lymphatic vessels (LVs) in normal joints, and that this process is impaired in OA joints in humans.
The lymphatic system plays an important role in regulating fluid homeostasis of the interstitial space by trafficking lymph that contains proteins and cells from the tissues to DLNs [7]. Unlike blood circulation, LVs allow the exchange of macromolecules between the vessel lumen and interstitial space [7, 8]. Using combinations of near-infrared-indocyanine green (NIR-ICG) lymphatic imaging, histology, and cellular/molecular approaches, we described the synovial lymphatic system (SLS) and its role in maintaining joint homeostasis [8]. In this process, macromolecules including aggregated soluble proteins enter the lymphatic capillaries located in the synovium and surrounding soft tissues, translocate to DLNs via collecting LVs, and are ultimately cleared through the thoracic duct or the subclavian vein [8]. We and others demonstrated SLS dysfunction in mice with inflammatory arthritis including rheumatoid arthritis (RA) [9, 10] and post-traumatic OA (PTOA) [11], and that restoration of SLS function attenuates joint damage. In these models, inflammation plays a critical pathogenic role by damaging LVs, while anti-inflammatory drugs improve SLS function [8, 12]. The pathogenesis of age-associated OA differs from PTOA, and is related to long-term mechanical overload to the articular cartilage during natural aging. Reduced draining function of LVs has recently been linked to age-related diseases, such as Alzheimer’s [13] and vascular diseases [14]. Most studies focus on the effects of blockage or stimulation of the lymphatic function on the disease process, while the molecular mechanisms involved have not been thoroughly explored. Thus, the role of the SLS in age-related OA remains unknown.
In the current study, we hypothesized that decreased SLS function contributes to age-related OA progression, which can be attenuated by vascular endothelial growth factor C (VEGF-C), the predominant growth factor for lymphatic endothelial cell (LEC) proliferation, differentiation, and survival [15]. We showed that fluorescence dye-labeled dextran macromolecules are removed from the synovium via LVs to the DLN and can be used to assess SLS function in mice. We also show that aged mice have impaired SLS function, decreased VEGF-C expression, and dysregulated VEGF-C/VEGFR3 signaling in synovium. Improvement of SLS function via intraarticular VEGF-C administration reduces OA tissue damage in aged mice.
Material and Methods
Animals.
Three-month-old young and 19- to 24-month-old aged C57BL/6J mice were used. TNF-Tg mice (3647 line) were originally obtained from Dr. George Kollias and maintained on a C57BL/6J background. Mice were housed in micro-isolator technique room. Mouse numbers in individual experiments are included in the figure legends. All animal experiments were approved by the University of Rochester Institutional Animal Care and Use Committee.
IVIS-dextran lymphatic imaging.
Mice were anesthetized with 2.5% isoflurane, and received intraarticular Texas Red-dextran (70kDa, Thermal Fisher, cat#D1864) injection. For joint clearance, knees were longitudinally scanned with an IVIS Live Animal Imaging System (Caliper Life Sciences Inc.) at 0 (immediately), 1, 6, 24, and 48 hrs after dextran injection to access the dextran signals as the epifluorescence total radiant efficiency of Texas Red. For DLN capacity, iliac LNs that drain the knee [8] were imaged for epifluorescence intensity. For synovial influx, frozen sections of the knee were washed with PBS to remove free dextran molecules that have not entered the tissues, and scanned with the Olympus VS120 whole-slide imaging system. The number of dextran+ particles in the synovium was quantified with Image J software. Data from individual mice at each time point were fitted in one- or two-component exponential models with MatLab. Lymphatic clearance was measured between 0hr and 6hr to compare young and aged mice (Figure 3A) to accommodate the faster clearance in young mice, and between 1hr and 6hr to compare treatment among aged mice (Figure 5E) to accommodate the larger sample size required by power analysis.
Figure 3. Dysfunction of the synovial lymphatic system in aged mice.

Young (3-month) and aged (19-month) C57BL/6J male mice were used. (A) Joint clearance (n=18 for young, n=10 for aged, measured 0hr and 6hr after injection as “(dextran0hr- dextran6hr)/dextran0hr”), synovial influx (n=8 per group, measured 6hr after injection) and DLN lymphatic capacity (n=8 per group, measured 48hr after injection) were examined by IVIS-dextran lymphatic imaging as described in Figure 2. (B) Representative SafraninO/Fast Green knee histology images at 1.2x at lower power and 1.8x and 2.5x at high power for young and aged knee respectively are shown to illustrate the fibrillation of articular cartilage surface (arrow). Scale bar= 200μm. (C) Histomorphometry analysis of OA tissue damage using Visiopharm analysis software. (n=6 per group). Data were presented as mean +/− SD. Difference between young and aged mice was analyzed using unpaired t-test and Mann-Whitney test for normally (synovial influx, DLN capacity, cartilage/osteophyte/meniscus area, growth plate length, body weight) and non-normally (joint clearance, OARSI score, unmineralized cartilage cross-sectional area fraction) distributed data respectively. The exact p-values are shown. A # glyph is indicated when the comparison is significant at p<0.05 after Bonferroni correction for the number of tests in the panel.
Figure 5. Lymphatic growth factor VEGF-C improves synovial lymphatic drainage and attenuates OA tissue damage in aged mice.
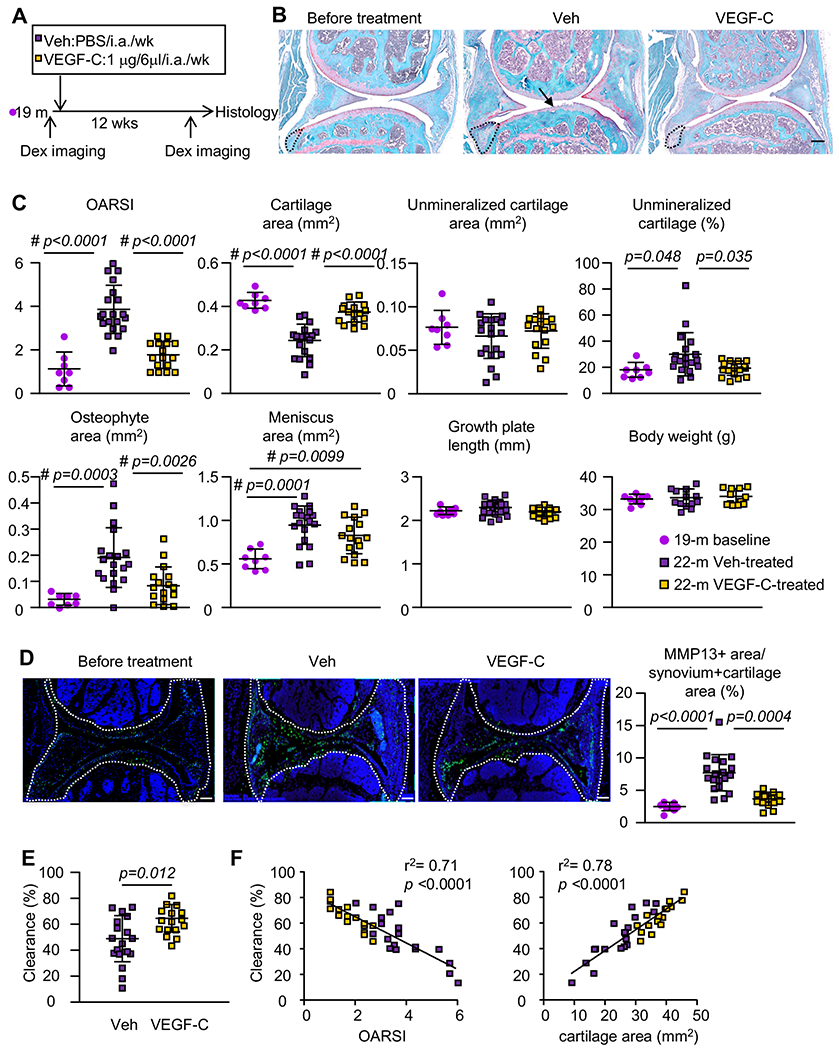
(A) VEGF-C treatment outline. 19-month-old C57Bl/6 male were treated with vehicle or VEGF-C for 12 wks (n=8 per 19-month-old baseline; n=19 per vehicle-treated; n=16 per VEGF-C-treated). Mice were examined by IVIS-dextran lymphatic imaging for joint clearance before knee μ-CT and histology. (B) Safranin-O-stained images show cartilage loss (black arrows) and osteophyte formation (opened outline). Scale bar= 200μm. (C) Histomorphometry analysis of OA tissue damage. (D) IHC staining of MMP13 in Veh or VEGF-C treated joints and quantification of % of MMP13+ area in the synovium area (outlined by open white line). Scale bar= 200μm. Statistical difference was analyzed using One-way ANOVA followed by Tukey post-hoc test or Kruskal-Wallis followed by Dunn’s post-hoc test for normally and non-normally distributed data respectively. The exact p-values that are below 0.05 are shown. A # glyph is indicated when the comparison is significant at p<0.05 after Bonferroni correction for the number of tests in the panel. (E) Joint clearance by IVIS-dextran lymphatic imaging. (F) The correlation between synovial lymphatic clearance and OARSI or cartilage cross-sectional area. R2 and p-value of the linear regression is indicated.
Histology and histomorphometry.
We used histomorphometric parameters established by the Center for Musculoskeletal Research faculty for analyzing age-related OA pathology [16]. Thirty consecutive 4-μm-thick sagittal paraffin sections were divided to 3 levels. The first section from each level was stained for Safranin-O and scanned with the Olympus VS120 slide scanner and analyzed using Visiopharm imaging analysis software blindly. Histomorphometry parameters were averaged from the three levels. 1) Modified OARSI score [11] (detailed in supplementary information). 2) Unmineralized cartilage cross-sectional area-above the tidemark and stained dark pink. 3) Total cartilage cross-sectional area (unmineralized + mineralized cartilage cross-sectional area-below the tidemark and stained light pink). 4) The percentage of unmineralized cartilage over total cartilage cross-sectional area. 5) Osteophyte and meniscus area. 6) Tibial growth plate length.
Immunohistochemistry.
Frozen sections (7-μm-thick) were stained with antibodies against LV Endothelial Receptor 1 (LYVE-1) (Abcam, cat# ab14917, 1:50) for LECs, Endomucin (Santa Cruz, cat# sc-65495, 1:50) for blood endothelium. Paraffin sections were subjected to antigen retrieval in a citrate-based buffer in a pressure cooker, and stained with antibodies against Metalloproteinase-13 (MMP13) (Abcam, cat# ab39012, 1:50). Stained samples were scanned with the VS120 slide scanner and the percentage of MMP13+ stained area within the total synovial area was quantified with Visiopharm software.
qPCR.
To dissect the synovial tissues, two incisions parallel to the patellar ligament were made in the medial and lateral sides, and two incisions vertical to the patella ligament were made proximal and distal to the joint to dissect the soft tissue surrounding the patellar tendon. The patellar ligament tissue was then removed and the remaining synovial tissues were flash frozen with liquid nitrogen. RNA was extracted (detailed in supplementary information) and cDNA was synthesized using the iSCRIPT cDNA Synthesis kit. qPCR was performed with iQ SYBR Green supermix using an iCycler PCR machine (BioRad). Primer sequences are listed in Supplementary Table 1. The fold change of gene expression is first normalized to actin and then normalized to the values from young samples.
Bulk RNA-sequencing of synovial tissue.
HiSeq2500 high-throughput DNA sequencer (Illumina) was used. Gene counts were derived from the number of uniquely aligned unambiguous reads and annotated to estimate the expression levels of genes. All gene-level transcript counts were normalized for library size (R/Bioconductor DEseq2-1.16.1). Log2 fold-changes of lowly expressed genes were moderated using the ‘IfcShrink’ method, and resulted in 11,604 genes for down-stream analysis. Differential expression analysis was performed comparing aged vs. young samples, with a threshold for differentially expressed genes (DEGs) set as fold-change (Aged/Young)>2 and FDR adjusted p-value<0.05.
VEGF-C treatment.
Aged mice (19-month-old) were assigned to a 12-week regimen of VEGF-C156S (R&D, cat#752) (1μg in 6μL/joint/week, i.a. injection, n=19) or vehicle (PBS, free of BSA, n=16) treatment in alternating pairs after ranking mice based on baseline measurements of joint clearance instead of randomization to mitigate the variation of baseline lymphatic clearance. VEGF-C156S (referred as VEGF-C) is a lymphangiogenic specific form of VEGF-C with a Cys156=>Ser mutation that binds specifically to VEGFR3 [17]. To determine the optimal regimen duration, we examined joint clearance before, 8- and 12-weeks after intraarticular VEGF-C injection. Compared to the vehicle, VEGF-C had no effect after 8-weeks, but significantly increased joint clearance after 12-weeks, which was used in our experiment.
Analysis of published RNA-sequencing datasets.
Bulk or single-cell (sc)RNA-sequencing data were downloaded (Supplementary Table 2) and analysis is detailed in supplementary information.
Flow cytometry analysis.
Synovial cells were fixed with a Fixation and Permeabilization Solution (BD Biosciences, cat: #554722). Cells were then incubated with anti-VEGF-C (NOVUS NB110-61022) and anti-COL6A1 (Collagen type VI alpha 1 chain) antibody (Santa Cruz 377143), followed by APC-anti-rabbit IgG and PE-anti-mouse IgG antibody. Cells were subjected to flow cytometric analysis using a Becton-Dickinson FACSCanto II Cytometer, and analyzed with Flowjo10.4 software (FLOWJO, LLC Ashland).
Statistical analysis.
Sample sizes were determined by a priori power calculations using the G*power software (version 3.1). Data are presented as mean ± standard deviation. The unpaired Student’s t-test or Mann-Whitney test was used for two-group comparison. One-way ANOVA followed Tukey post-hoc test or Kruskal-Wallis test followed Dunn’s post-hoc test was used for multiple-group comparisons. Repeated measurement one-way ANOVA followed Tukey post-hoc test was used for longitudinal joint clearance. p-values less than 0.05 were considered statistically significant. Statistical tests were performed in Prism9.0 software except for repeated measure one-way ANOVA by JMP software. Detailed power analysis and statistical analysis for each experiment is detailed in the supplementary information.
Results
Establishment of IVIS-dextran imaging to measure functions of the synovial lymphatic system.
We have used NIR-ICG imaging to measure the amount of ICG left in a joint after intraarticular administration as a surrogate for catabolic molecules in mice with inflammatory arthritis [8, 18]. However, the NIR-ICG imaging cannot distinguish “influx” (factors entering initial LVs) [19] from “clearance” (factors being transferred from initial LVs to DLNs via collecting LVs) [20]. To measure lymphatic influx and clearance separately, we developed an IVIS-dextran imaging method by intraarticular Texas Red-dextran (70kDa) administration into the mouse knee, and quantifying the resulting dextran signal intensity in the knee joint and DLN using IVIS and microscopy (Figure 1A). IVIS-dextran imaging results in 3 outcome measures for SLS: joint clearance (Figure 1B), DLN capacity (Figure 1C), and synovial influx (Figure 1D). 1) We assessed joint clearance by quantifying dextran signal intensity in the knees at different time points post-intraarticular administration of dextran, as we have done in NIR-ICG imaging (Figure 1B) [18]. 2) DLN capacity is the maximum dextran signal intensity in the DLN quantified ex vivo, which measures the net accumulation of dextran arriving from the afferent LVs and exiting through the efferent LVs (Figure 1C). Of note is the specificity of this dextran signal, which was only detected in the iliac LN that drains the knee, and not in the popliteal LN that drains the ankle (Figure 1C). 3) Synovial influx was accessed on histological sections of the knee joint that were thoroughly washed to retain only the dextran molecules in the tissue, to distinguish between influx dextran molecules that enter capillary LVs in the synovial tissues from the free-floating dextran molecules in the joint space (Figure 1D). We found that dextran molecules localized mainly in the synovium and soft tissues proximal to the meniscus, where LVs are enriched [21]. Immunofluorescent staining using anti-LYVE1 and anti-Endomucin antibodies, proteins specifically expressed by LECs and blood endothelium respectively, confirmed that dextran signals co-localized only with LYVE1+ LVs, but not Endomucin+ blood vessels both in the knee joint (Figure 1E) and DLN (Figure 1F). This is consistent with previous findings that 70kDa dextran molecules only enter LVs, but not blood vessels of the DLN of metastatic melanoma [22].
Figure 1. 70kDa dextran is transferred by the synovium lymphatic system.

3-month-old C57Bl/6 male mice were used. (A) Flow chart illustrating the protocol of IVIS-dextran lymphatic imaging. (B) (a) Representative in vivo IVIS images 1 and 6hr post-intraarticular (i.a.) injection of Texas Red-dextran are shown to illustrate the decrease in the fluorescence signal over time, which is a function of joint clearance. (b) Representative ex vivo IVIS images of iliac draining lymph node (DLN) and background signal in the popliteal LN (PLN) adjacent to the injected knee (negative control) are shown to illustrate the knee draining DLN capacity. (c) Representative images of a 5x H&E-stained section with ROI (box) and 20x darkfield image of the ROI in a parallel section of a knee are shown to illustrate the location of the draining LVs in the synovium (arrows in (c) between the femur and tibia indicated by the dashed lines). (C-D) Frozen sections of knees from B.a and DLNs. Nodes from B.b were immunostained with FITC-labeled antibodies LYVE-1 (LVs) or Endomucin (blood vessels) for fluorescence microscopy. Representative 40x images show that the injected dextran colocalizes with LYVE-1+ LVs (arrows) in the synovium (solid outline). Scale bar=50 μm. S=synovium; F=femur; T=tibia; M=meniscus.
To determine the kinetics of dextran transfer through the SLS, we measured synovial influx, DLN capacity, and joint clearance at 0hr, 1hr, 6hr, 24hr, and 48hr after intraarticular dextran administration in young WT mice. Overall dextran signal intensity of the entire knee joint peaked immediately after injection, rapidly decreased at 1hr with a T1/2 clearance of 0.83hr, and plateaued after 6hr (Figure 2A). Synovial influx significantly increased at 1hr, 6hr, and 24hr compared to 0hr, peaked at 6hrs, and returned to the 0hr level at 48hr (Figure 2C). DLN capacity initially increased at 1hr, and gradually increased thereafter to the end of the study at 48hr (Figure 2B). Thus, 0hr and 6hr timepoints were chosen to examine the percentage of dextran clearance from the knee joint, calculated as: (dextran0hr- dextran6hr)/dextran0hr in subsequent experiments comparing young and aged clearance (Figure 3A). We also used 6hr and 48hr post-injection time-points for cross-sectional analyses of synovial influx and DLN capacity respectively. The results from these studies demonstrated that large molecules (70kDa dextran) i.a. injected into the knees of young WT mice rapidly enter the synovial LVs in the first 6hrs, where they gradually translocate to the DLNs within 48hr, and then reside in the DLNs for days.
Figure 2. IVIS-dextran lymphatic image and kinetics of dextran clearance via the synovial lymphatic system.

3-month-old male mice were subjected to lymphatic imaging protocol as Figure 1A. Joint clearance, DLN capacity and synovial influx were examined at 0, 1, 6, 24, and 48 hrs following dextran injection. (A) The kinetics of dextran clearance from the knee is illustrated by longitudinal IVIS images of a representative mouse, quantified by fluorescence signal intensity ((photons/s)/(μW/cm2)). n=26, 22, 18, 14, 10 for each time-point. Data were fitted in an exponential decay curve. (B) The kinetics of Texas Red-dextran accumulation in the DLN is illustrated by cross-sectional ex vivo IVIS images of ILN following knee injection, quantified by fluorescence signal intensity ((photons/s)/(μW/cm2)). n=4 at 0hr, n=8 for other time-points. Data were fitted to two-component exponential regression curve. (C) Representative darkfield images of unstained knee sections illustrate the relative amount of dextran particles in the synovium following knee injection, quantified within the synovium (solid line) in arbitrary units (Peak signal = 6 hrs; Scale bar=200μm). n=4 at 0hr, n=8 for other time-points. Data were fitted to two-component exponential regression curve. One-way Anova followed by Tukey post-hoc test. p-values compared to time 0hr and <0.05 were indicated.
Impaired synovial lymphatic function in knee joints of aged mice.
To determine whether the SLS is involved in age-related OA, we examined the longitudinal dextran signal intensity of knee joints in 19-month-old aged mice similarly to Figure 2A in young joints. Compared to T1/2 clearance of 0.83hr in young mice (Figure 2C), the T1/2 clearance was delayed to 3.29hr in aged mice (Supplemental Figure 1). For SLS parameters, compared to young mice, aged mouse knees had decreased joint clearance, synovial influx, and DLN capacity (Figure 3A). These aged mice had osteoarthritic changes in their knees, including increased OARSI score, decreased unmineralized cartilage cross-sectional area, cartilage surface fibrillation, and meniscus hypertrophy (Figure 3B&C), consistent with our previous study comparing 6 month-old and >24 month-old mice [16].
Decreased expression of genes in the VEGF-C/VEGFR3 signaling pathway in aged joints.
To explore the potential mechanisms of age-related SLS dysfunction, we performed bulk RNA sequencing using synovial tissues of young and aged mice. Among the lymphatic specific genes, the expression of Pdpn (Podoplanin), a surface marker for LECs, and Vegf-c, growth factor for the LECs, significantly decreased in aged samples (Figure 4A). Expression of VEGF-C receptor VEGFR3 protein, Flt4 (Fms related receptor tyrosine kinase 4), was comparable in young and aged. Since VEGFR3 is a member of transmembrane receptor tyrosine kinase, we then assessed the expression levels of 69 genes involved in the receptor protein tyrosine kinase signaling pathway. Impressively, the majority of genes in this pathway were downregulated in aged samples (Supplementary Table 2). A thorough literature search revealed that 16 of the 69 genes are related to lymphatics (Supplementary Table 3), and had decreased expression in aged synovium (Figure 4B). The decreased expression of Vegf-c, Pdpn and genes within tyrosine kinase pathways including Sema6 (Semaphorin 6A) [23], Pdgfc (Platelet derived growth factor C) [24], and Itgb3 (Integrin subunit beta 3) [25] in aged synovium was validated with qPCR (Figure 4C). These data demonstrate that expression of Vegf-c and genes related to the VEGFR3 signaling pathway are decreased in aged synovium.
Figure 4. Expression of VEGF-C and genes related to VEGF-C downstream tyrosine kinase signaling is downregulated in aged synovium.

Young (3-month-old) and aged (24-month-old) C57Bl/6 female mice were used. (A-B) RNA sequencing of synovial tissues from young (n=5) and aged (n=4) mice. (A) Expression of lymphangiogenesis genes including Vegf family growth factors and receptors, lymphatic markers, and transcription factors. (A) Gene expression (log-transformed counts per million) of the 11604 detected genes was scaled and centered at 0. FDR adjusted p-values from the DESeq2 differential expression test are reported. (B) Log2-Fold change of gene expression in aged compared to young of 16 genes comparing 24-m with published literature suggesting involvement in the lymphatics and also in the tyrosine kinase signaling pathway including VEGFR3 signaling pathway (GO:0007169). FDR adjusted p-values from the DESeq2 differential expression test are reported. (C) mRNA Expression of Vegf-c, Pdpn, and tyrosine kinase related genes in knee synovium was determined by qPCR. Fold-change was first normalized to Actin expression and then normalized to one young mouse. Statistics difference between young and aged mice was analyzed using unpaired t-test and the exact values of p-values that are below 0.05 are shown.
VEGF-C attenuates OA tissue damage and improves synovial lymphatic drainage in aged mice.
Since decreased Vegf-c expression may be associated with age-related SLS dysfunction (Figure 3&4), we asked if supplementing VEGF-C in aged mouse joints could attenuate OA tissue damage and improves SLS function. We intraarticularly administered VEGF-C or vehicle to aged mice weekly for 12 weeks and examined OA pathology. A group of aged mice (19-month-old) before the treatment was included as a cross-sectional baseline control (Figure 5A). Compared to baseline control, vehicle-treated mice (22-month-old) had more severe osteoarthritic damage, indicating increased OA progression during the period between 19-month to 22-month of age. VEGF-C treatment reduced the joint tissue damage and MMP13 positive tissue area versus the 19-month baseline levels, indicating that VEGF-C reduced the OA progression between 19-month to 22-month of age (Figures 5B–D). While VEGF-C treatment reduced the percentage area of unmineralized cartilage, the actual area of unmineralized cartilage was unchanged (Fig. 5C), suggesting that the decrease in tissue area was offset by the larger total cartilage cross-sectional area preserved by VEGF-C treatment. Pain response score (Supplementary Figure 3), subchondral bone volume (Supplementary Figure 4), and synovial area (Supplementary Figure 5A&B) were not affected, suggesting that VEGF-C protected against age-related OA by preserving articular cartilage. To rule out the possibility that joint damage between the 19-month baseline and post-treatment at 22-month was due to weekly intraarticular injections, we compared OA parameters of mouse knees that received 6x vehicle injections with the knees that received 12x vehicle injections (used in Figure 5B–D as vehicle group) with a rationale that if intraarticular injection causes joint damage, the knees that received 12x injections should have more severe damage than the knees that received 6x injections. Histomorphometric analysis revealed no difference in OA histopathologic parameters between the knees that received 12x or 6x injections (Supplemental Figure 2). VEGF-C treatment also improved joint clearance (Figure 5E). In addition, the percentage of joint clearance was negatively correlated to OARSI score with r2 = 0.71, and positively correlated to cartilage cross-sectional area with r2 = 0.78 (Figure 5F), indicating that SLS function is negatively correlated with OA tissue damage in the same joint. Interestingly, despite improving synovial lymphatic drainage function, VEGF-C treatment did not increase the number of PDPN+ lymphatic vessels in the joint (Supplementary Figure 5), suggesting that VEGF-C treatment ameliorates OA pathology by enhancing synovial lymphatic function. Thus decreased SLS function likely contributes to age-related OA progression.
Synovial fibroblasts are the major source of VEGF-C.
We next explored the cellular sources for VEGF-C in the synovium using published sequencing datasets [26–28] (Supplementary Table 2). We first examined the bulk RNA-sequencing dataset of synovial tissues, and scRNA-sequencing of synovial fibroblasts from early and late OA patients [26]. We found that the expression of VEGF-C and VEGF-B, but not VEGF-A and VEGF-D, decreased in late OA synovial tissues (Figure 6A) and synovial fibroblasts (Figure 6A, B). We then explored a scRNA-sequencing of the total synovial cells from mice on C57Bl/6 background [27] and found that the major Vegf-c+ cells were Col6a1+ synovial fibroblasts, but not Lyz2 (Lysozyme C-2)+ myeloid cells (Supplementary Figure 6A&B). Similarly, a scRNA-sequencing of synovial cells from OA and RA patients [28] also revealed that VEGF-C was chiefly expressed by cluster 2 THY1 (THYmocyte differentiation antigen 1)+ and cluster 7 PRG4 (Proteoglycan 4)+ lining fibroblasts (Figure 6C&D, Supplementary Figure 7), both of which express COL6A1. In addition, we subsetted 1602 Vegf-c+ mouse synovial cells, and found that they did not express other Vegfs (Supplementary Figure 6C). Similarly, we subsetted the 916 VEGF-C+ cells from synovial cells of arthritic patients and found that the expression of VEGF-C and other VEGFs were mostly mutually exclusive (Supplementary Figure 8). To rule out articular chondrocyte as an alternative source for VEGF-C, we examined Vegf expression levels in single cell sequencing datasets from PTOA mice [29] (Supplementary Figure 9A) and OA patients [30] (Supplementary Figure 9B). Chondrocytes express high Vegf-a, moderate Vegf-b, and a very low level of Vegf-c. Consistently in an unpublished bulk RNA sequencing dataset of young and aged knee cartilage tissue, the mean count of Vegf-a, Vegf-b, Vegf-c expression was 2576, 190, 24, respectively. These data suggest that chondrocytes are not the major source for Vegf-c in the joint. Finally, we examined the percentage of VEGF-C+ and COL6A1+ cells in synovial cells from WT mice, and used TNF-Tg synovial cells as positive control because they have increased VEGF-C expression [9]. We found that 1.88% synovial cells expressed VEGF-C in WT synovium, which was increased to 14.3% in TNF-Tg mice. Consistent with the finding from scRNA-sequencing (Supplementary Figure 6–8), 97.8% and 99.4% of VEGF-C+ cells express COL6A1 in WT and TNF-Tg synovial cells, respectively (Figure 6E). In summary, we found that the major source for VEGF-C in synovium is the COL6A1+ synovial fibroblast.
Figure 6. COL6A1+ synovial fibroblasts are the major source of VEGF-C in human synovium.

(A) Bulk RNA sequencing of synovial tissues collected from patients with early OA (n=11) and late OA (n=12) (PMID: 34628351; GSE176223). VEGF-C expression is decreased in patients with late OA. (B) Single cell sequencing of 4247 synovial fibroblasts collected from early (n=8) and late (n=4) OA patients (PMID: 34628351; GSE176308). Violin plot showing that the VEGF-C expression is decreased in Late OA patient. (C) Analysis of 10099 synovial cells from 25 donors (RA and OA patients, PMID: 31061532; NCBI dbGaP: phs001457.v1.p1). Unsupervised clustering and feature plots displaying VEGF growth factors and fibroblast markers on UMAP. (D) Majority of VEGF-C expressing cells are in cluster2 (THY1+ sublining fibroblast) and cluster7 (PRG4+ lining fibroblast). (E) Flow cytometry showing VEGF-C expressing cells is increased in TNF-Tg mice, the majority of which are also COL6A1+.
Discussion
The lymphatic vascular system contributes to multiple human diseases. We and others revealed an important role of the SLS in the pathogenesis of inflammatory arthritis including RA [8, 31, 32] and PTOA [11], but its involvement in age-related OA remains unexplored. Here we used a novel IVIS-dextran lymphatic imaging tool and demonstrated impaired SLS function in knee joints of aged mice. RNA sequencing of synovial tissue revealed decreased expression of LEC growth factor Vegf-c and the genes involved in the VEGFR3 signaling pathway. Intra-articular administration of VEGF-C attenuated the OA pathology and improved SLS function in aged mice. We also found by analyzing published bulk and single cell RNA-sequencing datasets of murine [27] and human [26, 28] synovium that the major cellular source of VEGF-C in knee joints are synovial fibroblasts. These findings indicate for the first time that SLS dysfunction is a pathogenetic mechanism and may represent a therapeutic target for age-related OA.
In mouse models of RA and PTOA, inflammatory factors and cells could damage the SLS [18, 21], which is associated with increased lymphangiogenesis via the NF-κB signal pathway, a transcription factor promoting VEGF-C expression [33, 34]. While inflammation also increases in aging, unlike post-traumatic and inflammatory arthritis, we found that aged joints have decreased expression of VEGF-C levels (Figure 4), indicating that the mechanisms for SLS dysfunction in age-related OA differs from inflammatory arthritis. Aside from the age-related OA, lymphatic dysfunction during aging is shown to underlie various diseases [35–37]. The disruption of meningeal LVs aggravates parenchymal amyloid deposition and accumulation, which is improved by VEGF-C treatment via improving meningeal lymphatic drainage in an Alzheimer’s disease mouse model [13]. In addition, this study showed decreased VEGFR3 signaling in aged meningeal LECs. Thus, it is likely that down-regulation of VEGF-C/VEGFR3 may be a shared mechanism for age-related lymphatic dysfunction.
VEGF-C predominantly signals via VEGFR3 [38]. VEGFR3 gene Flt4 is differentially expressed in Prox1+ LECs in the mouse knee synovial cells (unpublished scRNA seq), suggesting that synovial LECs are the VEGF-C effector cells in the synovium. However, while scRNA seq data showed that Flt4 expression level is minuscule in chondrocytes from PTOA mice and patients (Supplementary Figure 10), VEGFR3 expression is reported in the articular cartilage from knee replacement OA patients [39], and cartilage-subchondral bone interface [40]. In addition, VEGF-C can affect osteoclasts [41] and macrophages [42] via VEGFR3. Thus, VEGF-C may exert effects directly on articular cartilage, bone tissue, or immune cells in addition to the SLS, which requires further investigation.
We demonstrated osteoarthritic tissue damage in 22-month-old mice (equivalent to 64-year-old human) is attenuated by VEGF-C treatment, as the joint was similar to that of 19-month-old mice (equivalent to 58-year-old human). We also found a prominent manifestation of OA tissue damage from 19-month to 22-month of age in mice (Figure 5A–D), which was independent of damaged caused by the intra-articular injections (Supplementary Figure 2). Coincidentally in humans, the estimated incidence of diagnosed symptomatic knee OA is highest among adults between 55-64 years of age [43]. Thus, it is likely that age of 19-22 months is also the inflection point for the onset age-related OA tissue damage in mice. Interestingly, analysis of an independent dataset revealed that late OA patients with an average age of 69-years and more severe knee dysfunction and pain, had reduced expression of VEGF-C compared to early OA patients with an average age of 54-years (Figure 6A&B), supporting the onset of OA around the age of 60 [26]. Alternatively, we cannot rule out the possibility that repeated injections over the course of 12 weeks could result in acute inflammation, and a combination of inflammatory arthritis and age-related arthritis, resulting in a phenotype of aggressive cartilage erosion within 3 months. Regardless of the cause of the cartilage loss, VEGF-C is able to protect against the cartilage loss phenotype at 22-month of age.
Whether protective macromolecules such as hyaluronic acid (HA) in the joint space can be removed through an enhanced synovial lymphatic system is highly relevant for clinical translation of lymphatic related therapies. HA, with a molecular weight >6000 kDa, is important in maintaining the viscosity and chondroprotective features of the synovial fluid, while the smaller depolymerized HA (molecular weight <600 kDa) is associated with increased inflammation and pain [44]. While lymphatic endothelial cells contribute to HA trafficking and degradation [45], Armstrong et al. reported that the ~600 kDa detrimental HA is in the lymph while the ~6000 kDa protective HA is found in the tissue [46], suggesting that the lower molecular weight detrimental HA is cleared by the synovial lymphatics. This provides an additional rationale for promoting the SLS clearance to treat arthritis.
There are several limitations of this study. First, we used male mice to assess the effect of VEGF-C treatment. A recent study using murine PTOA model showed that OA development was comparably in both sexes, although female had less severe end-stage histological damage and more severe pain [47]. In humans, OA is more prevalent in women with more clinical pain, inflammation and more severe radiographic signs compared to men [48]. Thus, future studies using female mice in the age-related OA model is necessary. Second, we do not know why Vegf-c expression is decreased in aged joints. We found that the majority of VEGF-C expressing cells in human synovium are COL6A1+ synovial fibroblasts, but not myeloid cells (Figure 6, Supplementary Figure 6&7). Whether the reduced VEGF-C expression in aged knees is due to the reduced VEGF-C expressing fibroblast population or decreased Vegf-c RNA transcription remains to be explored. Third, our data imply normal expression levels of Flt4 mRNA. VEGFR3 post-translational modification and degradation might also impact VEGF-C/VEGFR3 pathway [49]. Finally, VEGF-C is a cytokine and has a short half-life in vivo. Thus, optimization of VEGF-C treatment dosage or using other vehicle such as nanoparticle delivery system [50] may improve the efficacy of VEGF-C treatment.
In conclusion, decreased VEGF-C levels expressed by synovial fibroblasts in the knee synovium contributes to synovial lymphatic dysfunction and OA progression in mice during aging. Improvement of SLS may represent a therapeutic strategy for age-related OA treatment.
Supplementary Material
Supplementary Figure 1. Delayed dextran clearance in aged mice by IVIS-dextran lymphatic image. 19-month-old aged mice were subjected to for IVIS-dextran lymphatic image as described in Figure 1A. Joint clearance was examined at 0, 1, 6, 24, and 48 hrs following Texas Red-dextran joint injection. The relative amount of Texas Red-dextran particles in the synovium at the indicated time following knee injection was quantified with ImageJ software in arbitrary units. n=8 per time-points. One-way Anova followed by Tukey post-hoc test. p-values compared to time 0hr and <0.05 were indicated in the plot. Two component exponential regression curve was used for model fitting in MatLab as described in Figure 2. Parameters of the decay curve is indicated in the figures with T1/2=3.29hr.
Supplementary Figure 2. The intraarticular injection procedure does not accelerate joint tissue damage in aged mice. Aged C57Bl/6 mice (19-month-old) were i.a. injected vehicle (PBS) every other week for 12 weeks (n=8, a total of 6x injections). Knee joints were subjected to OA histopathological analysis on Safranin O stained sections. Parameters of OA histopathological changes were compared between the sections that received 6x i.a. injections and the sections that received 12x i.a. injections (n=16, data from Figure 3). The difference between 12x and 6x injections was analyzed using unpaired t-test and Mann-Whitney test for normally (cartilage/osteophyte/meniscus area, growth plate length) and non-normally (OARSI score, unmineralized cartilage cross-sectional area fraction) distributed data respectively.
Supplementary Figure 3. VEGF-C treatment does not affect Von Frey pain score in aged mice. Aged C57Bl/6 male mice (19-month-old) were treated with VEGF-C (n=8) or veh (n=10, 2 mice in this group were removed due to non-responsiveness to the Von Frey test) as described in Figure 5. 3-month-old young mice (n=8) were used as control. (A) Von Frey Score by the end of the 12-week treatment regimen. (B) The difference of Von Frey Score between before treatment and the end of the 12-week treatment regimen. Statistics difference among groups was analyzed using Kruskal-Wallis followed by Dunn’s post-hoc tests for BV/TV respectively. The exact p-values that are below 0.05 are shown.
Supplementary Figure 4. VEGF-C treatment does not affect subchondral bone volume in aged mice. Aged C57Bl/6 male mice (19-month-old) were treated with VEGF-C or veh as described in Figure 5. 3-month-old young mice and 19-month-old non-treated aged mice were used as baseline control (n=5 per 3-month-old young group; n=8 per 19-month-old baseline group; n=7 per vehicle-treated aged group; n=8 per VEGF-C-treated group). Knee joints were harvested for CT scanning. Trabecular bone volume (A-B) and the percentage of trabecular bone to total subchondral tissue volume (BV/TV) (C-D) of femur and tibia were analyzed respectively. Statistics difference among groups was analyzed using One-way ANOVA followed by Tukey post-hoc test for the trabecular bone volume or Kruskal-Wallis followed by Dunn’s post-hoc tests for BV/TV respectively. The exact p-values that are below 0.05 are shown.
Supplementary Figure 5. VEGF-C treatment does not affect PDPN+ lymphatic vessel area in aged mice. Aged C57Bl/6 male mice (19-month-old) were treated with VEGF-C or veh as described in Figure 5. 3-month-old young mice and 19-month-old non-treated aged mice were used as baseline control (n=5 per 3-month-old young group; n=8 per 19-month-old baseline group; n=7 per vehicle-treated aged group; n=8 per VEGF-C-treated group). (A) IHC staining of PDPN in the joint. The synovium is outlined by open white line. Arrows indicate vessel-like PDPN+ staining. Arrowheads indicate cell-like PDPN+ staining. Scale bar= 500μm. (B) Quantification of the synovium area. (C) Quantification of the % the PDPN+ area in the synovium area. Statistics difference among groups was analyzed using One-way ANOVA followed by Tukey post-hoc test for the synovium area or Kruskal-Wallis followed by Dunn’s post-hoc tests for the % PDPN+ area. The exact p-values that are below 0.05 are shown.
Supplementary Figure 6. Col6a1+ synovial fibroblasts are the major source of Vegf-c in mouse synovium. Single cell RNA dataset from mouse synovium was used (PMID: 32499639; GSE145286). 18491 synovial cells from adult mice on C57Bl/6 background were analyzed. (A) Unsupervised clustering revealed 7 clusters. Feature plots showing the expression of Vegf family growth factors Vegf-a, Vegf-b, Vegf-c, Vegf-d, and Col12a1, Col6a1. Vegf-c is expressed by Col6a1+ synovial fibroblast populations. (B) Annotated synovial cell subpopulations using markers published by Wei et al. (PMID: 32499639; GSE145286). Cluster1-7 are: Cluster1: Thy1+ sublining fibroblast; Cluster2: myeloid cell, Cluster3: Col12a1+ intermediate fibroblast, Cluster4: Prg4+ lining fibroblast; Cluster5: endothelial cell; Cluster6: T cell; Cluster7: B cell, respectively. (C) Unsupervised clustering of 1602 Vegf-c-expressing cells revealed six clusters. Expression of Vegf family growth factors Vegf-a, Vegf-b, Vegf-c, Vegf-d, and Col12a1, Col6a1. Most of Vegf-c-expressing cell express Col6a1, but not other Vegfs.
Supplementary Figure 7. Major cell identities identified by single cell sequencing of human cells. Single cell RNA dataset from synovium of RA and OA patients was used (PMID: 31061532; NCBI dbGaP: phs001457.v1.p1). 10099 synovial cells were analyzed. Unsupervised clustering revealed 9 clusters. Feature plot of marker genes roughly revealed six major cell identities. Cluster1: T cell. Cluster2: THY1+ sublining fibroblast. Cluster3: myeloid cell. Cluster4: B cell. Cluster5: EIF4G2+ cell. Cluster6: plasma cell. Cluster7: PRG4+ lining fibroblast. Cluster8: LYVE1+ cell. Cluster9: proliferating cell.
Supplementary Figure 8. All VEGF-C expressing cells are COL6A1+ in human synovium. Single cell RNA dataset from synovium of 25 RA and OA patients was used (PMID: 31061532; NCBI dbGaP: phs001457.v1.p1). (A) A total of 916 VEGF-C-expressing cells in synovial cells were sub-clustered. (B) UMAP showing that the majority of VEGF-C-expressing cells express COL6A1 and but do not express other VEGFs.
Supplementary Figure 9. Expression of Vegfc is low in chondrocytes. (A) Single cell RNA dataset of 6089 chondrocytes from a PTOA mouse model were used (PMID:34200880; GSE172500). FeaturePlot demonstrating the expression of Vegf family growth factors. (B) Single cell RNA dataset of 26228 chondrocytes from 3 OA patients were used (PMID:32616761; GSE152805). FeaturePlot demonstrating the expression of Vegf family growth factors.
Supplementary Figure 10. VEGFR3 expression is low in chondrocytes. (A) Single cell RNA dataset of 6089 chondrocytes from a PTOA mouse model were used (PMID:34200880; GSE172500). FeaturePlot demonstrating the expression of VEGFR3 gene Flt4. (C) Single cell RNA dataset of 26228 chondrocytes from 3 OA patients were used (PMID:32616761; GSE152805). FeaturePlot demonstrating the expression of VEGFR3 gene Flt4.
Supplementary Table 1. Primers used in qPCR.
Supplementary Table 2. Expression levels of genes in the transmembrane receptor protein tyrosine kinase signaling pathway (GO:0007169) is decreased in aged synovium.
Supplementary Table 3. Genes in the transmembrane receptor protein tyrosine kinase signaling pathway that involved in the lymphatics.
Supplementary Table 4. Published data set used in the bioinformatic analysis.
Acknowledgments
We would like to thank Dr. Takumi Fujita who performed the Von Frey measurement, and the faculty and staff at the Histology, Biochemistry, and Molecular Imaging Core at the University of Rochester Medical Center. This work was supported by funding from the National Institutes of Health: R01AG059775 and R21AR069789 (LX), AR076623 (JJ), R01-AT007945 (TT), and P30 AR069655.
Funding sources:
Research was supported by grants from the National Institute of Health PHS awards (AR069789, AG059775, AR069655, AT007945, AR076623).
Footnotes
Disclosure: The authors declare that no conflicts of interest exist.
References
- 1.Helmick CG, et al. , Estimates of the prevalence of arthritis and other rheumatic conditions in the United States. Part I. Arthritis Rheum, 2008. 58(1): p. 15–25. [DOI] [PubMed] [Google Scholar]
- 2.Lawrence RC, et al. , Estimates of the prevalence of arthritis and other rheumatic conditions in the United States. Part II. Arthritis Rheum, 2008. 58(1): p. 26–35. [DOI] [PMC free article] [PubMed] [Google Scholar]
- 3.Kapoor M, et al. , Role of proinflammatory cytokines in the pathophysiology of osteoarthritis. Nat Rev Rheumatol, 2011. 7(1): p. 33–42. [DOI] [PubMed] [Google Scholar]
- 4.Murphy G and Nagase H, Reappraising metalloproteinases in rheumatoid arthritis and osteoarthritis: destruction or repair? Nat Clin Pract Rheumatol, 2008. 4(3): p. 128–35. [DOI] [PubMed] [Google Scholar]
- 5.Albuquerque M and de Lima JP, Articular lymphoscintigraphy in human knees using radiolabeled dextran. Lymphology, 1990. 23(4): p. 215–8. [PubMed] [Google Scholar]
- 6.Albuquerque M, Scientigraphic studies of the lymphatic articular function in normal and pathological knees. European Journal of Lymphology and Related Problems, 1990. 1(2): p. 33–36. [Google Scholar]
- 7.Zawieja D, Lymphatic biology and the microcirculation: past, present and future. Microcirculation, 2005. 12(1): p. 141–50. [DOI] [PubMed] [Google Scholar]
- 8.Bouta EM, et al. , Targeting lymphatic function as a novel therapeutic intervention for rheumatoid arthritis. Nat Rev Rheumatol, 2018. 14(2): p. 94–106. [DOI] [PMC free article] [PubMed] [Google Scholar]
- 9.Guo R, et al. , Inhibition of lymphangiogenesis and lymphatic drainage via vascular endothelial growth factor receptor 3 blockade increases the severity of inflammation in a mouse model of chronic inflammatory arthritis. Arthritis Rheum, 2009. 60(9): p. 2666–76. [DOI] [PMC free article] [PubMed] [Google Scholar]
- 10.Zhou Q, et al. , Vascular endothelial growth factor C attenuates joint damage in chronic inflammatory arthritis by accelerating local lymphatic drainage in mice. Arthritis Rheum, 2011. 63(8): p. 2318–28. [DOI] [PMC free article] [PubMed] [Google Scholar]
- 11.Wang W, et al. , Attenuated Joint Tissue Damage Associated With Improved Synovial Lymphatic Function Following Treatment With Bortezomib in a Mouse Model of Experimental Posttraumatic Osteoarthritis. Arthritis Rheumatol, 2019. 71(2): p. 244–257. [DOI] [PMC free article] [PubMed] [Google Scholar]
- 12.Manzo A, et al. , Power Doppler ultrasonographic assessment of the joint-draining lymph node complex in rheumatoid arthritis: a prospective, proof-of-concept study on treatment with tumor necrosis factor inhibitors. Arthritis Res Ther, 2016. 18(1): p. 242. [DOI] [PMC free article] [PubMed] [Google Scholar]
- 13.Da Mesquita S, et al. , Functional aspects of meningeal lymphatics in ageing and Alzheimer’s disease. Nature, 2018. 560(7717): p. 185–191. [DOI] [PMC free article] [PubMed] [Google Scholar]
- 14.Baranwal G and Rutkowski JM, Reduced lymphatic function contributes to age-related disease. Aging (Albany NY), 2019. 11(22): p. 9969–9970. [DOI] [PMC free article] [PubMed] [Google Scholar]
- 15.Mäkinen T, et al. , Isolated lymphatic endothelial cells transduce growth, survival and migratory signals via the VEGF-C/D receptor VEGFR-3. Embo j, 2001. 20(17): p. 4762–73. [DOI] [PMC free article] [PubMed] [Google Scholar]
- 16.Catheline SE, et al. , IKKβ-NF-κB signaling in adult chondrocytes promotes the onset of age-related osteoarthritis in mice. Sci Signal, 2021. 14(701): p. eabf3535. [DOI] [PMC free article] [PubMed] [Google Scholar]
- 17.Joukov V, et al. , A recombinant mutant vascular endothelial growth factor-C that has lost vascular endothelial growth factor receptor-2 binding, activation, and vascular permeability activities. J Biol Chem, 1998. 273(12): p. 6599–602. [DOI] [PubMed] [Google Scholar]
- 18.Zhou Q, et al. , Near-infrared lymphatic imaging demonstrates the dynamics of lymph flow and lymphangiogenesis during the acute versus chronic phases of arthritis in mice. Arthritis Rheum, 2010. 62(7): p. 1881–9. [DOI] [PMC free article] [PubMed] [Google Scholar]
- 19.Igarashi H, et al. , Water influx into cerebrospinal fluid is significantly reduced in senile plaque bearing transgenic mice, supporting beta-amyloid clearance hypothesis of Alzheimer’s disease. Neurol Res, 2014. 36(12): p. 1094–8. [DOI] [PMC free article] [PubMed] [Google Scholar]
- 20.Iliff JJ, et al. , A paravascular pathway facilitates CSF flow through the brain parenchyma and the clearance of interstitial solutes, including amyloid beta. Sci Transl Med, 2012. 4(147): p. 147ra111. [DOI] [PMC free article] [PubMed] [Google Scholar]
- 21.Shi J, et al. , Distribution and alteration of lymphatic vessels in knee joints of normal and osteoarthritic mice. Arthritis Rheumatol, 2014. 66(3): p. 657–66. [DOI] [PMC free article] [PubMed] [Google Scholar]
- 22.Riedel A, et al. , Tumor-induced stromal reprogramming drives lymph node transformation. Nat Immunol, 2016. 17(9): p. 1118–27. [DOI] [PMC free article] [PubMed] [Google Scholar]
- 23.Epstein JA, Aghajanian H, and Singh MK, Semaphorin signaling in cardiovascular development. Cell Metab, 2015. 21(2): p. 163–173. [DOI] [PMC free article] [PubMed] [Google Scholar]
- 24.Folestad E, Kunath A, and Wågsäter D, PDGF-C and PDGF-D signaling in vascular diseases and animal models. Mol Aspects Med, 2018. 62: p. 1–11. [DOI] [PubMed] [Google Scholar]
- 25.Cordeiro OG, et al. , Integrin-Alpha IIb Identifies Murine Lymph Node Lymphatic Endothelial Cells Responsive to RANKL. PLoS One, 2016. 11(3): p. e0151848. [DOI] [PMC free article] [PubMed] [Google Scholar]
- 26.Nanus DE, et al. , Synovial tissue from sites of joint pain in knee osteoarthritis patients exhibits a differential phenotype with distinct fibroblast subsets. EBioMedicine, 2021. 72: p. 103618. [DOI] [PMC free article] [PubMed] [Google Scholar]
- 27.Wei K, et al. , Notch signalling drives synovial fibroblast identity and arthritis pathology. Nature, 2020. 582(7811): p. 259–264. [DOI] [PMC free article] [PubMed] [Google Scholar]
- 28.Zhang F, et al. , Defining inflammatory cell states in rheumatoid arthritis joint synovial tissues by integrating single-cell transcriptomics and mass cytometry. Nat Immunol, 2019. 20(7): p. 928–942. [DOI] [PMC free article] [PubMed] [Google Scholar]
- 29.Sebastian A, et al. , Single-Cell RNA-Seq Reveals Transcriptomic Heterogeneity and Post-Traumatic Osteoarthritis-Associated Early Molecular Changes in Mouse Articular Chondrocytes. Cells, 2021. 10(6). [DOI] [PMC free article] [PubMed] [Google Scholar]
- 30.Chou CH, et al. , Synovial cell cross-talk with cartilage plays a major role in the pathogenesis of osteoarthritis. Sci Rep, 2020. 10(1): p. 10868. [DOI] [PMC free article] [PubMed] [Google Scholar]
- 31.Schwartz N, et al. , Lymphatic Function in Autoimmune Diseases. Front Immunol, 2019. 10: p. 519. [DOI] [PMC free article] [PubMed] [Google Scholar]
- 32.Lam AD, et al. , Intra-articular injection of biologic anti-rheumatic drugs enhances local exposure to the joint-draining lymphatics. Eur J Pharm Biopharm, 2022. 173: p. 34–44. [DOI] [PubMed] [Google Scholar]
- 33.Zhang Q, et al. , Increased lymphangiogenesis in joints of mice with inflammatory arthritis. Arthritis Res Ther, 2007. 9(6): p. R118. [DOI] [PMC free article] [PubMed] [Google Scholar]
- 34.Flister MJ, et al. , Inflammation induces lymphangiogenesis through up-regulation of VEGFR-3 mediated by NF-kappaB and Prox1. Blood, 2010. 115(2): p. 418–29. [DOI] [PMC free article] [PubMed] [Google Scholar]
- 35.Shang T, et al. , Pathophysiology of aged lymphatic vessels. Aging (Albany NY), 2019. 11(16): p. 6602–6613. [DOI] [PMC free article] [PubMed] [Google Scholar]
- 36.Filelfi SL, et al. , Lymphatic Senescence: Current Updates and Perspectives. Biology (Basel), 2021. 10(4). [DOI] [PMC free article] [PubMed] [Google Scholar]
- 37.González-Loyola A and Petrova TV, Development and aging of the lymphatic vascular system. Adv Drug Deliv Rev, 2021. 169: p. 63–78. [DOI] [PubMed] [Google Scholar]
- 38.Rauniyar K, Jha SK, and Jeltsch M, Biology of Vascular Endothelial Growth Factor C in the Morphogenesis of Lymphatic Vessels. Front Bioeng Biotechnol, 2018. 6: p. 7. [DOI] [PMC free article] [PubMed] [Google Scholar]
- 39.Shakibaei M, et al. , Expression of the VEGF receptor-3 in osteoarthritic chondrocytes: stimulation by interleukin-1 beta and association with beta 1-integrins. Histochem Cell Biol, 2003. 120(3): p. 235–41. [DOI] [PubMed] [Google Scholar]
- 40.Orlandini M, et al. , Vascular endothelial growth factor-D activates VEGFR-3 expressed in osteoblasts inducing their differentiation. J Biol Chem, 2006. 281(26): p. 17961–7. [DOI] [PubMed] [Google Scholar]
- 41.Zhang Q, et al. , VEGF-C, a lymphatic growth factor, is a RANKL target gene in osteoclasts that enhances osteoclastic bone resorption through an autocrine mechanism. J Biol Chem, 2008. 283(19): p. 13491–9. [DOI] [PMC free article] [PubMed] [Google Scholar]
- 42.Yamashita M, et al. , VEGF-C/VEGFR-3 signalling in macrophages ameliorates acute lung injury. Eur Respir J, 2022. 59(4). [DOI] [PubMed] [Google Scholar]
- 43.Losina E, et al. , Lifetime risk and age at diagnosis of symptomatic knee osteoarthritis in the US. Arthritis Care Res (Hoboken), 2013. 65(5): p. 703–11. [DOI] [PMC free article] [PubMed] [Google Scholar]
- 44.Hunter DJ, Viscosupplementation for osteoarthritis of the knee. N Engl J Med, 2015. 372(11): p. 1040–7. [DOI] [PubMed] [Google Scholar]
- 45.Jackson DG, Immunological functions of hyaluronan and its receptors in the lymphatics. Immunol Rev, 2009. 230(1): p. 216–31. [DOI] [PubMed] [Google Scholar]
- 46.Armstrong SE and Bell DR, Relationship between lymph and tissue hyaluronan in skin and skeletal muscle. Am J Physiol Heart Circ Physiol, 2002. 283(6): p. H2485–94. [DOI] [PubMed] [Google Scholar]
- 47.Hwang HS, et al. , Comparison of joint degeneration and pain in male and female mice in DMM model of osteoarthritis. Osteoarthritis Cartilage, 2021. 29(5): p. 728–738. [DOI] [PubMed] [Google Scholar]
- 48.Tschon M, et al. , Gender and Sex Are Key Determinants in Osteoarthritis Not Only Confounding Variables. A Systematic Review of Clinical Data. J Clin Med, 2021. 10(14). [DOI] [PMC free article] [PubMed] [Google Scholar]
- 49.Wu H, et al. , Epsin deficiency promotes lymphangiogenesis through regulation of VEGFR3 degradation in diabetes. J Clin Invest, 2018. 128(9): p. 4025–4043. [DOI] [PMC free article] [PubMed] [Google Scholar]
- 50.Jin GZ, Current Nanoparticle-Based Technologies for Osteoarthritis Therapy. Nanomaterials (Basel), 2020. 10(12). [DOI] [PMC free article] [PubMed] [Google Scholar]
Associated Data
This section collects any data citations, data availability statements, or supplementary materials included in this article.
Supplementary Materials
Supplementary Figure 1. Delayed dextran clearance in aged mice by IVIS-dextran lymphatic image. 19-month-old aged mice were subjected to for IVIS-dextran lymphatic image as described in Figure 1A. Joint clearance was examined at 0, 1, 6, 24, and 48 hrs following Texas Red-dextran joint injection. The relative amount of Texas Red-dextran particles in the synovium at the indicated time following knee injection was quantified with ImageJ software in arbitrary units. n=8 per time-points. One-way Anova followed by Tukey post-hoc test. p-values compared to time 0hr and <0.05 were indicated in the plot. Two component exponential regression curve was used for model fitting in MatLab as described in Figure 2. Parameters of the decay curve is indicated in the figures with T1/2=3.29hr.
Supplementary Figure 2. The intraarticular injection procedure does not accelerate joint tissue damage in aged mice. Aged C57Bl/6 mice (19-month-old) were i.a. injected vehicle (PBS) every other week for 12 weeks (n=8, a total of 6x injections). Knee joints were subjected to OA histopathological analysis on Safranin O stained sections. Parameters of OA histopathological changes were compared between the sections that received 6x i.a. injections and the sections that received 12x i.a. injections (n=16, data from Figure 3). The difference between 12x and 6x injections was analyzed using unpaired t-test and Mann-Whitney test for normally (cartilage/osteophyte/meniscus area, growth plate length) and non-normally (OARSI score, unmineralized cartilage cross-sectional area fraction) distributed data respectively.
Supplementary Figure 3. VEGF-C treatment does not affect Von Frey pain score in aged mice. Aged C57Bl/6 male mice (19-month-old) were treated with VEGF-C (n=8) or veh (n=10, 2 mice in this group were removed due to non-responsiveness to the Von Frey test) as described in Figure 5. 3-month-old young mice (n=8) were used as control. (A) Von Frey Score by the end of the 12-week treatment regimen. (B) The difference of Von Frey Score between before treatment and the end of the 12-week treatment regimen. Statistics difference among groups was analyzed using Kruskal-Wallis followed by Dunn’s post-hoc tests for BV/TV respectively. The exact p-values that are below 0.05 are shown.
Supplementary Figure 4. VEGF-C treatment does not affect subchondral bone volume in aged mice. Aged C57Bl/6 male mice (19-month-old) were treated with VEGF-C or veh as described in Figure 5. 3-month-old young mice and 19-month-old non-treated aged mice were used as baseline control (n=5 per 3-month-old young group; n=8 per 19-month-old baseline group; n=7 per vehicle-treated aged group; n=8 per VEGF-C-treated group). Knee joints were harvested for CT scanning. Trabecular bone volume (A-B) and the percentage of trabecular bone to total subchondral tissue volume (BV/TV) (C-D) of femur and tibia were analyzed respectively. Statistics difference among groups was analyzed using One-way ANOVA followed by Tukey post-hoc test for the trabecular bone volume or Kruskal-Wallis followed by Dunn’s post-hoc tests for BV/TV respectively. The exact p-values that are below 0.05 are shown.
Supplementary Figure 5. VEGF-C treatment does not affect PDPN+ lymphatic vessel area in aged mice. Aged C57Bl/6 male mice (19-month-old) were treated with VEGF-C or veh as described in Figure 5. 3-month-old young mice and 19-month-old non-treated aged mice were used as baseline control (n=5 per 3-month-old young group; n=8 per 19-month-old baseline group; n=7 per vehicle-treated aged group; n=8 per VEGF-C-treated group). (A) IHC staining of PDPN in the joint. The synovium is outlined by open white line. Arrows indicate vessel-like PDPN+ staining. Arrowheads indicate cell-like PDPN+ staining. Scale bar= 500μm. (B) Quantification of the synovium area. (C) Quantification of the % the PDPN+ area in the synovium area. Statistics difference among groups was analyzed using One-way ANOVA followed by Tukey post-hoc test for the synovium area or Kruskal-Wallis followed by Dunn’s post-hoc tests for the % PDPN+ area. The exact p-values that are below 0.05 are shown.
Supplementary Figure 6. Col6a1+ synovial fibroblasts are the major source of Vegf-c in mouse synovium. Single cell RNA dataset from mouse synovium was used (PMID: 32499639; GSE145286). 18491 synovial cells from adult mice on C57Bl/6 background were analyzed. (A) Unsupervised clustering revealed 7 clusters. Feature plots showing the expression of Vegf family growth factors Vegf-a, Vegf-b, Vegf-c, Vegf-d, and Col12a1, Col6a1. Vegf-c is expressed by Col6a1+ synovial fibroblast populations. (B) Annotated synovial cell subpopulations using markers published by Wei et al. (PMID: 32499639; GSE145286). Cluster1-7 are: Cluster1: Thy1+ sublining fibroblast; Cluster2: myeloid cell, Cluster3: Col12a1+ intermediate fibroblast, Cluster4: Prg4+ lining fibroblast; Cluster5: endothelial cell; Cluster6: T cell; Cluster7: B cell, respectively. (C) Unsupervised clustering of 1602 Vegf-c-expressing cells revealed six clusters. Expression of Vegf family growth factors Vegf-a, Vegf-b, Vegf-c, Vegf-d, and Col12a1, Col6a1. Most of Vegf-c-expressing cell express Col6a1, but not other Vegfs.
Supplementary Figure 7. Major cell identities identified by single cell sequencing of human cells. Single cell RNA dataset from synovium of RA and OA patients was used (PMID: 31061532; NCBI dbGaP: phs001457.v1.p1). 10099 synovial cells were analyzed. Unsupervised clustering revealed 9 clusters. Feature plot of marker genes roughly revealed six major cell identities. Cluster1: T cell. Cluster2: THY1+ sublining fibroblast. Cluster3: myeloid cell. Cluster4: B cell. Cluster5: EIF4G2+ cell. Cluster6: plasma cell. Cluster7: PRG4+ lining fibroblast. Cluster8: LYVE1+ cell. Cluster9: proliferating cell.
Supplementary Figure 8. All VEGF-C expressing cells are COL6A1+ in human synovium. Single cell RNA dataset from synovium of 25 RA and OA patients was used (PMID: 31061532; NCBI dbGaP: phs001457.v1.p1). (A) A total of 916 VEGF-C-expressing cells in synovial cells were sub-clustered. (B) UMAP showing that the majority of VEGF-C-expressing cells express COL6A1 and but do not express other VEGFs.
Supplementary Figure 9. Expression of Vegfc is low in chondrocytes. (A) Single cell RNA dataset of 6089 chondrocytes from a PTOA mouse model were used (PMID:34200880; GSE172500). FeaturePlot demonstrating the expression of Vegf family growth factors. (B) Single cell RNA dataset of 26228 chondrocytes from 3 OA patients were used (PMID:32616761; GSE152805). FeaturePlot demonstrating the expression of Vegf family growth factors.
Supplementary Figure 10. VEGFR3 expression is low in chondrocytes. (A) Single cell RNA dataset of 6089 chondrocytes from a PTOA mouse model were used (PMID:34200880; GSE172500). FeaturePlot demonstrating the expression of VEGFR3 gene Flt4. (C) Single cell RNA dataset of 26228 chondrocytes from 3 OA patients were used (PMID:32616761; GSE152805). FeaturePlot demonstrating the expression of VEGFR3 gene Flt4.
Supplementary Table 1. Primers used in qPCR.
Supplementary Table 2. Expression levels of genes in the transmembrane receptor protein tyrosine kinase signaling pathway (GO:0007169) is decreased in aged synovium.
Supplementary Table 3. Genes in the transmembrane receptor protein tyrosine kinase signaling pathway that involved in the lymphatics.
Supplementary Table 4. Published data set used in the bioinformatic analysis.