Abstract
Ferroptosis, an iron-dependent form of cell death driven by lipid peroxidation, provides a potential treatment avenue for drug-resistant cancers and may play a role in the pathology of some degenerative diseases. Identifying the subcellular membranes essential for ferroptosis and the sequence of their peroxidation will illuminate drug discovery strategies and ferroptosis-relevant disease mechanisms. We employed fluorescence and stimulated Raman scattering imaging to examine the structure-activity-distribution relationship of ferroptosis-modulating compounds. We found that while lipid peroxidation in various subcellular membranes can induce ferroptosis, the endoplasmic reticulum (ER) membrane is a key site of lipid peroxidation. Our results suggest an ordered progression model of membrane peroxidation during ferroptosis that accumulates initially in the ER membrane, and later in the plasma membrane. Thus, the design of ER-targeted inhibitors and inducers of ferroptosis may be used to optimally control the dynamics of lipid peroxidation in cells undergoing ferroptosis.
Introduction
The iron-dependent form of lipid-peroxidation-mediated cell death known as ferroptosis, while remaining somewhat enigmatic, represents an emerging modality for treatment of several illnesses, including cancers and degenerative diseases.1-5 There is a suite of compounds that induce and inhibit this form of regulated cell death, highlighting the therapeutic potential of controlling this mechanism of cell death. Induction of ferroptosis, pharmacologically or genetically, has been shown to slow and regress tumor growth in vivo.6,7 In addition, some approved medications may kill cancer cells by ferroptosis, albeit not with high selectivity.8-11 Compounds inhibiting ferroptosis have shown therapeutic potential in models of degenerative diseases and ischemia-reperfusion injuries.12-18 The development of potent and selective ferroptosis-inducing or inhibiting drugs will benefit from a deeper understanding of the mechanisms of this form of cell death.
Ferroptosis occurs when lipid hydroperoxides accumulate in cellular membranes.19-21 The increased accumulation of such hydroperoxides can be due to inhibition of lipid reactive oxygen species (ROS) detoxification systems, or by direct lipid ROS generation.12,22-24 Polyunsaturated fatty acyl moieties (PUFAs), incorporated into phospholipids, are specific substrates of iron-dependent peroxidation during ferroptosis, due to their easily abstractable bis-allylic hydrogens.21,25,26 Because PUFA moieties could be incorporated into membranes throughout the cell, the question of which cellular membranes are particularly susceptible to, or necessary for, ferroptosis is still enigmatic. Previous work exploring the distribution of ferrostatin-1 (fer-1), an anti-ferroptotic agent, revealed that while fer-1 localizes to the endoplasmic reticulum (ER) membrane, mitochondrial membrane, and lysosomal membrane, accumulation in neither the mitochondria nor the lysosomes was necessary for activity, suggesting that the ER membrane may serve as a primary site of action for this compound.27 The role of mitochondria in ferroptosis was further explored by Gao and coworkers, who found that mitochondria play a role in cysteine-deprivation-induced ferroptosis, but they are dispensable for GPX4-inhibition-induced ferroptosis.28 Additionally, work by Mao et al. identified that inhibition of the mitochondrial reductase dihydroorotate dehydrogenase (DHODH) sensitizes cells to ferroptosis, indicating another role for mitochondria in the proliferation of lipid peroxide in ferroptotic death.29
The plasma membrane (PM) has also been implicated in ferroptosis. The anti-ferroptotic effect of the monounsaturated fatty acid (MUFA) oleic acid was observed to be exerted in conjunction with accumulation in the PM.30 Furthermore, the protein FSP1/AIFM2 was discovered to act as a CoQ10-dependent suppressor of ferroptosis, possibly working at the PM.31,32 These prior studies raised the question of which cellular membranes are involved in the ferroptotic death process, and how they are inter-related. Here, we aimed to elucidate the roles of cellular membranes in ferroptotic death.
To identify essential membranes for ferroptosis, we evaluated the structure-activity-distribution profile of ferroptosis inhibitors and inducers. This new approach involves imaging the subcellular distribution of ferroptosis-modulating compounds, then generating analogs with altered distributions, or genetically and pharmacologically modulating the compounds’ sites of accumulation. Two imaging techniques were used in this work: confocal fluorescence microscopy of compounds with fluorescent tags, and stimulated Raman scattering (SRS) imaging of Raman-active compounds with high sensitivity and resolution.33,34 While fluorescence imaging is more commonly employed and highly sensitive, SRS imaging offers the advantage of requiring only minor or even no modifications to the structures of the molecules of interest. Compared to conventional confocal Raman microscopy, SRS offers orders of magnitude higher imaging speed and sensitivity. Furthermore, SRS represents an orthogonal technique to fluorescence imaging, thereby eliminating interference during fluorescence measurement of cellular stains.
The primary ferroptosis-modulating compounds explored in this study were ferroptosis-inhibiting polyunsaturated fatty acids deuterated at their bis-allylic sites (D-PUFAs), and ferroptosis-inducing class IV inducers, including FINO2 and related compounds.
D-PUFAs potently inhibit ferroptosis due to the primary kinetic isotope effect. Bis-allylic hydrogens, situated between two double bonds, are particularly prone to hydrogen atom abstraction, which results in carbon oxygenation and subsequent lipid peroxide formation. In contrast, heavier deuterium atoms at the same sites slow this abstraction sufficiently to block peroxide propagation.35,36 The potent anti-peroxidation activity of these compounds has been demonstrated in vitro as well as in vivo.17,24,35-38 Here, we aimed to use these D-PUFAs as a chemical tool, hypothesizing that the observed sites of accumulation may point to essential protection points against ferroptosis.
We also explored the class IV ferroptosis inducer FINO2, which is an endoperoxide-containing 1,2-dioxolane that induces ferroptosis through oxidation of iron, and indirect inactivation of GPX4.24 Because FINO2 is a lipophilic compound, we hypothesized that FINO2 accumulates in membranes and directly induces PUFA peroxidation in PUFA-PLs (PUFA-containing phospholipids) in those locations. Other ferroptosis inducers target specific proteins and disrupt antiferroptotic pathways, meaning their localization is not directly connected to sites of lipid peroxide formation. However, because FINO2 directly delivers a peroxide to cells, its subcellular localization is of interest. We therefore aimed to determine if FINO2 targets specific membranes that allow it to exert its pro-ferroptotic action, and whether redirection to other subcellular sites would alter the ability of FINO2-type compounds to induce ferroptosis.
We report here analysis of subcellular distributions of numerous fatty acids and class IV ferroptosis inducers, finding that lipid peroxidation in the ER membrane and PM is essential to ferroptosis, with contribution from the mitochondria. We determined that modulating the lipid composition of these membranes alters cell sensitivity ferroptosis. We found that ferroptosis can be induced through lipid peroxidation in various organelles. Finally, we observed a consistent pattern of lipid ROS spread in cells treated with all four classes of ferroptosis inducers: lipid peroxidation initially propagated through the ER membrane, and later accumulated in the plasma membrane. Together, these results identify the ER membrane as a key site of ferroptotic lipid peroxidation, and an important target of ferroptosis-inducing and ferroptosis-inhibiting compounds.
Results
Deuterated PUFAs accumulate perinuclearly and in puncta
PUFAs deuterated at their bisallylic sites (D-PUFAs) will potently inhibit ferroptosis due to the primary kinetic isotope effect – heavier deuterium atoms at these sites slow the abstraction sufficiently to block peroxide propagation.35,36 We reasoned that identifying the subcellular sites of accumulation of D-PUFAs would reveal essential sites of lipid peroxidation in ferroptotic death.
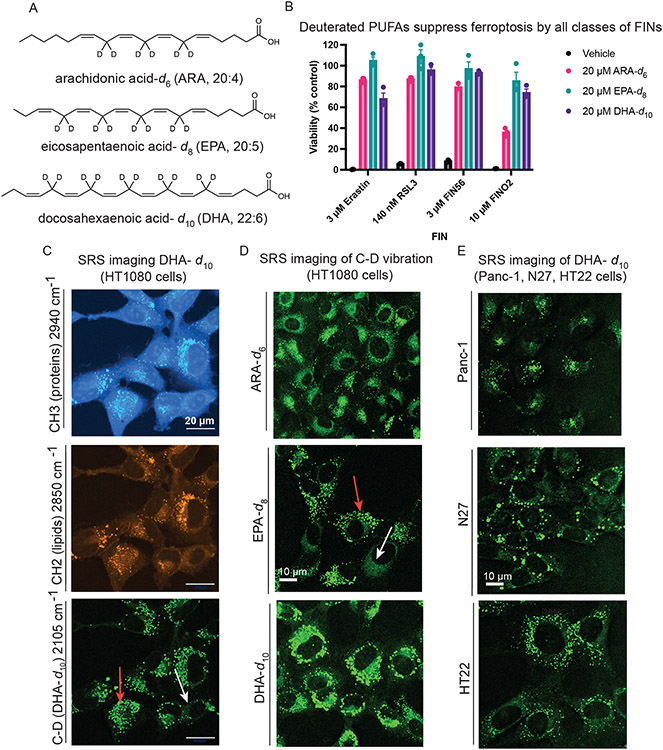
We evaluated the potency and distribution of three different D-PUFAs: arachidonic acid-d6 (ARA-d6), eicosapentaenoic acid-d8 (EPA-d8), and docosahexaenoic acid-d10 (DHA-d10) (Figure 1A). Treatment with 20 μM of ARA-d6, EPA-d8, or DHA-d10 potently prevents death by all four classes of ferroptosis inhibitors (Figure 1B), and concentrations as low as 1 μM were sufficient to cause some suppression of cell death (Extended Data Figure 1A).
Figure 1. Exogenous deuterated polyunsaturated fatty acids rescue against ferroptosis and accumulate perinuclearly and in puncta.
A. Structures of polyunsaturated fatty acids deuterated at their bis-allylic sites. B. Rescue of HT-1080 cells treated with each of four classes of ferroptosis inducers after a 24-hour pre-treatment with D-PUFAs. Data are represented as mean ± SEM, n=3. C. SRS images of HT-1080 cells treated for 24 hours with 20 μM DHA-d10. The protein (CH3) and lipid (CH2) cell-intrinsic vibrational frequencies are shown as well for comparison. Red arrow points to lipid droplets and white arrow points to perinuclear accumulation. D. SRS imaging of HT-1080 cells treated for 24 hours with the three different D-PUFAs used in this study, ARA-d6 (80 μM), EPA-d8 (20 μM), and DHA-d10 (20 μM). Red arrow points to lipid droplets and white arrow points to perinuclear accumulation. E. SRS imaging of Panc-1, N27, and HT-22 cells treated for 24 hours with 20 μM DHA-d10.
To determine the subcellular sites of accumulation of D-PUFAs, we made use of stimulated Raman scattering (SRS) imaging.33,34 Because the vibration of C–D bond is Raman active in a cell-silent region, it is possible to directly image these C–D-containing D-PUFAs with high specificity, sensitivity, and spatial resolution inside living cells. Imaging of DHA-d10 in HT-1080 fibrosarcoma cells revealed perinuclear accumulation (Figure 1C, white arrow) decorated with bright puncta (Figure 1C, red arrow), consistent with ER and lipid droplet localization. This distribution was also observed for ARA-d6 and EPA-d8 (Figure 1D) as well as in other cell types (Figure 1E), including Panc-1 (a human pancreatic cancer line), N27 (a rat dopaminergic neuronal line), and HT-22 cells (a mouse hippocampal neuronal line). Thus, D-PUFAs have a consistent and predominant perinuclear and puncta localization. This concentration of each of these PUFAs was sufficient to inhibit ferroptosis by all four classes of inducers, indicating the areas of accumulation were candidates for primary activity sites.
D-PUFAs in lipid droplets do not inhibit ferroptosis
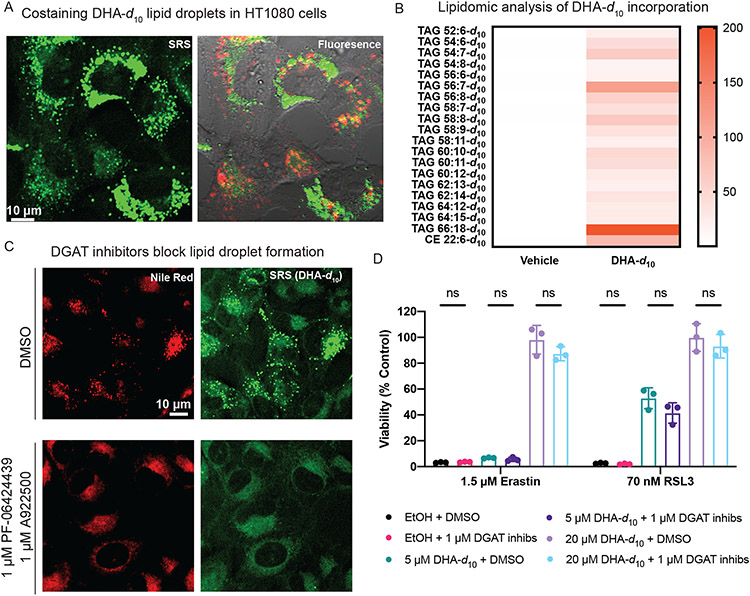
We hypothesized that the puncta observed on SRS imaging of D-PUFAs were either lipid droplets or lysosomes. Cells treated with DHA-d10 were stained with LysoTracker to label lysosomes and Nile Red to label lipid droplets. These experiments revealed that DHA-d10 accumulates in lipid droplets, but not in lysosomes (Figure 2A). We did not observe D-PUFA accumulation in peroxisomes (Extended Data Figure 1B). Lipidomic analysis of cells treated with DHA-d10 supported localization in lipid droplets, as the PUFA was incorporated into triacylglycerides (TAGs) and cholesterol esters (CE), which are stored in lipid droplets (Figure 2B).
Figure 2. D-PUFA accumulation in lipid droplets does not play a role in inhibition of ferroptosis.
A. SRS and fluorescence imaging of HT-1080 cells treated with 20 μM DHA-d10, and then stained with Nile Red (shown in green for consistency with SRS image) and Lysotracker Green (in red). B. Heatmap showing relative incorporation of deuterated DHA into HT-1080 triglycerides, as measured by LC-MS. Vehicle showed no deuterated incorporation, whereas DHA-d10 had varying levels of incorporation into triglycerides and cholesterol esters, with different sum total numbers of carbons and double bonds. Data shown are an average of absolute signal intensity of three biological replicates. C. SRS and fluorescence imaging of HT-1080 cells treated with DHA-d10 (20 μM) ± cotreatment with DGAT inhibitors PF-06424439 (1 μM) and A922500 (1 μM), and then stained with Nile Red. D. Rescue of HT-1080 cells from erastin or RSL3 lethality with pre-treatment of DHA-d10 ± co-treatment of DGAT inhibitors. Data are represented as mean ± SEM, along with individual data points, n=3. Statistics performed using two-sided unpaired t test.
We next aimed to determine whether the accumulation in lipid droplets was relevant to the anti-ferroptotic activity of D-PUFAs. To inhibit lipid droplet formation, synthesis of TAGs was blocked by pharmacologically inhibiting diglyceride acyltransferase (DGAT) enzymes. A co-treatment with 1 μM of inhibitors of each DGAT isozyme (PF-06424439 and A922500) completely abated lipid droplet accumulation in cells treated with exogenous PUFAs, as demonstrated by SRS imaging (Figure 2C). Inhibition of lipid droplet formation by DGAT inhibitors had no impact on the anti-ferroptotic potency of DHA-d10 (Figure 2D), demonstrating that accumulation in lipid droplets does not play a role in the ability of D-PUFAs to prevent ferroptosis, and moreover that lipid droplets are not needed for ferroptosis.
D-PUFAs incorporate primarily into ER phospholipids
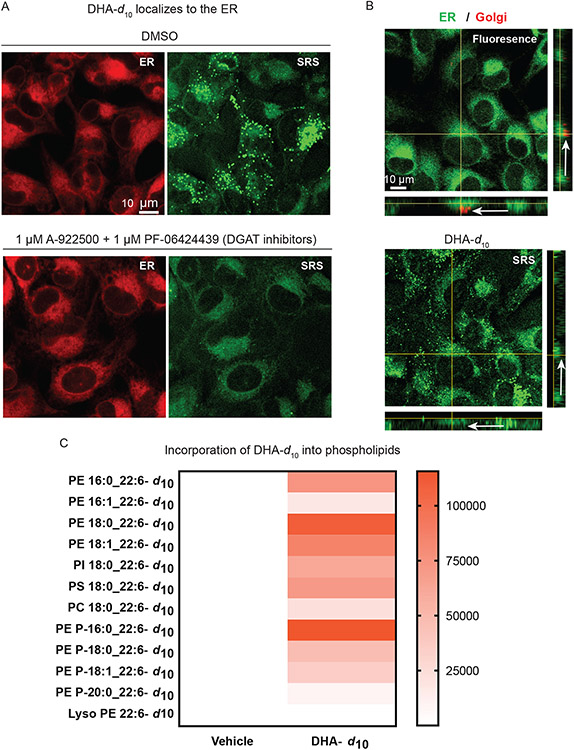
We next aimed to determine the identity of the perinuclear site of accumulation of D-PUFAs. Upon inhibition of lipid droplet formation, it became clear that D-PUFAs were likely accumulating in the endoplasmic reticulum (ER) membrane. This hypothesis was confirmed by SRS imaging of cells treated with DHA-d10 (with and without co-treatment of DGAT inhibitors) and stained with ERTracker Green, a fluorescent ER label (Figure 3A). To determine whether D-PUFAs were additionally accumulating in the Golgi body membrane, cells treated with DHA-d10 were co-stained with ERTracker and BODIPY TR Ceramide, a fluorescent Golgi stain. The resulting correlative fluorescence and SRS images enhanced by X-Z and Y-Z axis images revealed that accumulation of D-PUFAs occurs primarily in the ER membrane, with little co-localization of DHA-d10 with the Golgi stain (Figure 3B, white arrows). Finally, lipidomic analysis showed incorporation of DHA-d10 into phospholipids (Figure 3C). There was marked incorporation into phosphatidylethanolamine (PE) phospholipids and ether phospholipids. Ferroptosis has been reported to involve PE phospholipids20; thus, incorporation of D-PUFAs into PEs with an observed ER distribution potentially explains the potent protective effect of these fatty acids. With regard to ether phospholipids, plasmalogens have been implicated in ferroptosis, with observations that ether phospholipids containing PUFAs are substrates of lipid peroxidation during ferroptosis,39 and that plasmalogen synthesis proteins are necessary for some fatty-acid-induced ferroptosis.40
Figure 3. Anti-ferroptotic D-PUFAs incorporate into ER phosphatidylethanolamine phospholipids and ether phospholipids.
A. SRS and fluorescence imaging of HT-1080 cells treated with DHA-d10 (20 μM) ± co-treatment with DGAT inhibitors PF-06424439 (1 μM) and A922500 (1 μM), and then stained with ERTracker Green. B. SRS and fluorescence imaging of HT-1080 cells treated with DHA-d10 (20 μM) and then stained with ERTracker Green and BODIPY TR ceramide (a Golgi stain). White arrows indicate the Golgi region. C. Heatmap showing incorporation of deuterated DHA into HT-1080 phospholipids as measured by LC-MS. Vehicle shows no deuterated incorporation, whereas DHA-d10 has varying incorporation depending on the lipid species and fatty acid compositions. PE: phosphatidylethanolamine, PI:phosphatidylinositol, PS:phospatidyserine, PC: phosphatidylcholine. Data shown are an average of absolute signal intensity of three biological replicates.
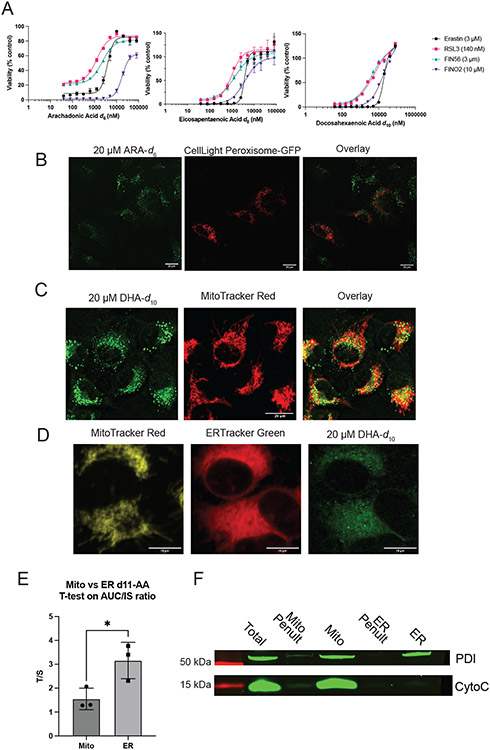
Given the nuanced role of mitochondria in ferroptosis, and the proximity of the ER and mitochondria, we sought to determine incorporation of D-PUFAs into mitochondria. Initial images did not show significant overlap with mitochondria, and higher resolution SRS imaging showed a distribution pattern more consistent with ER localization than mitochondrial localization (Extended Data Figures 1C & D). Given the proximity of the ER and mitochondria in these images, however, it was difficult to accurately quantify ER versus mitochondrial incorporation definitively. We therefore attempted an orthogonal approach, by treating cells with D-PUFA and purifying ER and mitochondrial membranes. We quantified relative incorporation of D-PUFA using high resolution mass spectrometry (Extended Data Figure 1D & E), and found that there was a significantly greater normalized incorporation into the ER as compared to the mitochondria. Importantly, we observed contamination of the mitochondrial fraction with ER as measured by ER resident protein PDI on western blot, suggesting the true D-PUFA level in the mitochondria is even lower. We conclude that the perinuclear localization of D-PUFAs is primarily in the ER, but that we cannot rule out minor incorporation into the mitochondria.
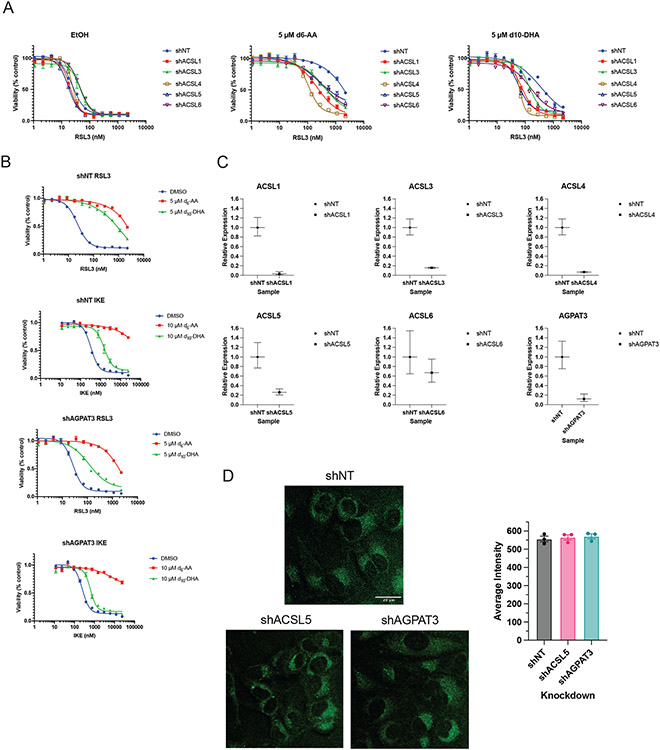
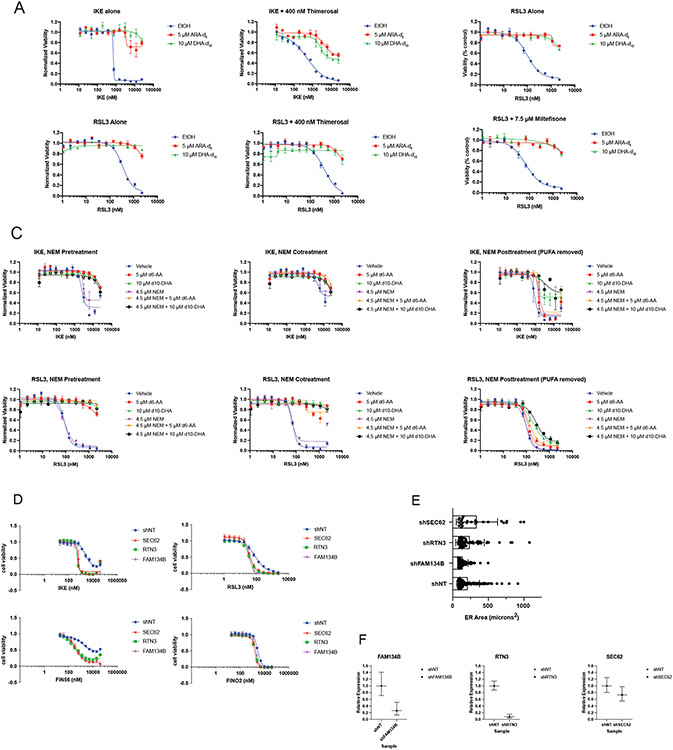
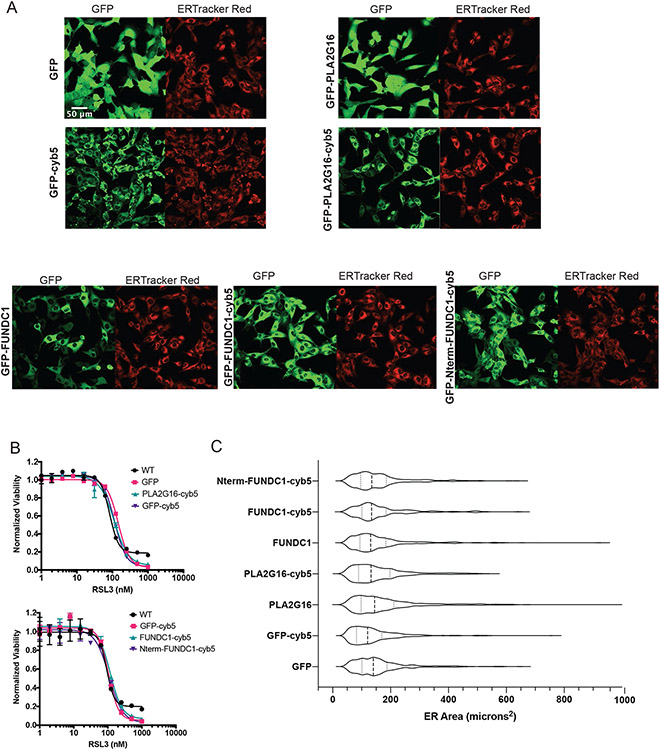
We made extensive attempts to modulate the ER through genetic and pharmacological means. None of the approaches explored, however, resulted in significant or persistent changes in ER size or composition. Knockdown of lipid metabolism genes, including acyl-CoA synthase (ACSL) genes and 1-Acylglycerol-3-Phosphate O-Acyltransferase 3 (AGPAT3), did cause decreases in D-PUFA potency (Extended Data Figure 2A-C), but these effects were not consistent. A decrease in PUFA incorporation was not reliably detected under these conditions (Extended Data Figure 2D). We attempted to alter incorporation of exogenous lipids into the ER with various compounds, including thimerosal, a lysophosphatidylcholine acyltransferase (LPCAT) inhibitor,41 miltefosine, a phosphatidylcholine synthesis inhibitor,42 and N-ethylmaleimide, a phospholipase A2 (PLA2) activator.43 None of these modulators were effective, however (Extended Data Figure 3A-C). We also tried to increase the ER size by inhibiting ER-phagy pathways, and to decrease ER area by directing organelle-depleting proteins to the ER. Knockdown of ER-phagy proteins FAM134B, SEC62, and RTN344 did result in an increase sensitivity to FINs, but there was no detectable expansion of ER volume (Extended Data Figure 3D-F). Considering that PLA2G16 and FUN14 domain containing 1 (FUNDC1) both play roles in targeted organelle degradation,45,46 we overexpressed these proteins on the surface of the ER to induce ER-phagy. GFP, PLA2G16, FUNDC1, and the active cytosolic N-terminal region of FUNDC1 were directed to the ER using a cytochrome B5 tag (Extended Data Figure 4A-C), resulting in no detectable change in ER size. We concluded that modulation of ER size and lipid composition is challenging, and perhaps future developments will allow more straightforward and applicable manipulation of ER surface area and content.
Modulating ER and PM lipids alters ferroptotic sensitivity
We next sought to explore if the distribution observed for D-PUFAs remained consistent for other fatty acids relevant to ferroptosis. The fatty acids examined included pro-ferroptotic PUFAs and anti-ferroptotic MUFAs. We hypothesized that if we enriched the ER membrane with these fatty acids, we would observe corresponding changes in sensitivity to ferroptosis.
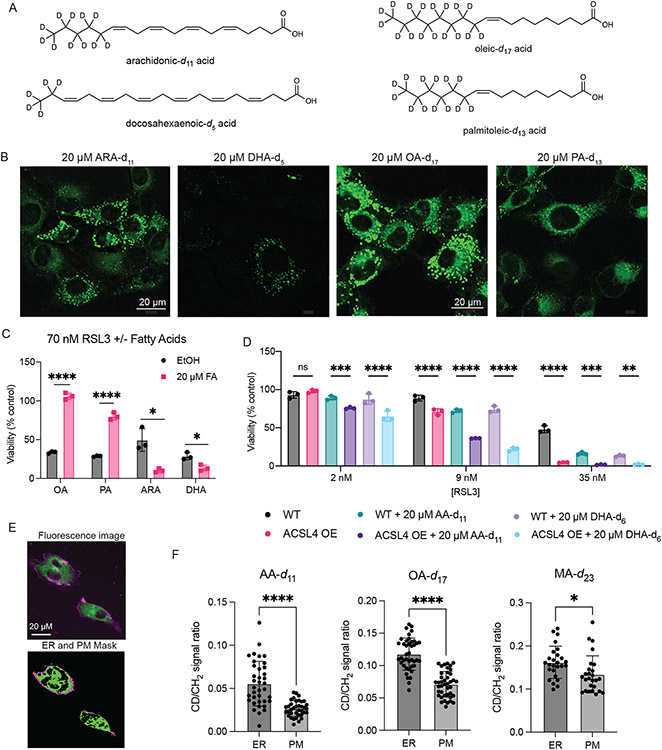
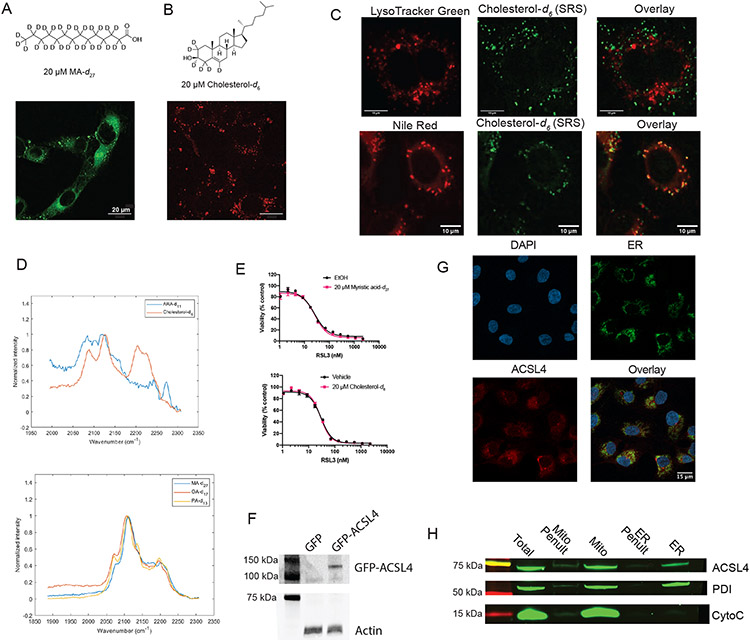
To determine the distribution of PUFAs and MUFAs, SRS imaging was again employed. Fatty acids labeled with deuterium atoms were again used – PUFAs ARA-d11 and DHA-d5, deuterated at non-bis-allylic sites (and therefore pro-ferroptotic with abstractable bisallylic hydrogens), and MUFAs oleic-d17 acid (OA-d17) and palmitoleic-d13 acid (PA-d13) (which are antiferroptotic due to their lack of bisallylic sites and their harboring a monounsaturated fatty acyl moiety) (Figure 4A). All four fatty acids displayed the same distribution pattern as the anti-ferroptotic D-PUFAs (Figure 4B). As a control, the distributions of two other lipids were tested as well: myristic-d27 acid (MA-d27) and cholesterol-d6. MA-d27, a saturated fatty acid (SFA), accumulated into the ER and lipid droplets like other fatty acids, demonstrating this distribution appears to be common to various fatty acid types, including SFAs that do not influence ferroptosis. Cholesterol-d6 did not accumulate in the ER, demonstrating that the ER is not simply the default site of accumulation for any lipid (Extended Data Figure 5A-C). Solution Raman spectra of all these compounds showed an observable C—D peak (Extended Data Figure 5D).
Figure 4. Enriching the ER and PM with pro- or anti-ferroptotic lipids modulates cell sensitivity to ferroptosis.
A. Structures of deuterated fatty acids. Of note, the PUFAs are deuterated at non-bis-allylic positions and therefore do not inhibit ferroptosis. B. SRS images of HT-1080 cells treated with each of the deuterated fatty acids. C. Effect of pre-treatment (24 hours) with fatty acids on ferroptosis induced by RSL3 in HT-1080 cells, as compared to ethanol vehicle. Data are represented as mean ± SEM, n=3. Two-sided unpaired t test was performed with p values of 0.00001, 0.000053, 0.010389, 0.012767. D. Increase in sensitivity to ferroptosis in cells overexpressing GFP-ACSL4 when treated with equivalent dose of PUFAs, as compared to parental HT-1080 cells. Data are represented as mean ± SEM, n=3. 2way ANOVA with Tukey’s multiple comparison test was performed with p values of 0.5037, 0.0004, <0.0001, <0.0001, <0.0001, <0.0001, <0.0001, 0.0001, 0.0033. E. Representative imaging of cells stained with ERTracker Green and FM 4-64 to label ER and PM, respectively, and the resulting masks generated in MATLAB. F. Quantification of relative fatty acid incorporation as CD signal to general lipid CH2 signal ratio within the PM and ER masks as shown in 4E. Data are represented as mean ± SEM with each point representing an individual cell. Two-sided unpaired t test resulted in ARA n=37 p<0.0001, OA n=41 p<0.0001, MA n=26 p=0.016. For all panels, GraphPad Prism (GP) P value style of 0.1234 (ns), 0.0332 (*), 0.0021 (**), 0.0002 (***), <0.0001 (****).
Once the subcellular distributions of these lipids were assessed, their effects on ferroptotic death were evaluated. As expected, pre-treatment with the MUFAs OA-d17 or PA-d13 potently inhibited RSL3-induced ferroptosis, while PUFAs ARA-d11 and DHA-d5 significantly increased cell death (Figure 4C). By contrast, myristic acid and cholesterol did not significantly alter sensitivity to ferroptosis (Extended Data Figure 5E). To increase incorporation of PUFAs into membranes via increased intracellular PUFA-CoA concentration, an HT-1080 ACSL4 overexpression cell line was generated (Extended Data Figure 5F). HT-1080 ACSL4 OE cells exhibited increased sensitivity to ferroptosis, as well as an increased pro-ferroptotic effect of pre-treatment with PUFAs (Figure 4D), confirming that enriching PUFAs in the ER enhanced ferroptosis. We also explored the possibility of localization of ACSL4 playing a role in PUFA distribution. Immunofluorescence imaging of HT-1080 cells stained for ACSL4, however, showed a distribution diffusely throughout cells (Extended Data Figure 5G), with overlap with the ER, labeled by calnexin staining. A western blot of ER and mitochondrial fractions from HT-1080 cells identified ACSL4 in both fractions (Extended Data Figure 5H), overall suggesting that ACSL4 is spread throughout the cell.
Since it has been observed that inhibition of OA incorporation into the plasma membrane (PM) correlated with diminished anti-ferroptotic effect of this MUFA,30 we sought to determine the degree of accumulation of MUFAs and PUFAs in the PM. Perhaps due to the narrowness of the PM in image cross-sections, as well as the lower magnification of the SRS images, no fatty acids were initially detected in the PM. Higher magnification, however, revealed PM incorporation. Staining with ERTracker Green and FM 4-64 (PM) was used to generate ER and PM masks in MATLAB (Figure 4E), which were then applied as masks to the SRS images of the deuterated FAs and used to quantify relative incorporation as compared to the general SRS lipid signal. We found that there was significantly more PUFA, MUFA, and SFA incorporation into the ER than the PM, although relative levels were closer in the case of myristic acid (Figure 4F).
Class IV ferroptosis inducers localize to ER and Golgi
To complement our work evaluating the key sites of ferroptosis-relevant fatty acid accumulation, we also explored the class IV ferroptosis inducer FINO2 (1), which is an endoperoxide-containing 1,2-dioxolane that induces ferroptosis through oxidation of iron, and indirect inactivation of GPX4.24 Because FINO2 is a lipophilic compound, we hypothesized that FINO2 accumulates in membranes and directly induces PUFA peroxidation in PUFA-PLs in those locations. We therefore aimed to determine if FINO2 targets specific membranes that allow it to exert its pro-ferroptotic action, and whether redirection to other subcellular sites would alter the ability of FINO2-type compounds to induce ferroptosis.
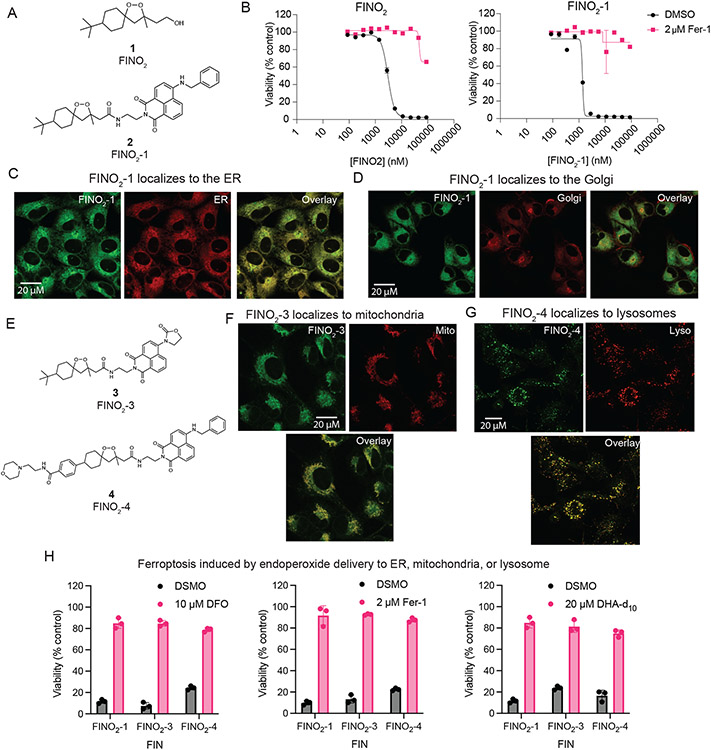
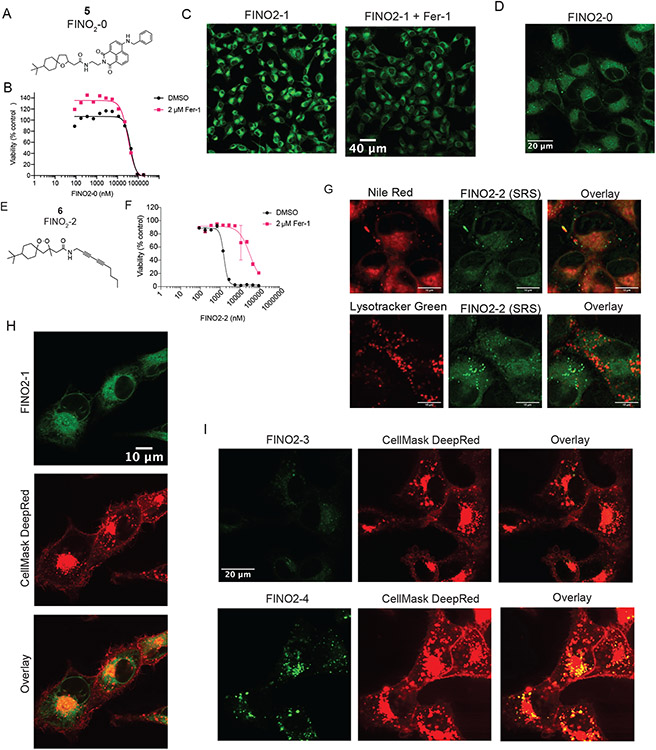
To identify the subcellular distribution of FINO2, labeled analogs were prepared. Peroxide FINO2-1 (2) resembles FINO2 but contains a fluorescent naphthalimide moiety (Figure 5A) that can be visualized by fluorescence microscopy. Analog FINO2-0 (5) does not contain the endoperoxide moiety essential for biological activity,24 but does contain the naphthalimide moiety (Extended Data Figure 6A). FINO2-1 was able to induce ferroptosis with similar potency as FINO2 (Figure 5B), while FINO2-0 did not induce ferroptosis (Extended Data Figure 6B), confirming that the endoperoxide moiety is necessary and that the naphthalene group does not exhibit toxicity.
Figure 5. FINO2 analogs can induce ferroptosis through accumulation in the ER, lysosome, or mitochondria.
A. Structures of FINO2 and analog FINO2-1 with an added fluorescent naphthalimide label. B. Dose response curves of FINO2 and FINO2-1, ± fer-1 (2 μM). Data are represented as a mean ± SEM, n=3. C. Confocal fluorescence imaging of HT-1080 cells treated with FINO2-1 (3 μM) and fer-1 (3 μM) for 3 hours, co-stained with ERTracker Red. D. Confocal fluorescence imaging of HT-1080 cells treated with FINO2-1 (3 μM) and fer-1 (3 μM) for 3 hours, co-stained with BODIPY TR ceramide. E. Structures of FINO2analogs FINO2-3 and FINO2-4. F. Confocal fluorescence imaging of HT-1080 cells treated with FINO2-3 (3 μM) and fer-1 (3 μM) for 3 hours, co-stained with MitoTracker Red CMXRos. G. Confocal fluorescence imaging of HT-1080 cells treated with FINO2-4 (3 μM) and fer-1 (3 μM) for 3 hours, co-stained with LysoTracker Red. H. Rescue of HT-1080 cells treated for 24 hours with FINO2-1 (2.5 μM), FINO2-3 (5 μM), or FINO2-4 (5 μM) by DFO (left, 10 μM cotreatment), fer-1 (center, 2 μM cotreatment), or DHA-d10 (right, 20 μM 24-hour pretreatment). Data are represented as mean ± SEM, n=3 biologically independent samples.
Next, confocal fluorescence imaging was performed to determine the distributions of these compounds. Because FINO2-1 kills cells within a few hours of treatment, co-treatment with 3 μM of fer-1 was used to prevent cell death. As this co-treatment did not alter the distribution of the compound, co-treatment with fer-1 was used for the remainder of these analog imaging experiments (Extended Data Figure 6C). FINO2-1 displayed a perinuclear distribution that was confirmed to be the ER membrane (Figure 5C). FINO2-0 had the same distribution (Extended Data Figure 6D). Accumulation in the Golgi membrane was identified as well (Figure 5D).
To ensure that ER/Golgi membrane localization of FINO2-1 was not due strictly to the addition of the fluorescent moiety, another analog, FINO2-2 (6), was synthesized, which contained an SRS active diyne group instead of the naphthalimide fragment (Extended Data Figure 6E). FINO2-2 induced ferroptosis with similar potency as FINO2-1 and FINO2, and SRS imaging revealed that FINO2-2 exhibited the same distribution as FINO2-1 with some additional puncta (Extended Data Figure 6F & G). Co-staining with LysoTracker and Nile Red was performed, showing that the puncta were neutral lipid bodies, likely induced by the higher concentrations necessary to detect the compound with SRS imaging (Extended Data Figure 6G).
Finally, given the localization of fatty acids to the PM, we sought to determine if class IV ferroptosis inducers such as FINO2 accumulate to any extent in the PM. Cells treated with FINO2-1 were co-stained with CellMask Deep Red to stain the PM and imaged (Extended Data Figure 6H). FINO2-1 did not show any overlap with CellMask, demonstrating that accumulation in the PM is not essential for initiation of ferroptosis by class IV inducers.
Ferroptosis can be directly induced in various organelles
Imaging of FINO2-1 and FINO2-0 revealed that delivery of an endoperoxide moiety to the ER and Golgi results in ferroptotic cell death. We wondered if redistributing an endoperoxide to other organelles would induce ferroptosis.
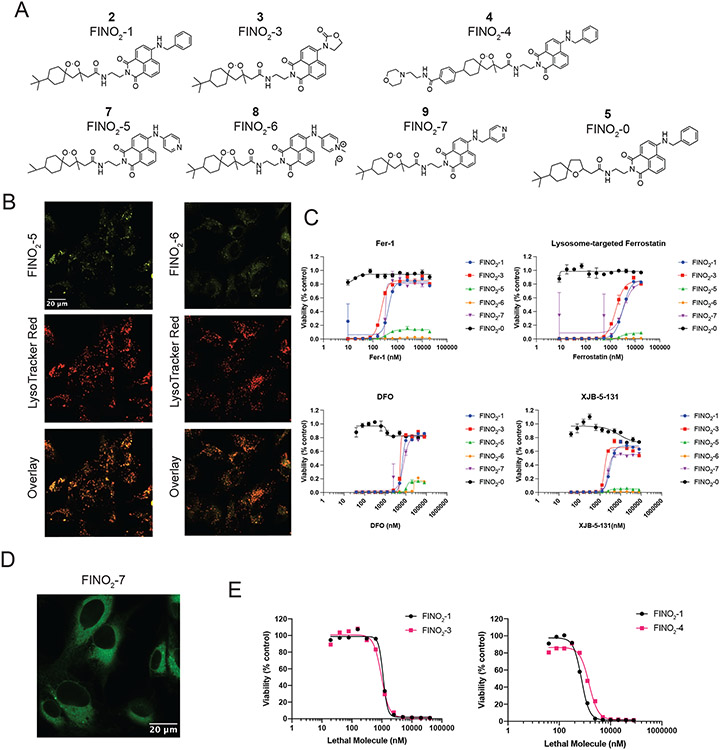
Experiments with a series of analogs of FINO2 demonstrated that protection of the ER is key to inhibiting ferroptosis, regardless of where in the cell it was initiated. These analogs were synthesized to redistribute the FINO2 endoperoxide to other subcellular sites (Extended Data Figure 7A). While compounds FINO2-5 (7) and FINO2-6 (8) were successfully redirected to lysosomal membranes, they induced a non-ferroptotic cell death (Extended Data Figure 7B and C). Compound FINO2-7 (9) did not change distribution as compared to FINO2-1 (Extended Data Figure 7D). In contrast, FINO2-3 (3) and FINO2-4 (4) (Figure 5E) successfully induced ferroptosis while being redistributed to the mitochondrial membranes and the lysosomal membranes, respectively (Figure 5F & G). FINO2-3 and FINO2-4 did not accumulate in the PM when examined on higher magnification (Extended Data Figure 6I), and retained similar lethal potency as FINO2-1 (Extended Data Figure 7E). Both FINO2-3 and FINO2-4 induced ferroptotic cell death that could be rescued by ferroptosis inhibitors with varying mechanisms and distributions: fer-1, deferoxamine, and DHA-d10 (Figure 5H). Rescue by both DHA-d10 and fer-1 points to the ER and mitochondria as essential sites of protection. As it has been demonstrated that mitochondria are not essential to ferroptosis,27,28 this finding implicates the ER as the key essential site of protection.
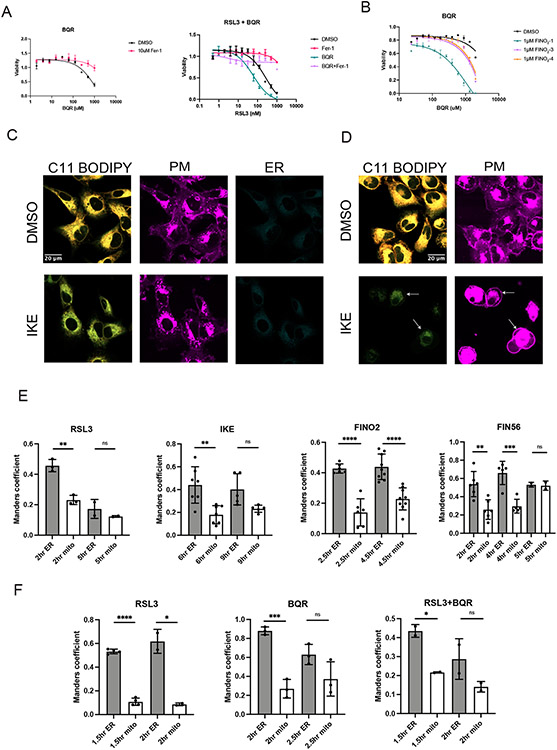
To further characterize the role of mitochondria, we sought to determine how treatment with these different FINO2 analogs would impact sensitivity of cells to inhibition of the mitochondrial reductase DHODH. Inhibition of DHODH with the compound brequinar (BQR) induced ferroptosis in HT1080 cells and caused an increase in sensitivity to RSL3, as previously demonstrated by Mao et al. (Extended Data Figure 8A).29 We then cotreated cells with a fixed amount of FINO2-1, FINO2-3, or FINO2-4 and increasing doses of BQR (Extended Data Figure 8B). FINO2-1 demonstrated a greater degree of sensitization, suggesting that the combination of simultaneously oxidizing the ER and mitochondria more effectively induces ferroptosis.
Ferroptosis results in peroxidation of ER followed by PM
To further define the roles that different membranes play in the ferroptotic death cascade, HT-1080 cells were treated with inducers from each of the four ferroptosis classes and imaged at various timepoints to capture cell death progression. Cells were stained with C11 BODIPY to detect lipid peroxidation and organelle stains for subcellular localization.
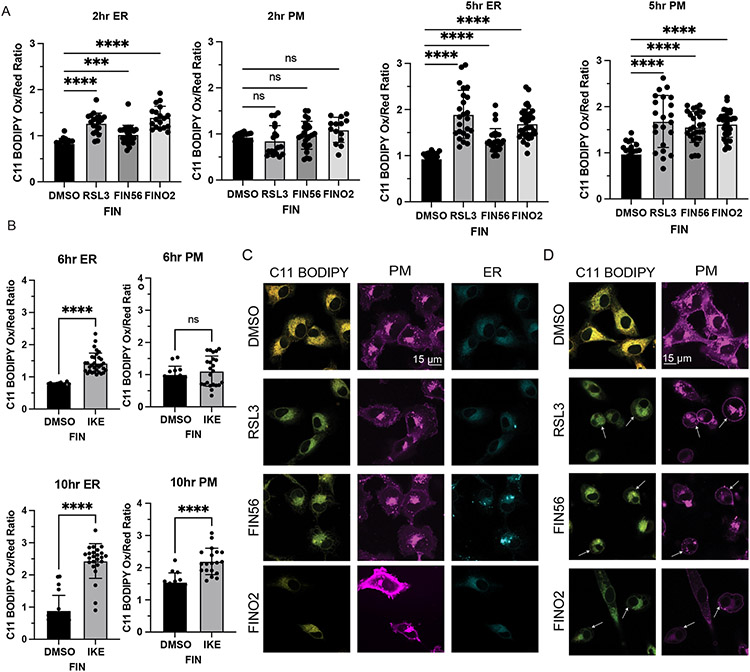
In cells treated with ferroptosis inducers, we observed ER peroxidation initially, followed later by PM peroxidation (Figure 6A & B). The peroxidation of each membrane was associated with morphological changes, including a decrease in ER membrane area, and a narrowing and ballooning of the plasma membrane. ER peroxidation occurs within 2 hours for cells treated with RSL3, FIN56, and FINO2. At this stage, there is not significant observable change in PM morphology (Figure 6C). By five hours, most cells exhibited lipid peroxidation within the plasma membrane (Figure 6D). Imidazole ketone erastin (IKE) induces a slower death than the other ferroptosis inducers; ER peroxidation was observed by six hours, with widespread plasma membrane peroxidation by ten hours (Extended Data Figure 8 C & D).
Figure 6. Ferroptosis induced by RSL3, FIN56, FINO2, or IKE results in ER peroxidation followed by PM peroxidation.
A. Quantification of C11 BODIPY oxidized:reduced ratio within the ER and PM of HT-1080 cells treated with DMSO, RSL3 (0.5 μM), FIN56 (10 μM), or FINO2 (10 μM) at 2 and 5 hours. CellMask Deep Red (PM) and ERTracker Blue-White (ER) were used to select regions of interest in CellProfiler within which C11 BODIPY signal was quantified. Data are represented as mean ± SEM, with each point representing a single cell. Sample sizes are 2 hours ER (n=18, 19, 25, 18), PM (n=18, 19, 25, 14) and 5 hours ER (n=21, 24, 28, 36), PM (n=21, 22, 28, 36). Brown-Forsythe and Welch ANOVA with Dunnet T3 test for multiple comparisons was used with p values of: ER 2 hours (<0.0001, 0.0007, <0.0001), PM 2 hours (0.6485, 0.9049, 0.1531), ER 5 hours (<0.0001, <0.0001, <0.0001), PM 5 hours (<0.0001, <0.0001, <0.0001) B. Quantification of C11 BODIPY oxidized:reduced ratio within the ER and PM of HT-1080 cells treated with DMSO or IKE (10 μM) at 6 and 10 hours. CellMask Deep Red (PM) and ERTracker Blue-White (ER) were used to select regions of interest in CellProfiler within which C11 BODIPY signal was quantified. Data are represented as mean ± SEM, with each point representing a single cell. Sample sizes are 6 hours ER (n=20, 32), PM (n=14, 23) and 10 hours ER (n=20, 24), PM (n=14, 19). Two-sided unpaired t test was used with p values of: ER 6 hours (<0.0001), PM 6 hours (0.4385), ER 10 hours (<0.0001), PM 10 hours (<0.0001) C. Representative images of HT-1080 cells treated with DMSO, RSL3 (0.5 μM), FIN56 (10 μM), or FINO2 (10 μM) for 2 hours and stained with C11 BODIPY (oxidized and reduced overlay), CellMask Deep Red, and ERTracker Blue-White. D. Representative images of HT-1080 cells treated with DMSO, RSL3 (0.5 μM), FIN56 (10 μM), or FINO2 (10 μM) for 5 hours and stained with C11 BODIPY (oxidized and reduced overlay), CellMask Deep Red, and ERTracker Blue-White. For all panels, GraphPad Prism (GP) P value style of 0.1234 (ns), 0.0332 (*), 0.0021 (**), 0.0002 (***), <0.0001 (****).
To evaluate lipid peroxidation in the mitochondria, we compared correlation of oxidized C11 BODIPY signal to ERTracker vs MitoTracker. C11 BODIPY oxidized signal had a significantly higher correlation with the ER initially for all four FINs at the intial stages of death (Extended Data Figure 8E). We performed the same quantification for cells treated with RSL3, BQR and RSL3 + BQR, and observed more relative mitochondrial peroxidation with BQR as expected, but interestingly still significantly greater peroxidation in the ER earlier in death. Altogether, these data point to the ER as a primary essential target of lipid peroxidation in ferroptosis, with the peroxidation of the mitochondria and PM as a later stage of death.
Discussion
Previous research pointed to the ER membrane as a possible primary site of protection by fer-1 against lipid ROS to prevent ferroptotic death.27 Here, we demonstrated that directly introducing lipid ROS into the ER membrane is sufficient to initiate ferroptotic death, with our observation that the ER is the subcellular membrane target of FINO2, a class IV ferroptosis inducer. It is not a requirement that lipid ROS be introduced exclusively to the ER membrane, however: we found that initiating lipid ROS in the mitochondrial or in lysosomal membranes can still induce ferroptotic cell death, as demonstrated by the FINO2 analogs FINO2-3 and FINO2-4, which localize to different subcellular compartments. Protecting lysosomes or mitochondria from lipid ROS with a radical trapping agent was not effective for blocking ferroptosis.27 At the same time, inhibition of DHODH is known to fuel ferroptotic death, indicating a relevant contribution of mitochondrial ROS. Interestingly, we found that inhibiting DHODH in combination with induction of lipid ROS in the ER membrane with FINO2-1 resulted in augmented cell death. Altogether, these findings indicate that ROS in the lysosomes and mitochondria can initiate and drive ferroptosis.
Our findings showed that lipid droplets do not play a significant role in D-PUFA-mediated protection against ferroptosis. Recently published work by Dierge and colleagues, however, found that exogenous n-3 and n-6 PUFAs potentiated ferroptosis in acidic cancer cells, and that this effect is magnified through inhibition of protective shunting of PUFAs into lipid droplets with DGAT inhibitors.47 Therefore, while inhibition of lipid droplets may not influence sensitivity to ferroptosis in all cases, or play a role in the activity of antiferroptotic FAs, perturbation of lipid droplet metabolism may have a role in modulating ferroptosis in certain contexts.
Beyond lipid droplets, we identified the ER as the primary site of PUFA incorporation, with less incorporation into the PM or mitochondria. These results point to the ER as a key target of lipid peroxidation in ferroptosis, as the largest membrane in the cell containing a high relative PUFA concentration. We then aimed to deepen our understanding of the subcellular dynamics of lipid peroxidation to disentangle the roles of these membranes in influencing ferroptosis. For all ferroptosis inducers, plasma membrane lipid peroxidation was observed by C11-BODIPY three to four hours after ER lipid peroxidation was observed. This finding is consistent with previous observations by Magtanong and coworkers, who found that treatment with Erastin2, an erastin analog, resulted in PM peroxidation ten hours after treatment, as observed in our time course for IKE.30 Our data indicate that ER peroxidation happens early in ferroptotic death, with mitochondrial and plasma membrane peroxidation as later events.
Our model proposes that the ER membrane is a key site of lipid peroxidation in ferroptosis induced by class I through IV compounds. This finding couples with the previously observed activation of the ER stress-related unfolded protein response in ferroptosis, and further underscores the question of the role this organelle plays in ferroptosis.48,49 Lipid peroxidation may spread from the ER to other membranes, or peroxidation of membranes may occur independently at different stages and with different rates. If lipid peroxidation is spreading, how it spreads is not clear. How peroxidation progresses from the ER to the plasma membrane is also not clear. Vesicular transport or membrane contact sites are both good hypotheses, and warrant further exploration. It was recently shown by Riegman and colleagues that ferroptotic cell lysis is osmotic, and perhaps it is the combination of lipid peroxidation in the cell membrane and the osmotic swelling that results in the final blow of cell death – a membrane that is both stretched and then weakened finally pops.50
In summary, we found that endoperoxide delivery to different organelle membranes can induce ferroptosis, and that the ER membrane is a primary target of lipid peroxidation in ferroptotic death. Although mitochondria are not required for ferroptosis, when present they play an important role in susceptibility. We also observe that oxidation of the plasma membrane occurs at a later, more final stage of ferroptotic death. These observations dovetail with the cell’s natural systems of protection against lipid peroxidation, with GPX4 serving as protector of the ER membrane and subcellular membranes in general, while DHODH protects the mitochondria and FSP1 protects the plasma membrane.29,31,32 The use of SRS and fluorescence imaging to examine the structure-activity-distribution relationship of inducers and inhibitors of ferroptosis demonstrates the power of such a strategy in its ability to demystify the subcellular dynamics of this form of cell death, and to provide important information for future development of ferroptosis-modulating drugs.
Methods
Cell Lines
HT-1080 (human [Homo sapiens] male fibrosarcoma), PANC-1 (human [Homo sapiens] male pancreatic epithelial fibrosarcoma), HEK293T (human [Homo sapiens] male fibrosarcoma), N27 (Rat [Rattus norvegicus] dopaminergic neural cell line), and HT22 (Mouse [Mus musculus] hippocampal neuronal cell line) were obtained from ATCC (https://www.atcc.org/). HT-1080, HEK293T, and HT-22 cells were cultured in Dulbecco’s Modified Eagle Medium (DMEM) with 10% Fetal Bovine Serum (FBS), 1% Non-Essential Amino Acids, and 1% Penicillin-Streptomycin (P-S). PANC-1 cells were cultured in DMEM with 10% FBS and 1% P-S. N27 cells were cultured in RPMI medium with 10% FBS, 2 mM L-glutamine, and 1% P-S. All cells were cultured at 37°C and 5% CO2.
Chemicals and reagents
Reagents used in this study include: Arachidonic acid-d6 (Retrotope, Inc.), Eicosapentaenoic acid-d8 (Retrotope, Inc.), Docosahexaenoic acid-d10 (Retrotope, Inc.), Erastin (Cayman Chemical), Imidazole Keto Erastin (IKE) (Stockwell laboratory), RSL3 (Stockwell laboratory), FIN56 (Gift of Rachid Skouta), FINO2 (Woerpel laboratory), Brequinar (BQR) (Cayman Chemical) PF-06424439 (Cayman Chemical), A922500 (Cayman Chemical), Arachidonic acid-d11 (Cayman Chemical), Docosahexaenoic acid-d5 (Cayman Chemical), Oleic acid-d17 (Cayman Chemical), Palmitoleic acid-d13 (Cayman Chemical), Myristic acid-d27 (Sigma-Aldrich), Cholesterol-d6 (Sigma-Aldrich), Thimerosal Ready Made Solution (Sigma-Aldrich), Miltefisone (Cayman Chemical), N-ethylmaleimide (Sigma-Aldrich), LysoTracker Green DND-26 (Invitrogen), LysoTracker Red DND-99 (Invitrogen), Nile Red (Invitrogen), ERTracker Red (Invitrogen), ERTracker Green (Invitrogen), ERTracker Blue-White DPX (Invitrogen), BODIPY TR Ceramide complexed to BSA (Invitrogen), MitoTracker Red CMXRos (Invitrogen), Hoechst 33342 (Invitrogen), BODIPY 581/591 C11(Invitrogen), CellMask Deep Red (Invitrogen), and FM 4-64 (Invitrogen).
Dose-Response Assays
Cells were seeded in a 384-well plate at 1500 cells/well. In experiments using D-PUFAs, cells were treated at the time of seeding. After 24 hours incubation at 37°C/5% CO2, cells were treated with compounds of interest, and incubated for a further 24 hours at 37°C/5% CO2. Cell viability was evaluated with CellTiterGlo (Promega), and results were worked up in GraphPad Prism. All treatments were performed in triplicate.
SRS Imaging and analysis
Cells were seeded on 12 mm circular cover glasses (Thermo Fischer) in a 24-well plate at 50,000 cells/well. In experiments using deuterated fatty acids, cells were treated at the time of seeding and incubated for 24 hours at 37°C/5% CO2. In experiments with FINO2-2, cells were treated after overnight incubation at 37°C/5% CO2. All treatments were performed in duplicate. SRS imaging was performed with a system coupling two spatially and temporally overlapped laser beams from an integrated laser source (picoEmerald, Applied Physics & Electronics, Inc.) into a commercial confocal laser-scanning microscope (FV1200MPE, Olympus). One of the laser beams for SRS is a tunable pump beam (720 to 990 nm, 5-6 ps), the other is a Stokes beam with fixed wavelength (1064 nm, 6 ps, intensity modulated at 8 MHz). Both are at 80 MHz repetition rate. The two beams are focused onto the cell samples through a 25X water objective (XLPlan N, 1.05 NA MP, Olympus), and the transmitted beams are then collected by a high N.A. oil condenser lens (1.4 N.A., Olympus) for detection. A high O.D. bandpass filter (890/220 CARS, Chroma Technology) is used to block the Stokes beam and leave only the pump beam to be collected by a silicon photodiode (FDS1010, Thorlabs) with a DC voltage of 64 V. The output current of the photodiode was terminated by 50 Ω and demodulated with a high-frequency lock-in amplifier (HF2LI, Zurich instrument) at 8 MHz frequency. The stimulated Raman loss signal at each pixel is sent to the analog interface box (FV10-ANALOG, Olympus) of the microscope to generate the image. All images (512 × 512 pixels) are acquired with 30 μs time constant at the lock-in amplifier and 100 μs pixel dwell time. The on-sample power for SRS imaging was 80 mW for pump beam and 120 mW for Stokes beam.
For evaluation of incorporation of D-FA into ER and PM, cells treated with 20 μM D-FA were incubated with 1 μM ERTracker Green (Invitrogen) in HBSS for 15 min at 37 °C and 10 μg/mL FM 4-64 (Invitrogen) in HBSS for 5 min at room temperature for ER and PM labeling. The CH2 on resonance channel was acquired at 2850 cm−1, and the CD on resonance channel was acquired at 2105 cm−1. Off resonance channels were acquired at 1900 cm−1 and were used for subtraction from the on resonance channel to obtain the pure SRS signal. The PM and ER regions in cells were segmented on the CH2 on resonance channel with reference to the corresponding PM and ER fluorescence images using MATLAB R2020a. Concentrated lipid droplets gave saturated SRS signals and were removed from segmented regions. The pure SRS signals for CD and CH2 were obtained by subtracting the on resonance image with the off resonance image at the same condition.
Confocal Fluorescence Imaging
Cells were seeded in 4-well coverglass chambers (Nunc™ Lab-Tek™) at 150,000 cells/well or 8-well coverglass chambers at 50,000 cells/well. In experiments using fatty acids, cells were treated at the time of seeding and incubated for 24 hours at 37°C/5% CO2. In experiments with FINO2 analogs and FINs, cells were treated after overnight incubation at 37°C/5% CO2. After relevant staining as described below, cells were placed in HBSS and images were taken using Zeiss LSM 700 and 800 confocal microscopes with Zeiss Zen Blue 2.1 software, then worked up in FIJI/CellProfiler.51,52 For quantification of images, CellProfiler was used. For ER vs PM quantification, ER and PM of each cell were identified as objects using their respective stains. The median signal for C11 BODIPY oxidized and reduced channels was then determined for every cell within the identified ER and PM regions, and these were plotted. For ER vs mitochondria quantification, colocalization of C11 BODIPY was used instead due to the proximity of the ER and mitochondria stains and small size of the mitochondria making object identification too difficult. The colocalization metrics were measured only for pixels above a certain threshold which was set as 20% of the maximum intensity of the image to eliminate the background. The Manders coefficient was used to represent the correlation of pixel intensity between C11 BODIPY oxidized and either the ER stain or mitochondrial stain. For quantification of ER size, objects were identified using adaptive Otsu two class thresholding, and their size properties were calculated and exported. At least six images were used for each sample, resulting in the sample sizes of # of cells defined as n.
Fluorescent Staining of Live Cells
Fluorescent labels were used according to manufacturer’s instructions. LysoTracker Green DND-26 (Invitrogen) and LysoTracker Red DND-99 (Invitrogen) were diluted to 50 nM in HBSS and incubated for 30 minutes at 37°C. Nile Red (Invitrogen) was diluted to 1 μg/mL in HBSS, and incubated for 5 minutes at room temperature. ERTracker Green, ERTracker Red, and ERTracker Blue-White (Invitrogen) were diluted to 1 μM in HBSS and incubated for 20 minutes at 37°C. Golgi stain BODIPY™ TR Ceramide complexed to BSA (Invitrogen) was diluted to 5 μM and incubated at 37°C for 30 minutes. MitoTracker Red CMXRos (Invitrogen) was diluted to 50 nM in HBSS and incubated at 30 minutes. Hoechst 33342 was diluted to 1 μg/mL and incubated for 5 minutes at room temperature. BODIPY™ 581/591 C11 (Invitrogen) was diluted to 10 μM and incubated for 10 minutes at 37°C. CellMask Deep Red Plasma Membrane stain (Invitrogen) was diluted to 5 μg/mL in HBSS and incubated for 10 minutes at 37°C.
Immunofluorescence Imaging
HT-1080 cells were seeded on 8-well chambered slides (Fisher Scientific) at 0.05 million cells per well and let grow overnight. Cells were washed with PBS twice and fixed with 4% paraformaldehyde for 30 min at room temperature at dark. Cells were than permeabilized by three washes with PBST (PBS with 0.1% Triton X-100). Cells were blocked with 5% normal goat serum in PBST for 1 hr at room temperature. Cells were stained with mouse anti-ACSL4 antibody (Invitrogen) 1:250 and rabbit anti-Calnexin antibody (Invitrogen) 1:333 overnight at 4 °C. Cells were washed three times with PBST and stained with Alexafluor 594-conjugated anti-mouse (Invitrogen) 1:500 and Alexafluor 488-conjugated anti-rabbit antibody (Invitrogen) 1:500 at room temperature for 1 hr. Cells were washed three times with PBST. Slides were slightly dried and added with one drop of antifade mountant with DAPI (Invitrogen) and covered with cover glass. Slides were dried overnight and imaged using Zeiss LSM 800 confocal microscope.
Lipidomics with High Resolution Mass-Spectrometry
HT-1080 cells were seeded at 5 million cells per 10 cm dish in triplicate, with either ethanol as vehicle or 20 μM PUFA, at incubated for 24 hours. Cells were harvested and lipids were isolated and analyzed as previously described6,53. Briefly, cells were homogenized with a microtip sonicator in 250 μL ice cold methanol with 0.01% butylated hydroxyltoluene (BHT), then transferred to glass tubes containing 850 μL of cold methyl-tert-butyl ether (MTBE) and vortexed for 30 seconds. Samples were then incubated on a shaker at 4 °C for 2 hours. 200 μL of cold water was added, and they were and incubated on ice for 20 min before centrifugation at 3,000 rpm for 20 min at 4 °C. The organic layer was collected and dried under a stream of nitrogen gas on ice. Next, the samples were reconstituted in a solution of 2-propanol/acetonitrile/water (4:3:1, v/v/v) containing a splashlipidomix standard (Avanti Polar Lipids Inc.). Ultra-performance liquid chromatography was then performed at 55°C on Acquity UPLC HSS T3 Column, (1.8 μm, 2.1 mm X 100 mm) over a 20 min gradient elution. Mobile phase A was acetonitrile/water (60:40, v/v) and mobile phase B was 2-propanol/acetonitrile/water (85:10:5, v/v/v), both containing 10 mM ammonium acetate and 0.1% acetic acid. After injection, the gradient was held at 40% mobile phase B for 2 min. For the next 12 min, the gradient was ramped in a linear fashion to 100% B and held at this composition for 3 min. The eluent composition returned to the initial condition in 1 min, and the column was re-equilibrated for an additional 1 min before the next injection was conducted.The flow rate was 0.4 mL/min and injection volumes were 6 μL. The Synapt G2 mass spectrometer (Waters) was operated in both positive and negative ESI modes. All raw data files were converted to netCDF format using DataBridge tool implemented in MassLynx software (Waters, version 4.1). They were then subjected to peak-picking, retention time alignment, and grouping using XCMS package (version 3.2.0) in R (version 3.4.4) environment 54,R 55. After retention time alignment and filling missing peaks, an output data frame was generated containing the list of time-aligned detected features (m/z and retention time) and the relative signal intensity (area of the chromatographic peak) in each sample. All the extracted features were normalized to measured protein concentrations measured by BCA assay (Pierce). Structural assignment and structural characterization of significant lipid features were initially obtained by searching monoisotopic masses against the available online databases such as METLIN, Lipid MAPS, and HMDB with a mass tolerance of 5 ppm and by confirming fragmentation patterns of HDMSE data in MSE data viewer (Version 1.3, Waters Corp., MA, USA).
Isolation of Mitochondrial and ER fractions
Samples were subject to fractionation utilizing commercially-available mitochondrial isolation (Thermo Fisher Scientific, #89874) and endoplasmic reticulum isolation (Millipore-Sigma, # ER0100-1KT) kits for each respective fraction.
Briefly, for mitochondrial fractionation, cells were spun down at 850g for 2 minutes, resuspended in 1.6 mL of reagent A, vortexed for 5 seconds and incubated on ice for 2 minutes. Cells were homogenized in a 7 mL dounce homogenizer (Bellco Glass), 1.6 mL of reagent C was added, and suspension was centrifuged at 700g for 10 minutes at 4 °C. Supernatant was then transferred to new tubes and spun down for 3,500g for 15 minutes at 4 °C. After spin down, supernatant was discarded and pellet resuspended in 500 μL of reagent C, and centrifuged at 12,000g for 5 min at 4 °C. The resulting mitochondrial fraction pellet was isolated, flash frozen, and maintained at − 80°C until use.
For ER fractionation, cells were centrifuged at 600g for 5 min at 4 °C and supernatant discarded. Cells were washed with 10 volumes of PBS and pelleted again under identical conditions. Cells were resuspended in 3 mL hypotonic extraction buffer, and incubated on ice for 20 minutes. Cells were then centrifuged at 600g for 5 minutes at 4 °C, supernatant discarded, and pellet was resuspended in 2 mL of isotonic extraction buffer. Suspension was homogenized in 7 mL dounce homogenizer, and homogenate was centrifuged at 1,000g for 10 minutes at 4 °C.
The central supernatant above the pellet but bellow the thin lipid layer on top was isolated by slowly puncturing the top lipid layer, and 1.5 mL of the central supernatant layer was transferred to a new tube and centrifuged again at 12,000g for 15 minutes at 4 °C. Again 1 mL of the central layer was transferred to a new tube, and then to a flat bottom 250 mL glass beaker with a stir bar inside. 8 mM calcium chloride solution was added drop wise while stirring to the beaker on ice, and once added, solution was stirred for an additional 15 minutes. Solution was then subject to centrifugation at 8,000g for 10 minutes at 4 °C, the supernatant siphoned off, and the pellet flash frozen and stored at − 80°C until use.
Cloning of overexpression retrovirus plasmids
NEBuilder HiFi DNA Assembly Cloning Kit (New England Biolabs) was used to clone inserts of interest into retroviral expression plasmid pMRX-IP-GFP (Gift of Noboru Mizushima) 45. Gibson assembly primers for genes of interest were designed (See Supplementary Table 1), and inserts were amplified by PCR using Phusion High-Fidelity Polymerase (New England Biolabs) on T100 Thermal Cycler (Bio-Rad). For ACSL4 and FUNDC1, insert amplification was performed with pCMV-Entry-ACSL4 (Origene) and pcDNA4/TO/Myc-His-FUNDC1 (Gift of Quan Chen) respectively, and pMRX-IP-GFP-Plaat3 (PLA2G16) was then digested using BamHI and XhoI in CutSmart Buffer (New England Biolabs). To introduce the cytochrome b5 sequence into pMRX-IP-GFP-PLA2G16, two inserts were made using long primers to introduce the new sequence in, resulting in a three-piece assembly that required digesting the vector with BamHI and BsiWI. For PLA2G16-cyb5, the pMRX-IP-GFP-PLA2G16 was used as template and vector for digestion. For FUNDC1-cyb5, the pMRX-IP-GFP-FUNDC1 was used as template, and the same primers as PLA2G16 were used with exception of FUNDC1-cyb5 R1 substituted for PLA2G16-cyb5 R1. To make the pMRX-IP-GFP control plasmid, the three GFP primers in the table were used along with PLA2G16-cyb5 R2 to amplify the two inserts from pMRX-IP-GFP-PLA2G16, and vector was cut with HindIII and BsiWI. To make pMRX-IP-GFP-cyb5, pMRX-IP-GFP-PLA2G16-cyb5 was amplified with GFP-cyb5 F and PLA2G16-cyb5 R2, and pMRX-IP-GFP was digested with BamHI and BsiWI. To make the N terminus cyb5 tagged FUNDC1 plasmid, the FUNDC1-cyb5 primers were used with GFP F1 and PLA2G16-cyb5 R2, with pMRX-IP-GFP-FUNDC1 and pMRX-IP-GFP-PLA2G16-cyb5 as templates, and with pMRX-IP-GFP digested with HindIII and BsiWI. All PCR and digestion products were gel purified using the Zymoclean Gel Recovery Kit. The HiFi kit was then used according to manufacturer’s instructions, and the reaction was incubated at 50°C for 1 hour. The reactions were then transformed into Stable (New England Biolabs) or Stbl3 (Invitrogen) cells, and plated on LB/Agar plates. Resulting colonies were grown up with QIAprep Spin Miniprep Kit (Qiagen) and sent to Genewiz for Sanger sequencing. The primers used for these experiments are found in Supplementary Table 1.
Generation of overexpression and stable knockdown cell lines by viral infection
For overexpression cell lines, genes were inserted into pMRX-IPU-GFP as described above. For this plasmid, the pUMVC gag-pol plasmid and pVSV-G envelope plasmid were used 56. For knockdown cell lines, glycerol stocks of Mission shRNA knockdown sequences in pLKO.1-puro were purchased from Sigma-Aldrich (Supplementary Table 3). For this plasmid, the psPAX2 gag-pol plasmid and pVSV-G envelope plasmid were used.
To produce virus, 400,000 HEK293T cells/well were seeded in 2.5 mL in 6 well plates and incubated overnight at 37°C/5% CO2. To 250 μL of OptiMEM (Gibco), 1.25 μg of knockdown or overexpression plasmid, 1.25 μg of gag-pol plasmid, and 0.156 μg of VSV-G plasmid was added. Next, 8 μL of TransIT LT1 (Mirus) was added, and this solution was mixed and incubated at room temperature for 15 to 30 minutes. The solution was then added dropwise to HEK293T cells, and incubated overnight at 37°C/5% CO2. Transfection medium was replaced with 5 μL fresh medium, and cells were incubated at 32°C/5% CO2 for 24 hours. Viral supernatant was harvested, 250 μL 1 M HEPES buffer (Gibco) was added, and the supernatant was filtered through at 0.45-micron syringe filter. Aliquots were then either frozen and stored at 80°C or applied directly to cells of interest.
To infect cells, viral supernatant with a 1:2000 dilution of 10 mg/mL polybrene (Santa Cruz Biotechnology) was applied to cells of interest seeded in 6 well plates, and incubated overnight at 37°C/5% CO2. Fresh media was then applied and cells were incubated 24 hours. Selection media containing 1 μg/mL puromycin was then added, and selection/expansion took place. Knockdowns/overexpressions were confirmed by qPCR or western blot as described below.
qPCR
Cells were harvested, washed with PBS, and lysed using QIAshredder (Qiagen). RNEasy kit (Qiagen) was used to isolate RNA, and RT-PCR was performed using MultiScribe Reverse Transcriptase (Invitrogen) on T100 Thermal Cycler (Bio-Rad). qPCR reactions were then performed in triplicate using PowerSYBRGreen PCR Master Mix (Applied Biosystems) on ViiA 7 Real-Time PCR instrument (Thermo Fischer). TBP was used as an internal reference. Differences in mRNA levels compared with TBP were computed between vehicle and experimental groups using the DDCt method. The primers used in the study are found in Supplementary Table 2.
Western Blotting
Cells were harvested, washed with PBS, and incubated in RIPA buffer containing cOmplete, Mini Protease Inhibitor Tablets (Sigma-Aldrich) on ice for 30 minutes. These were then centrifuged at 14,000 x g for 15 minutes at 4°C. Protein concentrations of supernatants were determined using BCA Protein Assay Kit (Pierce), and concentrations were normalized and diluted with 4x SDS running buffer (Invitrogen). Nupage Novex 4-12% Bis-tris Midi protein gel (Invitrogen) was loaded at run in MES buffer (Invitrogen) for 30 minutes at 200 V. Proteins were then transferred to PVDF membrane (Invitrogen) using the iBlot2 machine. Membrane was washed in PBS, and then blocked overnight at 4°C in Intercept Blocking Buffer (LICOR). Membrane was then incubated overnight at 4°C with primary antibodies in a 1:1 solution of blocking buffer and PBST (PBS + 0.1% Tween 20). Membrane was then washed three times with PBST, incubated for 1 hour at room temperature with secondary antibodies in 1:1 solution of blocking buffer and PBST, and washed three more times with PBST. It was then imaged with ChemiDoc MP Imaging System (Bio-Rad). Antibodies used included Mouse monoclonal anti-ACSL4 (F-4) (Santa Cruz Biotechnology) 1:500, Rabbit monoclonal anti-Pan-Actin (D18C11) (Cell Signaling Technology) 1:1000, Mouse monoclonal anti-β-Actin (8H10D10) (Cell Signaling Technology) 1:1000, Rabbit monoclonal anti-Cytochrome c (D18C7) (Cell Signaling Technology) 1:1000, Rabbit Monoclonal anit-PDI (C81H6) (Cell Signaling Technology) 1:1000, IRDye Goat Anti-Mouse 680 1:5000 and IRDye Goat Anti-Rabbit 800 antibodies (LICOR) 1:5000.
For synthetic methods, see supplementary note.
Statistical Analysis and Reproducibility
Statistical analysis was performed in Prism using ANOVA with multiple comparison control or two-sided unpaired t test with 95% confidence; GraphPad Prism (GP) P value style of 0.1234 (ns), 0.0332 (*), 0.0021 (**), 0.0002 (***), <0.0001 (****). All SRS and confocal fluorescence images are representative. SRS imaging was performed with at least two independent experiments with at least three images. Confocal fluorescence imaging was performed at least twice for each FINO2 analog with a minimum of three images per experiment. Immunofluorescence imaging was performed twice with a minimum of three images per experiment. C11 BODIPY imaging of ER and PM was repeated three times with at least five images per condition. C11 BODIPY imaging of ER and mitochondria was repeated twice with at least two images per condition.
Extended Data
Extended Data Fig. 1. Dose-response of D-PUFAs, peroxisome and mitochondrial staining of D-PUFA-treated cells, and mitochondrial/ER quantification of D-PUFAs.
A. Dose-response curves of HT-1080 cells pretreated with varying concentrations of D-PUFAs and then treated with FINs. Data are plotted as mean ± SEM, n=3 biologically independent samples. B. HT1080 cells treated for 24 hours with 20 μM ARA-d6 and CellLight Peroxisome-GFP, and imaged by fluorescence and SRS imaging. C. HT-1080 cells treated for 24 hours with 20 μM DHA-d10, and then stained with MitoTracker Red CMXRos and imaged by fluorescence and SRS imaging. D. High resolution SRS imaging of HT-1080 cells treated for 24 hours with 20 μM DHA-d10 with DGAT inhibitors PF-06424439 (1 μM) and A922500 (1 μM), then stained with MitoTracker Red CMXRos and ERTracker Green and imaged by fluorescence and SRS imaging. E. Quantification of arachidonic acid-d11 in mitochondrial and ER fractions isolated from HT1080 cells treated at 20 μM for 24 hours. Values determined by high resolution mass spectrometry and plotted as normalized to internal standard. Data are plotted as mean of 3 biological replicates ± SEM. F. Western blotting of mitochondrial and ER fractions stained for PDI as ER marker and Cytochrome C as mitochondrial marker, representative of four experiments. Results indicate no mitochondrial contamination of ER fraction, but indicate ER contamination of mitochondrial fraction.
Extended Data Fig. 2. Knockdown of PUFA-related genes shows some impact on D-PUFA potency, but no observable decrease in incorporation.
A. Dose-response curves of stable non-targeting (NT) or ACSL knockdown HT-1080 cells pretreated with EtOH or D-PUFAs and then treated with RSL3. Data are represented as mean ± SEM, n=3. B. Dose-response curves of stable nontargeting (NT) or AGPAT3 knockdown HT-1080 cells pretreated with EtOH or D-PUFAs and then treated with RSL3 or IKE. Data are represented as mean ± SEM, n=3. C. qPCR data of stable shRNA knockdowns. Data are represented as mean ± SD of three technical replicates. D. SRS images of shNT, shACSL5, and shAGPAT3 HT-1080 cells treated with DHA-d10 (10 μM) (left), and quantification of their signal intensity (right), Data are plotted as mean ± SEM, n=3.
Extended Data Fig. 3. Thimerosal, Miltefosine, and N-Ethyl Maleimide do not impact anti-ferroptotic potency of D-PUFAs, and knockdown of ER-phagy related genes SEC62, RTN3, and FAM134B did not result in apparently altered ER area.
A. Dose-response curves of HT-1080 cells treated with vehicle (water) or 400 nM thimerosal, and subsequently treated with vehicle (EtOH) or PUFAs 4 hours later, followed by varying concentrations of IKE and RSL3 24 hours later. Data are represented as mean ± SEM, n=3. B. Dose-response curves of HT-1080 cells treated with vehicle (water) or 7.5 μM miltefosine, and subsequently treated with vehicle (EtOH) or PUFAs 4 hours later, followed by varying concentrations of RSL3 24 hours later. Data are represented as mean ± SEM, n=3. C. Dose-response curves of HT-1080 cells treated with D-PUFAs and either pretreated, cotreated, or post-treated with vehicle (EtOH) or 4.5 μM NME, and subsequently treated with varying concentrations IKE and RSL3. In the post-treatment experiments, media containing PUFAs was removed before NME was added. Data are represented as mean ± SEM, n=3. D. Dose-response curves of stable shNT, shSEC62, shRTN3, and shFAM134B HT-1080 cells treated with varying doses of IKE, RSL3, FIN56, and FINO2. Data are represented as mean ± SEM, n=3. E. ER area of ER-Phagy knockdown cell lines as compared to control. Cells were stained with ERTracker Blue-White, imaged with confocal microscopy, and their ER areas were measured using the CellProfiler software. Individual ER areas are shown for each cell, as well as the mean ± SD. Sample sizes (number of cells) are as follows: shNT n=123, shFAM134B n=98, shRTN3 n=60, shSEC62 n=26. F. qPCR analysis of knockdowns of ER-phagy genes in HT-1080 cells. Data are represented as mean of 3 technical replicates ± SD.
Extended Data Fig. 4. Overexpression and targeting of organelle-phagy related genes did not result in apparently altered ER area.
A. Confocal fluorescence images of HT-1080 cells overexpressing GFP, GFP-PLA2G16, GFP-FUNDC1 (as well as the cytoplasmic N-terminal FUNDC1 sequence), with and without c terminal- cytochrome b5 ER targeting signals, stained with ERTracker Red. GFP channels show protein distribution as all overexpressed proteins are tagged with GFP. Representative images of at least 6 images per sample are shown. B. Dose-response curves of overexpression cell lines with varying doses of RSL3. Data are represented as mean ± SEM, n=3 biologically independent samples. C. ER area overexpression cell lines as compared to control. Cells were stained with ERTracker Red, imaged with confocal microscopy, and their ER areas were measured using the CellProfiler software. Violin quartile plots are shown. Sample sizes (number of cells) are as follows: GFP n=358, GFP-cyb5 n=478, PLA2G16 n=353, PLA2G16-cyb5 n=292, FUNDC1 n=354, FUNDC1-cyb5 n=212, Nterm-FUNDC1-cyb5 n=399.
Extended Data Fig. 5. Subcellular localization and effect on ferroptosis of myristic acid and cholesterol, overexpression and distribution of ACSL4.
A. Structure and SRS image of myristic acid-d27 (20 μM) in HT-1080 cells. B. Structure and SRS image of cholesterol-d6 (20 μM) in HT-1080 cells. C. Fluorescence and confocal imaging of cholesterol-d6 to evaluate its subcellular localization. D. Solution Raman spectra of the FAs and cholesterol used in these experiments. E. Dose-response curves of HT-1080 cells pretreated with either MA-d27 or cholesterol-d6 (20 μM) followed by varying concentrations of RSL3. Data are represented as mean ± SEM, n=3. F. Western blot of HT-1080 cells overexpressing GFP (control) or GFP-ACSL4. ACSL4 antibody was used, with actin as a control. G. Immunofluorescence staining of HT1080 cells labeled for ACSL4 (anti-ACSL4 antibody), ER (anti-calnexin antibody), and nucleus (DAPI). Individual channels and overlay is shown. H. Western blotting of mitochondrial and ER HT1080 fractions stained for ACSL4 PDI (ER), and Cytochrome C (mitochondria), indicating presence in both fractions, representative of two experiments.
Extended Data Fig. 6. FINO2-0 and FINO2-2 accumulate in the ER, and FINO2-1/FINO2-3/FINO2-4 do not accumulate in the plasma membrane.
A. Structure of FINO2-0. B. Dose-response curve of HT-1080 cells treated with FINO2-0 ± fer-1. Data are represented as mean ± SEM, n=3. C. Confocal fluorescence images of HT-1080 cells treated for 3 hours with 3 μM FINO2-1 alone or with 3 μM fer-1. D. Confocal fluorescence image of HT-1080 cells treated with 3 μM FINO2-0. F. Confocal fluorescence imaging of HT-1080 cells treated with FINO2-1 (3 μM) and fer-1 (3 μM) for 3 hours, co-stained with BODIPY TR ceramide. G. Structure of FINO2-2. H. Dose-response curve of HT-1080 cells treated with FINO2-2 ± fer-1. Data are represented as mean ± SEM, n=3. I. SRS and fluorescence imaging of HT-1080 cells treated with 20 μM FINO2-2 and 2 μM fer-1, and stained with Nile Red and Lysotracker green. J. Confocal fluorescence image of HT-1080 cells treated with 3 μM FINO2-1 and 3 μM fer-1, and costained with CellMask Deep Red. K. Confocal fluorescence image of HT-1080 cells treated with 3 μM FINO2-3 or 3 μM FINO2-4, and 3 μM fer-1, and co-stained with CellMask Deep Red.
Extended Data Fig. 7. Analogs of FINO2 redistribute throughout the cell.
A. Structures of analogs of FINO2. B. Confocal fluorescence images of HT-1080 cells treated with FINO2-5 (3 μM) or FINO2-6 (3 μM) and fer-1 (3 μM), and co-stained with LysoTracker Red. C. Dose-response curves of HT-1080 cells treated with fixed concentrations of FINO2 analogs (10 μM) and varying concentrations of ferroptosis inhibitors. Lysosome-directed ferrostatin previously published by Gaschler et al.27 Data are represented as mean ± SEM, n=3. D. Confocal fluorescence image of HT-1080 cells treated with FINO2-7 (3 μM) and fer-1 (3 μM). E. Dose-response curves of HT-1080 cells comparing treatment with FINO2-1 and FINO2-3 or FINO2-4. Data are represented as mean ± SEM, n=3.
Extended Data Fig. 8. Ferroptosis induced by DHODH inhibition is amplified by ER peroxidation, ferroptosis induced by IKE results in ER membrane peroxidation followed by PM peroxidation, early perinuclear lipid peroxidation occurs in the ER.
A. Brequinar (BQR) induces ferroptosis in HT1080s as rescued by fer-1, and cotreatment with BQR (500 μM) increases sensitivity to RSL3 in HT1080s. Data are represented as mean ± SEM, n=3. B. Dose-response curve of HT1080 cells cotreated with 1 μM of FINO2-1, FINO2-3, or FINO2-4. Data are represented as mean ± SEM, n=3. C. HT-1080 cells treated with DMSO or IKE (10 μM) for 6 hours and stained with C11 BODIPY (oxidized and reduced overlay), CellMask Deep Red, and ERTracker Blue-White. D. HT-1080 cells treated with DMSO or IKE (10 μM) for 10 hours and stained with C11 BODIPY (oxidized and reduced overlay), CellMask Deep Red, and ERTracker Blue-White. E. Correlation (Manders coefficient) of C11 BODIPY oxidized signal with ERTracker Blue-White or MitoTracker Deep Red in HT1080 cells treated with either RSL3, IKE, FINO2, or FIN56 at designated timepoints. Data are represented as mean ± SEM, each individual point represents an image of multiple cells. Number of images for each condition are RSL3 2 hour (n=3), 5 hour (n=2); IKE 2 hour (n=7), 5 hour (n=5), FINO2 2.5 hour (n=6), 4.5 hour (n=9), FIN56 2 hour (n=6), 4 hour (n=5), 5 hour (n=2). Ordinary one way ANOVA with Tukey’s test for multiple comparisons was used with p values of: RSL3 (0.0016, 0.6120), IKE (0.0023, 0.1279), FINO2 (<0.0001, <0.0001), FIN56 (0.0034, 0.0005, >0.9999). F. Correlation (Manders coefficient) of C11 BODIPY oxidized signal with ERTracker Blue-White or MitoTracker Deep Red in HT1080 cells treated with either RSL3 (1 μM), BQR (1 mM) or both at designated timepoints. Data are represented as mean ± SEM, each individual point represents an image of multiple cells. Number of images for each condition are RSL3 1.5 hour (n=4), 2 hour (n=2); BQR 2 hour (n=3), 2.5 hour (n=3); RSL3 + BQR 1.5 hour (n=2), 2 hour (n=2). Two-sided unpaired t test was used with p values of: RSL3 (<0.0001, 0.0178), BQR (0.0006, 0.1011), RSL3 + BQR (0.0117, 0.2027). For all panels, GraphPad Prism (GP) P value style of 0.1234 (ns), 0.0332 (*), 0.0021 (**), 0.0002 (***), <0.0001 (****).
Supplementary Material
Acknowledgments
A.N.K. was funded by NIH NRSA grant F30AG066272. The research of B.R.S. was supported by National Cancer Institute (NCI) grant P01CA87497 and R35CA209896. The research of K.A.W. was supported by the National Institute of General Medical Sciences of the National Institutes of Health (R01GM118730). The research of W.M. was supported by the National Institute of Biomedical Imaging and Bioengineering of the National Institutes of Health (R01 EB029523)
Footnotes
Competing Interests Statement
B.R.S. is an inventor on patents and patent applications involving ferroptosis, co-founded and serves as a consultant to Inzen Therapeutics, ProJenX, Inc., and Exarta Therapeutics, and serves as a consultant to Weatherwax Biotechnologies Corporation and Akin Gump Strauss Hauer & Feld LLP, and receives sponsored research support from Sumitomo Dainippon Pharma Oncology. M.S.S. is the Chief Scientific Officer of Retrotrope, Inc. The remaining authors declare no competing interests.
Data Availability
Lipidomics data are available at Academic Commons at https://doi.org/10.7916/rphv-v394. All other data, including statistical data and blots are available as Source Data and at https://doi.org/10.7916/hggm-7r90.
References
- 1.Li J et al. Ferroptosis: past, present and future. Cell Death Dis. 11, (2020). [DOI] [PMC free article] [PubMed] [Google Scholar]
- 2.Liang C, Zhang X, Yang M & Dong X Recent Progress in Ferroptosis Inducers for Cancer Therapy. Adv. Mater 31, 1–25 (2019). [DOI] [PubMed] [Google Scholar]
- 3.Su Y et al. Ferroptosis, a novel pharmacological mechanism of anti-cancer drugs. Cancer Lett. 483, 127–136 (2020). [DOI] [PubMed] [Google Scholar]
- 4.Reichert CO et al. Ferroptosis mechanisms involved in neurodegenerative diseases. Int. J. Mol. Sci 21, 1–27 (2020). [DOI] [PMC free article] [PubMed] [Google Scholar]
- 5.Ye LF et al. Radiation-Induced Lipid Peroxidation Triggers Ferroptosis and Synergizes with Ferroptosis Inducers. ACS Chem. Biol 15, 469–484 (2020). [DOI] [PMC free article] [PubMed] [Google Scholar]
- 6.Zhang Y et al. Imidazole Ketone Erastin Induces Ferroptosis and Slows Tumor Growth in a Mouse Lymphoma Model. Cell Chem. Biol 26, 623–633.e9 (2019). [DOI] [PMC free article] [PubMed] [Google Scholar]
- 7.Badgley MA et al. Cysteine depletion induces pancreatic tumor ferroptosis in mice. Science (80-. ). 368, 85–89 (2020). [DOI] [PMC free article] [PubMed] [Google Scholar]
- 8.Louandre C et al. Iron-dependent cell death of hepatocellular carcinoma cells exposed to sorafenib. Int. J. Cancer 133, 1732–1742 (2013). [DOI] [PubMed] [Google Scholar]
- 9.Lachaier E et al. Sorafenib induces ferroptosis in human cancer cell lines originating from different solid tumors. Anticancer Res. 34, 6417–6422 (2014). [PubMed] [Google Scholar]
- 10.Wang Q et al. GSTZ1 sensitizes hepatocellular carcinoma cells to sorafenib-induced ferroptosis via inhibition of NRF2/GPX4 axis. Cell Death Dis. 12, (2021). [DOI] [PMC free article] [PubMed] [Google Scholar]
- 11.Eling N, Reuter L, Hazin J, Hamacher-Brady A & Brady NR Identification of artesunate as a specific activator of ferroptosis in pancreatic cancer cells. Oncoscience 2, 517–532 (2015). [DOI] [PMC free article] [PubMed] [Google Scholar]
- 12.Friedmann Angeli JP et al. Inactivation of the ferroptosis regulator Gpx4 triggers acute renal failure in mice. Nat. Cell Biol 16, 1180–1191 (2014). [DOI] [PMC free article] [PubMed] [Google Scholar]
- 13.Li Q et al. Inhibition of neuronal ferroptosis protects hemorrhagic brain. JCI insight 2, e90777 (2017). [DOI] [PMC free article] [PubMed] [Google Scholar]
- 14.Liu P et al. Ferrostatin-1 alleviates lipopolysaccharide-induced acute lung injury via inhibiting ferroptosis. Cell. Mol. Biol. Lett 25, 1–14 (2020). [DOI] [PMC free article] [PubMed] [Google Scholar]
- 15.Feng Y, Madungwe NB, Imam Aliagan AD, Tombo N & Bopassa JC Liproxstatin-1 protects the mouse myocardium against ischemia/reperfusion injury by decreasing VDAC1 levels and restoring GPX4 levels. Biochem. Biophys. Res. Commun 520, 606–611 (2019). [DOI] [PMC free article] [PubMed] [Google Scholar]
- 16.Cao Y et al. Selective Ferroptosis Inhibitor Liproxstatin-1 Attenuates Neurological Deficits and Neuroinflammation After Subarachnoid Hemorrhage. Neurosci. Bull 37, 535–549 (2021). [DOI] [PMC free article] [PubMed] [Google Scholar]
- 17.Hatami A et al. Deuterium-reinforced linoleic acid lowers lipid peroxidation and mitigates cognitive impairment in the Q140 knock in mouse model of Huntington’s disease. FEBS J. 285, 3002–3012 (2018). [DOI] [PubMed] [Google Scholar]
- 18.Elharram A et al. Deuterium-reinforced polyunsaturated fatty acids improve cognition in a mouse model of sporadic Alzheimer’s disease. FEBS J. 284, 4083–4095 (2017). [DOI] [PMC free article] [PubMed] [Google Scholar]
- 19.Dixon SJ et al. Ferroptosis: An iron-dependent form of nonapoptotic cell death. Cell 149, 1060–1072 (2012). [DOI] [PMC free article] [PubMed] [Google Scholar]
- 20.Kagan VE et al. Oxidized arachidonic and adrenic PEs navigate cells to ferroptosis. Nat. Chem. Biol 13, 81–90 (2017). [DOI] [PMC free article] [PubMed] [Google Scholar]
- 21.Yang WS et al. Peroxidation of polyunsaturated fatty acids by lipoxygenases drives ferroptosis. Proc. Natl. Acad. Sci. U. S. A 113, E4966–E4975 (2016). [DOI] [PMC free article] [PubMed] [Google Scholar]
- 22.Yang WS et al. Regulation of ferroptotic cancer cell death by GPX4. Cell (2014) doi: 10.1016/j.cell.2013.12.010. [DOI] [PMC free article] [PubMed] [Google Scholar]
- 23.Shimada K et al. Global survey of cell death mechanisms reveals metabolic regulation of ferroptosis. Nat. Chem. Biol 12, 497–503 (2016). [DOI] [PMC free article] [PubMed] [Google Scholar]
- 24.Gaschler MM et al. FINO2 initiates ferroptosis through GPX4 inactivation and iron oxidation. Nat. Chem. Biol 14, 507–515 (2018). [DOI] [PMC free article] [PubMed] [Google Scholar]
- 25.Wenzel SE et al. PEBP1 Wardens Ferroptosis by Enabling Lipoxygenase Generation of Lipid Death Signals. Cell 171, 628–641.e26 (2017). [DOI] [PMC free article] [PubMed] [Google Scholar]
- 26.Doll S et al. ACSL4 dictates ferroptosis sensitivity by shaping cellular lipid composition. Nat. Chem. Biol 13, 91–98 (2017). [DOI] [PMC free article] [PubMed] [Google Scholar]
- 27.Gaschler MM et al. Determination of the Subcellular Localization and Mechanism of Action of Ferrostatins in Suppressing Ferroptosis. ACS Chem. Biol 13, 1013–1020 (2018). [DOI] [PMC free article] [PubMed] [Google Scholar]
- 28.Gao M et al. Role of Mitochondria in Ferroptosis. Mol. Cell 73, 354–363.e3 (2019). [DOI] [PMC free article] [PubMed] [Google Scholar]
- 29.Mao C et al. DHODH-mediated ferroptosis defence is a targetable vulnerability in cancer. Nature 593, 586–590 (2021). [DOI] [PMC free article] [PubMed] [Google Scholar]
- 30.Magtanong L et al. Exogenous Monounsaturated Fatty Acids Promote a Ferroptosis-Resistant Cell State. Cell Chem. Biol 26, 420–432 (2019). [DOI] [PMC free article] [PubMed] [Google Scholar]
- 31.Bersuker K et al. The CoQ oxidoreductase FSP1 acts parallel to GPX4 to inhibit ferroptosis. Nature 575, 688–692 (2019). [DOI] [PMC free article] [PubMed] [Google Scholar]
- 32.Doll S et al. FSP1 is a glutathione-independent ferroptosis suppressor. Nature 575, (2019). [DOI] [PubMed] [Google Scholar]
- 33.Shen Y, Hu F & Min W Raman Imaging of Small Biomolecules. Annu. Rev. Biophys 48, 347–369 (2019). [DOI] [PubMed] [Google Scholar]
- 34.Hu F, Shi L & Min W Biological imaging of chemical bonds by stimulated Raman scattering microscopy. Nat. Methods 16, 830–842 (2019). [DOI] [PubMed] [Google Scholar]
- 35.Hill S et al. Small amounts of isotope-reinforced polyunsaturated fatty acids suppress lipid autoxidation. Free Radic. Biol. Med 53, 893–906 (2012). [DOI] [PMC free article] [PubMed] [Google Scholar]
- 36.Firsov AM et al. Threshold Protective Effect of Deuterated Polyunsaturated Fatty Acids on Peroxidation of Lipid Bilayers. FEBS J. 1–19 (2019) doi: 10.1111/febs.14807. [DOI] [PubMed] [Google Scholar]
- 37.Shah R, Shchepinov MS & Pratt DA Resolving the Role of Lipoxygenases in the Initiation and Execution of Ferroptosis. ACS Cent. Sci 4, 387–396 (2018). [DOI] [PMC free article] [PubMed] [Google Scholar]
- 38.Raefsky SM et al. Deuterated polyunsaturated fatty acids reduce brain lipid peroxidation and hippocampal amyloid β-peptide levels, without discernable behavioral effects in an APP/PS1 mutant transgenic mouse model of Alzheimer’s disease. Neurobiol. Aging 66, 165–176 (2018). [DOI] [PMC free article] [PubMed] [Google Scholar]
- 39.Zou Y et al. Plasticity of ether lipids promotes ferroptosis susceptibility and evasion. Nature 585, 603–608 (2020). [DOI] [PMC free article] [PubMed] [Google Scholar]
- 40.Cui W, Liu D, Gu W & Chu B Peroxisome-driven ether-linked phospholipids biosynthesis is essential for ferroptosis. Cell Death Differ. 20–24 (2021) doi: 10.1038/s41418-021-00769-0. [DOI] [PMC free article] [PubMed] [Google Scholar]
- 41.Gijón MA, Riekhof WR, Zarini S, Murphy RC & Voelker DR Lysophospholipid acyltransferases and arachidonate recycling in human neutrophils. J. Biol. Chem 283, 30235–30245 (2008). [DOI] [PMC free article] [PubMed] [Google Scholar]
- 42.Jiménez-Lápez JM, Ríos-Marco P, Marco C, Segovia JL & Carrasco MP Alterations in the homeostasis of phospholipids and cholesterol by antitumor alkylphospholipids. Lipids Health Dis. 9, 1–10 (2010). [DOI] [PMC free article] [PubMed] [Google Scholar]
- 43.Neve EPA, Boyer CS & Moldéus P N-ethyl maleimide stimulates arachidonic acid release through activation of the signal-responsive phospholipase A2 in endothelial cells. Biochem. Pharmacol 49, 57–63 (1995). [DOI] [PubMed] [Google Scholar]
- 44.Loi M, Fregno I, Guerra C & Molinari M Eat it right: ER-phagy and recovER-phagy. Biochem. Soc. Trans 46, 699–706 (2018). [DOI] [PMC free article] [PubMed] [Google Scholar]
- 45.Morishita H et al. Organelle degradation in the lens by PLAAT phospholipases. Nature 592, 634–638 (2021). [DOI] [PubMed] [Google Scholar]
- 46.Liu L et al. Mitochondrial outer-membrane protein FUNDC1 mediates hypoxia-induced mitophagy in mammalian cells. Nat. Cell Biol 14, 177–185 (2012). [DOI] [PubMed] [Google Scholar]
- 47.Dierge E et al. Peroxidation of n-3 and n-6 polyunsaturated fatty acids in the acidic tumor environment leads to ferroptosis-mediated anticancer effects. Cell Metab. 1–15 (2021) doi: 10.1016/j.cmet.2021.05.016. [DOI] [PubMed] [Google Scholar]
- 48.Dixon SJ et al. Pharmacological inhibition of cystine-glutamate exchange induces endoplasmic reticulum stress and ferroptosis. Elife 3, e02523 (2014). [DOI] [PMC free article] [PubMed] [Google Scholar]
- 49.Lee YS et al. Ferroptotic agent-induced endoplasmic reticulum stress response plays a pivotal role in the autophagic process outcome. J. Cell. Physiol 235, 6767–6778 (2020). [DOI] [PMC free article] [PubMed] [Google Scholar]
- 50.Riegman M et al. Ferroptosis occurs through an osmotic mechanism and propagates independently of cell rupture. Nat. Cell Biol 22, 1042–1048 (2020). [DOI] [PMC free article] [PubMed] [Google Scholar]
Methods References
- 51.Schindelin J et al. Fiji: An open-source platform for biological-image analysis. Nat. Methods 9, 676–682 (2012). [DOI] [PMC free article] [PubMed] [Google Scholar]
- 52.McQuin C et al. CellProfiler 3.0: Next-generation image processing for biology. PLoS Biol. 16, 1–17 (2018). [DOI] [PMC free article] [PubMed] [Google Scholar]
- 53.Kraft VAN et al. GTP Cyclohydrolase 1/Tetrahydrobiopterin Counteract Ferroptosis through Lipid Remodeling. ACS Cent. Sci 6, 41–53 (2020). [DOI] [PMC free article] [PubMed] [Google Scholar]
- 54.Smith CA, Want EJ, O’Maille G, Abagyan R & Siuzdak G XCMS: Processing mass spectrometry data for metabolite profiling using nonlinear peak alignment, matching, and identification. Anal. Chem 78, 779–787 (2006). [DOI] [PubMed] [Google Scholar]
- 55.Core Team, R. R: A language and environment for statistical computing. (2014). [Google Scholar]
- 56.Stewart SA et al. Lentivirus-delivered stable gene silencing by RNAi in primary cells. Rna 9, 493–501 (2003). [DOI] [PMC free article] [PubMed] [Google Scholar]
Associated Data
This section collects any data citations, data availability statements, or supplementary materials included in this article.
Supplementary Materials
Data Availability Statement
Lipidomics data are available at Academic Commons at https://doi.org/10.7916/rphv-v394. All other data, including statistical data and blots are available as Source Data and at https://doi.org/10.7916/hggm-7r90.


