

Abstract
Objective:
Identifying cerebrospinal fluid measures of the microtubule binding region of tau (MTBR-tau) species that reflect tau aggregation could provide fluid biomarkers that track Alzheimer disease related neurofibrillary tau pathological changes. We examined CSF MTBR-tau species in dominantly inherited Alzheimer disease (DIAD) mutation carriers to assess the association with AD biomarkers and clinical symptoms.
Methods:
Cross-sectional and longitudinal CSF from 229 DIAD mutation and 130 mutation non-carriers had sequential characterization of N-terminal/mid-domain phosphorylated tau (p-tau) followed by MTBR-tau species and tau-PET, other soluble tau and amyloid biomarkers, comprehensive clinical and cognitive assessments, and brain magnetic resonance imaging of atrophy.
Results:
CSF MTBR-tau species located within the putative “border” region and one species corresponding to the “core” region of aggregates in neurofibrillary tangles increased during the presymptomatic stage and decreased during the symptomatic stage. The “border” MTBR-tau species were associated with amyloid pathology and CSF p-tau; while the “core” MTBR-tau species were associated stronger with tau-PET and CSF measures of neurodegeneration. The ratio of the border to the core species provided a continuous measure of increasing amounts that tracked clinical progression and NFT.
Interpretation:
Changes in CSF soluble MTBR-tau species preceded the onset of dementia, tau tangle increase, and atrophy in DIAD. The ratio of 4R-specific MTBR-tau (border) to the NFT (core) MTBR-tau species corresponds to the pathology of NFT in DIAD and change with disease progression. The dynamics between different MTBR-tau species in the CSF may serve as a marker of tau-related disease progression and target engagement of anti-tau therapeutics.
Search Terms: Microtubule binding region of tau, Tau, autosomal dominant Alzheimer disease
Introduction
With the emphasis of tau-directed therapies for the treatment of Alzheimer’s disease (AD) and other neurodegenerative tauopathies, there is a need for reliable biomarkers to measure the spectrum of tau-related pathology and the response to therapies1–4. Recent methods monitoring soluble tau changes in cerebrospinal fluid (CSF) and plasma and brain tau aggregation by positron emission tomography (PET) have provided fundamental insights into AD progression 5–14. Currently available soluble tau-related biomarkers largely center on unmodified and phosphorylated species of tau (total-tau and p-tau). These measures are derived from the N-terminal or proline rich mid-domain of tau, and rarely include peptides within the microtubule binding region15. The association between soluble tau species and intracellular aggregates of tau (neurofibrillary tangles (NFT)) measured by tau PET is not clear14,16,17, as many of these tau species change in response to amyloid deposition in patients without measurable brain tau aggregation18. Further, increases in soluble tau and p-tau in CSF are seen in mouse models of amyloidosis, even in the absence of NFT-like pathology19 20. Together, these findings indicate that current soluble CSF tau-related measures do not clearly reflect NFT pathology.
There is a clear need for a reliable, fluid-based biomarkers of NFT related pathology, particularly as NFT burden is proposed to more closely track clinical symptoms8,21–25. Development of a soluble measure associated with tau aggregation will not only help us better understand the process of tau-related pathological changes in AD, but may also provide a more efficient pharmacodynamic marker for tau-specific therapies as well as anti-amyloid therapies. Recently, we reported the existence of microtubule binding region of tau (MTBR-tau) fragments in the CSF and potential utility of different CSF MTBR-tau species as AD biomarkers 26. These cross-sectional results showed that CSF tau is truncated at multiple sites, and specific MTBR-tau containing the repeat domain 2 (R2) and repeat domain 4 (R4) changed differentially in CSF based on stage of disease progression and were enriched in the insoluble tau deposits of AD brain samples in sporadic AD (sAD)26 27. Previously we have comprehensively assessed the longitudinal profile of multiple CSF p-tau species in dominantly inherited AD (DIAD)5 where presymptomatic disease can be more easily studied allowing us to identify a p-tau signature of disease progression. A similar approach focusing on the MTBR would provide an expanded and necessary view of the tauopathy of AD.
In this study, using the anti-MTBR-tau antibody, E2814, we applied a sensitive and specific immunoprecipitation (IP) and mass spectrometry (MS) method to quantify specific MTBR-tau peptides located in the tau domains forming the AD filament core and enriched in brain tau aggregates, (Fig 1). We sought to determine if specific MTBR-tau species within the putative “border” and “core” regions of NFTs in DIAD 1) have different changes in the presymptomatic and mildly symptomatic stage of disease; and, 2) if there are differences in MTBR-tau species in relation to amyloid-β (Aβ) plaques, NFT burden as measured by tau PET and post-mortem brain, as well as with relation to atrophy measured by MRI, clinical symptoms, and cognitive measures.
Figure 1. MTBR region of tau splicing isoforms and the evolution of soluble fragments with disease progression.
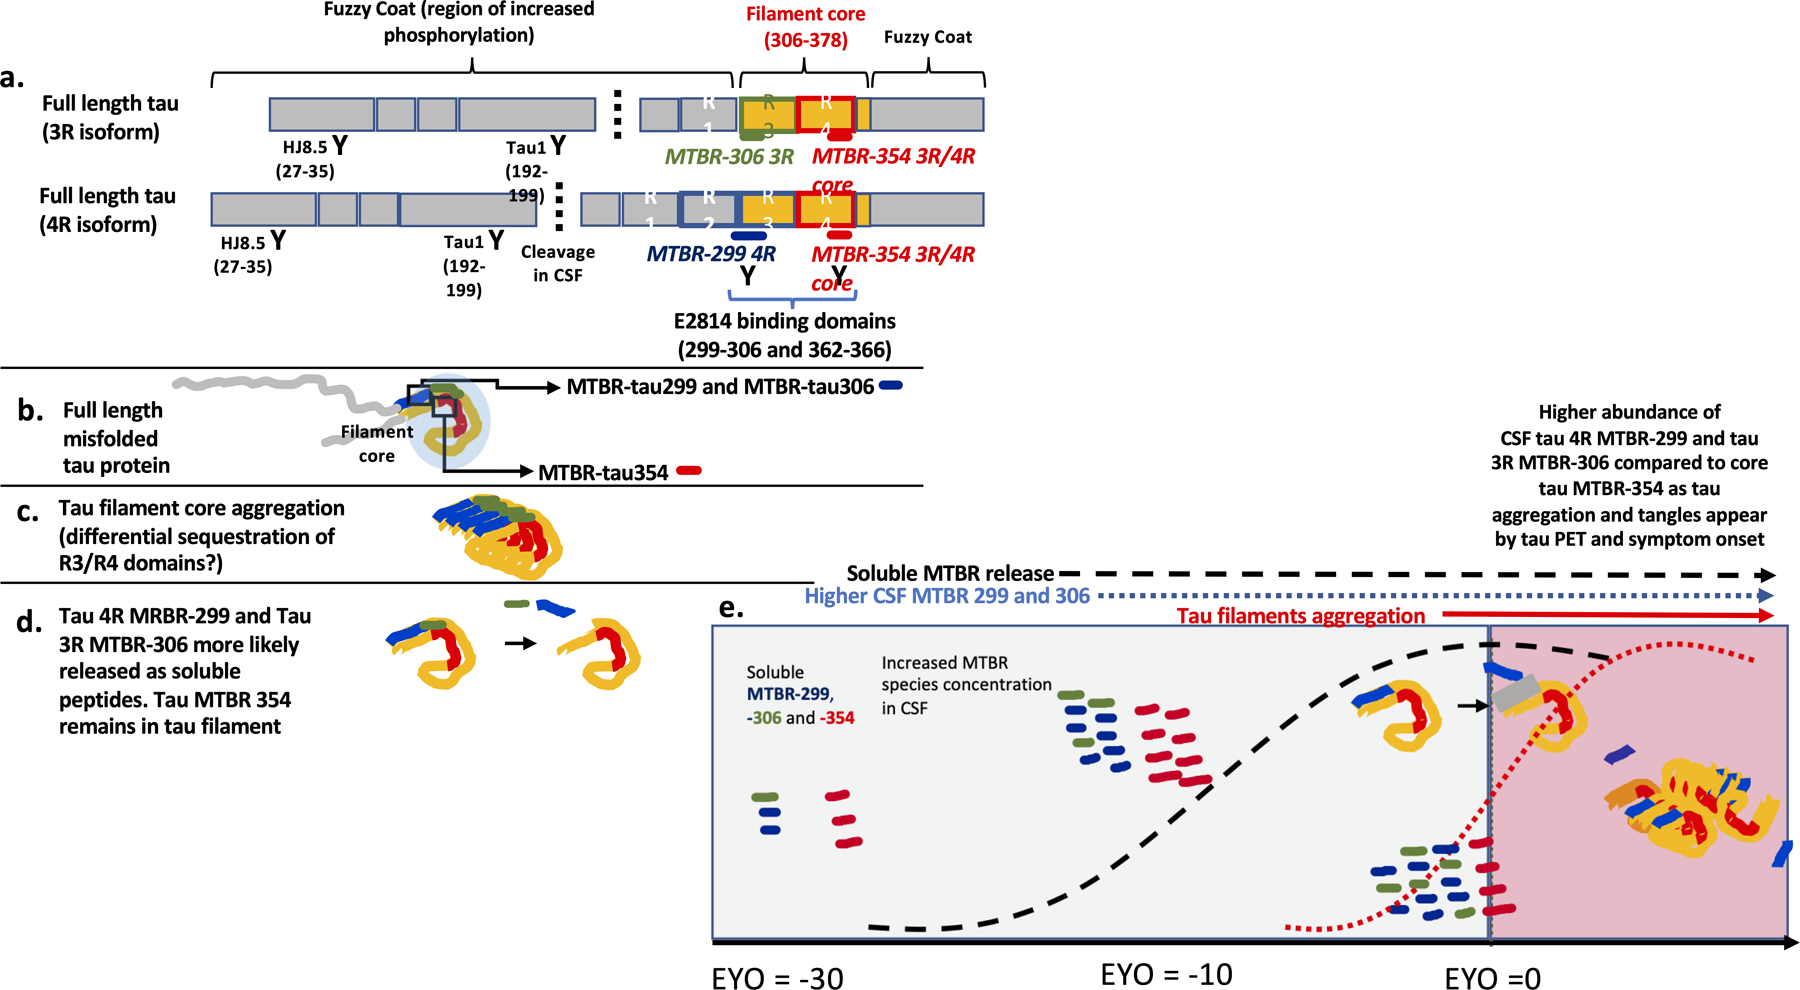
(a) Three repeat (3R) and four repeat (4R) tau splicing isoforms and the binding regions of HJ8.5, Tau1, and E2814 of the N-terminal, mid-domain, and MTBR repeats, respectively. The cleavage at mid-domain (around the residue 224) in CSF is also described. (b) distribution of E2814 targeted MTBR regions on the border and fold of the core of misfolded fibrillar tau of AD. (c) evolution of fibrillar aggregates demonstrating area of the core/fold with border (blue) and core (red). (d) proposed dynamic metabolism of NFT with the R2–3 (border) segments of the NFT having higher proportion of soluble fragments released to the extracellular space relative to the deep, core, sections of R4. (e) Soluble R2–3 (blue) and R4 (red) fragment changes with disease progression and relative to the development of Aβ-plaques (hashed black line) and NFT (red line); both fragments begin to increase with the Aβ-plaques pathology and, relative to maximal levels, begin to decline as NFT pathology begins to increase, with R4 (core) fragments decreasing greater than R2–3 fragments; gray shading represents primarily soluble phase of tau and pink shading representing aggregated phase of tau.
Methods
Study Design
Participants
Participants with at least 50% risk of inheriting an DIAD mutation from families with a confirmed genetic mutation in PSEN1, PSEN2 or APP were enrolled in the Dominantly Inherited Alzheimer Network study (DIAN, NIA U19 AG032438) (dian.wustl.edu; clinicaltrials.gov number NCT00869817)28. All procedures were approved by the Institutional Review Board (IRB) of Washington University and conformed to local IRB and Ethics Committees where the study was being performed. The presence or absence of a DIAD mutation was determined using PCR-based amplification of the appropriate exon followed by Sanger sequencing. At each study visit, participants underwent comprehensive clinical assessments, cognitive testing, neuroimaging, and CSF studies. The details of study structure and assessments can be found in prior publications28,29. Data was obtained from quality-controlled data (yearly quality assessments for irregular results and missing data from January 26, 2009 to June 30, 2017) and included 359 participants (n=142 with longitudinal CSF evaluations with a median follow-up time of 2.8 years).
Estimated Years to Symptom Onset (EYO)
Estimated years to symptom onset (EYO) was defined as the mutation-specific age of onset subtracted from each participant’s age at the time of clinical assessment to define the individual’s EYO and has been described extensively30. For participants who were symptomatic at baseline or during follow-up, as assessed by a Clinical Dementia Rating® (CDR®) >0, the reported age of actual symptom onset was subtracted from age at each clinical assessment to define EYO.
Clinical Assessments
Standardized clinical evaluations, including the use of a study partner, were performed for each participant. The CDR was used to indicate dementia stage. Participants were rated as cognitively normal (CDR=0) or having very mild dementia (CDR 0.5), mild dementia (CDR 1) or moderate dementia (CDR 2)31. Evaluating clinicians were blind to genetic status. A comprehensive neuropsychological battery assessing general cognitive function, memory, attention, executive function, visuospatial function, and language was performed at each visit32. From these tests we developed a cognitive composite that reliably detects decline across the range of EYO and CDR33. The composite represents the average of the z-scores from tests assessing episodic memory, complex attention, and processing speed and a general cognitive screen (Mini Mental State Examination).
CSF tau Analyses
CSF samples were collected and tau and p-tau species from N-terminal and Mid-domain were measured as previously reported5,16. For p-tau measures, the phosphorylation occupancies at different tau residues (pT111/T111, pT153/T153, pT181/T181, pS199/S199, pS202/S202, pT205/T205, pT217/T217, and pT231/T231) were reported. The phosphorylation occupancy represents the percentage of tau phosphorylated at a certain amino acid position, which is a more specific measure of phosphorylation not confounded with total tau concentrations, and superior to the corresponding p-tau concentration in prediction of abnormal amyloid status34,35. Briefly, 25 μl of the master mix solution containing detergent and chaotropic reagents (final 1% NP-40, 5mM guanidine, protease inhibitor cocktail [Roche]) and 2.5 ng of internal standards for tau (15N isotope-labeled 2N4R tau [gift from Dr. Guy Lippens]) were added to 0.5 ml of CSF in polypropylene tubes. Tau and p-tau species from N-terminal and Mid-domain were extracted by IP using incubation under rotation at room temperature during 2 hours with 30 µl of sepharose beads cross-linked to HJ8.5 and Tau1 anti-tau antibodies with epitopes residing in N-terminal (27–35) and mid-domain (192–199) of tau, respectively (Fig 1). The post-IP CSF samples were collected in new polypropylene tubes and stored at −80 °C until the MTBR-tau analysis.
For MTBR-tau measurements, the post-IP CSF samples (after the immunodepleting by Tau1 and HJ8.5 for p-tau species) were thawed and mixed with 10 µl of internal standard solution containing respectively 1 ng of 15N isotope-labelled 0N3R tau (Promise Proteomics, Grenoble, France) and 1 ng of 13C15N isotope-labelled 2N4R tau (rPeptide, Watkinsville, GA). Tau was extracted by immunoprecipitation using incubation under rotation at room temperature during 2.5 hours with 30 µl of sepharose beads cross-linked to E2814 (tau epitope 299–303 and 362–366 of tau 441 2N4R) antibody. E2814 is a high affinity bi-epitopic antibody specifically binding the HVPGG sequences (299–303, 362–366) within R2 and R4 of MTBR-tau, respectively36 (Fig 1). The immunoprecipitated tau species were digested on-beads with 400 ng of trypsin (Promega), desalted by TopTip C18 (Glygen), and analyzed by Orbitrap Eclipse mass spectrometer (Thermo Scientific) operating in parallel reaction monitoring (PRM) mode. Tau peptides from CSF (Table 1) were quantified by comparison with corresponding isotopomer signals from the 15N isotope labeled 0N3R-tau or 13C15N isotope labeled 2N4R-tau internal standards as previously described26.
Table 1.
Baseline demographic, cerebrospinal fluid, neuroimaging and cognition measures for mutation carriers and non-carriers.
| Mutation Carriers | Mutation non-carriers | p-value (all MC vs NC) | |||
|---|---|---|---|---|---|
| N (Asymptomatic MC/Symptomatic MC/ NC) |
Asymptomatic (N = 151) |
Symptomatic (N = 78) |
(N = 130) | ||
| Age | 359 | 34.3 ± 8.9 | 46.3 ± 9.2 | 38.2 ± 12.0 | <0.0001 |
| Female, n (%) | 359 | 84 (55.6) | 39 (50.0) | 82 (63.1) | 0.13 |
| APOE ε4, n (%) | 359 | 47(31.1%) | 24 (30.8%) | 47 (36.2%) | 0.64 |
| EYO, MEAN ± SD | 359 | −13.3 ± 8.9 | 3.4 ± 3.7 | −9.8 ± 12.5 | <0.0001 |
| Cortical PiB PET SUVR | 288 (134/54/100) | 1.73 ± 0.87 | 2.90 ± 1.36 | 1.06 ± 0.18 | <0.0001 |
| *PiB +, n (%) | 288 (134/54/100) | 75 (59.1) | 46 (95.8) | 1 (0.88) | <0.0001 |
| MTBR-tau 299 (MTBR-299 4R) (ng/ml) | 359 | 0.06 ± 0.04 | 0.12 ± 0.07 | 0.04 ± 0.02 | < 0.0001 |
| MTBR-tau306 (MTBR-306 3R) (ng/ml) | 359 | 0.04 ± 0.02 | 0.06 ± 0.03 | 0.02 ± 0.01 | < 0.0001 |
| MTBR-tau354 (MTBR-354 3R/4R core) (ng/ml) | 359 | 0.19 ± 0.07 | 0.25 ± 0.10 | 0.15 ± 0.05 | < 0.0001 |
| MTBR -tau299/354 (border/core ratio) | 359 | 0.31 ± 0.1 | 0.47 ± 0.13 | 0.25 ± 0.05 | < 0.0001 |
| Lumipulse Aβ42 (ng/ml) | 351 (148/76/127) | 0.71 ± 0.38 | 0.40 ± 0.21 | 0.80 ± 0.28 | < 0.0001 |
| Lumipulse tTau (ng/ml) | 328 (142/71/115) | 0.40 ± 0.28 | 0.74 ± 0.36 | 0.27 ± 0.11 | < 0.0001 |
| Lumipulse pT181/T181 (ng/ml) | 359 | 0.026 ± 0.006 | 0.034 ± 0.007 | 0.022 ± 0.002 | < 0.0001 |
| Hippocampal volume (mm3) | 334 (146/72/116) | 8864 ± 994 | 7315± 1207 | 8811 ± 746 | <0.0001 |
| Cognitive Composite (z-score) | 346 (150/77/119) | −0.093 ± 0.64 | −1.64 ± 0.85 | −0.004 ± 0.61 | <0.0001 |
EYO- estimated years to onset of symptoms; MTBR- microtubule binding region; PiB- Pittsburgh compound B; R- repeat; SUVR- standard uptake value ratio; PiB + = SUVR >1.25.
Brain tau Analyses
Fresh frozen tissue from the lateral parietal lobe of sAD (n=7) and the dorsolateral frontal lobe of DIAD participants (n=6) was used to for analysis of brain insoluble tau. Analyses were performed using filter-aided sample preparation methods as previously described37.
Brain Imaging
Amyloid deposition, tau (NFT) PET and cortical thickness/subcortical volumes were assessed using 11C-PiB-PET, 18F-AV-1451 (a.k.a flortaucipir) and volumetric T1-weighted MRI scans, respectively. Standard procedures were used to ensure consistency in the data collection across DIAN sites. The details of the DIAN imaging process have been described extensively38,39. All tau and PiB-PET data have been reported in previously8,40. The PIB and tau PET SUVRs regions of interests (ROIs) were obtained using FreeSurfer software (http://surfer.nmr.mgh.harvard.edu/). The SUVRs were processed with total cerebellum grey matter as reference regions and ROI data were corrected for partial volume effects in geometric transfer matrix framework41.
Statistical analysis
Baseline participant characteristics of the participants were summarized as mean ± SD for continuous variables and n (column percent) for categorical variables. P-values for comparing the differences among asymptomatic MC (aMC), symptomatic MC (sMC) and non-carriers (NC) as defined at baseline were obtained using linear mixed effects models (LME) for continuous variables and generalized LME, with a logistic link for categorical variables. All of the models incorporated a random effect for each family cluster to account for family variation and the correlations on the outcome measures between participants within the same family. Comparisons in MTBR-tau species among different amyloid and CDR groups were also performed using LME models as described above. P values for pairwise comparisons were corrected using Benjamini-Hochberg Procedure42.
For within-individual annual rate of change over the longitudinal follow up, the best linear unbiased predictors for each biomarker were estimated using LME, which were then plotted against baseline EYO to examine biomarkers trajectories. Variables were log transformed as needed. The fixed effects in the LME models included group (aMC, sMC, NC), time since baseline and the interaction between them. The random effects included random intercept for each family cluster and individual random intercepts and slopes with an unstructured covariance matrix. Associations in the annual rate of change among MTBR-tau species, CSF p-tau species, cognitive composite, hippocampal volume and tau PET composite were evaluated using spearman correlation using a two-stage approach.
Cross-sectional associations between baseline measures of soluble MTBR-tau and multiple fluid, imaging and clinical measures in MCs were evaluated using Spearman correlations. Absolute values of the Spearman correlations were plotted as a heatmap for visualization of the pattern of association and ordered based on hierarchical clustering. The hierarchical structure was displayed as dendrograms in the margins of the heatmap. Because the intent of the hierarchical clustering was to assess if the various MTBR-tau species had different associations with amyloid pathology (CSF, PET), neurodegeneration-clinical (FDG-PET, NfL, MRI measure, MMSE, neurogranin, VILIP1), tau related biomarkers (CSF p-tau occupancies and total tau) and CSF markers of inflammation (sTREM2, YKL40), the clustering was limited to the strength of correlation but not direction.
Linear or linear spline mixed effects models, where appropriate, were then used to determine the baseline EYO point from which MC became significantly different from NC in the rate of change for each biomarker. The details of the linear spline mixed effects models can be found in a recent publication40. The linear or linear spline mixed effects models included the fixed effects of mutation group (MC or NC), baseline EYO, time since baseline and all possible two-way or three-way interactions among them. Sex, years of education, and APOE ε4 status were considered as covariates, but only those that were significant were retained in the models. Random effects included in the models were the random effects for family clusters, individual random intercepts and random slopes with unstructured covariance matrix to account for the within-subject correlation due to repeated measures.
All analyses were conducted using SAS 9.4 (SAS Institute Inc., Cary, NC) and RStudio (version 3.4.3). A p-value <0.05 was considered to be statistically significant and all statistical tests were two-sided.
Results
CSF and brain MTBR-tau in DIAD
Demographic, CSF, neuroimaging, and cognition measures for 229 mutation carriers (MCs) and 130 non-carriers (NCs) are summarized in Table 1. The mean/SD of EYO in MCs was (−7.6 ± 10.9) years and the percentage of asymptomatic MCs was 66%. All MTBR-tau species were increased in MCs relative to NCs. The IP/MS method utilizing E2814 antibody (epitopes: 299–303 and 362–366) in the second IP process recovered MTBR-tau peptides 299–317 (MTBR-tau299), 306–317 (MTBR-tau306), and 354–369 (MTBR-tau354), whereas the first IP utilizing HJ8.5 and Tau1 antibodies (epitopes: 27–35 and 192–199, respectively) did not recover the MTBR-tau species due to the truncation of tau around the residue 224 in CSF15,43 Notably, MTBR-tau306 is a 3R tau splicing isoform specific peptide, and we refer to it as the “MTBR-306 3R”. MTBR-tau299 is a 4R tau splicing isoform specific peptide located near the putative border of the AD-tau filament core based on cryogenic electron microscopy structural study44 and we refer to it as the “MTBR-299 4R”. Since MTBR-tau354 is common to 3R and 4R splicing isoforms but located in the R4 region and central in the AD tau filament core, we refer to it as “MTBR-354 3R/4R core”. The amounts of tau peptides located outside of MTBR and in the mid- and C-terminal domains were very low, suggesting E2814 specifically recovers the truncated MTBR-tau species in CSF. The MTBR-tau species were increased in MCs (presymptomatic and symptomatic, p<0.0001) relative to NCs (Table 1). We also calculated MTBR-299/354 (border/core) ratio to evaluate the changes in the stoichiometry of soluble MTBR-tau species with disease progression. The ratio also showed significant increase in MCs compared to NCs (p<0.0001).
To confirm that the E2814-targeted epitopes were enriched in insoluble tau, we analyzed tau profiles in brain insoluble extracts from symptomatic DIAD MCs (n=6) and compared to sAD (n=7), (Fig 2). Insoluble brain tau was most enriched at MTBR- 354 3R/4R core, followed by MTBR-306 3R and then MTBR-299 4R, with significantly less enrichment at other sites, except for MTBR-tau containing the residue of 243, which is at the beginning of the repeat 1 (R1) region within MTBR. These results indicate that in AD-related insoluble tau, E2814 -targeted MTBR epitopes are likely to represent relevant components of the core of NFTs. Lastly, because MTBR-299 4R and MTBR-354 3R/4R core represent different repeat domain species composing the border and central core of AD NFT, respectively, and MTBR-354 3R/4R core has more propensity to be recruited in NFT than MTBR-299 4R45, we also included a MTBR-299/354 ratio to evaluate the soluble/insoluble state of MTBR-tau with disease progression.
Figure 2. MTBR-tau299, 306 and 354 species are enriched in aggregated sporadic and dominantly-inherited Alzheimer’s disease brain insoluble extracts compared to control brain extracts, confirming that MTBR-tau species are specifically deposited in Alzheimer’s disease brain.
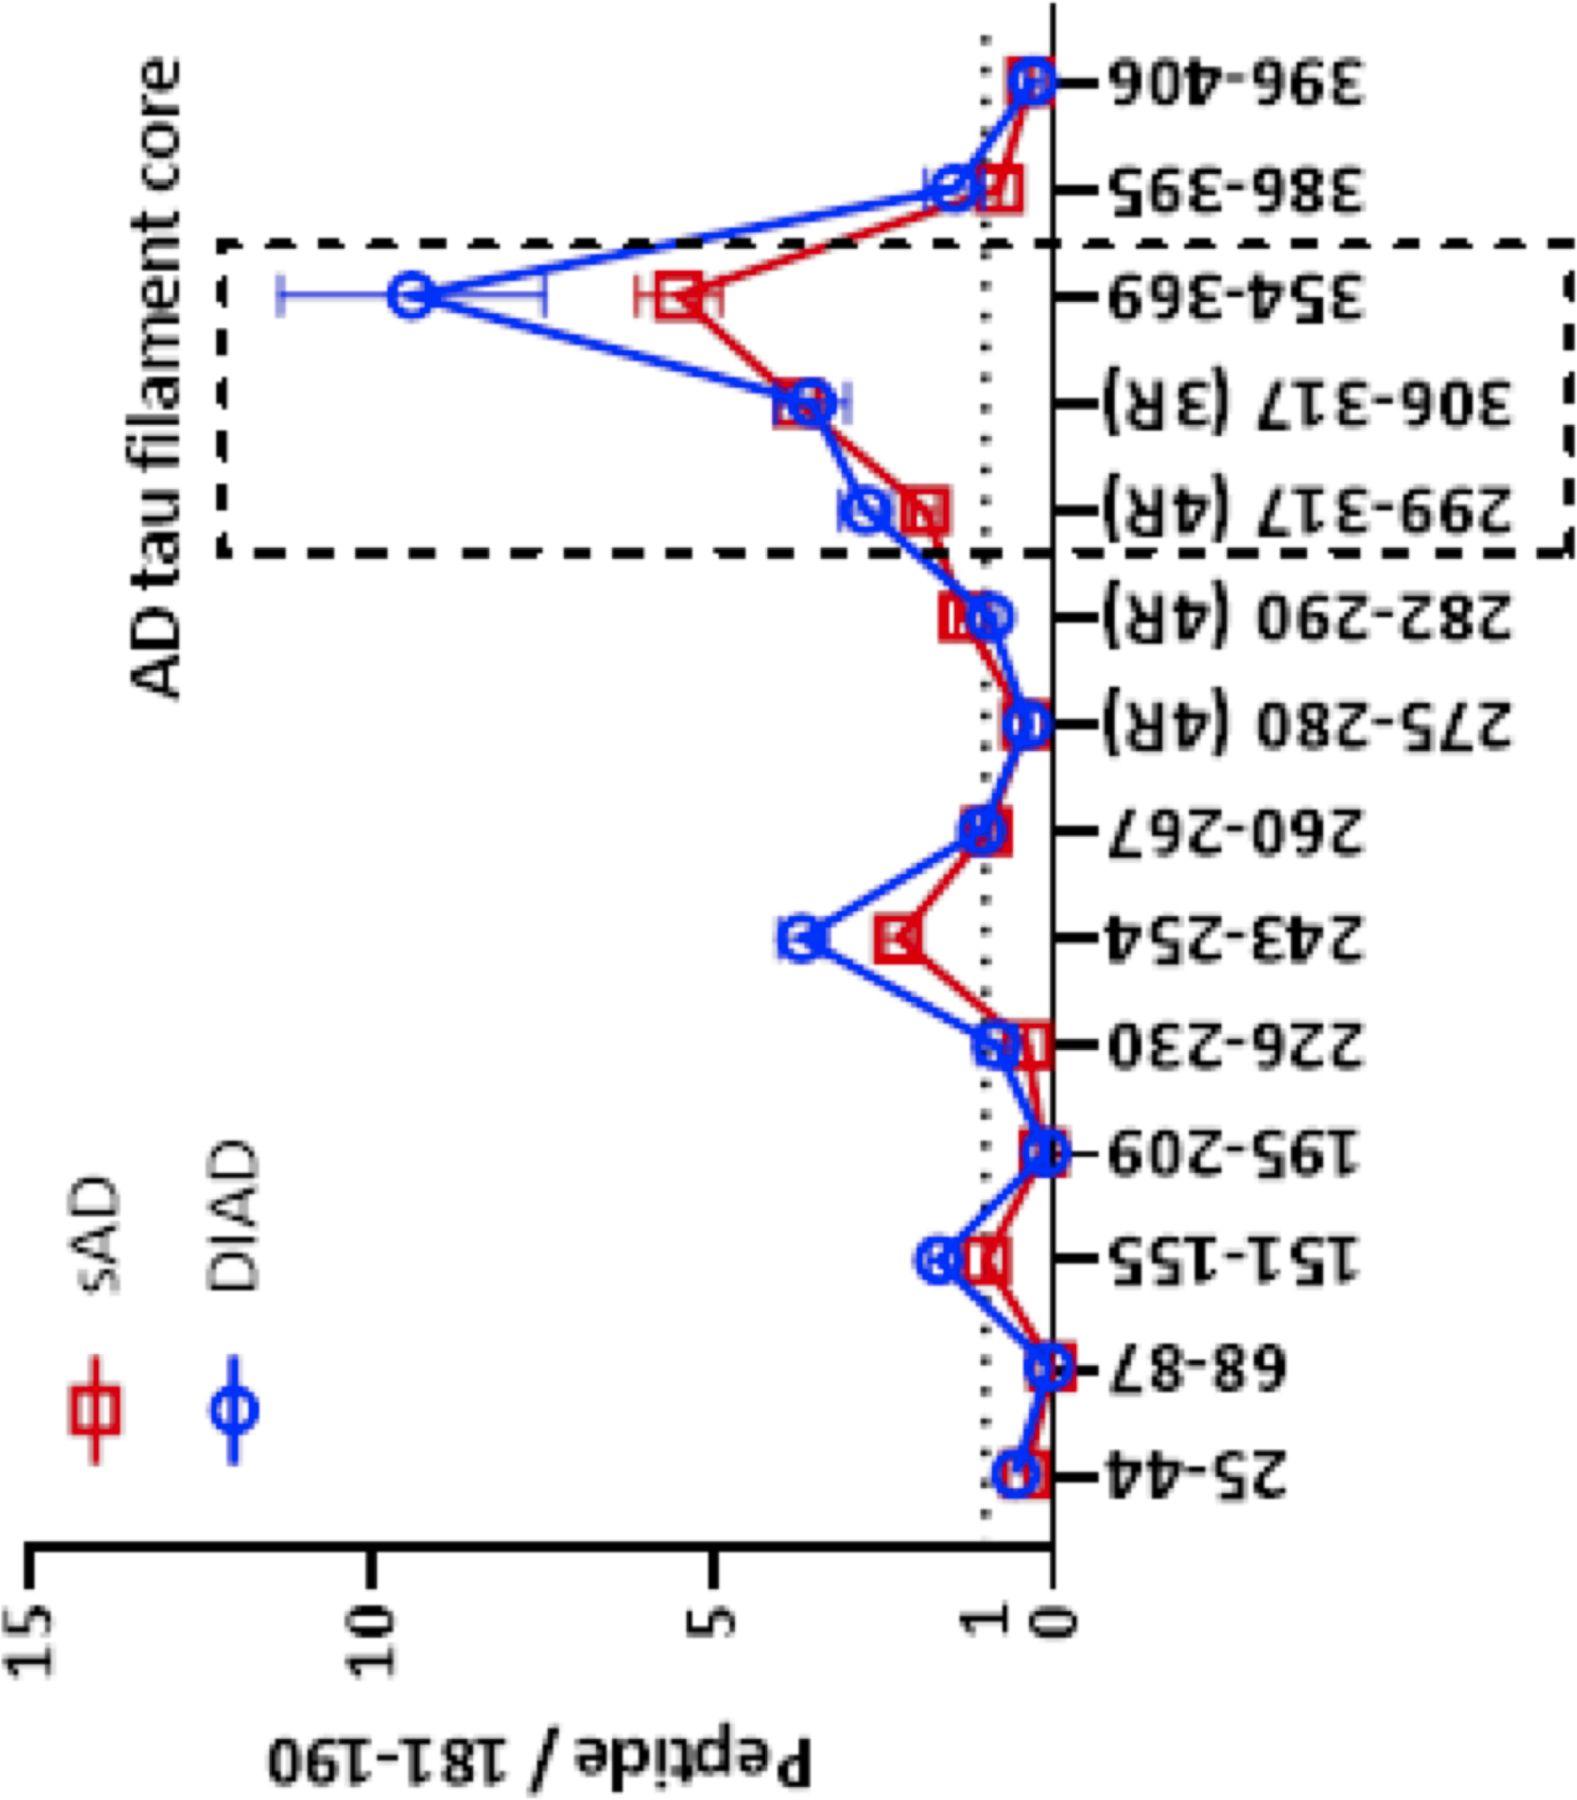
The enrichment profile of tau peptides from dominantly-inherited Alzheimer’s disease (DIAD) brains. DIAD n=6 (frontal cortex), sporadic AD n=7 (parietal cortex). The relative abundance of tau peptides was quantified relative to the mid-domain (residue 181–190) peptide for internal normalization. The species containing the upstream region of the microtubule binding region (MTBR) domain (residue 243–254), repeat region 2 (R2) to R3 domain (residue 299–317, MTBR-tau299, MTBR-299 4R), R3 domain (residue 306–317, MTBR-tau306, MTBR-306 3R) and R4 (residue 354–369, MTBR-tau354, MTBR-354 3R/4R core) were highly enriched in the insoluble fraction from Alzheimer’s disease brains compared to control. MTBR-299 4R is located at surface on the neurofibrillary tangle (NFT), whereas MTBR-306 3R and MTBR-354 3R/4R core are relatively located inside the NFT44. Data are represented as average with standard error of mean.
Cerebral amyloid pathology and symptom onset identify distinct patterns of soluble MTBR change
We have previously demonstrated in sporadic AD that the levels of CSF MTBR-299 4R, and MTBR-354 3R/4R core increased in the presence of Aß-plaque pathology26 in patients with sAD. To evaluate when the MTBR-tau species begin to increase in DIAD, we first assessed concentration of each MTBR-tau species across the EYO for all MCs and NCs, (Fig 3a-d). For border MTBR-tau species, MTBR-299 4R and MTBR-306 3R, CSF levels increased within 10–15 years prior to symptom onset. Whereas, MTBR-354 3R/4R core appeared to increase less than 10 years of symptom onset. Receiver operating curve analyses (ROC) for amyloid-statues (SUVR value of cortical PiB-PET that reliably identifies significant brain aggregated Aß (Amyloid +, SUVR ≥ 1.25 or Amyloid −, SUVR < 1.255)) found similar area under the curve (AUC) for MTBR-299 4R of 0.91 (95% confidence interval (CI) 0.87 – 0.95) and MTBR-306 3R of 0.89 (CI 0.84, 0.94), suggesting these border MTBR species correlate stronger with amyloid pathology than MTBR-354 3R/4R core, 0.77 (CI 0.70, 0.84), similar to the measures previously identified in sAD26.
Figure 3. All CSF MTBR-tau species increase during asymptomatic amyloid stage (a,b,c), then decrease during symptomatic tau stage (e,f,g). CSF MTBR-299 4R increase relative to MTBR-354 3R/4R core in symptomatic tau stage (d, h).

Individual, longitudinal changes of MTBR-tau species of (a) MTBR-tau299 (MTBR-299 4R), (b) MTBR-tau306 (MTBR-306 3R) (c) MTBR-tau354 (MTBR-354 3R/4R core), (d) MTBR-tau299/MTBR-tau354 (border/core), for mutation carriers (orange = asymptomatic mutation carriers (aMC), (n= 151), red = symptomatic mutation carriers (sMC),(n=78)) and non-carriers (blue, (n=130)) across the estimated years to symptom onset (EYO). The vertical dashed line is the point of expected symptom onset. (e-h). Individual longitudinal changes of soluble MTBR fragments. Individual, log, z-transformed, longitudinal changes in the levels of (e) MTBR-tau299 (MTBR-299 4R), (f) MTBR-tau306 (MTBR-306 3R) (g) MTBR-tau354 (MTBR-354 3R/4R core) and (h) MTBR-tau299/MTBR-tau354 (border/core) for aMCs (orange), sMCs (red) and NCs (blue) across the estimated years to symptom onset (EYO). The gray shading represents the soluble phase of tau with positive (increasing) rates of change; the pink shading represents the aggregated phase of tau (and symptomatic stage of disease) with negative (decreasing) rates of change. All fragments have a bimodal pattern of rate of change with all species having a negative rate of change (< 0) approximately 5 years before symptoms onset (EYO 0) with maximum reversal.
We then estimated the annual rate of change across EYO for all MCs and NCs based on the linear-mixed models. For all MTBR-tau species, there were early increases in annual rate of change, −20 to −10 EYO, with a maximal rate of change identified approximately 10 years before estimated symptom onset, (Fig 3e-g). However, for all MTBR-tau species as symptom onset approached the annual rate of change slowed and became negative after symptom onset, the point where tau PET begins to increase in DIAD MCs8. MTBR-299/354 (border/core) ratio remained positive across EYO, although the increase slowed down after symptom onset.
Together, these results indicate that during early Aβ-plaque pathology, “border” MTBR-tau species (MTBR-299 and 306) and “core” MTBR-tau species (MTBR-354) differentially begin to increase in the CSF. However, with disease progression and at symptom onset, CSF MTBR-tau species begin to decline from peak levels and at a time when NFT are expected to be detected in brain tissue.
Decreasing rates of CSF MTBR-tau species have different associations with Tau PET, Cognition and Neurodegeneration
With evidence of a decreasing rate of change of the MTBR-tau species occurring near the time of symptom onset, and with the MTBR enrichment profile of insoluble tau in post-mortem DIAD and sAD brain samples26,37, we next assessed the association of the rate of change of each CSF MTBR-tau species with tau PET, cognitive performance and neurodegeneration (hippocampal atrophy).
MTBR-tau and Tau PET
We hypothesized that there is a correlation between “core” CSF MTBR-tau species and Tau PET and evaluated the association of longitudinal rates of change of MTBR-tau species with tau PET SUVR in a subset of participants who underwent tau PET imaging (N=8 longitudinal), Fig 4. Although the numbers were small and subject to influence from outliers, we found that all correlations where negative and that the highest correlation was seen with rate of change of MTBR-354 3R/4R core (r = −0.90), followed by MTBR-306 3R (r = −0.81) and then MTBR-299 4R (r = −0.60) and baseline tau PET SUVR. This suggests that as aggregated tau measured by tau PET is increasing, CSF levels of MTBR-354 3R/4R core, MTBR-306 3R and MTBR-299 4R species begin to decline from their maximal levels.
Figure 4. Longitudinal change of soluble MTBR-tau species are differentially related to neurofibrillary tau (tau PET).
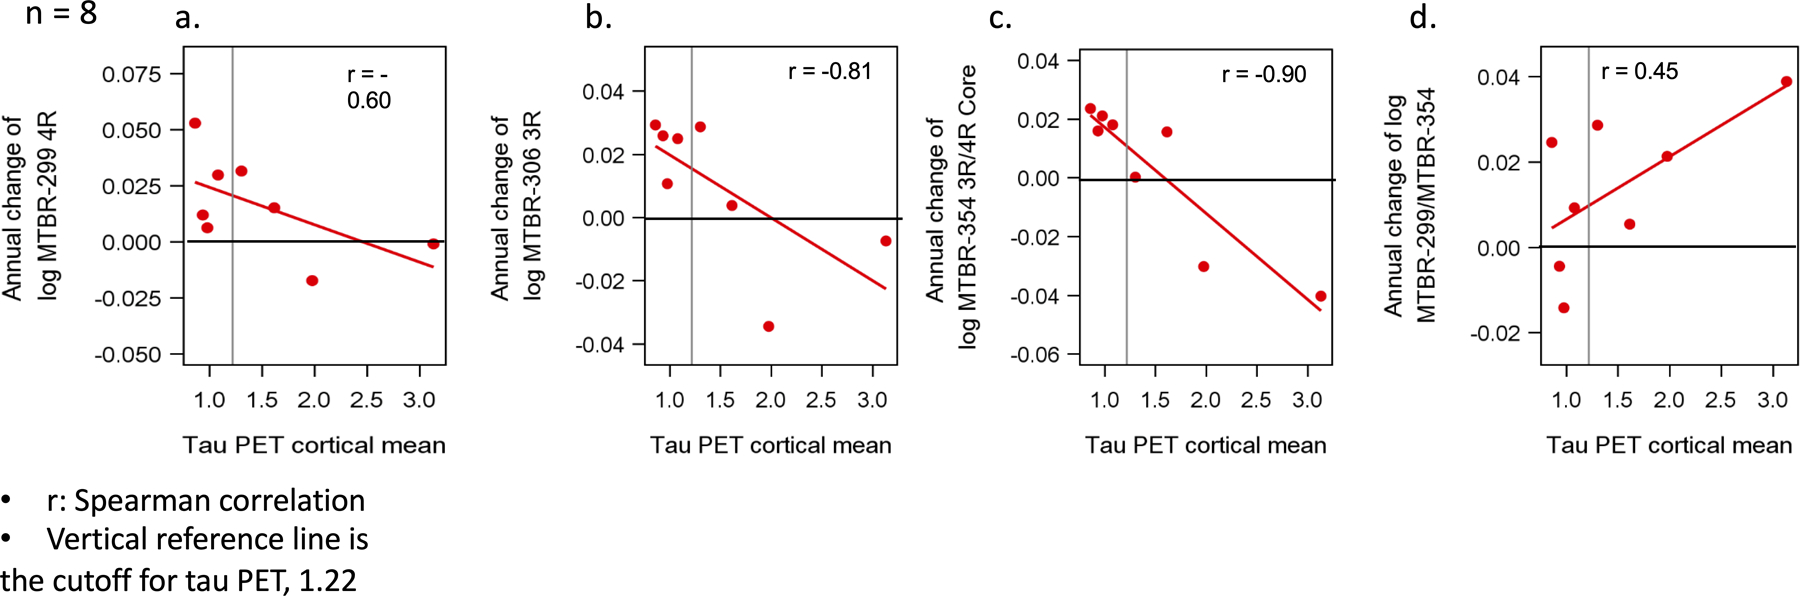
Estimated rates of change, log transformed, (n = 8) (a-d) of MTBR (y-axis) leading up to the time of tau PET scan (x-axis). The vertical line is an SUVR of 1.22 and represents a conservative estimate of the point when NFT tau PET (a composite of multiple cortical and limbic regions) is considered elevated compared to non-carriers. For longitudinal analyses, the rate of change of MTBR-306 3R, 95% confidence interval (CI) - 0.96 – −0.19; p – 0.01 and MTBR-tau354 (MTRB-354 3R/4R core), 95% CI - 0.98 – −0.51; p – < 0.001 in the time leading up to the tau PET were most strongly associated with tau PET SUVR; specifically, a decrease in the rate of change of these two MTBR species that was associated with higher levels of tau PET SUVR; MTBR-299 4R, 95% CI - 0.91 – 0.23; p – 0.12, MTBR-299/MTBR-354 (border/core), 95% CI - 0.39 – 0.98; p – 0.28.
MTBR-tau and Cognitive Change
NFT burden more closely track clinical symptoms8,21–25. Therefore, we hypothesized that CSF MTBR-tau may also correlate with cognitive changes. We performed a linear mixed effect modeling on longitudinal cognitive performance on a neuropsychological composite and log transformed CSF MTBR-tau measures, accounting for familial relation (participants of the same family) to derive individual annual rate of change in cognition and MTBR-tau levels. We then performed Spearman correlations of the longitudinal estimates for cognition and MTBR-tau changes by clinical status (symptomatic and asymptomatic). The rate of change of MTBR-306 3R had the strongest association with annual cognitive change in asymptomatic MCs (r = 0.43). Specifically, the more negative the rate of change for MTBR-tau, the more negative the change in cognition, (Fig 5). For symptomatic MC, there were similar associations with a decrease in the rate of change of MTBR-306 3R and MTBR-299 4R and cognitive decline (r = 0.21 and r = 0.29). For MTBR-354 3R/4R core, there were no associations with change in cognition.
Figure 5. Longitudinal change of MTBR-tau species are differently associated with change in cognition.
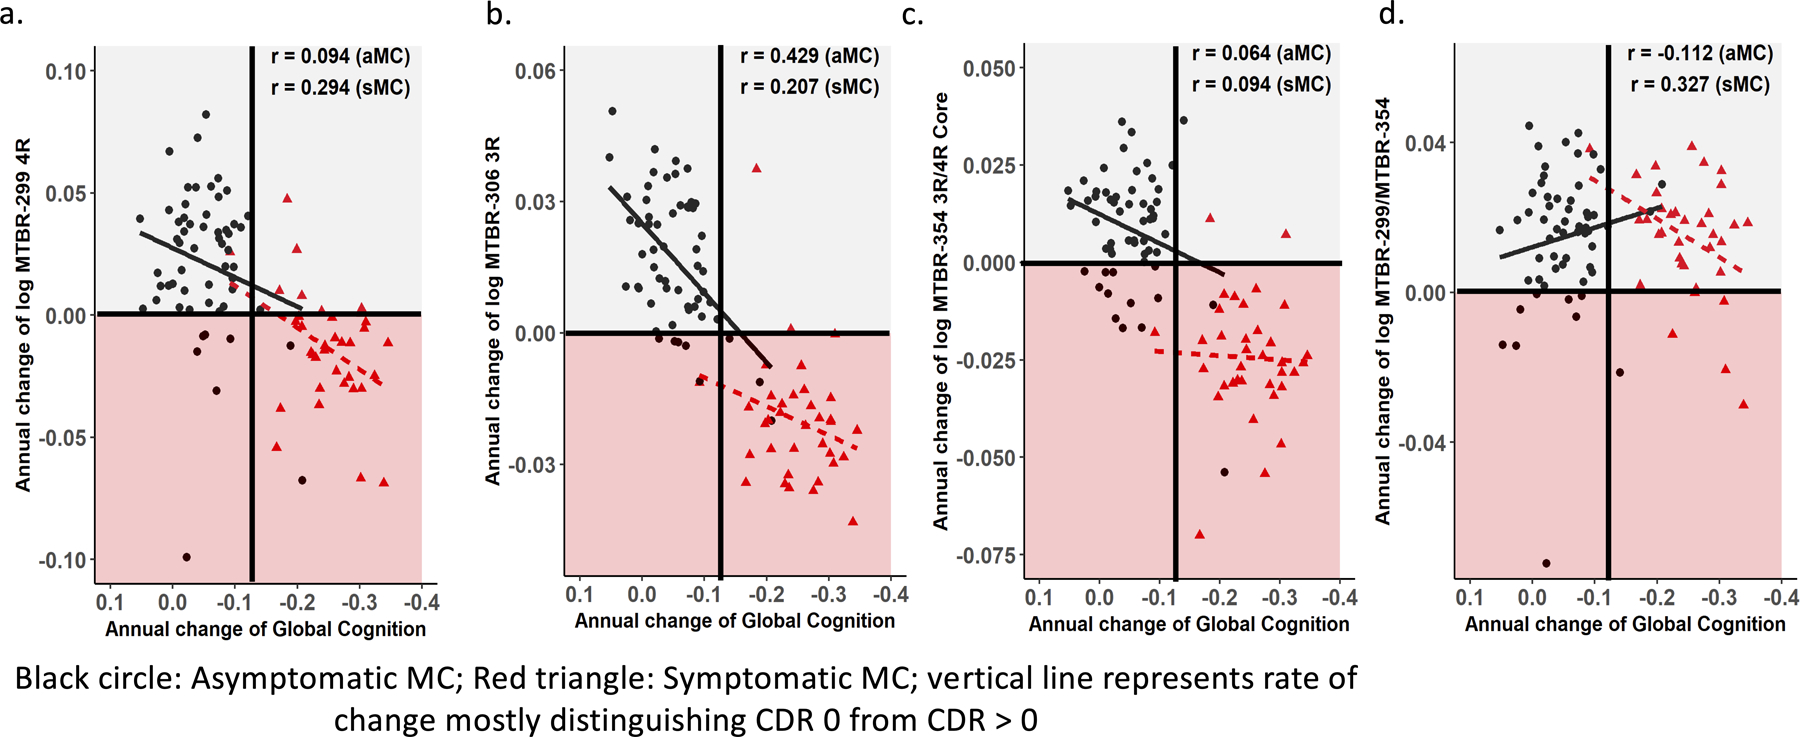
Individual estimated annualized rates of change, log transformed, of soluble MTBR-tau (y-axis) for MCs were correlated with the annualized change in global cognitive function (a-d); the lines represent simple linear regression and the r = Spearman correlation. Each point is an individual level correlation between measures. The linear regression was fit to those with no dementia (CDR 0, black circle, n= 57) and dementia (CDR >0, red triangle, n= 40). A decline in MTBR-tau306 (MTBR-306 3R, 95% CI 0.19 – 0.62; p – < 0.001) species (b) was associated with a decline in cognition at the asymptomatic stages, where MTBR-tau299 (MTBR-299 4R, 95% CI −0.05 – 0.57; p – 0.09) (a) and MTBR-299/MTBR-354 (border/core, 95% CI −0.01 – 0.59; p – 0.06) (d) was associated with a decline in cognition at the symptomatic stages; for all other correlations there were no statistically significant associations: asymptomatic MC - MTBR-299 4R, 95% CI −0.17 – 0.35; p – 0.49 (a), MTRB-354 (3R/4R core), 95% CI −0.20 – 0.32; p – 0.64 (c), MTBR-299/MTBR-354 (border/core), 95% CI −0.36 – 0.15; p – 0.41; symptomatic MC - MTBR-306 3R, 95% CI −0.14 – 0.50; p – 0.24 (b), MTRB-354 (3R/4R core), 95% CI −0.25 – 0.41; p – 0.59) (c).
MTBR-tau and hippocampal atrophy
Given the association of tau PET with MRI measures of atrophy46,47, we next examined the association between the rate of change of CSF MTBR-tau species and MRI measures of hippocampal volume, Fig 6. The strongest correlations were in the presymptomatic period where an increase in soluble MTBR-299 4R (r = 0.24) and MTBR-306 3R (r = 0.34) were associated with an acceleration in hippocampal volume loss. At the symptomatic stages, only change in MTBR-299 4R (r = 0.37) was associated with a continued change in hippocampal volumes. Importantly, this contrasts with our previous analyses of multiple soluble p-tau species that did not identify any clear associations between changes of p-tau and change in hippocampal volumes during the presymptomatic stage of AD5.
Figure 6. Longitudinal change of MTBR-tau species are differently associated with change in hippocampal atrophy.
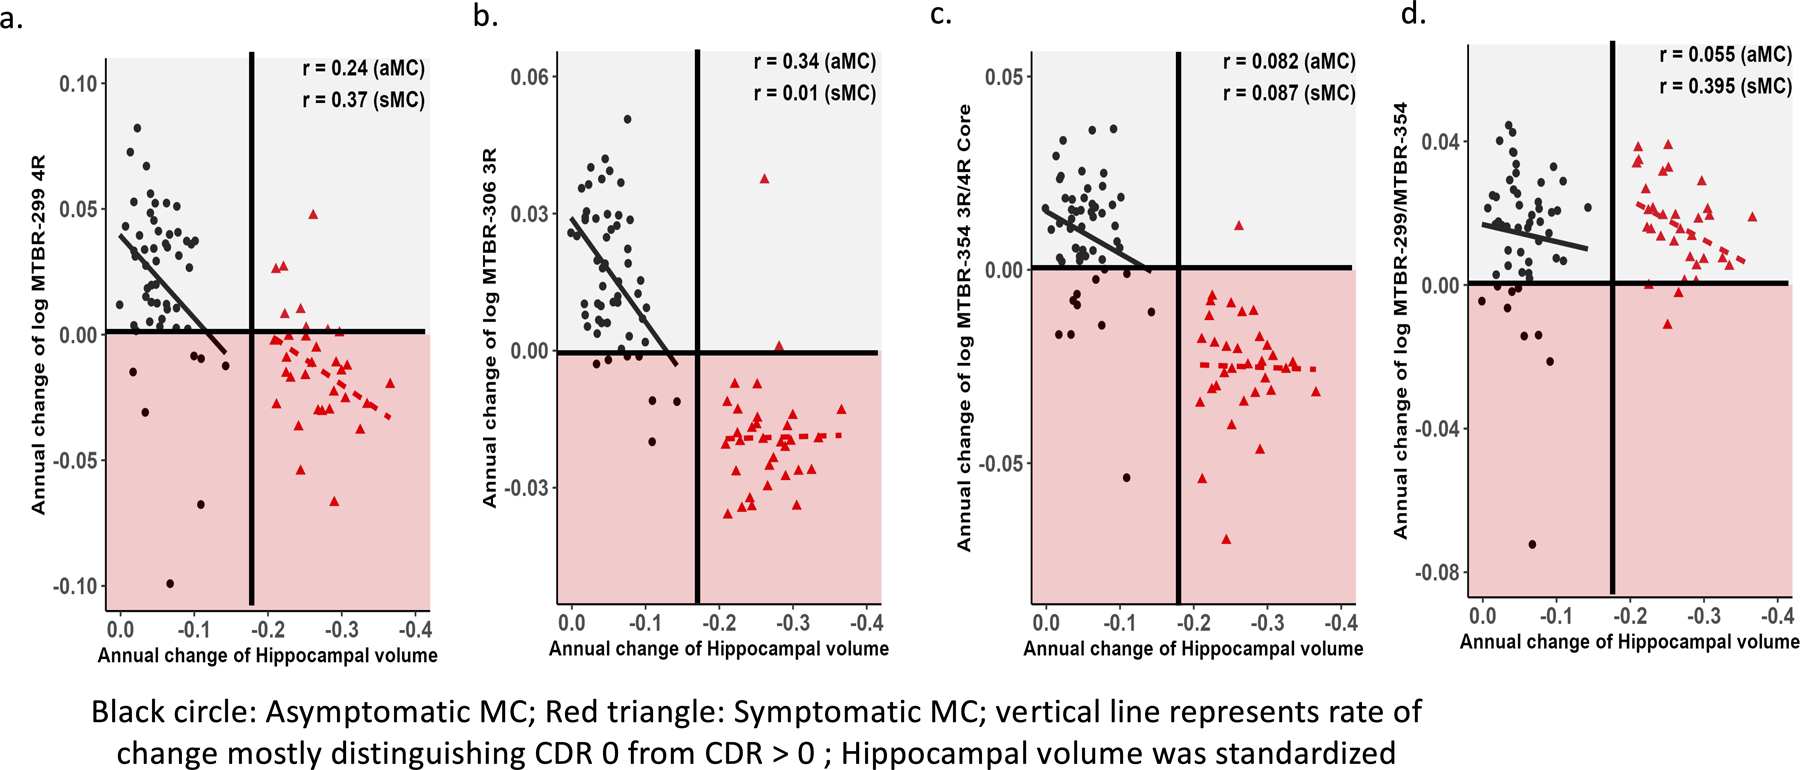
Individual estimated annualized rates of change, log transformed, of soluble MTBR-tau (y-axis) for MCs were correlated with the annualized change in hippocampal atrophy (a-d); the lines represent simple linear regression. Each point is an individual level correlation between measures and the r = Spearman correlation. The linear regression was fit to those with no dementia (CDR 0, black circle, n= 57) and dementia (CDR >0, red triangle, n= 40). There was evidence of a direct association with trends towards slower rates of change of MTBR-299 4R, 95% CI −0.03 – 0.49; p – 0.08 (a) and MTBR-306 3R, 95% CI 0.76 – 0.56; p – 0.01 (b) being associated with the initial decrease in hippocampal volumes during the asymptomatic phase; for MTBR-299 4R, 95% CI 0.02 – 0.63; p – 0.04 and the MTBR-299/MTBR-354 (border/core), 95% CI 0.05 – 0.65; p – 0.02 (d), there remained a suggestion of a similar association during the symptomatic phase of the disease as well. For all other correlations there were no statistically significant associations: asymptomatic MC- MTRB-354 (3R/4R core), 95% CI −0.19 – 0.34; p – 0.56 (c), MTBR-299/MTBR-354 (border/core, 95% CI −0.22 – 0.32; p – 0.70); symptomatic MC- MTBR-306 3R, 95% CI - 0.34 – 0.35; p – 0.96, MTRB-354 (3R/4R core), 95% CI −0.27 – 0.42; p – 0.64.
Together, these results suggest that specific soluble MTBR-tau species but not p-tau in CSF may track early NFT-related neurodegeneration and reflect a more pathogenic species related to clinical progression.
Correlations between MTBR-tau, p-tau and measures of disease progression suggest distinct associations of soluble tau-related biomarkers and other AD biomarkers
With the increasing number of tau-related soluble biomarkers available, it is essential to obtain a more comprehensive profile of and understand the key differences and correlations between each biomarker as it may reflect different aspects of AD pathophysiology (i.e. Amyloid, tau and neurodegeneration / cognitive decline). Thus, we examined the association of CSF soluble MTBR-tau and multiple p-tau phosphorylation occupancies with amyloid biomarkers, neurodegeneration and clinical measures in symptomatic and asymptomatic DIAD MCs. We used a hierarchical clustering analysis of cross-sectional data as a less biased approach of evaluating the association of the p-tau sites and MTBR species with measures of disease progression, Fig 7. The pattern of clustering suggested two main branches with one branch having two sub-clusters. The clusters indicated that nearly all phosphorylated tau species and MTBR-306 3R and MTBR-299 4R species were most closely associated with measures of amyloid pathology and YKL-40, a measure of astrocyte activation. There was also a cluster that primarily consists of measures of clinical progression and neurodegeneration. Lastly, the MTBR-354 3R/4R core species was most strongly associated with phosphorylation at S202, an epitope of the AT8 antibody binding of aggregated tau, and CSF measures of synaptic integrity and function.
Figure 7. Hierarchical clustering of cross-sectional measures of soluble MTBR-tau with multiple fluid, imaging and clinical measures in MCs.
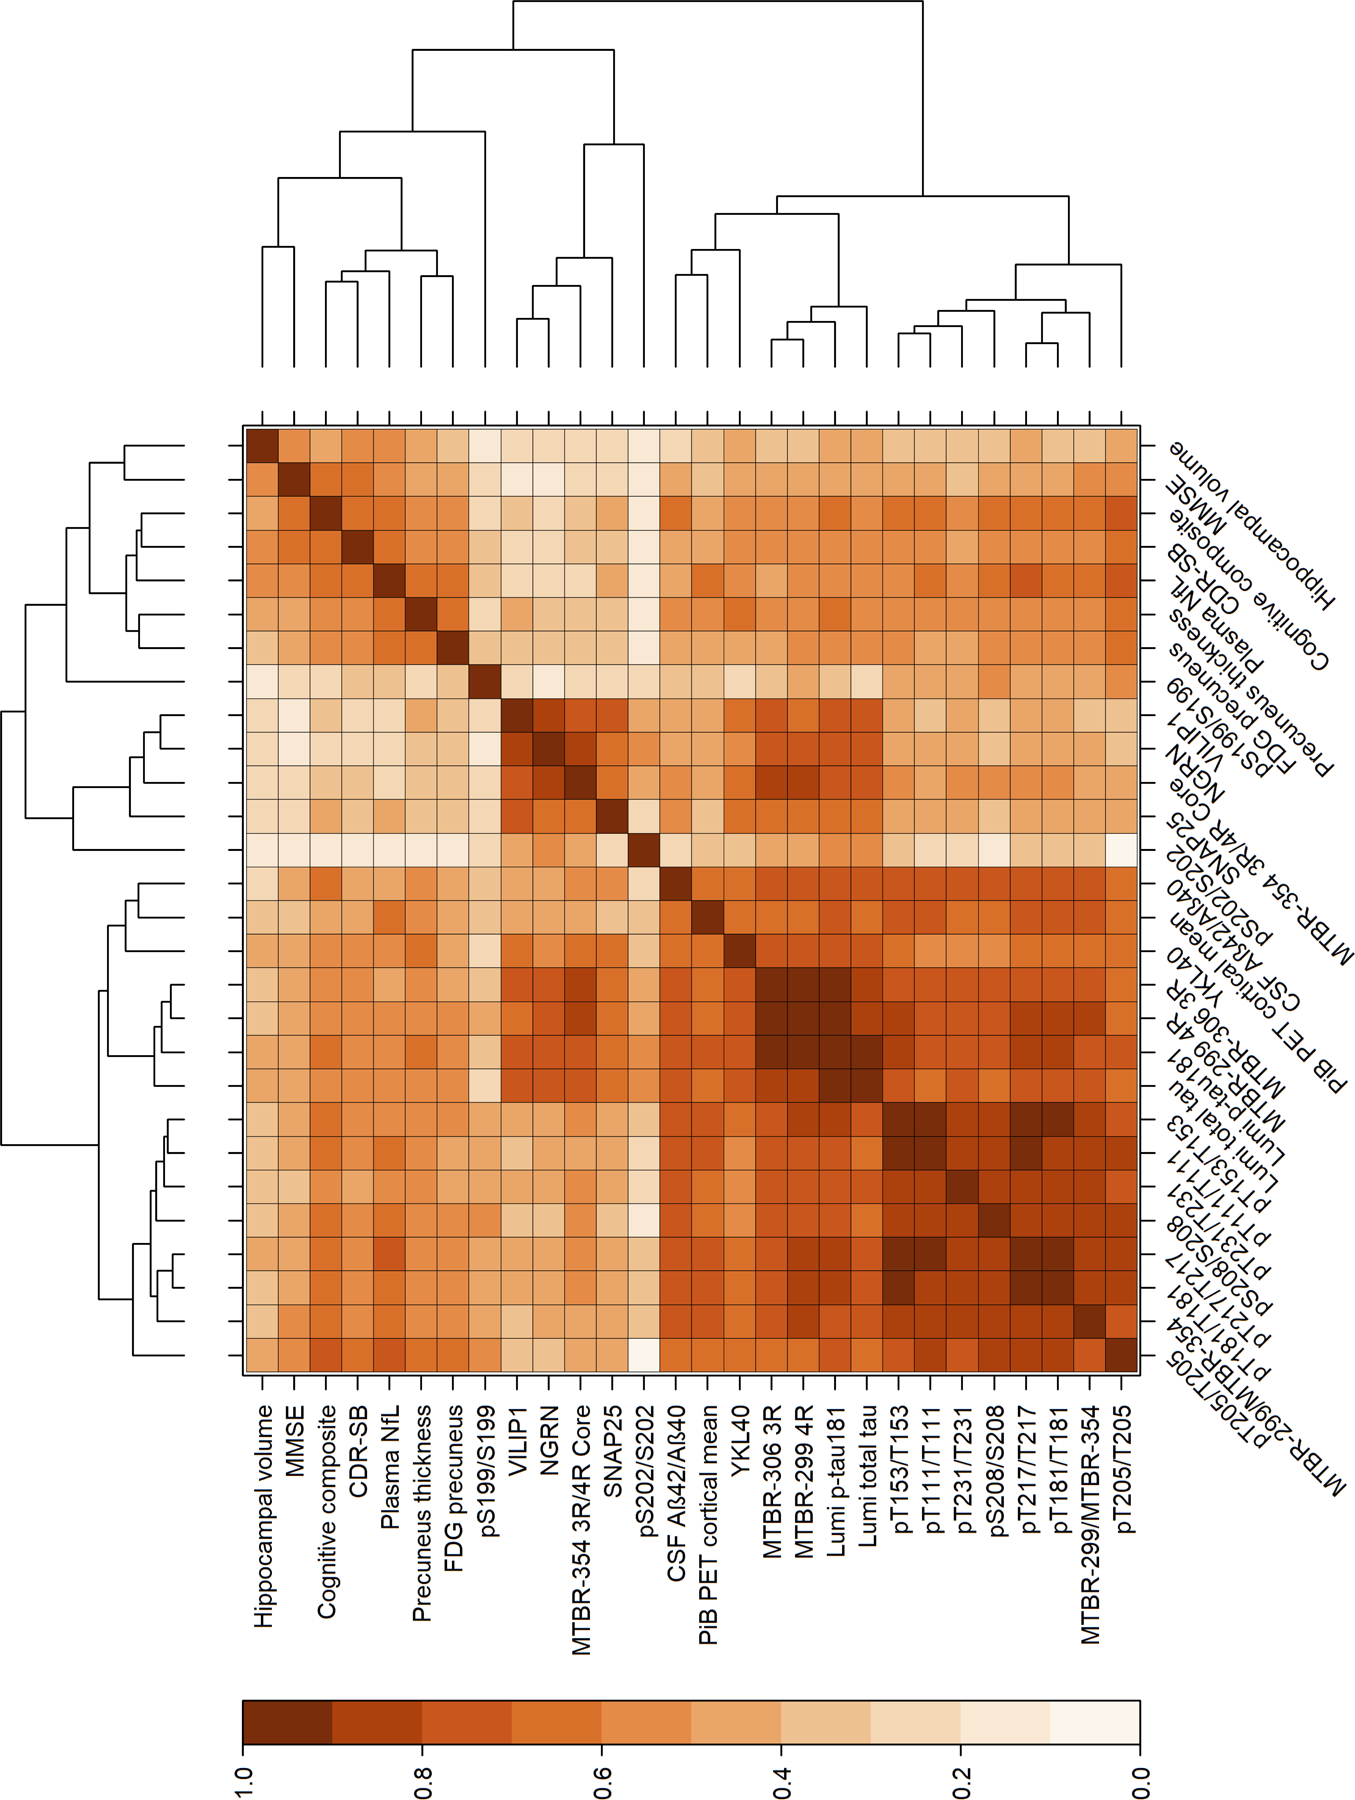
Baseline values of multiple p-tau ratios (phosphorylated to unphosphorylated levels) and MTBR-299 4R, MTBR-306 3R and MTBR-354 3R/4R core species identified two main branches with three primary clusters of 1) a clinical and neurodegenerative cluster, 2) a cluster of the MTBR-299 4R and MTBR-306 3R with measures of amyloid and multiple isoforms of p-tau, and 3) a small cluster involving p-tau sites associated with the AT8 binding of NFT, MTBR-354 3R/4R core and CSF measures of synaptic degeneration. MMSE: mini-mental state examination, CDR-SB: clinical dementia rating scale sum of boxes, NfL: neurofilament light chain, FDG: fluorodeoxyglucose, VILIP1: visinin-like protein 1, NGRN: neurogranin, SNAP25: Synaptosomal-Associated Protein, 25kDa.
Discussion
As MTBR-containing tau species make up the central core of tau filaments in AD44, we hypothesized that the levels of soluble MTBR-tau species in CSF would be closely tied to the development of NFT pathology. E2814, a high affinity bi-epitopic antibody binding the HVPGG sequences within R2 and R4 of MTBR-tau was used as an IP tool because 1) the R2 epitope is present in 4R-tau isoforms directly adjacent to the PHF6 domain (residue 306–311) which is necessary for the pathological aggregation of tau48,49 and 2) MTBR-tau species containing both R2 and R4 epitopes (residues 299–317 and 354–369) were indeed enriched and the main components in the insoluble tau aggregates from DIAD as well as sAD brains (Fig 2). We found that soluble species of the E2814-associated MTBR-tau released in CSF dynamically change in quantity and stoichiometry throughout the course of the disease, initially increasing when Aβ-plaques and soluble phosphorylated tau rises and later reversing from maximal levels as aggregated tau (as measured by tau PET) increased, atrophy accelerated and cognitive decline began. “Border” MTBR species were more strongly associated with Amyloid pathology, while “core” MTBR species were more associated with tau aggregation. Our results highlight how soluble MTBR-tau measures provide unique information that is distinct but related to that previously identified with soluble p-tau measures5, further expanding our understanding of the evolution of AD related tauopathy. A challenge for future work will be to determine how soluble MTBR species offer a potential pharmacodynamic measure of tau-targeting therapies as well as anti-amyloid therapies, i.e. in relation to amyloid or NFT pathologies, and the relationship between longitudinal changes of these soluble markers and longitudinal tau PET.
The results from this study suggest CSF MTBR-tau species begin to change decades before significant NFT pathology, as measured by tau PET8. The increases of MTBR-299 4R, MTBR-306 3R, and MTBR-354 3R/4R core species at the time of Aβ-plaques developing indicates that the post-translational modification of tau (i.e., truncation) in response to Aβ-plaques involves both 3R and 4R tau splicing isoforms. This is consistent with the fact that AD is classified as a 3R/4R mix tauopathy. Although unlikely to initially represent NFT, it is possible that these MTBR-tau species are associated with the initial Aβ neuritic-plaque-tau-aggregates48–51 and may reflect the initial neuronal and inflammatory response to Aβ-aggregates as suggested by the clustering results in Figure 7. As phosphorylation of tau is linked to the decoupling of intraneuronal tau from microtubules, it is not completely surprising that the initial rise of extracellular MTBR-tau occur with increased CSF p-tau species as well.
Yet, the AUC and clustering analyses also indicated that the location in MTBR regions may impact the trajectory of change for each species, possibly revealing an early- or late tau-amyloid relationship. The AUC analyses identified “border” MTBR species (MTBR-299 4R and MTBR-306 3R), but not “core” MTBR species (MTBR-354 3R/4R), species as more sensitive to discriminating amyloid plaques in MCs, but the clustering analyses suggesting MTBR-354 3R/4R core was most strongly associated with S202 phosphorylated tau recognized by AT8 antibody and CSF measures of synaptic dysfunction.
A unique discovery of this work was the consistent decline of all MTBR-tau species relative to their maximum rates of change as symptom onset approaches. Moreover, the reversal in the rate of change occurred maximally at the symptomatic stage of disease where tau PET signal increases in DIAD8. Although limited by a small sample size, this result supports the likelihood of a sequestration of corresponding MTBR-tau species into NFT, leading to reciprocal decrease in soluble MTBR-tau in CSF with disease progression. Interestingly, the ratio of MTBR-299 4R divided by MTBR-354 3R/4R core, which assessed the relative changes of these border/core specific species increased across disease stage, (Fig 3) and with increasing tau PET, (Fig 6). This may indicate that location of the MTBR-299 4R located closer to the perimeter of the NFT core (i.e. the border) may be more dynamically regulated in these aggregates and thus more consistently elevated even as other components of the MTBR-tau, closer to the dense core, are sequestered. This was further supported by the insoluble tau isolated from post-mortem brain tissue where MTBR-354 3R/4R core was the most highly enriched. Although it would require repeated sampling, the decline in the rate of change found with all MTBR fragments could be used as an important indicator of disease progression and pending tau PET accumulation. The reversing from maximal levels of these MTBR-tau species in CSF from sMC was consistent to other reports52,53, which demonstrated that a tau species containing a cleavage at residue 368 (tau368) within R4 was reduced in sAD CSF and may be a biomarker surrogate of tau PET pathology, supporting the hypothesis that the “core” MTBR species in CSF should reflect the underlying tau pathology.
Recent evidence supports that tau inclusions in neuronal cells are not static but have dynamic structures with appreciable turnover 54. It is likely that in AD, tau is in equilibrium state between soluble and insoluble fractions. The structural and biochemical characteristics of NFT may affect the tau profile in soluble fractions including extracellular space such as in CSF. Since MTBR-tau299 (MTBR-299 4R) is located at the putative interface between the surface and core on AD NFT44, MTBR-tau299 may be most sensitive to capturing the transition between soluble and insoluble phases compared to MTBR-tau354 (MTBR-354 3R/4R core) that is buried within the core region with more rigid structure and less accessibility for truncation or release. Future work including AD and non-AD tauopathies may provide new insights into whether the soluble MTBR-tau299/MTBR-tau354 (MTBR-299 4R / MTBR-354 3R/4R core) ratio may distinguish between different disease or stage specific NFT pathologies, particularly as it relates to 4R-tau splicing isoform.
The patterns identified among different levels of MTBR-tau species, cognitive measures and MRI measures of neurodegeneration may indicate that these MTBR-tau species are identifying unique information about tau in the process of the AD pathological cascade. For instance, it has been implicated that the predominant tau splicing isoforms in AD NFT transition from 4R tau splicing isoform to 3R tau splicing isoform with AD progression55–57. Immunostaining studies show that 4R tau-positive NFT are dominant during the transition from pretangles to mature NFT, while 3R tau-positive tangles are predominant at the mature NFT stage in relatively late stage of disease. Therefore, we hypothesized that the annual change of the 3R-tau specific MTBR-tau306 (MTBR-306 3R) might have a stronger association with cognitive decline. These findings were supported by the data, particularly in DIAD MCs within the presymptomatic stage. Similarly, for hippocampal atrophy, it was primarily during the presymptomatic phase where the changes in MTBR-tau had the greatest association with the rate of atrophy, for both MTBR-306 3R and MTBR-299 4R, prior to the point when significant tau PET signal increased. Further study is necessary to identify the pathological tau species involved in each step.
Lastly, CSF MTBR-tau measures may provide important pharmacodynamic and efficacy readout and insights into target regions for tau-therapeutics. Specifically, the E2814 antibodies used to capture these species make up the backbone of tau-targeting immunotherapy currently in phase I studies and planned for the phase II studies in asymptomatic and symptomatic DIAD (NCT04971733, NCT01760005). Our results provide a dynamic map of the changes of CSF soluble MTBR-tau species in DIAD and a therapeutic marker of drug engagement across the disease spectrum. It remains to be understood how targeting the extracellular reservoir of these species by E2814 or related immunotherapies will translate to clinical efficacy, but our study and related work26,36 will provide a more precise mechanism for testing therapeutic benefit of this approach. Further, the early elevation of MTBR-299 4R, MTBR-306 3R and MTBR-354 3R/4R core species identified in this study strongly supports targeting presymptomatic populations, particularly if these soluble species are key to the transsynaptic spread of tau as a mechanism for AD-related tau propagation and seeding45. As it is also becoming clear that many soluble tau-related biomarkers begin to change with amyloid pathology, these MTBR-tau measures may also provide information on the response to amyloid -targeting therapies as well.
Given the small number of participants, there are limits to the interpretation of these results, particularly the longitudinal estimates. Additionally, replication studies with other preparation methods (e.g., immunoprecipitation using other antibodies or antibody-independent extractions) will be required to compare to the serial immunoprecipitations used for this study, as it is likely these other methods will provide additional information on soluble MTBR. However, by measuring multiple MTBR-tau species in different regions simultaneously, these preliminary findings do illustrate that the trajectories of specific soluble MTBR-tau levels identified in DIAD CSF are reflecting the evolution of brain Aß and tau aggregates (NFT). Likewise, although this study is specific to DIAD, our previous work in sAD, both from CSF and insoluble tau from brain extractions, has identified important similarities26.
In summary, we have provided strong evidence that the region of the tau protein that makes up a core of NFT can be measured in CSF. In doing so, this study highlights the growing appreciation of the dynamic nature of the tau post-translational modifications and the important differences between the soluble and insoluble components of tau in disease progression. A comprehensive understanding of tau in AD will be critical to targeting it as a potential disease modifying process in AD.
Summary for Social Media.
-
If you and/or a co-author has a Twitter handle that you would like to be tagged, please enter it here. (format: @AUTHORSHANDLE).
@WashUNeurology
-
What is the current knowledge on the topic? (one to two sentences)
The microtubule binding region of tau (MTBR-tau) makes up the core of neurofibrillary tangles (NFT), and it was recently reported that the soluble form is present and increases in cerebrospinal fluid from sporadic Alzheimer disease patients.
-
What question did this study address? (one to two sentences)
Does the soluble MTBR-tau in cerebrospinal fluid change before symptoms develop in dominantly inherited Alzheimer disease? Is the change associated with the NFT pathology and the downstream neurodegeneration?
-
What does this study add to our knowledge? (one to two sentences)
CSF soluble MTBR-tau begins to change up to a decade before tau pathology and clinical symptoms develop in dominantly inherited Alzheimer disease and it tracks disease progression and tau pathology in terms of tau-PET.
-
How might this potentially impact on the practice of neurology? (one to two sentences)
These results suggest that targeting tau prior to the development of symptoms or NFT pathology may be necessary for AD prevention. The development of methods to measure soluble MTBR-tau could provide an important mechanism for tracking tau-targeted therapies.
Acknowledgements
Data collection and sharing for this project was supported by The Dominantly Inherited Alzheimer Network (DIAN, U19AG032438) funded by the National Institute on Aging (NIA),the Alzheimer’s Association (SG-20-690363-DIAN), the German Center for Neurodegenerative Diseases (DZNE), Raul Carrea Institute for Neurological Research (FLENI), Partial support by the Research and Development Grants for Dementia from Japan Agency for Medical Research and Development, AMED, and the Korea Health Technology R&D Project through the Korea Health Industry Development Institute (KHIDI), Spanish Institute of Health Carlos III (ISCIII), Canadian Institutes of Health Research (CIHR), Canadian Consortium of Neurodegeneration and Aging, Brain Canada Foundation, and Fonds de Recherche du Québec – Santé. The performance of the mass spectrometry analyses was supported by Eisai, the Alzheimer’s Association Research Fellowship (AARF-16-443265, N.R.B.) and the NIA (K23 AG046363, EM). This manuscript has been reviewed by DIAN Study investigators for scientific content and consistency of data interpretation with previous DIAN Study publications. We acknowledge the altruism of the participants and their families and contributions of the DIAN research and support staff at each of the participating sites for their contributions to this study.
Footnotes
Potential Conflict of Interests:
There are several inventions that have been filed by Washington University for patents, including “Methods of diagnosing AD with phosphorylation changes” and “Methods to detect MTBR-tau isoforms and use”. These intellectual properties owned by Washington University can be or are licensed and some licensing income may be distributed to Drs. Barthelemy, Bateman, Horie, McDade and Sato and other inventors. These intellectual properties being licensed by Washington University from C2N and currently being utilized in our research have been reviewed by the Washington University COI and ICOI committees.
All co-inventors, including some lab members, the University, and Drs. Barthelemy, Bateman, Horie, McDade and Sato could receive part of the profits from any sales of these tests by C2N, which is in the process of licensing or has licensed some IP from the University. These activities have been reviewed by Washington University’s (WU) Conflicts of Interest Review Committee in accordance with WU’s Research Conflicts of Interest Policy and WU’s Institutional Conflict of Interest Review Committee in accordance with WU’s Institutional Conflict of Interest Policy.
K.H. is an Eisai-sponsored voluntary research associate professor at Washington University and has received salary from Eisai.
RJB has received research funding from Avid Radiopharmaceuticals, Janssen, Roche/Genentech, Eli Lilly, Eisai, Biogen, AbbVie, Bristol Myers Squibb, and Novartis. Washington University and RJB have equity ownership interest in C2N Diagnostics and receive income based on technology (stable isotope labeling kinetics, blood plasma assay, and methods of diagnosing AD with phosphorylation changes) licensed by Washington University to C2N Diagnostics. RJB receives income from C2N Diagnostics for serving on the scientific advisory board. RJB serves on the Roche Gantenerumab Steering Committee as an unpaid member.
JL reports speaker fees from Bayer Vital, Biogen and Roche, consulting fees from Axon Neuroscience and Biogen, author fees from Thieme medical publishers and W. Kohlhammer GmbH medical publishers, non-financial support from Abbvie and compensation for duty as part-time CMO from MODAG and being beneficiary of the phantom share program of MODAG GmbH, outside the submitted work.
Data Availability:
The data that support the findings of this study can be requested from DIAN at https://dian.wustl.edu/our-research/observational-study/dian-observational-study-investigator-resources/.
References:
- 1.Dam T, Boxer AL, Golbe LI, et al. Safety and efficacy of anti-tau monoclonal antibody gosuranemab in progressive supranuclear palsy: a phase 2, randomized, placebo-controlled trial. Nat Med 2021;27(8):1451–1457. doi: 10.1038/s41591-021-01455-x [DOI] [PubMed] [Google Scholar]
- 2.Novak P, Kovacech B, Katina S, et al. ADAMANT: a placebo-controlled randomized phase 2 study of AADvac1, an active immunotherapy against pathological tau in Alzheimer’s disease. Nat Aging 2021;1(6):521–534. doi: 10.1038/s43587-021-00070-2 [DOI] [PubMed] [Google Scholar]
- 3.Höglinger GU, Litvan I, Mendonca N, et al. Safety and efficacy of tilavonemab in progressive supranuclear palsy: a phase 2, randomised, placebo-controlled trial. Lancet Neurol 2021;20(3):182–192. doi: 10.1016/S1474-4422(20)30489-0 [DOI] [PubMed] [Google Scholar]
- 4.Bateman RJ, Klunk WE. Measuring target effect of proposed disease-modifying therapies in Alzheimer’s disease. Neurotherapeutics 2008;5(3):381–390. doi: 10.1016/j.nurt.2008.05.009 [DOI] [PMC free article] [PubMed] [Google Scholar]
- 5.Barthélemy NR, Li Y, Joseph-Mathurin N, et al. A soluble phosphorylated tau signature links tau, amyloid and the evolution of stages of dominantly inherited Alzheimer’s disease. Nat Med 2020;26(3):398–407. doi: 10.1038/s41591-020-0781-z [DOI] [PMC free article] [PubMed] [Google Scholar]
- 6.Barthélemy NR, Horie K, Sato C, Bateman RJ. Blood plasma phosphorylated-tau isoforms track CNS change in Alzheimer’s disease. Journal of Experimental Medicine 2020;217(11). doi: 10.1084/jem.20200861 [DOI] [PMC free article] [PubMed] [Google Scholar]
- 7.Barthélemy NR, Bateman RJ, Hirtz C, et al. Cerebrospinal fluid phospho-tau T217 outperforms T181 as a biomarker for the differential diagnosis of Alzheimer’s disease and PET amyloid-positive patient identification. Alzheimers Res Ther 2020;12(1). doi: 10.1186/s13195-020-00596-4 [DOI] [PMC free article] [PubMed] [Google Scholar]
- 8.Gordon BA, Blazey TM, Christensen J, et al. Tau PET in autosomal dominant Alzheimer’s disease: relationship with cognition, dementia and other biomarkers. Brain 2019;142(4). doi: 10.1093/brain/awz019 [DOI] [PMC free article] [PubMed] [Google Scholar]
- 9.Thijssen EH, la Joie R, Wolf A, et al. Diagnostic value of plasma phosphorylated tau181 in Alzheimer’s disease and frontotemporal lobar degeneration. Nat Med 2020;26(3):387–397. doi: 10.1038/s41591-020-0762-2 [DOI] [PMC free article] [PubMed] [Google Scholar]
- 10.Johnson KA, Schultz A, Betensky RA, et al. Tau positron emission tomographic imaging in aging and early Alzheimer disease. Ann Neurol 2016;79(1):110–119. doi: 10.1002/ana.24546 [DOI] [PMC free article] [PubMed] [Google Scholar]
- 11.Janelidze S, Mattsson N, Palmqvist S, et al. Plasma P-tau181 in Alzheimer’s disease: relationship to other biomarkers, differential diagnosis, and longitudinal progression to Alzheimer’s dementia. Nat Med Published online 2020:1–8. doi: 10.1038/s41591-020-0755-1 [DOI] [PubMed] [Google Scholar]
- 12.Palmqvist S, Janelidze S, Quiroz YT, et al. Discriminative Accuracy of Plasma Phospho-tau217 for Alzheimer Disease vs Other Neurodegenerative Disorders. JAMA - Journal of the American Medical Association 2020;324(8):772–781. doi: 10.1001/jama.2020.12134 [DOI] [PMC free article] [PubMed] [Google Scholar]
- 13.Janelidze S, Stomrud E, Smith R, et al. Cerebrospinal fluid p-tau217 performs better than p-tau181 as a biomarker of Alzheimer’s disease. Nat Commun 2020;11(1):1683. doi: 10.1038/s41467-020-15436-0 [DOI] [PMC free article] [PubMed] [Google Scholar]
- 14.Janelidze S, Berron D, Smith R, et al. Associations of Plasma Phospho-Tau217 Levels With Tau Positron Emission Tomography in Early Alzheimer Disease. JAMA Neurol 2021;78(2):149–156. doi: 10.1001/jamaneurol.2020.4201 [DOI] [PMC free article] [PubMed] [Google Scholar]
- 15.Sato C, Barthélemy NR, Mawuenyega KG, et al. Tau Kinetics in Neurons and the Human Central Nervous System. Neuron 2018;97(6):1284–1298.e7. doi: 10.1016/j.neuron.2018.02.015 [DOI] [PMC free article] [PubMed] [Google Scholar]
- 16.Barthélemy NR, Toth B, Manser PT, et al. Site-Specific Cerebrospinal Fluid Tau Hyperphosphorylation in Response to Alzheimer’s Disease Brain Pathology: Not All Tau Phospho-Sites are Hyperphosphorylated. Journal of Alzheimer’s Disease 2022;85:415–429. doi: 10.3233/JAD-210677 [DOI] [PMC free article] [PubMed] [Google Scholar]
- 17.Ossenkoppele R, Reimand J, Smith R, et al. Tau PET correlates with different Alzheimer’s disease-related features compared to CSF and plasma p-tau biomarkers. EMBO Mol Med 2021;13(8):e14398. doi: 10.15252/emmm.202114398 [DOI] [PMC free article] [PubMed] [Google Scholar]
- 18.Milà-Alomà M, Ashton NJ, Shekari M, et al. Plasma p-tau231 and p-tau217 as state markers of amyloid-β pathology in preclinical Alzheimer’s disease. Nat Med 2022;28(9):1797–1801. doi: 10.1038/s41591-022-01925-w [DOI] [PMC free article] [PubMed] [Google Scholar]
- 19.Schelle J, Häsler LM, Göpfert JC, et al. Prevention of tau increase in cerebrospinal fluid of APP transgenic mice suggests downstream effect of BACE1 inhibition. Alzheimer’s and Dementia 2017;13(6):701–709. doi: 10.1016/j.jalz.2016.09.005 [DOI] [PubMed] [Google Scholar]
- 20.Kaeser SA, Häsler LM, Lamber M, et al. CSF p-tau increase in response to Aβ-type and Danish-type cerebral amyloidosis and in the absence of neurofibrillary tangles. Acta Neuropathol 2022;143(2):287–290. [DOI] [PMC free article] [PubMed] [Google Scholar]
- 21.Bennett DA, Schneider JA, Wilson RS, Bienias JL, Arnold SE. Neurofibrillary Tangles Mediate the Association of Amyloid Load With Clinical Alzheimer Disease and Level of Cognitive Function. Arch Neurol 2004;61(3):378–384. doi: 10.1001/archneur.61.3.378 [DOI] [PubMed] [Google Scholar]
- 22.Nelson PT, Alafuzoff I, Bigio EH, et al. Correlation of Alzheimer Disease Neuropathologic Changes With Cognitive Status: A Review of the Literature. J Neuropathol Exp Neurol 2012;71(5):362–381. doi: 10.1097/NEN.0b013e31825018f7 [DOI] [PMC free article] [PubMed] [Google Scholar]
- 23.Braak H, Braak E. Staging of alzheimer’s disease-related neurofibrillary changes. Neurobiol Aging 1995;16(3):271–278. doi: 10.1016/0197-4580(95)00021-6 [DOI] [PubMed] [Google Scholar]
- 24.Brier MR, Gordon B, Friedrichsen K, et al. Tau and Aβ imaging, CSF measures, and cognition in Alzheimer’s disease. Sci Transl Med 2016;8(338):338ra66. doi: 10.1126/scitranslmed.aaf2362 [DOI] [PMC free article] [PubMed] [Google Scholar]
- 25.Ossenkoppele R, Schonhaut DR, Schöll M, et al. Tau PET patterns mirror clinical and neuroanatomical variability in Alzheimer’s disease. Brain 2016;139(5):1551–1567. doi: 10.1093/brain/aww027 [DOI] [PMC free article] [PubMed] [Google Scholar]
- 26.Horie K, Barthélemy NR, Sato C, Bateman RJ. CSF tau microtubule binding region identifies tau tangle and clinical stages of Alzheimer’s disease. Brain 2021;144(2):515–527. doi: 10.1093/brain/awaa373 [DOI] [PMC free article] [PubMed] [Google Scholar]
- 27.Wesseling H, Mair W, Kumar M, et al. Tau PTM Profiles Identify Patient Heterogeneity and Stages of Alzheimer’s Disease. Cell 2020;183(6):1699–1713.e13. doi: 10.1016/j.cell.2020.10.029 [DOI] [PMC free article] [PubMed] [Google Scholar]
- 28.Morris JC, Bateman RJ, Benzinger TL, Cairns NJ, Fagan AM, Ghetti B, Goate AM, Holtzman DM, Klunk WE, McDade E, Marcus DS, Martins RN, Masters CL, Mayeux R, Oliver A, Quaid K, Ringman JM, Rossor MN, Salloway S, Schofield PR, Selsor NJ, Sperling RA, Weiner APS. Developing an international network for Alzheimer research: The Dominantly Inherited Alzheimer Network. Clin Investig (Lond) 1;2(10):975. doi: 10.4155/cli.12.93. [DOI] [PMC free article] [PubMed] [Google Scholar]
- 29.Bateman RJ, Xiong C, Benzinger TLS, et al. Clinical and biomarker changes in dominantly inherited Alzheimer’s disease. N Engl J Med 2012;367(9):795–804. doi: 10.1056/NEJMoa1202753 [DOI] [PMC free article] [PubMed] [Google Scholar]
- 30.Ryman DC, Acosta-Baena N, Aisen PS, et al. Symptom onset in autosomal dominant Alzheimer disease: a systematic review and meta-analysis. Neurology 2014;83(3):253–260. doi: 10.1212/WNL.0000000000000596 [DOI] [PMC free article] [PubMed] [Google Scholar]
- 31.Morris JC. The clinical dementia rating (cdr): Current version and scoring rules. Neurology 1993;43(11). doi: 10.1212/wnl.43.11.2412-a [DOI] [PubMed] [Google Scholar]
- 32.Storandt M, Balota DA, Aschenbrenner AJ, Morris JC. Clinical and psychological characteristics of the initial cohort of the Dominantly Inherited Alzheimer Network (DIAN). Neuropsychology 2014;28(1):19–29. doi: 10.1037/neu0000030 [DOI] [PMC free article] [PubMed] [Google Scholar]
- 33.Bateman RJ, Benzinger TL, Berry S, et al. The DIAN-TU Next Generation Alzheimer’s prevention trial: Adaptive design and disease progression model. Alzheimer’s and Dementia 2017;13(1). doi: 10.1016/j.jalz.2016.07.005 [DOI] [PMC free article] [PubMed] [Google Scholar]
- 34.Barthélemy NR, Saef B, Li Y, et al. CSF tau phosphorylation at T217 and T205 are improved biomarkers of amyloid and tau pathology in Alzheimer disease. Research Gate Published online 2022. doi: 10.21203/rs.3.rs-2175929/v1 [DOI] [PMC free article] [PubMed]
- 35.Janelidze S, Bali D, Ashton NJ, et al. Head-to-head comparison of 10 plasma phospho-tau assays in prodromal Alzheimer’s disease. Brain Published online September 10, 2022:awac333. doi: 10.1093/brain/awac333 [DOI] [PMC free article] [PubMed]
- 36.Roberts M, Sevastou I, Imaizumi Y, et al. Pre-clinical characterisation of E2814, a high-affinity antibody targeting the microtubule-binding repeat domain of tau for passive immunotherapy in Alzheimer’s disease. Acta Neuropathol Commun 2020;8(1):13. doi: 10.1186/s40478-020-0884-2 [DOI] [PMC free article] [PubMed] [Google Scholar]
- 37.Horie K, Barthélemy NR, Mallipeddi N, et al. Regional correlation of biochemical measures of amyloid and tau phosphorylation in the brain. Acta Neuropathol Commun 2020;8(1):149. doi: 10.1186/s40478-020-01019-z [DOI] [PMC free article] [PubMed] [Google Scholar]
- 38.Benzinger TLS, Blazey T, Jack CR, et al. Regional variability of imaging biomarkers in autosomal dominant Alzheimer’s disease. Proc Natl Acad Sci U S A 2013;110(47). doi: 10.1073/pnas.1317918110 [DOI] [PMC free article] [PubMed] [Google Scholar]
- 39.Gordon BA, Blazey TM, Su Y, et al. Spatial patterns of neuroimaging biomarker change in individuals from families with autosomal dominant Alzheimer’s disease: a longitudinal study. Lancet Neurol 2018;17(3):241–250. doi: 10.1016/S1474-4422(18)30028-0 [DOI] [PMC free article] [PubMed] [Google Scholar]
- 40.McDade E, Wang G, Gordon BA, et al. Longitudinal cognitive and biomarker changes in dominantly inherited Alzheimer disease. Neurology 2018;91(14):e1295–e1306. doi: 10.1212/WNL.0000000000006277 [DOI] [PMC free article] [PubMed] [Google Scholar]
- 41.Su Y, Blazey TM, Snyder AZ, et al. Partial volume correction in quantitative amyloid imaging. Neuroimage 2015;107:55–64. doi: 10.1016/j.neuroimage.2014.11.058 [DOI] [PMC free article] [PubMed] [Google Scholar]
- 42.Benjamini Y, Hochberg Y, Benjamini, Yoav HY. Benjamini and Y FDR.pdf. Journal of the Royal Statistical Society Series B (Methodological) 1995;57(1). [Google Scholar]
- 43.Cicognola C, Brinkmalm G, Wahlgren J, et al. Novel tau fragments in cerebrospinal fluid: relation to tangle pathology and cognitive decline in Alzheimer’s disease. Acta Neuropathol 2019;137(2):279–296. doi: 10.1007/s00401-018-1948-2 [DOI] [PMC free article] [PubMed] [Google Scholar]
- 44.Fitzpatrick AWP, Falcon B, He S, et al. Cryo-EM structures of tau filaments from Alzheimer’s disease. Nature 2017;547(7662):185–190. doi: 10.1038/nature23002 [DOI] [PMC free article] [PubMed] [Google Scholar]
- 45.Carlomagno Y, Manne S, DeTure M, et al. The AD tau core spontaneously self-assembles and recruits full-length tau to filaments. Cell Rep 2021;34(11):108843. doi: 10.1016/j.celrep.2021.108843 [DOI] [PMC free article] [PubMed] [Google Scholar]
- 46.la Joie R, Visani A v, Baker SL, et al. Prospective longitudinal atrophy in Alzheimer’s disease correlates with the intensity and topography of baseline tau-PET. Sci Transl Med 2020;12(524). doi: 10.1126/scitranslmed.aau5732 [DOI] [PMC free article] [PubMed] [Google Scholar]
- 47.Xia C, Makaretz SJ, Caso C, et al. Association of In Vivo [18F]AV-1451 Tau PET Imaging Results With Cortical Atrophy and Symptoms in Typical and Atypical Alzheimer Disease. JAMA Neurol 2017;74(4):427–436. doi: 10.1001/jamaneurol.2016.5755 [DOI] [PMC free article] [PubMed] [Google Scholar]
- 48.von Bergen M, Friedhoff P, Biernat J, Heberle J, Mandelkow EM, Mandelkow E. Assembly of tau protein into Alzheimer paired helical filaments depends on a local sequence motif (306VQIVYK311) forming tau structure. Proceedings of the National Academy of Sciences 2000;97(10):5129–5134. doi: 10.1073/pnas.97.10.5129 [DOI] [PMC free article] [PubMed] [Google Scholar]
- 49.Kadavath H, Hofele R v, Biernat J, et al. Tau stabilizes microtubules by binding at the interface between tubulin heterodimers. Proceedings of the National Academy of Sciences 2015;112(24):7501–7506. doi: 10.1073/pnas.1504081112 [DOI] [PMC free article] [PubMed] [Google Scholar]
- 50.Adamcik J, Sánchez-Ferrer A, Ait-Bouziad N, Reynolds NP, Lashuel HA, Mezzenga R. Microtubule-Binding R3 Fragment from Tau Self-Assembles into Giant Multistranded Amyloid Ribbons. Angew Chem Int Ed Engl 2016;55(2):618–622. doi: 10.1002/anie.201508968 [DOI] [PubMed] [Google Scholar]
- 51.Falcon B, Cavallini A, Angers R, et al. Conformation Determines the Seeding Potencies of Native and Recombinant Tau Aggregates. Journal of Biological Chemistry 2015;290(2):1049–1065. doi: 10.1074/jbc.M114.589309 [DOI] [PMC free article] [PubMed] [Google Scholar]
- 52.Simrén J, Brum WS, Ashton NJ, et al. CSF tau368/total-tau ratio reflects cognitive performance and neocortical tau better compared to p-tau181 and p-tau217 in cognitively impaired individuals. Alzheimers Res Ther 2022;14(1):192. doi: 10.1186/s13195-022-01142-0 [DOI] [PMC free article] [PubMed] [Google Scholar]
- 53.Blennow K, Chen C, Cicognola C, et al. Cerebrospinal fluid tau fragment correlates with tau PET: a candidate biomarker for tangle pathology. Brain 2020;143(2):650–660. doi: 10.1093/brain/awz346 [DOI] [PMC free article] [PubMed] [Google Scholar]
- 54.Croft CL, Goodwin MS, Ryu DH, et al. Photodynamic studies reveal rapid formation and appreciable turnover of tau inclusions. Acta Neuropathol 2021;141(3):359–381. doi: 10.1007/s00401-021-02264-9 [DOI] [PMC free article] [PubMed] [Google Scholar]
- 55.Cherry JD, Esnault CD, Baucom ZH, et al. Tau isoforms are differentially expressed across the hippocampus in chronic traumatic encephalopathy and Alzheimer’s disease. Acta Neuropathol Commun 2021;9(1):86. doi: 10.1186/s40478-021-01189-4 [DOI] [PMC free article] [PubMed] [Google Scholar]
- 56.Uchihara T, Hara M, Nakamura A, Hirokawa K. Tangle evolution linked to differential 3- and 4-repeat tau isoform deposition: a double immunofluorolabeling study using two monoclonal antibodies. Histochem Cell Biol 2012;137(2):261–267. doi: 10.1007/s00418-011-0891-2 [DOI] [PubMed] [Google Scholar]
- 57.Hara M, Hirokawa K, Kamei S, Uchihara T. Isoform transition from four-repeat to three-repeat tau underlies dendrosomatic and regional progression of neurofibrillary pathology. Acta Neuropathol 2013;125(4):565–579. doi: 10.1007/s00401-013-1097-6 [DOI] [PubMed] [Google Scholar]
Associated Data
This section collects any data citations, data availability statements, or supplementary materials included in this article.
Data Availability Statement
The data that support the findings of this study can be requested from DIAN at https://dian.wustl.edu/our-research/observational-study/dian-observational-study-investigator-resources/.