


Abstract
Expressed sequence tags (ESTs) have provided a first glimpse of the collection of transcribed sequences in a variety of organisms. However, a careful analysis of this sequence data can provide significant additional functional, structural and evolutionary information. Our analysis of the public EST sequences, available through the TIGR Gene Indices (TGI; http://www.tigr.org/tdb/tdb.html ), is an attempt to identify the genes represented by that data and to provide additional information regarding those genes. Gene Indices are constructed for selected organisms by first clustering, then assembling EST and annotated gene sequences from GenBank. This process produces a set of unique, high-fidelity virtual transcripts, or tentative consensus (TC) sequences. The TC sequences can be used to provide putative genes with functional annotation, to link the transcripts to mapping and genomic sequence data, and to provide links between orthologous and paralogous genes.
INTRODUCTION
Sequencing of expressed sequence tags (ESTs) (1) has resulted in the rapid identification of expressed genes. ESTs are single-pass, partial sequences of cDNA clones and they have been used extensively for gene discovery and mapping in humans (2–4) and other organisms (5–8). The EST approach has been widely adopted; there are nearly 3 000 000 EST sequences in the dbEST division of GenBank. ESTs represent 71% of all GenBank entries and 40% of the individual nucleotides (9). However, the partial gene sequences that ESTs represent are often difficult to use effectively. The value of ESTs is greatly enhanced if they are used to construct a high-fidelity set of non-redundant transcripts. These can be used for more extensive functional annotation, and integrated with available mapping and sequencing data. The TIGR Gene Indices provide such an analysis for humans, experimental models of human disease such as mouse and rat, valuable crop plants, and other important experimental organisms sampled extensively by EST sequencing. TIGR Gene Indices are maintained for 10 of the 14 organisms most heavily sampled by public EST projects; an 11th, the Potato Gene Index, is planned when sequence data become available early in 2000. The current state of EST sequencing and a summary of the available TIGR Gene Indices can be found in Table 1.
Table 1. EST sequence entries from dbEST as of August 20, 1999 for the most heavily sampled organisms with the corresponding TIGR Gene Indices and their most recent release dates.
| Species | Entries | TIGR Gene Index | Release date |
|---|---|---|---|
| Homo sapiens (human) | 1 548 327 | HGI 5.0 | September 1999 |
| Mus musculus + domesticus (mouse) | 688 084 | MGI 2.0 | February 1999 |
| Rattus sp. (rat) | 124 323 | RGI 4.0 | September 1999 |
| Caenorhabditis elegans (nematode) | 100 845 | ||
| Drosophila melanogaster (fruit fly) | 86 061 | DGI 1.1 | August 1999 |
| Oryza sativa (rice) | 46 268 | OGI 2.0 | June 1999 |
| Arabidopsis thaliana (thale cress) | 37 746 | AtGI 2.0 | August 1999 |
| Danio rerio (zebrafish) | 34 833 | ZGI 3.0 | September 1999 |
| Zea mays (maize) | 29 209 | ZmGI 1.0 | October 1999 |
| Lycopersicon esculentum (tomato) | 26 255 | LGI 1.2 | August 1999 |
| Dictyostelium discoideum | 19 182 | ||
| Brugia malayi (parasitic nematode) | 18 426 | ||
| Glycine max (soybean) | 17 738 | GmGI 1.0 | September 1999 |
| Emericella nidulans (Aspergillus nidulans) | 12 993 | ||
| Solanum tuberosum L. (potato) | (pending) | (pending) | Spring 2000 |
| Total number of sequences: | 2 790 290 |
Together, these species represent >95% of the EST data in GenBank; TIGR’s current and planned Gene Indices will represent >90% of the available EST data. A significant potato EST sequencing project is about to begin and a Gene Index will be constructed when data are available.
The TIGR Gene Indices treat ESTs as elements of a transcriptome shotgun sequencing project. Sequences are first clustered and elements of a cluster are assembled to produce a high quality consensus sequence. Stringent overlap criteria are used to assemble EST sequences into tentative consensus sequences (TCs; tentative human consensus, THC, in the Human Gene Index). While the TIGR Gene Indices are in many ways complementary (10) to other gene indexing databases such as UniGene (11) and STACK (12), the clustering and high stringency approach offers a number of significant advantages over the alternatives. First, assembly provides a high confidence consensus to represent each transcript. Low quality, misclustered or chimeric sequences are identified and discarded during assembly and closely related but distinct transcript isoforms can be identified if sufficient sequence is available. Second, the consensus sequence produced is generally longer than the individual ESTs that comprise it, providing a resource that can be used more effectively for functional annotation. Third, TCs can be used more effectively than individual ESTs for annotation of genomic sequence. Finally, the TC sequences allow the integration of complex mapping data and links to genomic sequence data, as well as the identification of orthologous genes.
CONSTRUCTION OF THE GENE INDICES
The assembly of each TIGR Gene Index builds upon previous releases, incorporating new ESTs and annotated gene sequences deposited in dbEST and GenBank, respectively. The first step in the process is the construction of a database of annotated gene sequences. For each species-specific Gene Index, all sequences from GenBank are downloaded and CDS and CDS Join features for full-length genes and mRNA sequences are parsed from the records. For redundant entries, one representative is chosen, although links to alternative GenBank accession numbers are maintained. The annotation of these expressed transcript sequences (ET; alternatively, Human Transcript, HT, for human records) is checked for consistency and the records are loaded into the TIGR Expressed Gene Anatomy Database (EGAD; http://www.tigr.org/tdb/egad/egad.html ). ESTs are downloaded daily from dbEST, and cleaned to remove untrimmed vector, linker, ribosomal, mitochondrial, low quality and poly(A)/poly(T) sequences.
Cleaned ESTs, ET sequences from EGAD, TC sequences from the previous build and previously unclustered sequences (singletons) are compared pair-wise to identify overlaps. Sequences sharing a minimum of 95% identity over a 40 nt or longer region with fewer than 20 bases of mismatched sequence at either end are grouped into a cluster. Each cluster is then assembled separately. For TCs appearing in a cluster, component EST and ET sequences are downloaded and added to any new EST or ET sequences. Clustered sequences are then assembled using CAP3 (13), a sequence assembly program developed by Xiaoqiu Huang of Michigan Technical University. Assembly produces one or more consensus sequences for each cluster and rejects any chimeric, low-quality and non-overlapping sequences. Each cluster is assembled in the same fashion until the entire set has been exhausted. A second round of clustering and assembly, using only the newly constructed TC sequences as input, allows the identification and elimination of most redundancy introduced during the process. The resulting set of TCs is loaded into the appropriate species-specific Gene Index database for annotation.
Each Gene Index, consisting of the assembled TC sequences and singletons, is released through the TIGR web site. The TC presentation includes a FASTA-formatted consensus, a graphical representation of each component sequence within the TC, links to GenBank and other relevant records for each component sequence, and functional and mapping information where available.
INTEGRATION OF MAPPING DATA
Recently, the number of mapped ESTs has increased dramatically, largely due to the use of radiation hybrid (RH) mapping. The 1998 Gene Map of the Human Genome (14) represents the most ambitious effort to map human expressed sequences. Approximately 30 000 representative EST sequences were selected and passed to participating laboratories where PCR primers were designed, validated, scored on either the Stanford G3 (SG3) or the GeneBridge 4 (GB4) RH panels, and deposited in the Radiation Hybrid Database (RHdb). Some markers were scored in multiple labs in order to allow results from different panels to be integrated; in total, nearly 45 000 markers were scored. Maps generated for both RH panels were integrated by binning ESTs using dinucleotide repeat markers from the Généthon genetic map of the human genome as reference markers.
In the Human Gene Index, the THCs are assigned RH map locations using the e-PCR program developed by Schuler (15) (ftp://ncbi.nlm.nih.gov/pub/schuler/e-PCR/ ) which uses published primer sequences and amplicon size (ftp://ncbi.nlm.nih.gov/repository/genemap/Oct1998/ ) to electronically map markers onto the THC sequences. The resulting mapping data are included in our web-based THC presentation. Our analysis of the published mapping data suggests that the published map contains significantly fewer than 30 000 distinct genes as many THCs contain multiple, independently mapped markers. The complete THC-RH map data for the current release of the Human Gene Index are available at http://www.tigr.org/tdb/hgi/rh_map.html . One might argue that the presence of multiple markers within a THC suggests a mis-assembly. However, in >99% of the cases observed, multiple markers from the same THC map to the same chromosome and bin to consistent chromosomal locations. THCs containing multiple mapped markers with inconsistent locations occur at a rate approximately equivalent to the estimated mapping error rate at the various participating labs. This suggests that the Gene Index assembly process produces high-fidelity reconstructions of the transcribed sequences represented by the ESTs.
Integration of the THCs with RH mapping data allows the published map to be condensed and refined, providing a better estimate of the total number and distribution of mapped transcripts. As RH and physical mapping data from mouse and rat become available, we will perform similar analyses, integrating map positions for ESTs in those organisms with the TC sequences. These mapping data, together with information on orthologous genes, discussed in detail below, can be used to produce high-resolution synteny maps containing information for genes of both known and unknown function. Such maps will be invaluable for gene discovery, phylogenetic analysis and sequence annotation.
FUNCTIONAL ANNOTATION AND RELEASE
Functional annotation is simplified by the use of consensus sequences to represent each gene. Because assembly generally produces a consensus that is longer than its constituent sequences, the TCs are more likely to contain protein-coding sequences than individual ESTs. This increases the likelihood that database searches will provide assignment of putative gene function. The assembly process also facilitates the identification of distinct transcripts that differ only in splicing pattern and between related, but distinct members of gene families.
Following assembly, TCs are annotated to provide a provisional functional assignment. An assembly containing an ET is given the ET’s annotation. TCs that do not contain ETs are first searched against a non-redundant amino acid database and then against a DNA sequence database. High-scoring hits are recorded and used for annotation. The resulting Gene Index is released through the TIGR web site (http://www.tigr.org/tbd/tdb.html ); an example THC from the Human Gene Index is shown in Figure 1. Gene Indices can be searched by TC number, the GenBank accession number of any EST contained within the dataset, or any ET used to build the Index. Users can perform a tissue-based search in which the library information in EST records is used to generate an ‘electronic northern blot’, identifying the tissue-specificity of expression based on the relative EST abundance. DNA and protein sequences can also be used to search the Gene Indices using WU-BLAST (http://www.tigr.org/cgi-bin/BlastSearch/blast_tgi.cgi ), a gapped BLAST program developed by Warren Gish (Washington University, St Louis).
Figure 1.
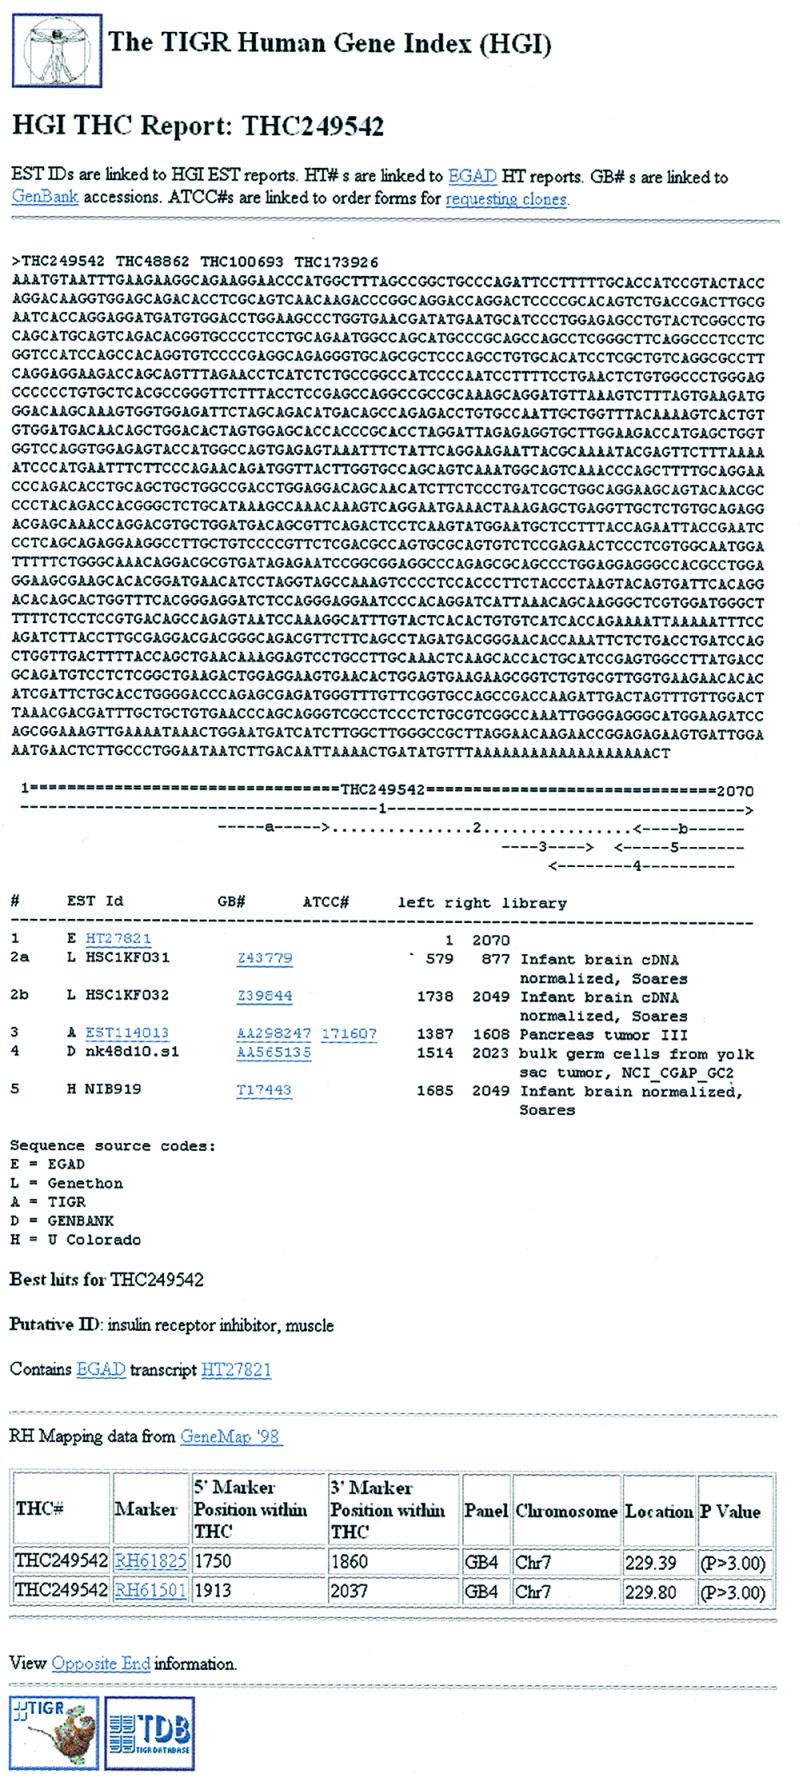
An example THC from the Human Gene Index. The consensus sequence is presented in FASTA format below which the locations of the gene sequence (HT27821; insulin receptor inhibitor, muscle) and ESTs that comprise the assembly are shown with their respective locations within the assembly. Links are provided to GenBank records, internal data for all ESTs sequenced at TIGR and to clones available through the ATCC. This THC has been assigned a putative ID of ‘insulin receptor inhibitor, muscle’ as it contains HT27821, an expressed sequence constructed from GenBank CDS features and contained within the EGAD database. This THC also includes Radiation Hybrid mapping data derived from Gene Map ’98 (14).
HERITABILITY: VERSIONING AND ANNOTATION
One important feature of the Gene Indices is that they maintain heritability—the ability to effectively track assemblies across releases. The TC assemblies are maintained within Sybase relational databases. Each time they are reassembled, novel assemblies, caused by either the joining or splitting of previous TCs, are assigned a new, unique TC identifier. Previously used identifiers are never recycled and information regarding the previous assemblies is never lost. Database queries using a TC identifier from a previous build return the most current incarnation of that assembly. This allows assemblies to evolve as more data are available while providing tracking from build to build and maintaining functional assignments across multiple releases.
INTEGRATION OF PREDICTED GENES FROM GENOMIC SEQUENCING
One of the challenges facing bioinformatics during the next few years is the increasing quantity of data from genomic sequencing projects. The revised plan for the Human Genome Project calls for a ‘working draft’ of the human sequence in 2000 with the completed sequence in 2001. Annotation of the finished sequence should provide preliminary identification of the estimated 80 000–100 000 human genes. Already, gene predictions exist for nearly 6600 genes from the completed sequencing of Saccharomyces cerevisiae and 15 000 genes from Caenorhabditis elegans, and genome sequencing in a variety of other organisms, including rice, Arabidopsis, Drosophila and mouse are progressing rapidly.
Predicted transcripts are an important first approximation of the genes encoded in these organisms, but these are likely to evolve significantly as more experimental data become available. While predictions cannot be treated on an equal footing with well-annotated gene sequences in GenBank, incorporation of the predictions in any transcript analysis will be important for providing links between ESTs and the genomic sequences, as well as for providing data needed to improve and validate gene prediction methods.
We investigated the possibility of including Predicted Transcripts (PTs) in Gene Index construction using the Arabidopsis thaliana chromosome 2 sequencing project as a model. Predicted transcripts that were annotated based on EST hits were downloaded and added to the EST and ET sequences used to build the AtGI. The addition of the 1158 PTs resulted in an increased number of TC sequences and a decreased number of singleton ESTs and ETs. It also allowed the TC and genomic sequences to be directly linked. This allows users of the genomic sequence to identify clones encoding genes of potential interest and also allows users of the AtGI to consider transcripts in a genomic context. The result of including the PTs is summarized in Table 2; AtGI release 2.0, which includes the predicted transcript sequences, is available at http://www.tigr.org/tdb/agi/agi.html
Table 2. The effect of including predicted transcripts (PTs) from genomic sequence.
| Starting ESTs | Starting ETs | Starting PTs | TCs | Singleton ESTs | Singleton ETs | Singleton PTs | |
|---|---|---|---|---|---|---|---|
| AtGI | 37 070 | 2 288 | 0 | 5 514 | 11 644 | 696 | 0 |
| AtGI (with PTs) | 37 070 | 2 288 | 1 158 | 5 581 | 10 237 | 683 | 44 |
| Difference | 67 | –1 407 | –13 |
The Arabidopsis Gene Index (AtGI) was built both without and with predicted coding sequences from the Chromosome 2 sequencing project. The addition of 1158 PTs increased the number of TCs while reducing both the singleton ESTs and ETs.
IDENTIFICATION OF ORTHOLOGUES AND PARALOGUES
The utility of cross-species comparisons using sequence data from distantly related organisms, such as yeast and humans, is without question (16,17). However, a comparison of more closely related organisms is necessary to identify and interpret the conservation of regulatory, non-coding sequences and will serve as an important resource for genomic sequence annotation. Human, mouse and rat represent ideal organisms for comparative analysis. Mouse is the premier organism for the study of mammalian genetics and development while rat has been extensively used for physiological and pharmacological studies. Mouse and rat genome projects, involving genetic and physical mapping, EST sequencing and limited genomic sequencing, are underway (18,19). Cross-referencing rodent and human sequence and mapping data has a number of important applications, including the identification of orthologous genes (20).
Homologous genes can be separated into two classes, orthologues and paralogues. Orthologues are homologous genes that perform the same biological function in different species but that have diverged in sequence due to evolutionary separation between species; paralogues are homologous genes within a species that are the result of a gene duplication event within the lineage. The study of orthologues is of particular importance because it is assumed that these genes play similar developmental or physiological roles and, consequently, should share conserved functional and regulatory domains.
The most extensive analysis of orthologous genes is a study by Makalowski and Boguski (21) that analyzed 1880 rodent–human orthologue pairs: 1212 rat–human pairs, 1138 mouse–human pairs and 470 genes shared by all three species. While significant, this analysis samples fewer than 3% of the 80 000–100 000 genes in each of these organisms. The vast body of EST sequence data, which likely represents 20% (rat) to 80% (human) or more of the genes, was ignored. This is despite the fact that their analysis indicates that 3′UTR sequences, which comprise the majority of EST data, are sufficiently similar to identify orthologues: 71.0 ± 12.2% identity for mouse–human orthologues, 70.1 ± 11.4% for rat–human orthologues and 86.3 ± 8.9% for mouse–rat orthologues.
The TC sequences comprising the human, mouse and rat Gene Indices are an excellent resource for the identification of orthologues within the 2.2 million EST sequences from these organisms. The consensus sequences require fewer comparisons and their greater lengths make it more likely that orthologues can be found. We developed the TIGR Orthologous Gene Alignment (TOGA) database to represent orthologue sets and to provide links to the appropriate TCs in the Gene Indices (http://www.tigr.org/tdb/toga/toga.html ). Data from previous analyses, such as that of HOVERGEN (22) and Makalowski and Boguski (21), provide a starting point for defining orthologous sets for TCs containing ETs that can be used to populate the database. However, pair-wise comparisons of the TCs define both putative orthologues and paralogues, greatly increasing the utility of such a database.
USING THE TIGR GENE INDICES
Genes serve as a natural indexing scheme for genomes. Effectively using genomic resources for comparative studies will rely on an effective cross-referencing scheme to allow researchers to rapidly traverse from one genome to another. The TIGR Gene Indices represent an effort to provide such a resource by first attempting to catalogue the genes in a variety of organisms and then providing a mechanism to link to candidate orthologues in other species.
There are a variety of means by which a user might gain entry to the TIGR Gene Indices. For example, the radiation hybrid mapping data allows users to search for TC sequences that map to a candidate genomic region. Other users may search for TCs that appear to be expressed in a tissue-specific fashion or that contain ESTs from a particular disease state. However, the most common entry point for most users is the sequence search page (http://www.tigr.org/cgi-bin/BlastSearch/blast_tgi.cgi ). Both BLASTN and TBLASTN versions of the WU-BLAST package have been implemented allowing both DNA and protein queries to be used. Alignments to high scoring TCs and singleton ESTs in the organism searched are returned and clicking on the TC number or EST id will bring the user to an appropriate display of the sequence, similar to that shown in Figure 1. If there are links from the TC to candidate orthologues in the TOGA database, users can view the relationship, including sequence alignments, by clicking on the ‘View Candidate Orthologues’ button, which brings up the appropriate display from the TOGA database. From TOGA, users can examine TCs and the associated data in other organisms.
In addition to the Web interface, the TIGR Gene Indices are available as flat files. The TC consensus sequences are provided in a FASTA format file; EST content for each TC is specified in a separate file. Many users involved in the annotation of genomic sequence and in analysis of cDNA microarray data have found these to be particularly useful.
CONCLUSION
As the collection of gene sequences increases, we must develop strategies to organize and integrate these data. The TIGR Gene Indices represent the most comprehensive, publicly available analysis of EST sequences. They have proven invaluable for annotation of genomic sequence and for functional analysis of ESTs. The TCs are linked to available mapping data and we have developed a strategy to incorporate predicted genes from genomic sequencing projects. We have also developed a database to represent orthologues, allowing cross-species comparisons using the Gene Indices as a reference.
The TIGR Gene Indices are available via a free license for academic and non-profit use; commercial licenses are available for a fee. Parties interested in obtaining a license should visit http://www.tigr.org/tdb/license.html or write to license@tigr.org
Acknowledgments
ACKNOWLEDGEMENTS
The authors are indebted to Anna Glodek for her database development efforts. The authors also wish to thank Michael Heaney for database support, and Vadim Sapiro, Bruce Vincent, Billy Lee, Sonja Gregory and Lily Fu for computer system support.
REFERENCES
- 1.Adams M.D., Kelley,J.M., Gocayne,J.D., Dubnick,M., Polymeropoulos,M.H.M., Xiao,H., Merril,C.R., Wu,A., Olde,B., Moreno,R.F. et al. (1991) Science, 252, 1651–1656. [DOI] [PubMed] [Google Scholar]
- 2.Adams M.D., Kerlavage,A.R., Fleischmann,R.D., Fuldner,R.A., Bult,C.J., Lee,N.H., Kirkness,E.F., Weinstock,K.G., Gocayne,J.D., White,O. et al. (1995) Nature, 377 (suppl.), 3–174. [PubMed] [Google Scholar]
- 3.Polymeropoulos M.H., Xiao,H., Sikela,J.M., Adams,M.D. and Venter,J.C. (1993) Nature Genet., 4, 381–386. [DOI] [PubMed] [Google Scholar]
- 4.Schuler G.D., Boguski,M.S., Stewart,E.A., Stein,L.D., Gyapay,G., Rice,K., White,R.E., Rodriguez-Tome,P., Aggarwal,A., Bajorek,E. et al. (1996) Science, 274, 540–546. [PubMed] [Google Scholar]
- 5.McCombie W.R., Adams,M.D., Kelley,J.M., FitzGerald,M.G., Utterback,T.R., Khan,M., Dubnick,M., Kerlavage,A.R., Venter,J.C. and Fields,C. (1992) Nature Genet., 1, 124–131. [DOI] [PubMed] [Google Scholar]
- 6.Waterston R., Martin,C., Craxton,M., Hunyh,C., Coulson,A., Hillier,L., Durbin,R., Green,P., Shownkeen,R., Halloran,N. et al. (1992) Nature Genet., 1, 114–123. [DOI] [PubMed] [Google Scholar]
- 7.Collet C. and Joseph,R. (1994) Biochem. Genet., 32, 181–190. [DOI] [PubMed] [Google Scholar]
- 8.Rounsley S.D., Glodek,A., Sutton,G., Adams,M.D., Somerville,C.R., Venter,J.C. and Kerlavage,A.R. (1996) Plant Physiol., 112, 1177–1183. [DOI] [PMC free article] [PubMed] [Google Scholar]
- 9.Schuler G.D. (1997) J. Mol. Med., 75, 694–698. [DOI] [PubMed] [Google Scholar]
- 10.Bouck J., Yu,W., Gibbs,R. and Worley,K. (1999) Trends Genet., 15, 159–162. [DOI] [PubMed] [Google Scholar]
- 11.Boguski M.S. and Schuler,G.D. (1995) Nature Genet., 10, 369–371. [DOI] [PubMed] [Google Scholar]
- 12.Burke J., Wang,H., Hide,W. and Davison,D.B. (1998) Genome Res., 8, 276–290. [DOI] [PMC free article] [PubMed] [Google Scholar]
- 13.Huang X. and Madan,A. (1999) Genome Res., 9, 868–877. [DOI] [PMC free article] [PubMed] [Google Scholar]
- 14.Deloukas P., Schuler,G.D., Gyapay,G., Beasley,E.M., Soderlund,C., Rodriguez-Tome,P., Hui,L., Matise,T.C., McKusick,K.B., Beckmann,J.S. et al. (1998) Science, 282, 744–746. [DOI] [PubMed] [Google Scholar]
- 15.Schuler G.D. (1997) Genome Res., 7, 541–550. [DOI] [PMC free article] [PubMed] [Google Scholar]
- 16.Bassett D.E., Boguski,M.S. and Hieter,P. (1996) Nature, 379, 589–590. [DOI] [PubMed] [Google Scholar]
- 17.Bottstein D. and Cherry,J.M. (1997) Proc. Natl Acad. Sci. USA, 94, 5506–5507. [DOI] [PMC free article] [PubMed] [Google Scholar]
- 18.Camper S.A. and Meisler,M.H. (1997) Mamm. Genome, 8, 461–463. [DOI] [PubMed] [Google Scholar]
- 19.James M.R. and Lindpainter,K. (1997) Trends Genet., 13, 171–173. [DOI] [PubMed] [Google Scholar]
- 20.Fitch W.M. (1970) Syst. Zool., 19, 99–113. [PubMed] [Google Scholar]
- 21.Makalowski W. and Boguski,M.S. (1998) Proc. Natl Acad. Sci. USA, 95, 9407–9412. [DOI] [PMC free article] [PubMed] [Google Scholar]
- 22.Duret L., Mouchiroud,D. and Gouy,M. (1994) Nucleic Acids Res., 22, 2360–2365. [DOI] [PMC free article] [PubMed] [Google Scholar]