

Abstract
Alterations in the expression of genes encoding proteins involved in synapse formation, maturation and function are a hallmark of many neurodevelopmental and psychiatric disorders. For example, there is reduced neocortical expression of the MET receptor tyrosine kinase (MET) transcript and protein in autism spectrum disorder and Rett syndrome. Preclinical in vivo and in vitro models manipulating MET signaling reveal that the receptor modulates excitatory synapse development and maturation in select forebrain circuits. The molecular adaptations underlying the altered synaptic development remain unknown. We performed a comparative mass spectrometry analysis of synaptosomes generated from the neocortex of wild type and Met null mice during the peak of synaptogenesis (postnatal day 14; data are available from ProteomeXchange with identifier PXD033204). The analyses revealed broad disruption of the developing synaptic proteome in the absence of MET, consistent with the localization of MET protein in pre- and postsynaptic compartments, including proteins associated with the neocortical synaptic MET interactome and those encoded by syndromic and ASD risk genes. In addition to an overrepresentation of altered proteins associated with the SNARE complex, multiple proteins in the ubiquitin-proteasome system and associated with the synaptic vesicle, as well as proteins that regulate actin filament organization and synaptic vesicle exocytosis/endocytosis, were disrupted. Taken together, the proteomic changes are consistent with structural and functional changes observed following alterations in MET signaling. We hypothesize that the molecular adaptations following Met deletion may reflect a general mechanism that produces circuit-specific molecular changes due to loss or reduction of synaptic signaling proteins.
Keywords: Neocortex, iTRAQ proteomics, synaptosome, MET, developing brain
Introduction
Disruption of synaptic function represents a key point of convergence in the pathology underlying many neurodevelopmental and psychiatric disorders. Consistent with this, pathway analyses of postmortem human brain have revealed enrichment in altered expression of genes that encode proteins involved in synapse formation, maturation and function (e.g., (1–9)), including the MET receptor tyrosine kinase (MET). Specifically, there is reduced expression of MET transcript and/or protein in the postmortem temporal lobe of Autism Spectrum Disorder and Rett syndrome cases compared to age- and sex-matched control subjects (10–13). While not a causal gene for either disorder, the altered expression has functional implications given the role of the receptor in synapse development.
There is an abundance of in vivo and in vitro studies demonstrating that MET modulates excitatory synapse development and maturation, including visual cortex critical period timing, in select circuits of the forebrain (14–21). In the developing primate and rodent forebrain, MET/Met is enriched in subpopulations of excitatory projection neurons in specific regions of the neocortex, the CA1 hippocampus subfield and a limited number of subcortical structures, with peak expression corresponding to periods of dendritic growth and synapse formation (22–25). MET protein is enriched in the neuropil of these regions during development, accumulating at pre- and post-synaptic compartments (26). When activated by its only known ligand, hepatocyte growth factor, MET interacts with select synapse-associated proteins and engages specific signaling cascades to mediate synaptic vesicle clustering and synapse formation in neocortical neurons in vitro (14, 20, 27). In mice in which Met is deleted in cells arising from the dorsal pallium, or its expression is extended temporally via a transgene in neocortical and hippocampal excitatory neurons, alterations occur in developing hippocampal and neocortical circuitry. Functionally, excitatory synapses mature precociously in the absence of Met (19), but exhibit a lengthened period of plasticity when the normal temporal window of MET signaling is extended later (15, 17). Structurally, alterations in pyramidal neuron dendritic arbor and spine head volume are observed (18, 19, 28). Thus far, studies of molecular adaptations to altered MET expression have focused on candidate postsynaptic proteins, revealing altered developmental expression of select glutamate receptor subunits (17, 19). The full breadth of altered protein expression at the developing neocortical synapse in the context of altered MET signaling has not been determined.
Over the past two decades, mass spectrometry interrogation of synaptosomes as a whole, or postsynaptic density, active zone and synaptic vesicle subfractions, have revealed the extraordinary molecular complexity of the synaptic proteome that includes, in addition to classically defined synapse-specific proteins, proteins associated with signaling pathways and organelles required for synapse formation, maturation and function (e.g., (29–39)). Similar approaches have also identified alterations in the synaptic proteome in response to genetic and environmental perturbations in animal models (e.g., (40–47)) and in postmortem tissue from clinical populations, including schizophrenia and Alzheimer’s disease (e.g., (48, 49)), providing insight into potential molecular mechanisms underlying disease pathology. Here we used a discovery-based proteomics approach to determine molecular changes in the mouse neocortical synaptosomal proteome at the peak of synaptogenesis following the conditional deletion of Met.
Methods and Materials
Mice
Conditional Met null mice (Metfx/fx/nestincre) were generated and genotyped as previously described (50). Breeding lines were backcrossed onto the C57BL/6J background for more than 10 generations and subsequently at least every fifth generation using mice purchased from the Jackson Laboratory (Bar Harbor, ME). Mice were housed in ventilated racks in a climate-controlled vivarium under at 13:11-hour light/dark cycle, with food and water provided ad libitum. All mouse procedures were approved by the Institutional Animal Care and Use Committee at the Children’s Hospital Los Angeles and conformed to NIH guidelines.
Generation of synaptosomes
Unless otherwise noted, all procedures were performed at 4°C and all chemicals are from Sigma (St Louis, MO). Synaptosomes were generated and prepared for proteomics as previously described (26, 51), with minor modifications. Briefly, wild type and null mice were anesthetized with saturated isoflurane vapors (Covetrus, Portland, ME) between 8:00 and 11:00 am on postnatal day (P) 14, during the period of peak synaptogenesis (52–55), decapitated and the brain removed. The neocortex was dissected, snap frozen and stored at −80°C until use. Synaptosomes were generated from two independent wild type and null neocortical samples on the same day, with each sample representing tissue pooled from 2 male mice. Pooled tissue was homogenized in 320mM sucrose, then centrifuged at 1000g for 10 minutes to remove nuclei. The sucrose concentration of the resulting supernatant was adjusted to 1.25M, overlaid with 1M sucrose and centrifuged at 100,000g for 3 hours. The synaptosome fraction, located at the sucrose interface, was removed and precipitated overnight with ice-cold acetone at −20°C. Precipitated samples were centrifuged at 14,000 g for 10 min, dried at room temperature and solubilized in 1% PPS Silent surfactant (Expedeon, San Diego, CA)/50mM Triethyl Ammonium Biocarbonate. Protein concentration of each sample was determined by the Pierce BCA protein assay kit (Thermo Fisher, Waltham, MA) and stored at −80°C prior to shipment to Vanderbilt University.
Proteomics screen
Proteomics procedures were performed at the Mass Spectrometry Research Center Proteomics Core at the Vanderbilt University School of Medicine. Two 4-plex isobaric tag for relative and absolute quantitation (iTRAQ) experiments, using independent samples, were performed. Each experiment included two independent wild type and null samples. Mass spectrometry methods and data analyses were performed similarly to those described previously (51, 56), with some minor modifications. One unit of labeling reagent (reporter tags: 114, 115, 116, 117) was used for 25μg protein. MudPIT analysis was performed using either a Q Exactive or Q Exactive Plus mass spectrometer. Samples analyzed on a Q Exactive were analyzed similar to Voss et al. 2015 (56) with a few differences. The Q Exactive instrument was operated in data-dependent mode acquiring HCD MS/MS scans after each MS1 scan on the 20 most abundant ions using an MS2 target of 1 × 10⁵ ions. The HCD-normalized collision energy was set to 30, and dynamic exclusion was set to 30 s. For experiments conducted on a QE Plus instrument, the instrument was operated in data-dependent mode acquiring HCD MS/MS scans on the 15 most abundant ions using an MS1 ion target of 3 × 10⁶ ions and an MS2 target of 1 × 10⁵ ions. For experiments on both the QE Plus, a Dionex Ultimate 3000 nano LC and autosampler were used, and peptides were gradient-eluted from the reverse analytical column at a flow rate of 350nL/min. For the peptides from the first 11 strong cation exchange (SCX) fractions, the reverse phase gradient consisted of 2–50% solvent B (0.1% formic acid in acetonitrile) in 83 min, followed by a 10 min equilibration at 2% solvent B. For the last 2 SCX-eluted peptide fractions, the peptides were eluted from the reverse phase analytical column using a gradient of 2–98% solvent B in 83 min, followed by a 10 min equilibration at 2% solvent B. Peptide/protein identifications and quantitative analysis were performed using Spectrum Mill (Agilent Technologies, Santa Clara, CA) as described previously. MS/MS spectra were searched against a subset of the UniProt KB protein database (www.uniprot.org) containing Mus musculus proteins. Autovalidation procedures in Spectrum Mill were used to filter the data rigorously to <1% false discovery rates at the protein and peptide level. For each group in each experiment, Log2 protein ratios were fit to a normal distribution using non-linear (least squares) regression. The calculated mean derived from the Gaussian fit was used to normalize individual log2 ratios for each quantified protein.
The mass spectrometry proteomics data were deposited to the ProteomeXchange Consortium via the PRIDE partner repository with the dataset identifier PXD033204 (57). In each experiment, one wild type sample was randomly designated as the comparator sample. The quantitative ratios for each protein in the two null and remaining wild type sample were calculated to determine adaptations in the synaptosomal proteome in the absence of MET signaling. To combine data from the two independent experiments, the ratios for each null sample were then normalized to the wild type ratio and a dataset comprising proteins exhibiting a mean fold difference >1.25 or <0.8 was generated. For each protein, one-sample t-tests were used to compare the ratios to one (no difference in expression between wild type and null), and filtered for false discoveries (false discovery rate, <0.05) using the Benjamini-Hochberg procedure, where the original p-value was compared to the Benjamini-Hochberg critical value.
Protein identifiers were converted to Entrez Gene identifiers using DAVID. Genes corresponding to the proteins detected in the developing neocortical synaptosomes were analyzed for 1) proteins detected in a published mouse developing neocortical synaptosome proteome (32), 2) genes annotated in Synaptic Gene Ontologies (SynGO release 1.1; https://www.syngoportal.org/) (58), 3) members of the neocortical MET synaptic interactome defined by Xie et al., 2016 (27), and 4) proteins encoded by ASD risk genes defined by Simons Foundation Autism Research Initiative Gene (SFARI Gene - syndromic or category 2 and above; downloaded August 28, 2021). Gene ontology (GO) enrichment analyses were performed using the database for Annotation, Visualization, and Integrated Discovery (DAVID, version 2021) (59, 60) with default settings, and SynGO against the brain expressed background setting and with first and second level terms as labels. Kyoto Encyclopedia of Genes and Genomes (KEGG) pathway enrichment analyses were performed using DAVID alone.
Western blot
Western blot analyses were used to validate select proteins in the dataset using synaptosomes generated from a separate cohort of mice. Synaptosomes were prepared as described for iTRAQ analysis, except that the acetone-precipitated samples were solubilized in 5% SDS in Tris-HCl (pH 7.2). SDS-PAGE and Western blotting were performed as described previously (26), with proteins <60kD resolved with 12% gels and those >60kD with 7.5% gels. Unless noted otherwise, all incubations/washes were at room temperature. Prior to immunoblotting, membranes were cut at a desirable range of protein mass, based on Precision Plus All Blue Prestained Protein Standards (Bio-Rad, Hercules CA, Supplementary Fig. 1). Images of the cut membranes, including the molecular weight standards, are provided in Supplementary Fig. S1. Blots were first incubated for one hour in blocking buffer comprising 4% Nonfat Dry Milk (Cell Signaling Technologies, Danvers MA) in Tris-buffered saline (TBS), pH 7.2. Blots were then incubated overnight at 4°C with one of the following primary antibodies diluted in 0.05% Tween 20 in blocking buffer: rabbit anti-VAMP2/synaptobrevin 2 (Synaptic Systems Cat# 104 202, Cedarlane Labs, Burlington NC; 1:2000), rabbit anti-Trim3 (ThermoFisher Cat# 28392–1-AP, 1:2000), rabbit anti-Cdc42ep4 (LifeSpan BioSciences Cat# LS-C804922, Seattle, WA, 1:1000), rabbit anti-Galpha(z) (Cell Signaling Cat # 3904, 1:1000), and mouse anti-Syntaxin 1A (Synaptic Systems Cat# 110111, 1:2000). Following 8 × 5-minute washes in TBS, blots were incubated for one hour in species appropriate horseradish peroxidase-conjugated secondary antibodies (Jackson ImmunoResearch: mouse - Cat# 71–035-10; rabbit - Cat# 715–035-152, West Grove PA) diluted 1:5000 in 0.05% Tween 20 in blocking buffer. Following 8 × 5-minute washes in TBS, immunoreactive bands were visualized with Pierce SuperSignal West Dura Chemiluminescent substrate (Thermo Scientific). Image capture and densitometric analysis was performed using a CC camera coupled to a UVP BioImaging System using VisionWorks LS Image Acquisition and Analysis software (v. 7.0.1, VisionWorks). The density of each band was measured, a global background subtraction applied, and the resulting value normalized to the wild type mean. A Hedge’s g, appropriate for small sample sizes, was calculated as an estimate of effect size. A protein was considered validated if it met the same mean fold change criterion as for the iTRAQ analyses (<0.8 or >1.25), with the same direction of change and with a medium (>0.5) to large (>1.0) effect size.
Results
Characterization of P14 neocortical synaptosomes
This study used a discovery-based MS approach to profile synaptosomes isolated from the mouse neocortex at the peaks of synaptogenesis and MET expression (P14). Western blot analyses demonstrated enrichment of the presynaptic marker, synaptophysin, and depletion of the nuclear marker, lamin B, in isolated synaptosomes compared to the crude homogenate and the cytoplasm fraction (Fig. 1a; Supplementary Figure S2). We identified 3616 unique proteins across the two iTRAQ experiments – each experiment comprising two independent wild type and Met−/− biological replicates - with 2149 proteins detected in both experiments (Fig. 1b; Supplementary Table S1). Only proteins detected in both experiments were considered for further analysis (Supplementary Table S2). Approximately 80% of proteins detected in our P14 neocortical synaptosomes were also detected in cortical synaptosomes isolated from 3- and 8-week-old male C57BL/6J mice using a 4-plex iTRAQ approach (Fig. 1c; Supplementary Table S2) (32), demonstrating reproducibility across laboratories when using the same approach. We next performed enrichment analyses for GO cellular component (GO-CC) using genome-wide (DAVID) and synapse-specific (SynGO) tools. Analyses using DAVID revealed an enrichment in proteins associated with the synapse, with 6 of the top 20 terms (based on p values) representing synaptic components; other enriched terms included those representing organelles and structural elements commonly observed at the synapse, including mitochondria, cytoskeleton and endosomes (Fig. 1d). Five hundred and thirty proteins were annotated in SynGO, with enrichment in both pre- and post-synaptic components (Fig. 1 e). The complete set of enriched terms, and the proteins associated with each term, is listed in Supplementary Table S3 (DAVID) and Supplementary Table S4 (SynGO).
Fig. 1.
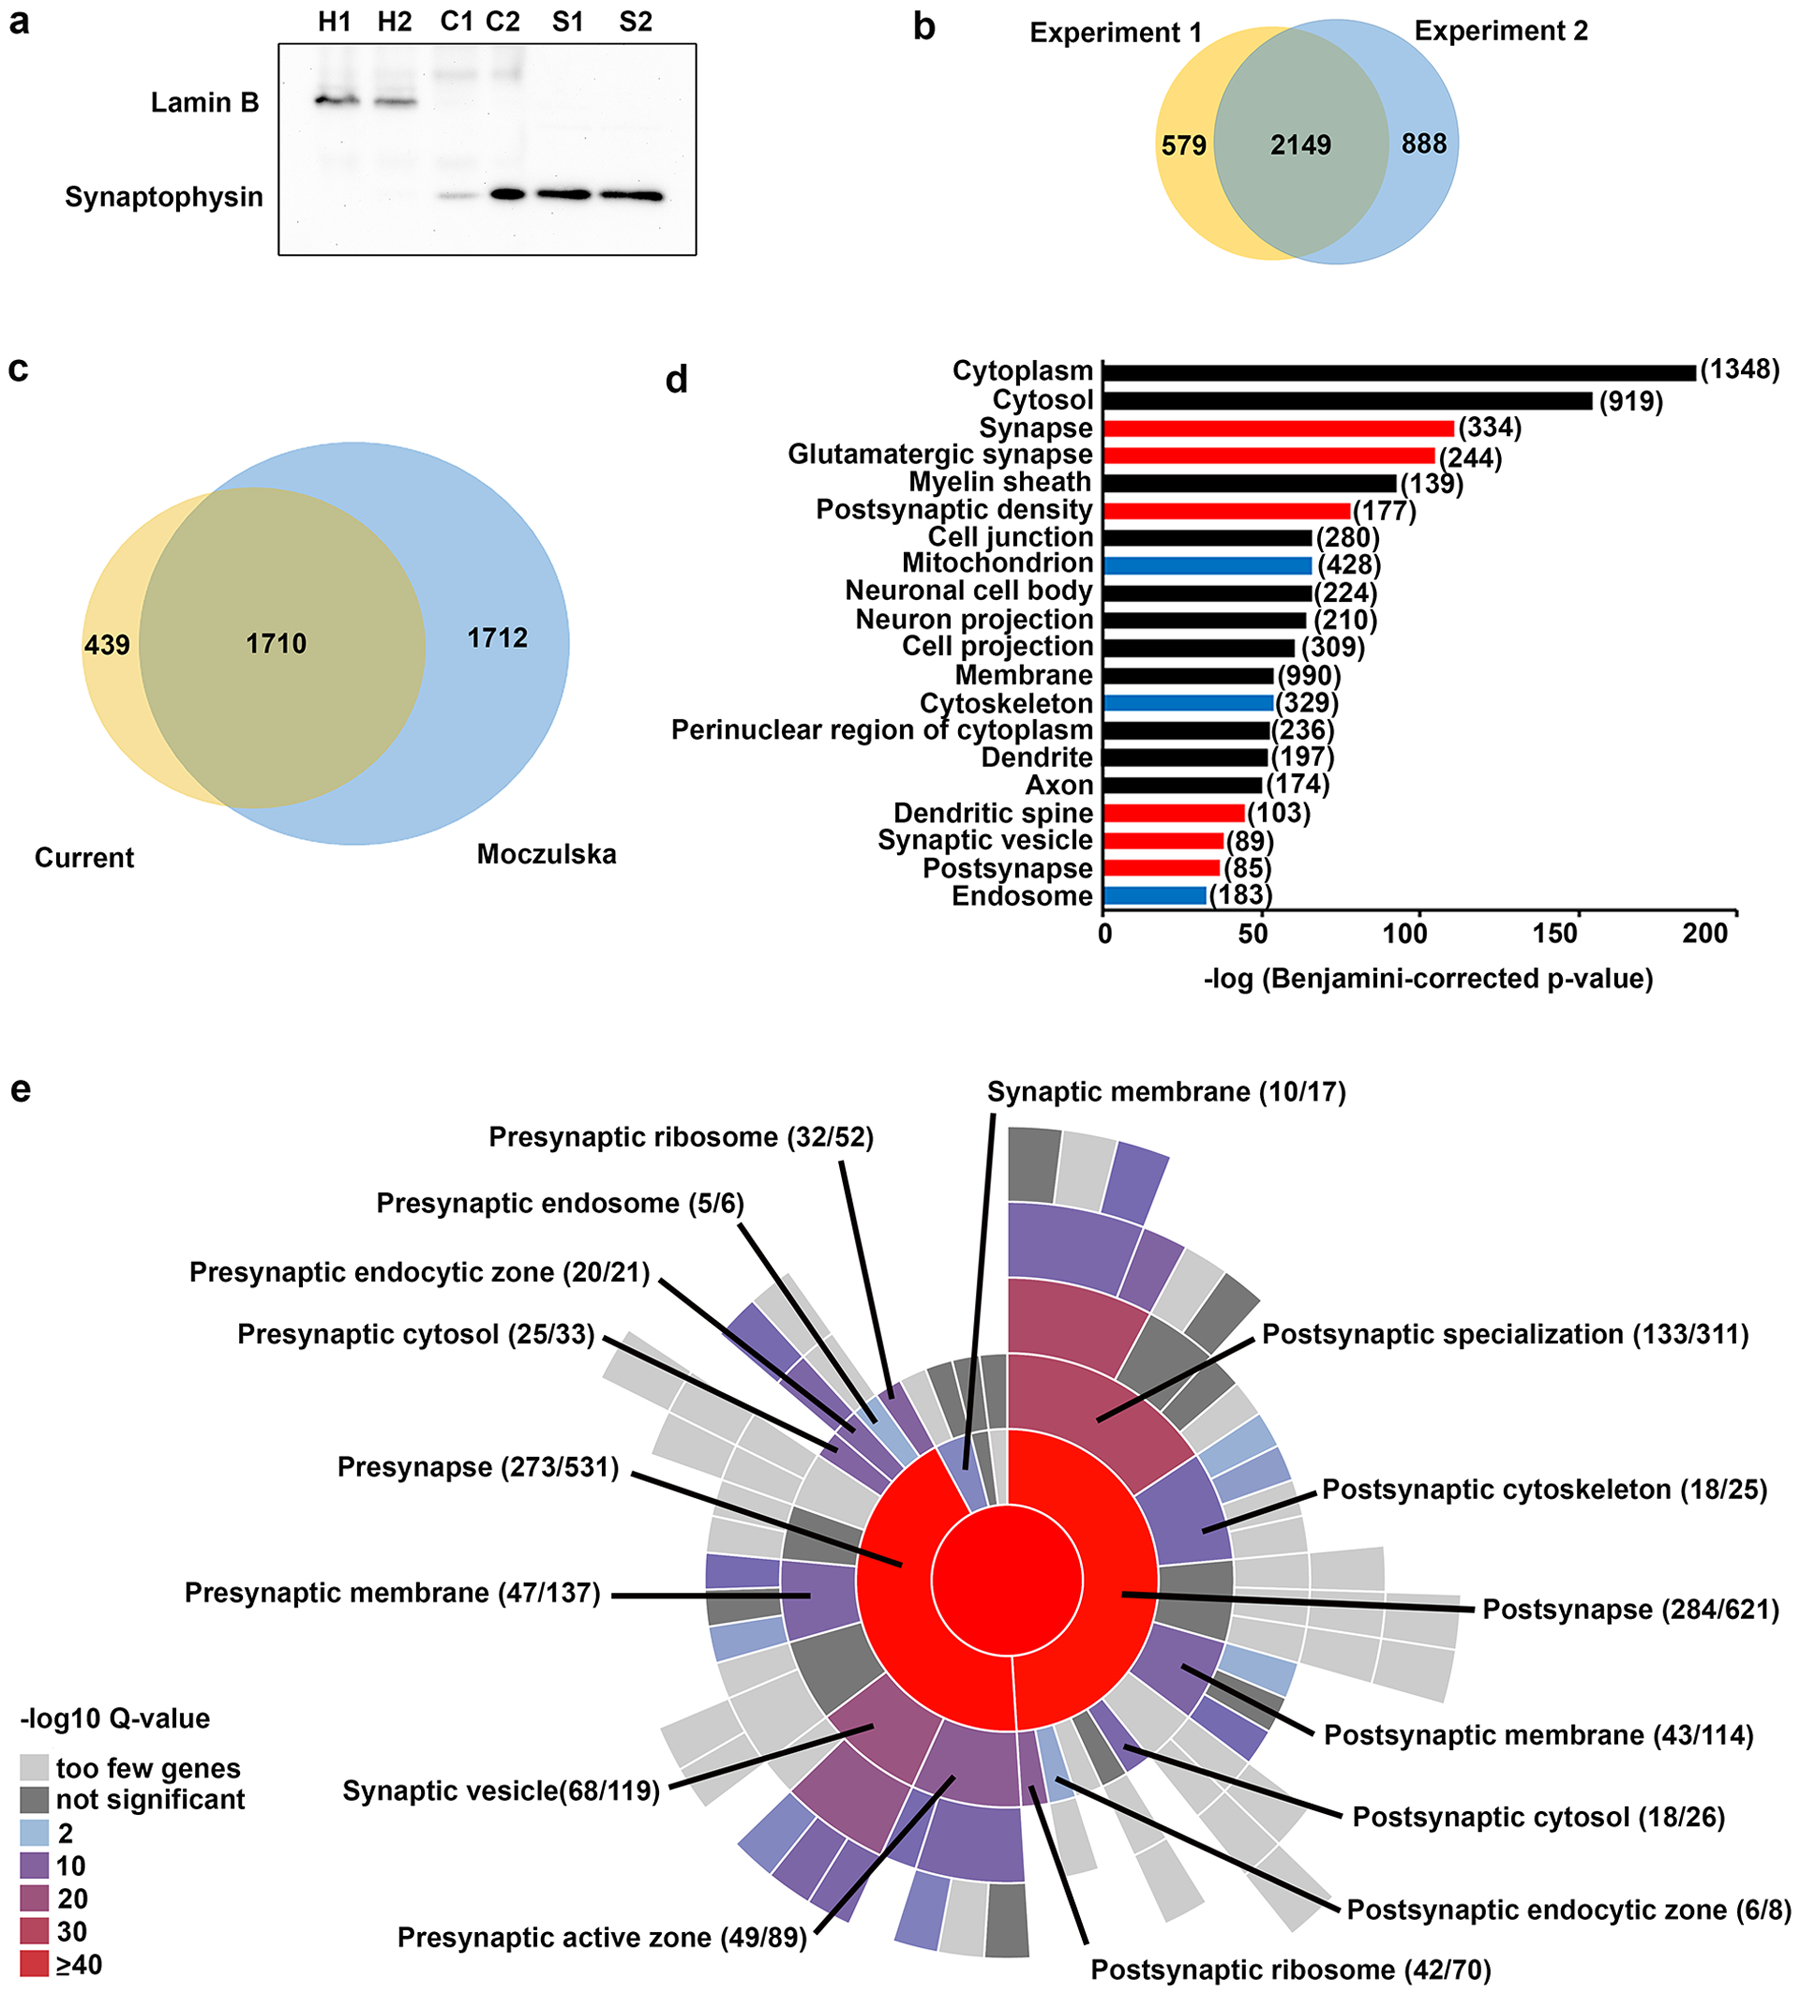
Characterization of synaptosomes generated from the P14 neocortex. (a) Western blot illustrating enrichment of synaptophysin and depletion of lamin B in the synaptosome fraction prepared from two independent P14 neocortical samples. Lanes were loaded with equal amounts of protein from homogenate (H), cytoplasm (C), and synaptosome (S) fractions. Uncropped images of the membrane are shown in Supplementary Figure S2. (b) Venn diagram displaying overlap in proteins detected in experiments 1 and 2 in the current study. (c) Venn diagram displaying overlap in proteins detected in both experiments in the current study and in (32). (d) Top 20 enriched Gene ontology (GO): cell component terms based on p-values using DAVID. Red bars: terms associated with the synapse; blue bars: terms associated with synapse-associated organelles and structural elements. Numbers in parentheses indicate the number of proteins for each term. The complete set of significantly enriched GO terms, and the proteins therein, are listed in Supplemental Table S3. (e) 530 proteins were categorized in SynGO cellular component. Sunburst plot with color-coded enrichment significance for top-level and second-level GO: cellular component terms. The number of counts compared to the total number of hits for each term is indicated. The proteins associated with the significant GO terms can be found in Supplemental Table S4.
We next determined adaptive molecular changes in neocortical synaptosomes in the absence of MET signaling. The distribution of protein ratios across the four samples was overlapping but not identical (Fig. 2a). Based on average fold change across the four samples, 509 proteins met a fold-change criteria of either <0.8 (227 proteins) or >1.25 (282 proteins; Fig. 2b; Supplementary Table S5). Of these, 389 were significantly altered in the absence of MET signaling, 315 of which exceeded FDR < 0.05 (Supplementary Table S6). Because this is a discovery study, we used all 389 proteins in the subsequent analyses.
Fig. 2.
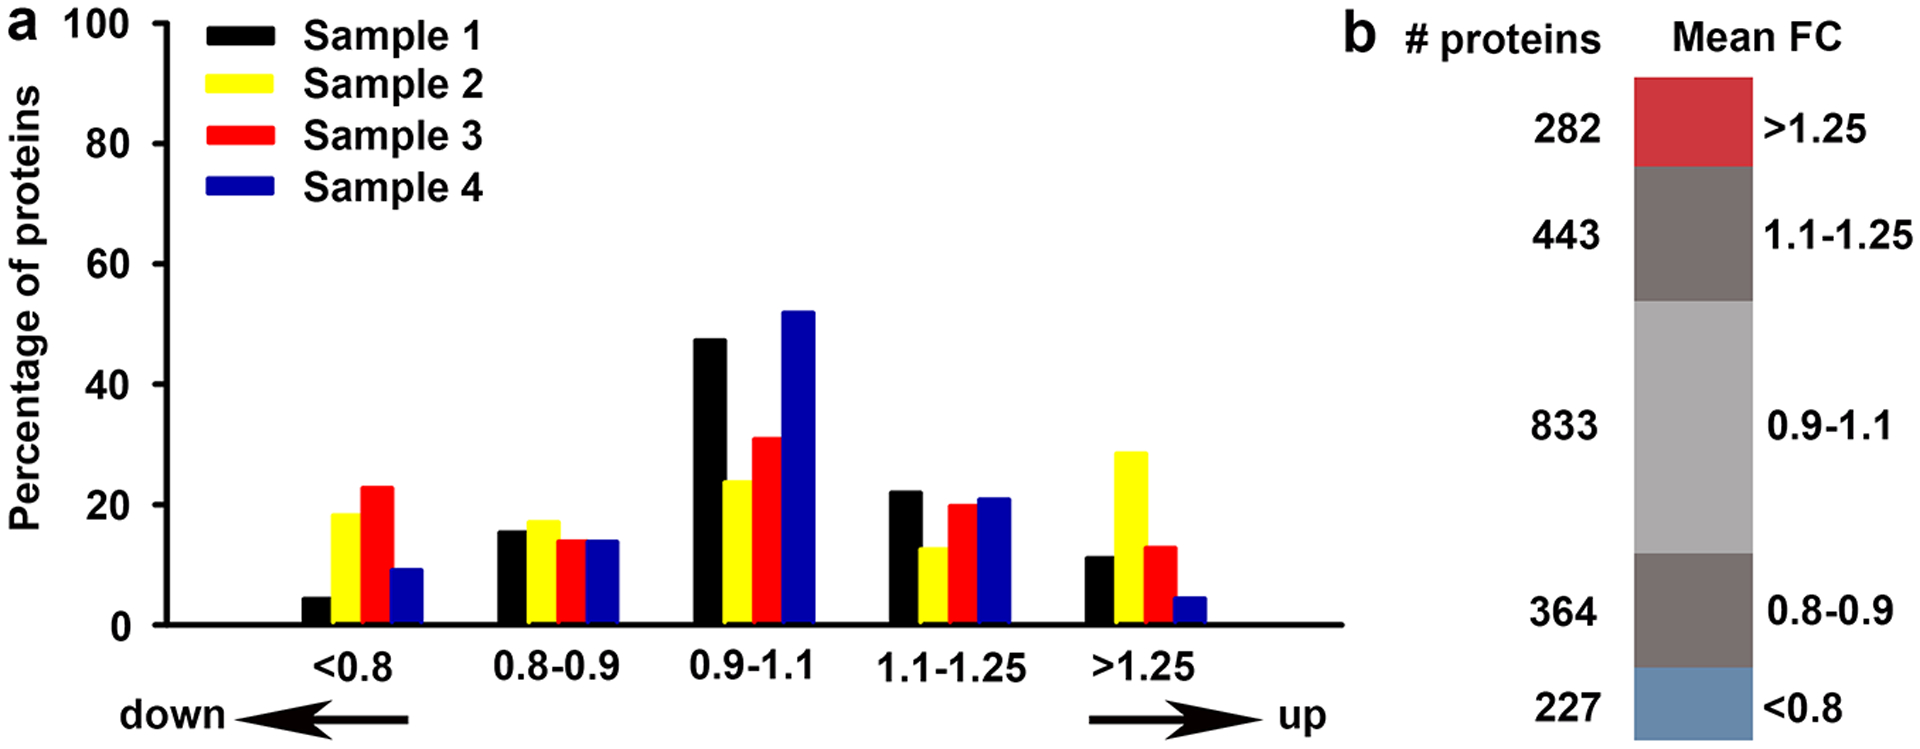
(a) Distribution of protein ratios for each sample from neocortical Met−/− synaptosomes normalized to wild type ratio. A single iTRAQ experiment included either samples 1 & 2 or samples 3 & 4. (b) Representation of distribution of mean fold change (FC) protein ratios across the four experiments.
We first used GO-CC and KEGG pathway analyses to determine if adaptations to the synaptosomal proteome in the absence of MET signaling were enriched in specific cellular components and pathways. As noted above, the neocortical synaptosomal dataset is enriched for proteins at the synapse and in synaptosome-associated organelles. We therefore used the neocortical synaptosomal dataset, rather than whole genome (DAVID) or brain background (SynGO), to serve as the background comparison in these analyses. When all changed proteins were considered as a single dataset, DAVID returned one GO-CC term (integral component of the membrane) and three KEGG terms (Huntington disease, prion disease, and phagosome) (Fig. 3a; Supplementary Table S7). Downregulated proteins returned four GO-CC terms (SNARE complex, extracellular region, membrane, integral component of membrane) and one KEGG term (SNARE interactions in vesicular transport) (Fig. 3b). The proteins associated with each term is listed in Table 1 (SNARE complex) or Supplementary Table S7. Approximately 17.5% (93/530) of the proteins annotated in SynGO exhibited altered expression in the absence of MET signaling. There were, however, no significantly overrepresented terms, but rather changes were observed broadly across the presynapse, the postsynapse, the synaptic cleft and synaptic membrane (Fig. 3c, Supplementary Table S8). In addition, multiple proteins in the ubiquitin-proteasome system (UPS) and associated with the synaptic vesicle, as well as proteins that regulate actin filament organization and synaptic vesicle exocytosis/endocytosis, were disrupted (Table 1).
Fig. 3.
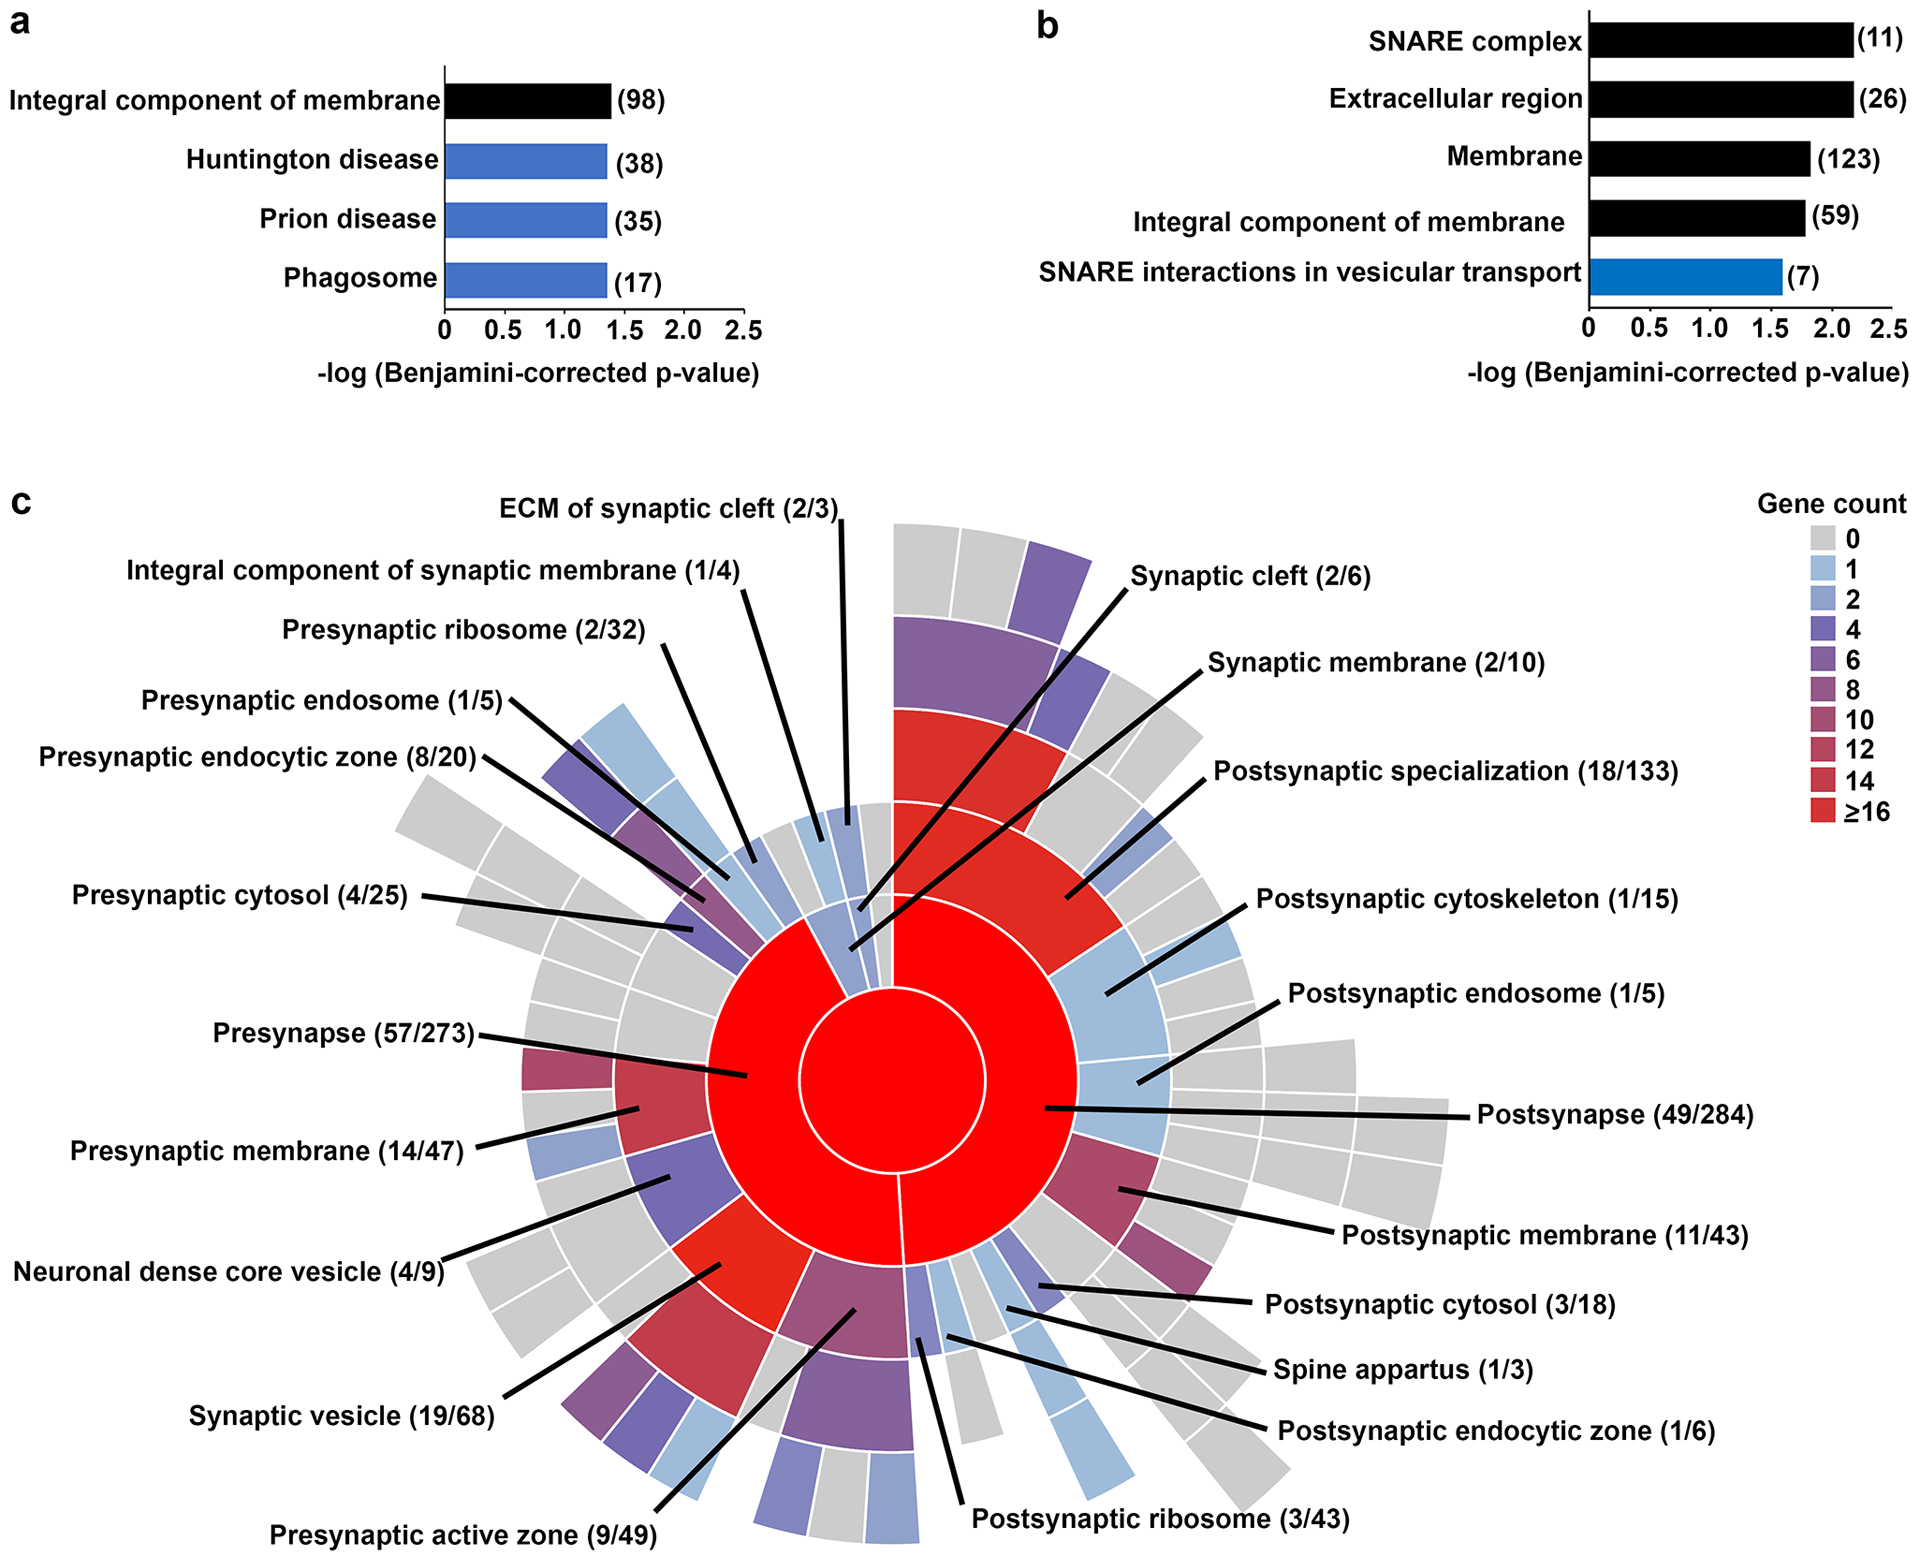
(a) Gene ontology (cellular component, black bars) and (b) KEGG pathway (blue bars) analyses in DAVID of proteins expressed differentially in neocortical synaptosomes in the absence of Met. The proteins associated with each significant term are listed in Supplemental Table S7. (c) Sunburst plot with color-coded gene counts for top-level and second-level SynGO: cellular component terms that include proteins exhibiting differential expression in the absence of Met. No term was overrepresented. The number of counts compared to the total number of hits for each term is indicated. The proteins associated with each term can be found in Supplemental Table S8.
Table 1.
Select proteins changed in Met-null neocortical synaptosomes*
| Process/pathway | Proteins |
|---|---|
| SNARE complex | |
| Upregulated | vesicle-trafficking protein SEC22b; syntaxin-binding protein 5-like |
| Downregulated | syntaxin-1A, −1B and −16; vesicle-associated membrane protein 2 and 4; complexin-1, −2 and −3; gamma-soluble NSF attachment protein; vesicle transport through interaction with t-SNAREs homolog 1A and 1B |
| Synaptic vesicle | |
| Upregulated | synaptogyrin-3; v-type proton ATPase subunits C1 and H; synaptic vesicle glycoprotein 2A; DmX-like protein 2; vesicle-trafficking protein SEC22b |
| Downregulated | complexin-3; clathrin light chains A and B; syntaxins 1A and 16; vesicle-associated membrane protein 2; vesicle transport through interaction with t-SNAREs homolog 1A; lysosome-associated membrane glycoprotein 1; amphiphysin; MARKS-related protein; synaptotagmin 1 and 2; v-type proton ATPase subunit G1 |
| Synaptic vesicle exocytosis/endocytosis | |
| Upregulated | dynamin-1; clathrin coat assembly protein AP180; AP-2 complex subunit mu; TBC1 domain family member 24 |
| Downregulated | syntaxins 1A and 1B; protein kinase C and casein kinase substrate in neurons protein 1; synaptotagmin 1 and 2; amphiphysin; vesicle-associated membrane protein 2; beta-synuclein; calnexin; complexins 1, 2 and 3; ras-related protein Rap-1A |
| Ubiquitin-proteasome system: | |
| Upregulated | ubiquitin-like modifier-activating enzyme 6; RNF14; HECW1; HECW2; UBR4; UBE3A; TRIM3; cullin-1 and −5; DNA damage-binding protein 1; 26S proteasome non-ATPase regulatory subunits 2, 8, 6 and 11 |
| Actin filament organization | |
| Upregulated | coronin-7; rho guanine nucleotide exchange factor 2; protein kinase C iota type; |
| Downregulated | tropomodulin-2; tropomyosin alpha-1, −3 and −4 chain; protein BRICK1; protein kinase C and casein kinase substrate in neurons protein 1; paralemmin-2; MARCKS-related protein |
See Supplementary Table S6 for the complete list of changed proteins
We previously identified 178 proteins that belong to a dynamic MET interactome, the composition of which is regulated by receptor activation, in crude synaptosomes isolated from P14 mouse neocortex (27). We detected 131 (~75%) MET-interaction partners in our current dataset (Fig. 4a; Supplemental Table S2), of which 18 were altered in the absence of MET signaling, with 17 increased and only 1 decreased (Fig. 4b). This did not represent a significant overrepresentation of MET-interaction proteins among proteins exhibiting altered expression (chi-square = 0.848, df = 1; p = .357). Nonetheless, the increased expression of proteins involved in signal transduction (guanine nucleotide-binding protein G(z) subunit alpha - GNAZ, tyrosine-protein kinase Fyn - FYN, Rho guanine nucleotide exchange factor 2 - ARHGEF2, dedicator of cytokinesis protein 3 - DOCK3, triple functional domain protein - TRIO), protein sorting (AP-1 complex subunit beta-1 - AP1B1, AP-2 complex subunit mu - AP2M1) and ubiquitination (E3 ubiquitin-protein ligase HECW1 – HECW1, E3 ubiquitin-protein ligase UBR4 - UBR4) likely impact synaptic function.
Fig. 4.
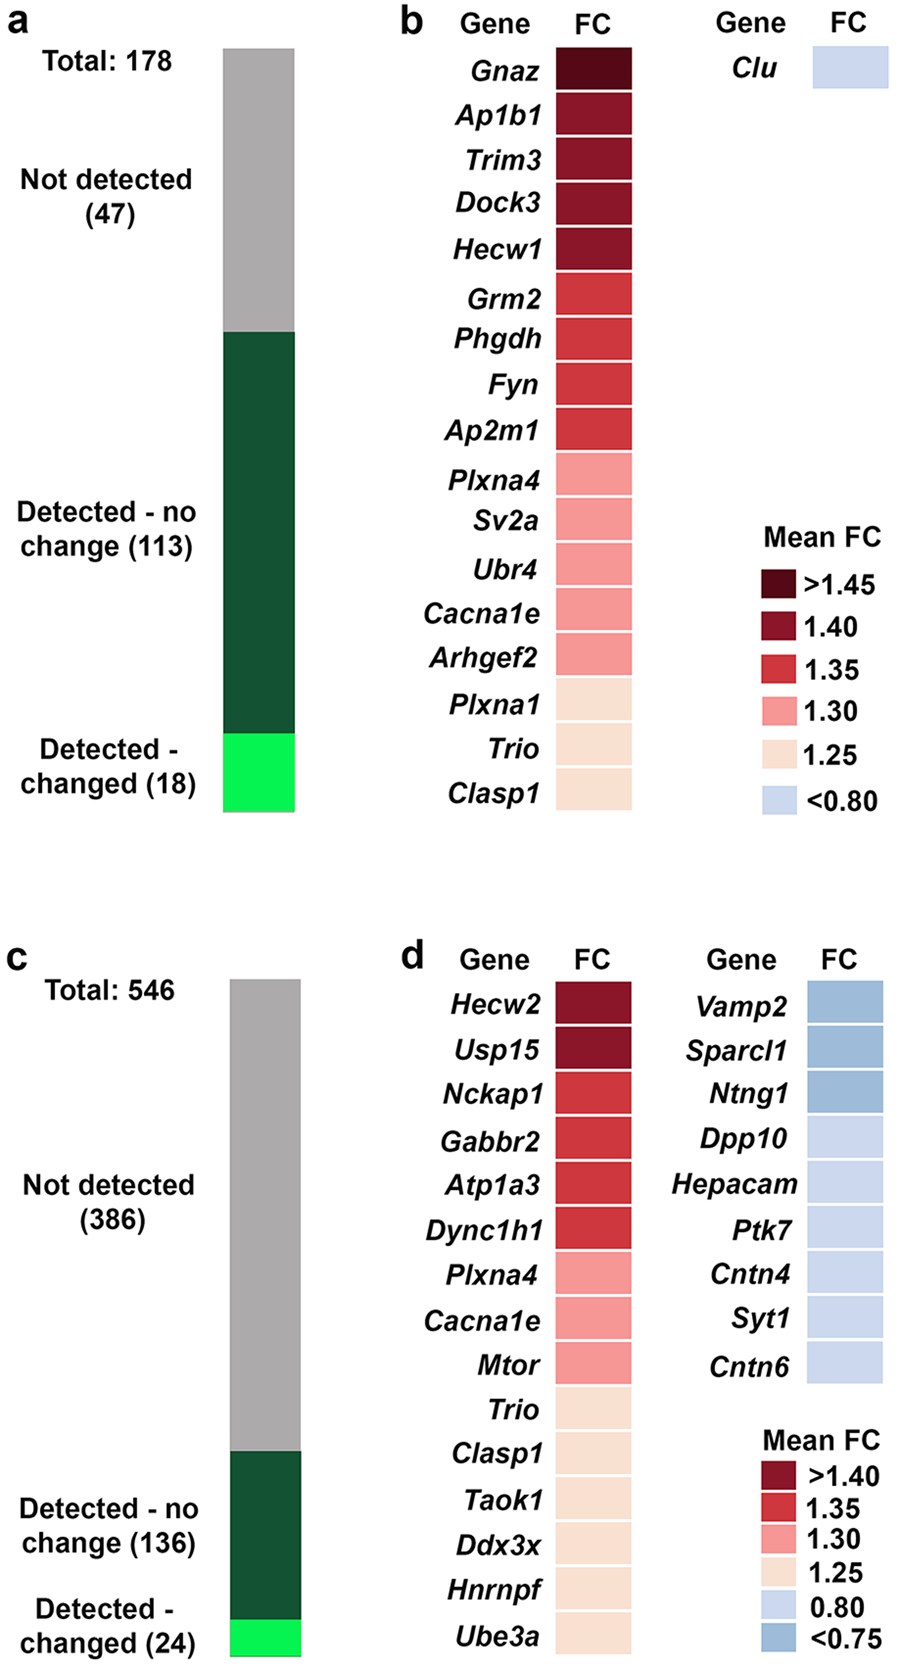
(a) Representation of the members of the MET interactome identified in (27). Undetected members are in grey, detected unchanged members in dark green and changed detected members in light green. (b) Identity and mean fold change (FC) in expression of MET-interacting proteins impacted by the absence of MET signaling. (c) Representation of the proteins encoded by ASD risk genes identified in SFARI gene. Undetected members are in grey, detected unchanged members in dark green and detected changed members in light green. (d) Identity and mean fold change (FC) in expression proteins encoded by ASD risk genes impacted by the absence of MET signaling.
Given the altered expression of Met/MET in ASD, we were interested in whether expression of other ASD-associated proteins was altered in the absence of MET signaling. We considered ASD-associated proteins to be those encoded by genes defined as category 1 (high confidence), category 2 (strong candidate) or category S (syndromic) by SFARI Gene, totaling 546 proteins. We detected 160 ASD-associated proteins in our neocortical synaptosome dataset (Fig. 4c, Supplementary Table S2), representing a significant enrichment (chi-square = 170.34, df = 1; p < .001) using the whole genome as the background comparison. Twenty-four ASD-related proteins detected in the neocortical synaptosomes were altered, with 15 upregulated and 9 downregulated (Fig. 4d). Although this did not represent a significant overrepresentation of proteins encoding ASD risk genes among proteins exhibiting altered expression (chi-square = 0.302, df = 1; p = .582), it is consistent with MET being part of a larger network of synaptic signaling molecules that includes proteins encoded by syndromic and other high confidence genes.
Finally, 5 proteins were selected for Western blot validation of the proteomics data. These proteins comprised upregulated (tripartite motif-containing protein 3 – TRIM3, GNAZ) and downregulated (vesicle-associated membrane protein 2 - VAMP2, syntaxin 1A – STX1A, cdc2 effector protein 4 - CDC42EP4) proteins, and included representatives of the MET interactome and proteins encoded by ASD risk genes. Four proteins met the average fold change criteria established for the iTRAQ analyses, with the same direction of change: VAMP2, 0.76 (Fig. 5b), STX1A, 0.79 (Fig. 5c), TRIM3, 1.36 (Fig. 5e) and GNAZ, 1.81 (Fig. 5f). One protein, however, did not meet this criterion: CDC42EP4, 0.90 (Fig. 5d). The 4 proteins that met criteria all exhibited a large effect size (Hedges g): VAMP2, 2.05; STX1A, 2.17; TRIM3, 1.25; GNAZ, 2.03.
Fig. 5.
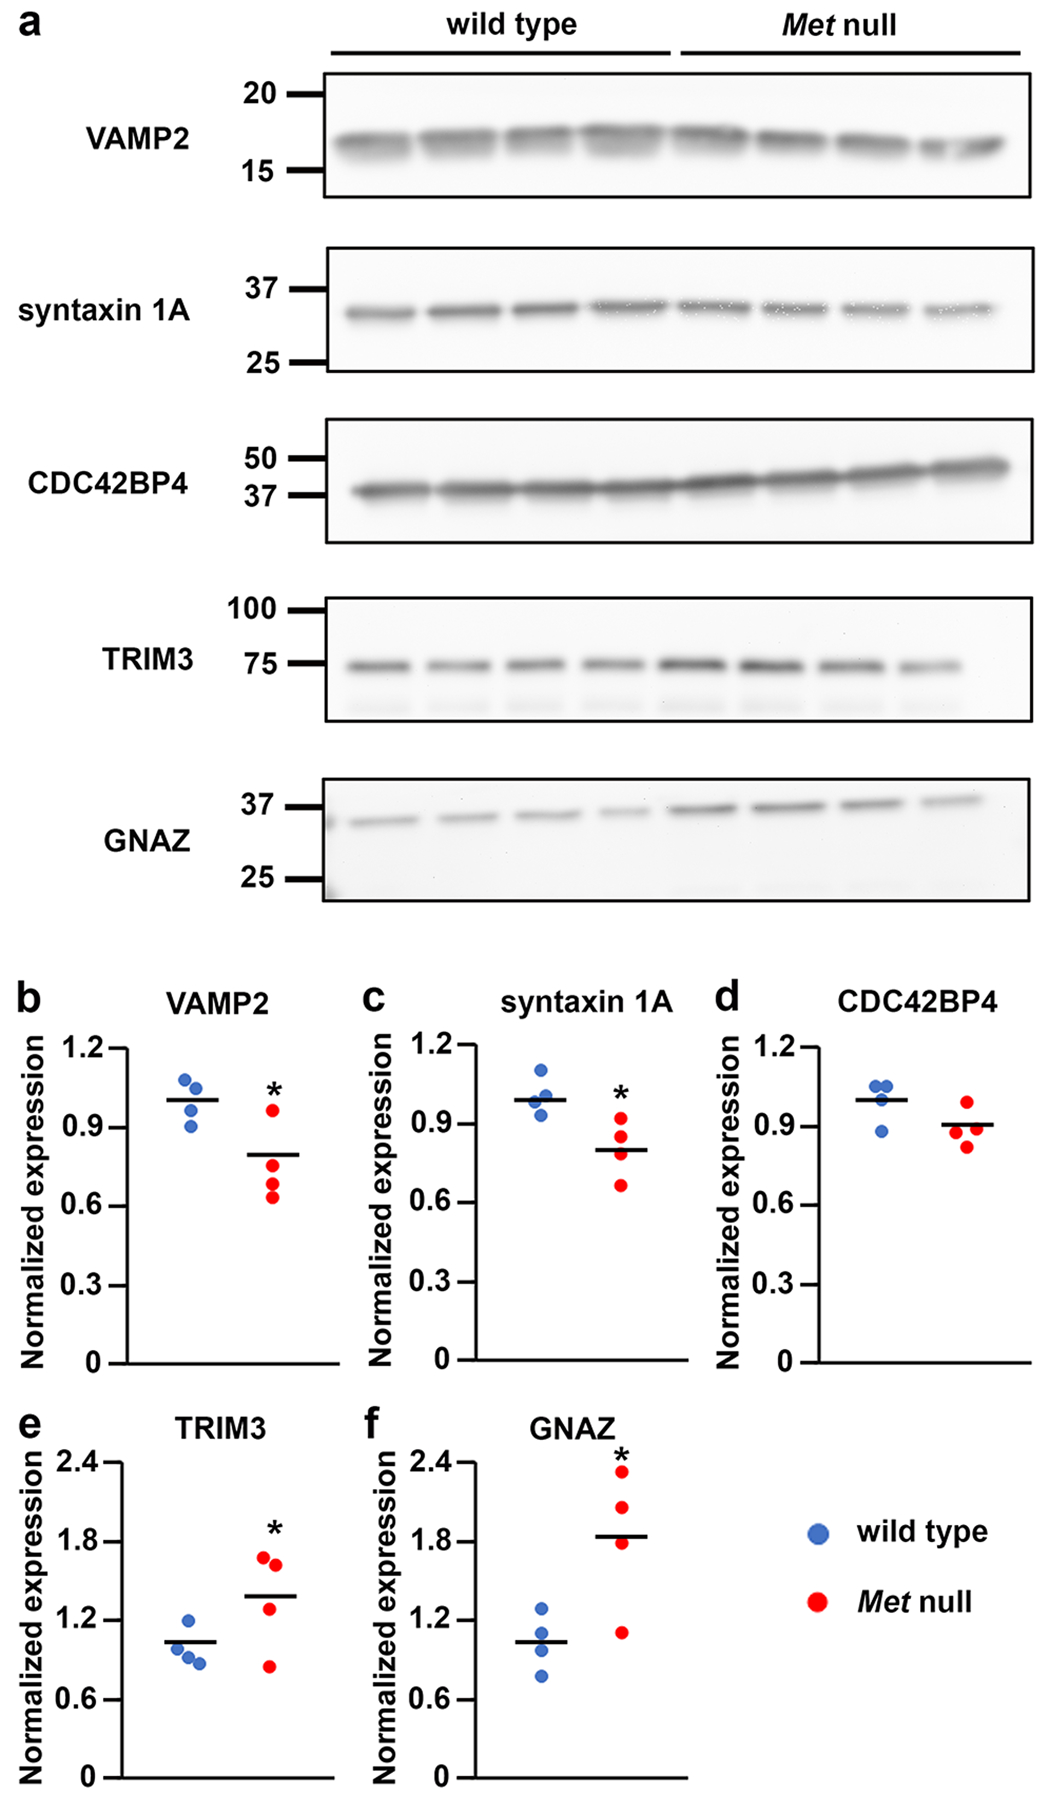
Validation of iTRAQ proteomics. (a) Western blot analysis of neocortical synaptosomes generated from independent P14 wild type and Met-null neocortex using antibodies against 5 proteins exhibiting significantly changed expression by iTRAQ. Uncropped images of the cut membranes are shown in Supplementary Figure S1. Semi-quantitative analysis reveals that VAMP2 (b), syntaxin-1 (c), TRIM3 (e) and GNAZ (f) meet the mean fold change criteria in the same direction as for iTRAQ. CDC42BP4 does not meet this criterion (d). Data are expressed relative to mean wild type value. Blue circles, wild type; red circles, Met-null. *Hedge’s g > 1.0 (large effect size).
Discussion
The present study used a discovery-based proteomics approach to identify proteins that exhibit differential expression in developing neocortical synaptosomes in the absence of MET signaling. The study complements studies demonstrating the impact of Met deletion on disrupting structural and functional synaptic development, maturation and physiological properties. The analysis revealed a broad disruption of the synaptic proteome during the peak of synaptogenesis, including changes in proteins associated with the neocortical synaptic MET interactome and those encoded by syndromic and ASD risk genes. In addition to the overrepresentation of proteins associated with the SNARE complex, multiple proteins in the ubiquitin-proteasome system (UPS) and associated with synaptic vesicles, as well as proteins that regulate actin filament organization and the synaptic vesicle exocytosis/endocytosis, are also disrupted. These changes are consistent with the alterations in spine dynamics and size, and the precocious maturation of glutamatergic synapses observed in the absence of MET signaling (16, 18, 19, 28).
There is an acceleration of the stereotypical developmental changes in N-methyl-D-aspartate (NMDA) and α-amino-3-hydroxy-5-methyl-4-isoxazolepropionic acid (AMPA) receptor subunit expression in the neocortex and hippocampus following reduced expression of Met (16, 19). These changes are due to altered trafficking of the subunits to the synaptic membrane rather than alterations in global expression (19). We also do not detect changes in subunit expression in our whole synaptosome preparations, consistent with a previous study that reported no changes in total AMPA receptor expression but increased levels in the postsynaptic density in synaptosomal preparations in the context of synaptic plasticity (61). We do, however, observe reduced expression of proteins with known roles in trafficking AMPA and NMDA receptors into and out of the PSD, namely protein kinase C and casein kinase II substrate in neurons (PACSIN1), neuroplastin (NPTN) and calsytenin-1 (CLSTN1). Protein interacting with C-kinase 1 (PICK1), whose expression remains unchanged in the absence of MET signaling, regulates trafficking of AMPA receptors through its interaction with PACSIN1 (62) and knockdown of PACSIN1 alone is sufficient to reduce activity-dependent internalization of glutamate receptor 2 (GluR-2) in hippocampal neurons (62, 63). Homophilic binding of NPTN activates p38 MAPK and the subsequent internalization of glutamate receptor 1 (GluR-1) (64). In Clstn1-null mice, the glutamate [NMDA] receptor subunit epsilon-2 (GluN2B) to glutamate [NMDA] receptor subunit epsilon-1 (GluN2A) ratio is disrupted in juvenile hippocampus (65). Although these interactions have been examined primarily in the context of synaptic plasticity, it is likely that they perform similar functions during development and underlie in part the altered developmental trajectory of glutamate subunit expression in the synaptic membrane in conditional Met-null mice.
Similar to postsynaptic maturation, the development of the synaptic vesicle pool, including the emergence of appropriate patterns of exocytosis and endocytosis, follows a typical trajectory (reviewed in (66)), and it has been proposed that even ‘a small shift in the expression of key presynaptic proteins may be sufficient to alter circuit activity during development…..resulting in a shift in the critical period’ (66). The current study identified altered expression of synaptic vesicle proteins, as well as non-vesicle proteins that modulate synaptic vesicle exocytosis and endocytosis. This includes, for downregulated proteins, an overrepresentation of proteins associated with the SNARE complex that is crucial for synaptic vesicle exocytosis and synchronization of neurotransmitter release (67). These findings are consistent with our previous biochemical and immunoelectron microscopic analyses demonstrating an association of MET with synaptic vesicles in the developing neocortex (26) and in vitro studies showing that HGF activation of MET increases clustering of synaptic vesicles at the active zone (20). We further suggest, in line with the proposal put forth by Bonnycastle (66), that the current data indicate there are presynaptic contributions to the circuit alterations observed following developmental disruptions in MET signaling.
The ubiquitin proteasome system regulates protein turnover. Specifically, ubiquitins are attached to a substrate protein via multiple rounds of an enzyme cascade comprising an ubiquitin E1 activating enzyme, E2 conjugase and E3 ligase, with the E3 ligase determining substrate specificity, creating a signal for degradation by the proteasome (reviewed in (68)). Based on the nature of the ubiquitin chain, protein ubiquitination can also regulate protein endocytosis and localization (69). Multiple members of the UPS are altered in developing neocortical synaptosomes in the absence of MET signaling, including an E1 activating enzyme (ubiquitin-like modifier-activating enzyme 6) and several E3 ligases/components of an E3 ligase complex (RNF14, HECW1, HECW2, UBR4, UBE3A, TRIM3, cullin-1, cullin-5, SKP1 and DNA damage-binding protein1), likely contributing to altered synaptic development and maturation. For example, the UPS plays a key role in synaptic plasticity, principally by influencing protein turnover and protein trafficking, including AMPA receptor trafficking (70–73). The UPS also impacts expression levels of presynaptic proteins, including syntaxin 1 (reviewed in (74)), and in vitro evidence indicates that it may also influence synaptic vesicle cycling (75). In these contexts, we suggest that the alterations in the UPS identified in the current study contribute to the accelerated maturation of glutamatergic synapses and altered expression of proteins associated with the synaptic vesicle cycle observed in the absence of MET.
Developmental alterations in MET signaling disrupt activation of downstream signaling proteins, such as cdc42, Rac1 and cofilin-1, that influence the actin cytoskeleton (17, 18), the major cytoskeletal component in spines (76). This disruption has been hypothesized to underlie altered spine dynamics and maturation and spine head size observed following alterations in MET signaling (17). The current analysis identified disrupted expression of proteins associated with actin filament organization in Met-null developing neocortical synaptosomes, including the downregulation of tropomodulin 2 (TMOD2), tropomyosin alpha-3 chain (Tpm3), tropomyosin alpha-1 chain (Tpm1), and tropomyosin alpha-4 chain (Tpm4), lending support to this hypothesis. Tropomyosins regulate the binding of actin-binding proteins and myosin motors to actin filaments (77), thus modulating actin filament remodeling required during spine formation and maturation. Tropomodulins cap the minus end of tropomyosin-coated actin, thus regulating the length of the actin filament (78). Alterations in the expression of TMOD2 alters the number of dendritic spines and filopodia and influences spine head morphology in hippocampal neurons (79, 80). Further, deficits in learning and memory are observed following knockout of Tmod2 (81).
Finally, we performed analyses focused on the developing neocortical synaptic MET interactome and on proteins encoded by high confidence ASD and syndromic genes. First, we identified an overrepresentation of proteins from both groups, consistent with a role in synapse development/function. Second, we identified changes in the expression of 18 members of the MET interactome and 24 proteins encoded by risk genes in the absence of MET, with one (TRIO) common to both groups. We note that we are measuring global protein expression in these analyses. As reported previously for glutamate receptor subunits, the trafficking of MET interactome or ASD/syndromic proteins, rather than total expression, may also be impacted. Analyses of the proteome of subsynaptic fractions in the absence of MET would address this possibility. We also note that changes in posttranslational modifications, including ubiquitination, phosphorylation, neddylation and SUMOylation, would also impact protein function. Indeed, as noted previously, alterations in the phosphorylation status of cdc42, Rac1 and cofilin-1, rather than changes in expression levels, are seen following disruption of MET signaling (17, 18). The data here, together with other studies, indicate that a combination of altered protein expression, posttranslational modification and intracellular trafficking likely contribute to disrupted synaptic development and maturation.
There are some limitations to the current study. The iTRAQ proteomics analysis does not readily detect low abundance proteins and we cannot exclude the possibility that expression of these proteins is also impacted in the absence of MET signaling. In addition, the data represent the average response of all synapses in neocortex, including those that do not express MET. There are likely discrete responses in individual MET-expressing synapses within the neocortex that are unable to be detected using the current approach. Finally, we note that differences in the synaptosomal isolation procedure may influence the repertoire of protein changes identified in the synaptosome proteome in the absence of MET (82).
Although correlational, many of the changes in expression identified in the current study are consistent with structural/functional changes observed in vivo and in vitro in the absence of MET. Further, MET, while not itself encoded by a causal ASD gene, appears to be part of a larger network of synaptic signaling molecules that includes proteins encoded by syndromic and other high confidence genes. Alterations in MET expression and signaling during peak synaptogenesis in circuits in which the receptor is expressed may contribute long-term consequences on synaptic function and altered developmental outcomes.
Supplementary Material
Supplementary Figure S1: Left: prior to immuoblotting, membranes were cut at a desirable range of protein mass, based on Precision Plus All Blue Prestained Protein Standards. Note that VAMP2 and Syntaxin 1A were probed on the same membrane, but the other antibodies were each probed on a separate membrane. Right: uncropped blots shown in Figure 5.
Supplementary Figure S2. A: Membranes imaged to illustrate Precision Plus All Blue Prestained Protein Standards. B: Uncropped blot shown in Figure 1A – note the non-specific high moecular weight bands are also absent from the synaptosomes. C. Gamma-adjusted image of blot shown in B that allows the outline of the membrane to be visible. D. Rectangle outlines the cropped image shown in Figure 1A.
Acknowledgements
We acknowledge Dr. Kristie Lindsey Roe (Mass Spectrometry Research Center (MRSC) Proteomic Core at the Vanderbilt University School of Medicine) for performing the iTRAQ protocols and generating the iTRAQ datasets and Amana Whipple for assistance in maintaining the mouse colony and genotyping.
Funding Sources
This work was supported by National Institute of Mental Health R01 MH067842, Simms/Mann Chair in Developmental Neurogenetics and the WM Keck Chair in Neurogenetics.
Footnotes
Conflict of Interest Statement
The authors have no conflicts of interest to declare.
Statement of Ethics
All mouse work was done according to IACUC review boards (Children’s Hospital Los Angeles) and conformed to NIH guidelines. This study protocol was reviewed and approved by the Institutional Animal Care and Use Committee at Children’s Hospital Los Angeles, Approval Number 357–17.
Data Availability Statement
Publicly available datasets were used in this study. Each dataset is deposited to the ProteomeXchange Consortium via the PRIDE partner repository with the dataset identifier PXD033204. Further inquiries can be directed to the corresponding author.
References
- 1.Qiu S, Aldinger KA, Levitt P. Modeling of autism genetic variations in mice: focusing on synaptic and microcircuit dysfunctions. Dev Neurosci. 2012;34(2–3):88–100. [DOI] [PubMed] [Google Scholar]
- 2.Bourgeron T A synaptic trek to autism. Curr Opin Neurobiol. 2009;19(2):231–4. [DOI] [PubMed] [Google Scholar]
- 3.Kenny EM, Cormican P, Furlong S, Heron E, Kenny G, Fahey C, et al. Excess of rare novel loss-of-function variants in synaptic genes in schizophrenia and autism spectrum disorders. Mol Psychiatry. 2014;19(8):872–9. [DOI] [PubMed] [Google Scholar]
- 4.Fromer M, Pocklington AJ, Kavanagh DH, Williams HJ, Dwyer S, Gormley P, et al. De novo mutations in schizophrenia implicate synaptic networks. Nature. 2014;506(7487):179–84. [DOI] [PMC free article] [PubMed] [Google Scholar]
- 5.McGee A, Li G, Lu Z, Qiu S. Convergent synaptic and circuit substrates underlying autism genetic risks. Front Biol (Beijing). 2014;9(2):137–50. [DOI] [PMC free article] [PubMed] [Google Scholar]
- 6.Hammerschlag AR, de Leeuw CA, Middeldorp CM, Polderman TJC. Synaptic and brain-expressed gene sets relate to the shared genetic risk across five psychiatric disorders. Psychol Med. 2020;50(10):1695–705. [DOI] [PMC free article] [PubMed] [Google Scholar]
- 7.van Spronsen M, Hoogenraad CC. Synapse pathology in psychiatric and neurologic disease. Curr Neurol Neurosci Rep. 2010;10(3):207–14. [DOI] [PMC free article] [PubMed] [Google Scholar]
- 8.Zoghbi HY, Bear MF. Synaptic dysfunction in neurodevelopmental disorders associated with autism and intellectual disabilities. Cold Spring Harb Perspect Biol. 2012;4(3). [DOI] [PMC free article] [PubMed] [Google Scholar]
- 9.Grant SGN. Synapse diversity and synaptome architecture in human genetic disorders. Hum Mol Genet. 2019;28(R2):R219–r25. [DOI] [PMC free article] [PubMed] [Google Scholar]
- 10.Campbell DB, D’Oronzio R, Garbett K, Ebert PJ, Mirnics K, Levitt P, et al. Disruption of cerebral cortex MET signaling in autism spectrum disorder. Ann Neurol. 2007;62(3):243–50. [DOI] [PubMed] [Google Scholar]
- 11.Plummer JT, Evgrafov OV, Bergman MY, Friez M, Haiman CA, Levitt P, et al. Transcriptional regulation of the MET receptor tyrosine kinase gene by MeCP2 and sex-specific expression in autism and Rett syndrome. Transl Psychiatry. 2013;3(10):e316. [DOI] [PMC free article] [PubMed] [Google Scholar]
- 12.Aldinger KA, Timms AE, MacDonald JW, McNamara HK, Herstein JS, Bammler TK, et al. Transcriptome data of temporal and cingulate cortex in the Rett syndrome brain. Sci Data. 2020;7(1):192. [DOI] [PMC free article] [PubMed] [Google Scholar]
- 13.Voineagu I, Wang X, Johnston P, Lowe JK, Tian Y, Horvath S, et al. Transcriptomic analysis of autistic brain reveals convergent molecular pathology. Nature. 2011;474(7351):380–4. [DOI] [PMC free article] [PubMed] [Google Scholar]
- 14.Eagleson KL, Lane CJ, McFadyen-Ketchum L, Solak S, Wu HH, Levitt P. Distinct intracellular signaling mediates C-MET regulation of dendritic growth and synaptogenesis. Dev Neurobiol. 2016;76(10):1160–81. [DOI] [PMC free article] [PubMed] [Google Scholar]
- 15.Chen K, Ma X, Nehme A, Wei J, Cui Y, Cui Y, et al. Time-delimited signaling of MET receptor tyrosine kinase regulates cortical circuit development and critical period plasticity. Mol Psychiatry. 2021;26(8):3723–36. [DOI] [PMC free article] [PubMed] [Google Scholar]
- 16.Ma X, Chen K, Lu Z, Piechowicz M, Liu Q, Wu J, et al. Disruption of MET Receptor Tyrosine Kinase, an Autism Risk Factor, Impairs Developmental Synaptic Plasticity in the Hippocampus. Dev Neurobiol. 2019;79(1):36–50. [DOI] [PMC free article] [PubMed] [Google Scholar]
- 17.Ma X, Wei J, Cui Y, Xia B, Zhang L, Nehme A, et al. Disrupted Timing of MET Signaling Derails the Developmental Maturation of Cortical Circuits and Leads to Altered Behavior in Mice. Cereb Cortex. 2021. [DOI] [PMC free article] [PubMed] [Google Scholar]
- 18.Peng Y, Lu Z, Li G, Piechowicz M, Anderson M, Uddin Y, et al. The autism-associated MET receptor tyrosine kinase engages early neuronal growth mechanism and controls glutamatergic circuits development in the forebrain. Mol Psychiatry. 2016;21(7):925–35. [DOI] [PMC free article] [PubMed] [Google Scholar]
- 19.Qiu S, Lu Z, Levitt P. MET receptor tyrosine kinase controls dendritic complexity, spine morphogenesis, and glutamatergic synapse maturation in the hippocampus. J Neurosci. 2014;34(49):16166–79. [DOI] [PMC free article] [PubMed] [Google Scholar]
- 20.Xie Z, Eagleson KL, Wu HH, Levitt P. Hepatocyte Growth Factor Modulates MET Receptor Tyrosine Kinase and β-Catenin Functional Interactions to Enhance Synapse Formation. eNeuro. 2016;3(4). [DOI] [PMC free article] [PubMed] [Google Scholar]
- 21.Tyndall SJ, Walikonis RS. The receptor tyrosine kinase Met and its ligand hepatocyte growth factor are clustered at excitatory synapses and can enhance clustering of synaptic proteins. Cell Cycle. 2006;5(14):1560–8. [DOI] [PubMed] [Google Scholar]
- 22.Judson MC, Bergman MY, Campbell DB, Eagleson KL, Levitt P. Dynamic gene and protein expression patterns of the autism-associated met receptor tyrosine kinase in the developing mouse forebrain. J Comp Neurol. 2009;513(5):511–31. [DOI] [PMC free article] [PubMed] [Google Scholar]
- 23.Judson MC, Amaral DG, Levitt P. Conserved subcortical and divergent cortical expression of proteins encoded by orthologs of the autism risk gene MET. Cereb Cortex. 2011;21(7):1613–26. [DOI] [PMC free article] [PubMed] [Google Scholar]
- 24.Kast RJ, Wu HH, Levitt P. Developmental Connectivity and Molecular Phenotypes of Unique Cortical Projection Neurons that Express a Synapse-Associated Receptor Tyrosine Kinase. Cereb Cortex. 2019;29(1):189–201. [DOI] [PMC free article] [PubMed] [Google Scholar]
- 25.Lanjewar AL, Jagetia S, Khan ZM, Eagleson KL, Levitt P. Subclass-specific expression patterns of MET receptor tyrosine kinase during development in medial prefrontal and visual cortices. J Comp Neurol. 2023;531(1):132–48. [DOI] [PMC free article] [PubMed] [Google Scholar]
- 26.Eagleson KL, Milner TA, Xie Z, Levitt P. Synaptic and extrasynaptic location of the receptor tyrosine kinase met during postnatal development in the mouse neocortex and hippocampus. J Comp Neurol. 2013;521(14):3241–59. [DOI] [PMC free article] [PubMed] [Google Scholar]
- 27.Xie Z, Li J, Baker J, Eagleson KL, Coba MP, Levitt P. Receptor Tyrosine Kinase MET Interactome and Neurodevelopmental Disorder Partners at the Developing Synapse. Biol Psychiatry. 2016;80(12):933–42. [DOI] [PMC free article] [PubMed] [Google Scholar]
- 28.Judson MC, Eagleson KL, Wang L, Levitt P. Evidence of cell-nonautonomous changes in dendrite and dendritic spine morphology in the met-signaling-deficient mouse forebrain. J Comp Neurol. 2010;518(21):4463–78. [DOI] [PMC free article] [PubMed] [Google Scholar]
- 29.Taoufiq Z, Ninov M, Villar-Briones A, Wang HY, Sasaki T, Roy MC, et al. Hidden proteome of synaptic vesicles in the mammalian brain. Proc Natl Acad Sci U S A. 2020;117(52):33586–96. [DOI] [PMC free article] [PubMed] [Google Scholar]
- 30.Husi H, Grant SG. Isolation of 2000-kDa complexes of N-methyl-D-aspartate receptor and postsynaptic density 95 from mouse brain. J Neurochem. 2001;77(1):281–91. [DOI] [PubMed] [Google Scholar]
- 31.Filiou MD, Bisle B, Reckow S, Teplytska L, Maccarrone G, Turck CW. Profiling of mouse synaptosome proteome and phosphoproteome by IEF. Electrophoresis. 2010;31(8):1294–301. [DOI] [PubMed] [Google Scholar]
- 32.Moczulska KE, Pichler P, Schutzbier M, Schleiffer A, Rumpel S, Mechtler K. Deep and precise quantification of the mouse synaptosomal proteome reveals substantial remodeling during postnatal maturation. J Proteome Res. 2014;13(10):4310–24. [DOI] [PubMed] [Google Scholar]
- 33.Roy M, Sorokina O, McLean C, Tapia-González S, DeFelipe J, Armstrong JD, et al. Regional Diversity in the Postsynaptic Proteome of the Mouse Brain. Proteomes. 2018;6(3). [DOI] [PMC free article] [PubMed] [Google Scholar]
- 34.McClatchy DB, Liao L, Lee JH, Park SK, Yates JR 3rd. Dynamics of subcellular proteomes during brain development. J Proteome Res. 2012;11(4):2467–79. [DOI] [PMC free article] [PubMed] [Google Scholar]
- 35.Cizeron M, Qiu Z, Koniaris B, Gokhale R, Komiyama NH, Fransén E, et al. A brainwide atlas of synapses across the mouse life span. Science. 2020;369(6501):270–5. [DOI] [PMC free article] [PubMed] [Google Scholar]
- 36.Dahlhaus M, Li KW, van der Schors RC, Saiepour MH, van Nierop P, Heimel JA, et al. The synaptic proteome during development and plasticity of the mouse visual cortex. Mol Cell Proteomics. 2011;10(5):M110.005413. [DOI] [PMC free article] [PubMed] [Google Scholar]
- 37.Bai F, Witzmann FA. Synaptosome proteomics. Subcell Biochem. 2007;43:77–98. [DOI] [PMC free article] [PubMed] [Google Scholar]
- 38.Xu Y, Song X, Wang D, Wang Y, Li P, Li J. Proteomic insights into synaptic signaling in the brain: the past, present and future. Mol Brain. 2021;14(1):37. [DOI] [PMC free article] [PubMed] [Google Scholar]
- 39.Dieterich DC, Kreutz MR. Proteomics of the Synapse--A Quantitative Approach to Neuronal Plasticity. Mol Cell Proteomics. 2016;15(2):368–81. [DOI] [PMC free article] [PubMed] [Google Scholar]
- 40.Engmann O, Campbell J, Ward M, Giese KP, Thompson AJ. Comparison of a protein-level and peptide-level labeling strategy for quantitative proteomics of synaptosomes using isobaric tags. J Proteome Res. 2010;9(5):2725–33. [DOI] [PubMed] [Google Scholar]
- 41.Mallei A, Giambelli R, Gass P, Racagni G, Mathé AA, Vollmayr B, et al. Synaptoproteomics of learned helpless rats involve energy metabolism and cellular remodeling pathways in depressive-like behavior and antidepressant response. Neuropharmacology. 2011;60(7–8):1243–53. [DOI] [PubMed] [Google Scholar]
- 42.Barks AK, Beeson MM, Matveeva T, Gale JJ, Rao R, Tran PV. Perinatal Ischemia Alters Global Expression of Synaptosomal Proteins Critical for Neural Plasticity in the Developing Mouse Brain. Dev Neurosci. 2019:1–13. [DOI] [PubMed] [Google Scholar]
- 43.Lang D, Schott BH, van Ham M, Morton L, Kulikovskaja L, Herrera-Molina R, et al. Chronic Toxoplasma infection is associated with distinct alterations in the synaptic protein composition. J Neuroinflammation. 2018;15(1):216. [DOI] [PMC free article] [PubMed] [Google Scholar]
- 44.Eshraghi M, Gombar R, De Repentigny Y, Vacratsis PO, Kothary R. Pathologic Alterations in the Proteome of Synaptosomes from a Mouse Model of Spinal Muscular Atrophy. J Proteome Res. 2019;18(8):3042–51. [DOI] [PubMed] [Google Scholar]
- 45.Reim D, Distler U, Halbedl S, Verpelli C, Sala C, Bockmann J, et al. Proteomic Analysis of Post-synaptic Density Fractions from Shank3 Mutant Mice Reveals Brain Region Specific Changes Relevant to Autism Spectrum Disorder. Front Mol Neurosci. 2017;10:26. [DOI] [PMC free article] [PubMed] [Google Scholar]
- 46.Sapp E, Seeley C, Iuliano M, Weisman E, Vodicka P, DiFiglia M, et al. Protein changes in synaptosomes of Huntington’s disease knock-in mice are dependent on age and brain region. Neurobiol Dis. 2020;141:104950. [DOI] [PubMed] [Google Scholar]
- 47.Shen L, Yang A, Chen X, Xiao S, Liu X, Lin J, et al. Proteomic Profiling of Cerebrum Mitochondria, Myelin Sheath, and Synaptosome Revealed Mitochondrial Damage and Synaptic Impairments in Association with 3 × Tg-AD Mice Model. Cell Mol Neurobiol. 2022;42(6):1745–63. [DOI] [PMC free article] [PubMed] [Google Scholar]
- 48.MacDonald ML, Garver M, Newman J, Sun Z, Kannarkat J, Salisbury R, et al. Synaptic Proteome Alterations in the Primary Auditory Cortex of Individuals With Schizophrenia. JAMA Psychiatry. 2020;77(1):86–95. [DOI] [PMC free article] [PubMed] [Google Scholar]
- 49.Chang RY, Etheridge N, Nouwens AS, Dodd PR. SWATH analysis of the synaptic proteome in Alzheimer’s disease. Neurochem Int. 2015;87:1–12. [DOI] [PubMed] [Google Scholar]
- 50.Thompson BL, Levitt P. Complete or partial reduction of the Met receptor tyrosine kinase in distinct circuits differentially impacts mouse behavior. J Neurodev Disord. 2015;7:35. [DOI] [PMC free article] [PubMed] [Google Scholar]
- 51.Eagleson KL, Villaneuva M, Southern RM, Levitt P. Proteomic and mitochondrial adaptations to early-life stress are distinct in juveniles and adults. Neurobiol Stress. 2020;13:100251. [DOI] [PMC free article] [PubMed] [Google Scholar]
- 52.Blue ME, Parnavelas JG. The formation and maturation of synapses in the visual cortex of the rat. II. Quantitative analysis. J Neurocytol. 1983;12(4):697–712. [DOI] [PubMed] [Google Scholar]
- 53.Aghajanian GK, Bloom FE. The formation of synaptic junctions in developing rat brain: a quantitative electron microscopic study. Brain Res. 1967;6(4):716–27. [DOI] [PubMed] [Google Scholar]
- 54.Dyson SE, Jones DG. Quantitation of terminal parameters and their inter-relationships in maturing central synapses: a perspective for experimental studies. Brain Res. 1980;183(1):43–59. [DOI] [PubMed] [Google Scholar]
- 55.Markus EJ, Petit TL. Neocortical synaptogenesis, aging, and behavior: lifespan development in the motor-sensory system of the rat. Exp Neurol. 1987;96(2):262–78. [DOI] [PubMed] [Google Scholar]
- 56.Voss BJ, Loh JT, Hill S, Rose KL, McDonald WH, Cover TL. Alteration of the Helicobacter pylori membrane proteome in response to changes in environmental salt concentration. Proteomics Clin Appl. 2015;9(11–12):1021–34. [DOI] [PMC free article] [PubMed] [Google Scholar]
- 57.Perez-Riverol Y, Bai J, Bandla C, García-Seisdedos D, Hewapathirana S, Kamatchinathan S, et al. The PRIDE database resources in 2022: a hub for mass spectrometry-based proteomics evidences. Nucleic Acids Res. 2022;50(D1):D543–d52. [DOI] [PMC free article] [PubMed] [Google Scholar]
- 58.Koopmans F, van Nierop P, Andres-Alonso M, Byrnes A, Cijsouw T, Coba MP, et al. SynGO: An Evidence-Based, Expert-Curated Knowledge Base for the Synapse. Neuron. 2019;103(2):217–34.e4. [DOI] [PMC free article] [PubMed] [Google Scholar]
- 59.Huang da W, Sherman BT, Lempicki RA. Systematic and integrative analysis of large gene lists using DAVID bioinformatics resources. Nat Protoc. 2009;4(1):44–57. [DOI] [PubMed] [Google Scholar]
- 60.Sherman BT, Hao M, Qiu J, Jiao X, Baseler MW, Lane HC, et al. DAVID: a web server for functional enrichment analysis and functional annotation of gene lists (2021 update). Nucleic Acids Res. 2022;50(W1):W216–21. [DOI] [PMC free article] [PubMed] [Google Scholar]
- 61.Corera AT, Doucet G, Fon EA. Long-term potentiation in isolated dendritic spines. PLoS One. 2009;4(6):e6021. [DOI] [PMC free article] [PubMed] [Google Scholar]
- 62.Anggono V, Koç-Schmitz Y, Widagdo J, Kormann J, Quan A, Chen CM, et al. PICK1 interacts with PACSIN to regulate AMPA receptor internalization and cerebellar long-term depression. Proc Natl Acad Sci U S A. 2013;110(34):13976–81. [DOI] [PMC free article] [PubMed] [Google Scholar]
- 63.Widagdo J, Fang H, Jang SE, Anggono V. PACSIN1 regulates the dynamics of AMPA receptor trafficking. Sci Rep. 2016;6:31070. [DOI] [PMC free article] [PubMed] [Google Scholar]
- 64.Empson RM, Buckby LE, Kraus M, Bates KJ, Crompton MR, Gundelfinger ED, et al. The cell adhesion molecule neuroplastin-65 inhibits hippocampal long-term potentiation via a mitogen-activated protein kinase p38-dependent reduction in surface expression of GluR1-containing glutamate receptors. J Neurochem. 2006;99(3):850–60. [DOI] [PubMed] [Google Scholar]
- 65.Ster J, Steuble M, Orlando C, Diep TM, Akhmedov A, Raineteau O, et al. Calsyntenin-1 regulates targeting of dendritic NMDA receptors and dendritic spine maturation in CA1 hippocampal pyramidal cells during postnatal development. J Neurosci. 2014;34(26):8716–27. [DOI] [PMC free article] [PubMed] [Google Scholar]
- 66.Bonnycastle K, Davenport EC, Cousin MA. Presynaptic dysfunction in neurodevelopmental disorders: Insights from the synaptic vesicle life cycle. J Neurochem. 2021;157(2):179–207. [DOI] [PubMed] [Google Scholar]
- 67.Zhou Q, Zhou P, Wang AL, Wu D, Zhao M, Südhof TC, et al. The primed SNARE-complexin-synaptotagmin complex for neuronal exocytosis. Nature. 2017;548(7668):420–5. [DOI] [PMC free article] [PubMed] [Google Scholar]
- 68.Kleiger G, Mayor T. Perilous journey: a tour of the ubiquitin-proteasome system. Trends Cell Biol. 2014;24(6):352–9. [DOI] [PMC free article] [PubMed] [Google Scholar]
- 69.Seet BT, Dikic I, Zhou MM, Pawson T. Reading protein modifications with interaction domains. Nat Rev Mol Cell Biol. 2006;7(7):473–83. [DOI] [PubMed] [Google Scholar]
- 70.Ehlers MD. Activity level controls postsynaptic composition and signaling via the ubiquitin-proteasome system. Nat Neurosci. 2003;6(3):231–42. [DOI] [PubMed] [Google Scholar]
- 71.Bingol B, Sheng M. Deconstruction for reconstruction: the role of proteolysis in neural plasticity and disease. Neuron. 2011;69(1):22–32. [DOI] [PubMed] [Google Scholar]
- 72.Ferreira JS, Schmidt J, Rio P, Águas R, Rooyakkers A, Li KW, et al. GluN2B-Containing NMDA Receptors Regulate AMPA Receptor Traffic through Anchoring of the Synaptic Proteasome. J Neurosci. 2015;35(22):8462–79. [DOI] [PMC free article] [PubMed] [Google Scholar]
- 73.Goo MS, Scudder SL, Patrick GN. Ubiquitin-dependent trafficking and turnover of ionotropic glutamate receptors. Front Mol Neurosci. 2015;8:60. [DOI] [PMC free article] [PubMed] [Google Scholar]
- 74.Hegde AN. Proteolysis, synaptic plasticity and memory. Neurobiol Learn Mem. 2017;138:98–110. [DOI] [PMC free article] [PubMed] [Google Scholar]
- 75.Willeumier K, Pulst SM, Schweizer FE. Proteasome inhibition triggers activity-dependent increase in the size of the recycling vesicle pool in cultured hippocampal neurons. J Neurosci. 2006;26(44):11333–41. [DOI] [PMC free article] [PubMed] [Google Scholar]
- 76.Matus A Actin-based plasticity in dendritic spines. Science. 2000;290(5492):754–8. [DOI] [PubMed] [Google Scholar]
- 77.Gunning PW, Hardeman EC, Lappalainen P, Mulvihill DP. Tropomyosin - master regulator of actin filament function in the cytoskeleton. J Cell Sci. 2015;128(16):2965–74. [DOI] [PubMed] [Google Scholar]
- 78.Rao JN, Madasu Y, Dominguez R. Mechanism of actin filament pointed-end capping by tropomodulin. Science. 2014;345(6195):463–7. [DOI] [PMC free article] [PubMed] [Google Scholar]
- 79.Gray KT, Suchowerska AK, Bland T, Colpan M, Wayman G, Fath T, et al. Tropomodulin isoforms utilize specific binding functions to modulate dendrite development. Cytoskeleton (Hoboken). 2016;73(6):316–28. [DOI] [PMC free article] [PubMed] [Google Scholar]
- 80.Gray KT, Stefen H, Ly TNA, Keller CJ, Colpan M, Wayman GA, et al. Tropomodulin’s Actin-Binding Abilities Are Required to Modulate Dendrite Development. Front Mol Neurosci. 2018;11:357. [DOI] [PMC free article] [PubMed] [Google Scholar]
- 81.Cox PR, Fowler V, Xu B, Sweatt JD, Paylor R, Zoghbi HY. Mice lacking Tropomodulin-2 show enhanced long-term potentiation, hyperactivity, and deficits in learning and memory. Mol Cell Neurosci. 2003;23(1):1–12. [DOI] [PubMed] [Google Scholar]
- 82.Gulyássy P, Puska G, Györffy BA, Todorov-Völgyi K, Juhász G, Drahos L, et al. Proteomic comparison of different synaptosome preparation procedures. Amino Acids. 2020;52(11–12):1529–43. [DOI] [PMC free article] [PubMed] [Google Scholar]
Associated Data
This section collects any data citations, data availability statements, or supplementary materials included in this article.
Supplementary Materials
Data Availability Statement
Publicly available datasets were used in this study. Each dataset is deposited to the ProteomeXchange Consortium via the PRIDE partner repository with the dataset identifier PXD033204. Further inquiries can be directed to the corresponding author.