

Abstract
Purpose:
The number of American Indian and Alaska Native (AI/AN) people living with dementia is expected to increase five-fold by 2060. Social determinants of health may explain disparities in incidence of Alzheimer’s disease (AD) but remain largely overlooked.
Methods:
We examined the time trend of AD mortality rates and associations of percent of AI/ANs, density of primary care physicians and neurologists, area deprivation index, rurality, and Indian Health Service region with AD mortality in 646 Purchased/Referred Care Delivery Area Counties.
Results:
AD mortality rates significantly increased over time. Counties with higher concentrations of AI/AN people had lower AD mortality. More deprived counties had 34% higher AD mortality compared to less deprived counties. AD mortality was 20% lower in non-metro counties than metro counties.
Conclusions:
Findings have implications for prioritizing areas where more resources for AD care, education, or outreach are needed.
Keywords: Alzheimer’s disease, American Indian, Alaska Native, Mortality, Access to Care, Socioeconomic status, Rurality
Background
Alzheimer’s disease (AD) is an irreversible, progressive brain disease affecting 4.7 million Americans over 65 years of age in 2010, with a projected increase for to 13.8 million cases by 2050.1 In 2019, AD was the sixth leading cause of death in the US.2 The only longitudinal study of AD mortality rates by race and ethnicity showed that between 1999 and 2004, death related to AD increased by 80% among American Indian and Alaska Native people (AI/AN).3 AI/AN people alone or in combination with other racial and ethnic groups comprise 7.1 million people or 2% of the U.S. population.4 The Centers for Disease Control and Prevention (CDC) reports that 20% of AI/AN people aged 45 and over experience cognitive decline related to memory loss and predicts the number of AI/AN people aged 65 and over living with dementia will increase fivefold by 2060.5
Previous research has largely focused on non-modifiable or clinical risk factors for AD including aging, gene variants, family history, traumatic brain injury, hypertension, or diabetes.6–9 Modifiable social determinants of health, such as access to healthcare, poverty, or rurality, may explain disparities in incidence of and mortality related to AD, but remain largely overlooked.10 Primary care physician (PCPs) and specialists play an important role in diagnosing and managing the needs of individuals with AD.1,11 However, PCP and neurologist shortage is an ongoing concern across the US.12 AI/AN people are particularly vulnerable to this shortage due to geographical or financial barriers related to accessing healthcare, lack of culturally competent providers, and distrust of medical professionals.13
Multiple studies in England, Wales, and the US have revealed that living in socioeconomically deprived neighborhoods is associated with increased incident dementia,14,15 incident AD,16,17 and mortality related to dementia.14 Urban-rural disparities in mortality rates related to AD are also documented. Rural counties are experiencing a large and widening disparity in mortality related to AD compared to their urban counterparts.3,18 These disparities may be associated with lower socioeconomic status, limited infrastructure, or larger prevalence of other chronic conditions that increase the risk of AD in socioeconomically deprived and rural areas.18 Around 25% of AI/AN people live on reservations or other trust lands, most of which are geographically isolated with limited infrastructure.19 This may render AI/AN people particularly vulnerable to AD.
In the absence of accurate incidence or prevalence data about AD, mortality data are commonly used to estimate the burden of AD in communities. Consistent with this approach, we conducted a longitudinal examination of AD mortality trends as a function of the percentage of AI/AN residents living in each county (hereafter AI/AN concentration), physician density, socioeconomic status, and rurality. We focused on AI/AN people as the nation’s most rural population and a population understudied in AD research.
Methods
This longitudinal study was conducted at the level of county in Indian Health Service (IHS) Purchased/Referred Care Delivery Areas (PRCDA). These areas contain or are located adjacent to federally recognized tribal lands.20 Approximately 62% of the AI/AN people live in PRCDA counties and race classification for AI/AN people is more accurate in these areas compared to other counties.21 Figure 1 show the location of PRCDA counties in the United States.
Figure 1.
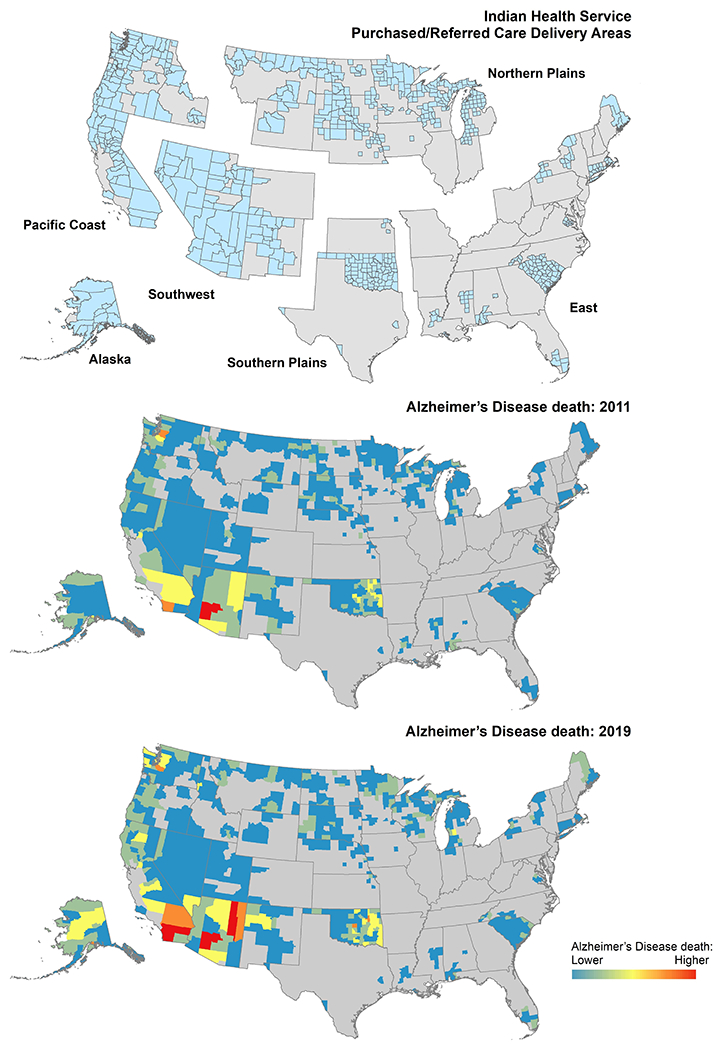
Alzheimer’s disease mortality among American Indian/Alaska Native people in Purchased/Referred Care Delivery Area Counties by Indian Health Service Region.
We used mortality data from the Centers for Disease Control and Prevention (CDC) National Vital Statistics System for years 2011-2019. Counties are the smallest spatial unit for which the CDC provides mortality data. De-identified mortality data were obtained through a data sharing agreement with the CDC.
Reported AD deaths were identified as either the underlying cause or contributing cause of death using International Classification of Diseases (ICD-10) codes of G30.0, G30.1, G30.8, or G30.9. A single underlying cause of death in addition to < 20 additional contributing causes of death can be reported on the US standard Certificate of Death. We included decedents identified as AI/AN alone or in combination with other race or ethnicities. Race and ethnicity information on death certificates is collected from next of kin or by observation of a coroner or physician.22
Measures
The outcome variable was the number of AD deaths per county and year. All AI/AN decedents were 45 years or older at the time of death. No missing data was reported for age among AI/AN decedents with AD as the underlying or contributing cause of death.
Independent variables included year, percent of AI/AN people, density of PCPs, density of neurologists, area deprivation index (ADI), rural-urban continuum codes (RUCC), and an indicator variable for PRCDA regions. We calculated percentage of AI/AN people per county and year. This measure reflected racial composition of counties in terms of percentage of AI/ANs and has been previously used as an indicator for racial residential homogeneity and segregation.23
The Health Resources and Services Administration provided data on the number of non-federal PCPs and neurologists by county.24 These data were based on the American Medical Association Masterfile. Data on PCPs were available for 2011-2019. Data on neurologists were available for 2010, 2015, and 2018. The 2010 neurologists’ data were merged with 2011-2013 mortality data, the 2015 neurologists’ data to 2014-2016 mortality data, and the 2018 neurologists’ data to 2017-2019 mortality data. We approximated physician density by calculating PCP and neurology availability per 10,000 persons for each county and year.
We used ADI, a validated composite score of socioeconomic status, to represent the socioeconomic characteristics of counties.25 This index is based on 17 census variables in four domains: poverty, housing, employment, and education. Scores range from one to 100, with higher scores reflecting more deprivation. We created a binary indicator of high deprivation (top 30%), as a surrogate for low socioeconomic status.25 ADI data for 2015 were joined with mortality data for 2011-2019.
County rurality was defined by RUCC codes. Codes of 1-3 were classified as metro; codes of 4-9 were classified as non-metro.26 The metro category includes large urban counties with a population of 250,000 or larger. The non-metro category includes small urban areas with a population of 20,000 and rural areas with a population of 2,500.26 RUCC data for 2013 was linked to mortality data for 2011-2019.
PRCDA counties are typically grouped into six IHS regions including Alaska, East, Northern Plains, Pacific Coast, Southern Plains, and Southwest.20 We combined Alaska with Pacific Coast because of the small number of cases. Members of federally recognized tribes may receive healthcare through this, clinics run by tribal governments, or private or federal insurance plans. IHS provides primary care only and for this reason access to specialized healthcare and hospital care is generally not available on tribal lands.27
Statistical Analysis
Descriptive statistics included age-adjusted mortality rates for AD overall and by ADI, RUCC, and PRCDA region. Rates were calculated per 100,000 persons and are age-adjusted to the 2000 U.S. standard population.20 We used generalized linear mixed models with zero inflated negative binomial distribution to estimate the association between AD mortality and our independent variables. These were estimated as bivariable models (adjusted by time), for each independent variable separately, and as a multivariable model that included all independent variables together. All models included a fixed effect for time, a random intercept for county, and the log of AI/AN population by county and year as the offset variable. Less deprivation, metro designation, and East were the reference categories for the ADI, RUCC, and IHS region variables. Results are reported as incidence risk ratios (IRR) with 95% confidence intervals (CI). The significance level was set at 0.05 (two-tailed). All analyses were conducted by R software version 4.0.3 and the glmmTMB package.
Results
Our dataset included 3,024 AD deaths in 646 PRCDA counties (Figure 1). The average county was composed of 7.0% (interquartile range = 1.0-5.8%) AI/AN people in 2011 and 7.4% (interquartile range = 1.0-6.6%) AI/AN people in 2019. More counties were classified as less deprived compared to more deprived (62% vs 38%) or non-metro compared to metro (67% vs 33%). Overall age-adjusted AD mortality rate increased from 36.2 per 100,000 people in 2011 to 44.2 per 100,000 people in 2019, an increase of 22%. Increase in mortality rates was larger for more deprived counties versus less deprived counties (an increase of 30% vs 17%). Across RUCC designations, AD mortality rates increased from 44.7 per 100,000 people in 2011 to 54.9 per 100,000 in 2019 in metro counties and from 27.9 per 100,000 people in 2011 to 32.5 per 100,000 in 2019 in non-metro counties (an increase of 23% in metro vs 16% in non-metro counties). For IHS regions, the greatest increase in the AD mortality rate was observed in the Southern Plains followed by East and Pacific Coast/Alaska in AD mortality. In contrast, the Northern Plains and Southwest experienced slightly decreased AD mortality rates. Table 1 shows age-adjusted AD mortality rates among AI/AN people by ADI, RUCC, and IHS region.
Table 1.
Age-adjusted mortality rates related to Alzheimer’s disease among American Indian/Alaska Native people by rurality, socioeconomic status, and state, 2011-2019
| Age-adjusted mortality rate (95% confidence interval) | Number of counties (%) | 2011 | 2012 | 2013 | 2014 | 2015 | 2016 | 2017 | 2018 | 2019 | % Change |
|---|---|---|---|---|---|---|---|---|---|---|---|
| Number of deaths | 646 | 238 | 239 | 270 | 305 | 350 | 385 | 410 | 416 | 411 | --- |
| Overall mortality rate | 646 | 36.2 (31.6-41.1) | 34.4 (30.1-39.1) | 38.4 (33.9-43.3) | 40.6 (36.1-45.5) | 45.2 (40.5-50.2) | 45.8 (41.3-50.7) | 47.6 (43.1-52.5) | 44.9 (40.6-49.5) | 44.2 (39.9-48.7) | 22% |
| Area deprivation index (ADI) | |||||||||||
| Less deprived | 398 (62) | 40.8 (34.7-47.8) | 38.5 (32.7-45.0) | 46.3 (40.0-53.3) | 49.3 (43.0-56.2) | 49.0 (43.0-55.8) | 51.2 (45.2-57.8) | 52.2 (46.2-58.7) | 49.2 (43.6-55.2) | 47.8 (42.3-53.8) | 17% |
| More deprived | 248 (38) | 29.2 (22.9-36.7) | 28.2 (22.2-35.3) | 25.6 (19.9-32.5) | 26.6 (20.9-33.4) | 38.5 (31.7-46.4) | 36.3 (29.8-43.9) | 39.8 (33.1-47.5) | 37.2 (30.8-44.5) | 38.0 (31.7-45.2) | 30% |
| Rural-urban continuum codes (RUCC) | |||||||||||
| Metro | 211 (33) | 44.7 (37.6-52.8) | 43.3 (36.5-51.0) | 47.6 (40.5-55.5) | 54.6 (47.2-62.8) | 53.7 (46.6-61.5) | 57.5 (50.3-65.3) | 59.2 (52.2-67.0) | 54.1 (47.6-61.2) | 54.9 (48.4-62.0) | 23% |
| Non-metro | 435 (67) | 27.9 (22.5-34.3) | 25.6 (20.5-31.5) | 29.2 (23.8-35.5) | 27.0 (22-32.8) | 36.2 (30.5-42.8) | 33.9 (28.5-40.0) | 35.6 (30.1-41.8) | 35.3 (29.9-41.3) | 32.5 (27.4-38.3) | 16% |
| Indian Health Service region (IHS) | |||||||||||
| East | 127 (20) | 20.0 (10.2-35.2) | <10 cases | 30.8 (17.5-50.2) | 26.1 (14.1-44.0) | 45.3 (29.0-67.2) | 26.6 (14.9-43.4) | 32.0 (18.8-50.4) | 30.1 (17.3-48.5) | 29.1 (17.0-46.0) | 45% |
| Northern Plains | 227 (35) | 40.0 (26.2-58.1) | 38.8 (26.2-55.1) | 46.3 (31.8-65.0) | 38.8 (26.3-54.9) | 30.6 (19.7-45.3) | 39.9 (27.6-55.7) | 39.7 (28.2-54.3) | 29.6 (19.9-42.2) | 39.5 (28.1-54.0) | −1% |
| Pacific Coast/Alaska | 139 (22) | 58.9 (46.9-73.0) | 54.5 (43.6-67.2) | 62.7 (51.3-75.8) | 65.3 (54.3-78.0) | 63.0 (52.5-74.9) | 68.2 (57.7-80.1) | 74.6 (63.4-87.2) | 66.9 (56.8-78.3) | 67.9 (57.6-79.5) | 15% |
| Southern Plains | 84 (13) | 42.4 (31.8-55.4) | 46.4 (35.8-59.1) | 39 (29.4-50.8) | 40.6 (30.9-52.3) | 66.2 (53.6-80.8) | 61.2 (49.5-74.7) | 81.4 (68.0-96.6) | 73.9 (61.4-88.1) | 68.6 (56.8-82) | 62% |
| Southwest | 69 (11) | 22.2 (16.6-29.1) | 17.6 (12.6-23.8) | 21 (15.7-27.6) | 26.7 (20.8-33.7) | 25.9 (20.2-32.6) | 26.7 (21.1-33.3) | 17.5 (13.2-22.9) | 23.4 (18.5-29.2) | 20.2 (15.7-25.6) | −9% |
Age-adjusted mortality rates were standardized to the 2000 projected U.S. standard population.
95% confidence interval are included in parentheses for age-adjusted mortality rates.
Table 2 depicts the results of bivariable and multivariable generalized linear mixed models. In bivariable models, time was associated with an increased incidence risk of AD. Every 10% increase in percentage of AI/AN people was associated with a 15% lower risk for AD mortality (IRR=0.85, 95% CI=0.81-0.89). Non-metro counties had 31% lower risk for AD mortality compared to metro counties (IRR=0.69, 95% CI=0.57 – 0.83). Compared to IHS region East, the risk for AD mortality was 76% higher in Pacific Coast/Alaska (IRR=1.76, 95% CI=1.34 – 2.31), 98% higher in Southern Plains (IRR=1.98, 95% CI=1.47 – 2.66), and 35% lower in Southwest (IRR=0.65, 95% CI=0.47 – 0.91). Other county characteristics including PCP density, neurology density, and ADI were not significantly related to AD mortality in bivariable models.
Table 2.
Bivariable and multivariable associations of county characteristics associated with Alzheimer’s disease mortality among American Indian/Alaska Native people in the United States, 2011-2019.
| Independent variables | IRR (95% CI) | IRR (95% CI) | IRR (95% CI) | IRR (95% CI) | IRR (95% CI) | IRR (95% CI) | IRR (95% CI) | IRR (95% CI) |
|---|---|---|---|---|---|---|---|---|
| Time | 1.08 (1.06 – 1.09) *** | 1.08 (1.06 – 1.09) *** | 1.08 (1.06 – 1.09) *** | 1.07 (1.06 – 1.09) *** | 1.08 (1.06 – 1.09) *** | 1.08 (1.06 – 1.09) *** | 1.08 (1.06 – 1.09) *** | 1.08 (1.06 – 1.09) *** |
| 10% increase in American Indian and Alaska Native population | 0.85 (0.81 – 0.89) *** | 0.86 (0.82 – 0.91) *** | ||||||
| Primary care physician per 10,000 people | 1.02 (1.00 – 1.05) | 1.02 (0.99 – 1.05) | ||||||
| Neurologist per 10,000 people | 1.29 (1.00 – 1.67) ** | 1.07 (0.81 – 1.40) | ||||||
| Area deprivation index | ||||||||
| Less deprived | Ref | Ref | ||||||
| More deprived | 0.96 (0.79 – 1.17) | 1.34 (1.06 – 1.70) * | ||||||
| Rural-urban continuum codes | ||||||||
| Metro | Ref | Ref | ||||||
| Non-metro | 0.69 (0.57 – 0.83) *** | 0.80 (0.66 – 0.97) * | ||||||
| Indian Health Service region | ||||||||
| East | Ref | Ref | ||||||
| Northern Plains | 0.92 (0.69 – 1.22) | 1.25 (0.94 – 1.66) | ||||||
| Pacific Coast/Alaska | 1.76 (1.34 – 2.31) *** | 2.16 (1.64 – 2.85) *** | ||||||
| Southern Plains | 1.98 (1.47 – 2.66) *** | 2.25 (1.67 – 3.04) *** | ||||||
| Southwest | 0.65 (0.47 – 0.91) * | 0.87 (0.63 – 1.21) |
IRR: incidence risk ratio; CI: confidence interval;
p<0.05,
p<0.01,
p<0.
Similar results were observed in multivariable models. AD mortality significantly increased over time (IRR=1.08, 95% CI=1.06 – 1.09). Every 10% increase in percentage of AI/AN people was associated with a 14% lower risk for AD mortality (IRR=0.86, 95% CI=0.82–0.91). More deprived counties had 34% higher risk for AD mortality compared to less deprived counties (IRR=1.34, 95% CI=1.06 – 1.70). Non-metro counties had 20% lower risk for AD mortality compared to metro counties (IRR=0.80, 95% CI=0.66 – 0.97). Compared to IHS region East, the risk for AD mortality was two times higher in Pacific Coast/Alaska (IRR=2.16, 95% CI=1.64 – 2.85) and Southern Plains (IRR=2.25, 95% CI=1.67 – 3.04) controlling for other county characteristics. None of the interactions between time and county characteristics were significantly related to AD mortality rates (results are not shown; available on request from authors).
Discussion
To our knowledge this is the first longitudinal study to examine AD mortality trends as a function of county characteristics among AI/AN people. Our findings reveal that mortality rates associated with AD increased overtime, a finding consistent with previous research.3,28 This increase represents actual increase in the number of AI/AN people dying with AD. This trend can also be attributed to the increase in the average life expectancy of this population, from 44 years in 1970 to 74 years in 2010, surviving to an age when the risk for developing AD or related dementias typically increases.29,30 A variety of other factors, including improved diagnosis or awareness of AD, mandates in assessment for cognitive impairment, and changes in the perception of AD as a cause of death likely attribute to this increase.31,32
Our study showed that higher concentration of AI/AN people in a county was associated with a lower risk for AD mortality. Even though AI/AN communities have experienced colonization, genocide, historical trauma, and poverty,33 they have exhibit remarkable resilience in the face of overwhelming socioeconomic adversity and cultural change.33 Thus, it may be the case that the sense of community through larger presence of AI/AN people serves as a protective factor against developing AD. It may also be the case that AD is underreported and underdiagnosed in these communities. IHS or clinics run by tribal governments and funded by IHS provide healthcare to members of federally recognized tribes.27 Even though previous research show that AD mortality is lower among AI/AN people compared to White or Black people,3,34 insights from IHS healthcare providers suggest that mortality data do not provide a complete picture of AD burden on AI/AN communities and that AD is underreported among this population.35 Additionally, studies that explored AI/AN people’s knowledge of AD showed that AI/AN people are only moderately informed about AD.36 Given that our findings describe a lower AD mortality rates in counties with a larger percentage of AI/AN, community outreach and education should target raising awareness of AD in areas with higher concentration of AI/AN people. Concurrently, future research should disentangle the extent to which community resilience may be protective for risk of AD among AI/AN people.
More deprived areas had higher AD mortality rates compared to less deprived areas. This finding is consistent with previous literature showing that the incidence and mortality related to dementia are higher in more deprived areas.14–17,37 This disparity may reflect inequalities in diet, vascular risk factors, or access to healthcare among other characteristics that may be related to the clinical manifestation of dementia. An unexpected finding was that non-metro counties had lower AD mortality rates compared to metro counties. This was inconsistent with previous research showing AD mortality mainly among White people.3,18 The lower rate of AD in non-metro areas may be confounded by lower physician density or limited/moderate information about AD.11 Given that AI/AN people are less likely to be diagnosed with AD even when symptoms are present13 and that clinical risk factors for AD including diabetes, hypertension, and obesity are prevalent among AI/AN people living in rural areas,6,38 future efforts should increase access to care to improve diagnosis and management of AD. Developing systems to track prevalence of AD and increasing awareness of the disease in rural areas is also warranted.
This analysis has several limitations. First, misclassification of AI/AN people in vital statistics data is common.39 This may have led to underestimating AD mortality among AI/AN people, hindering mortality status assessments, and impeding the planning, implementation, and evaluation of public health strategies to address AD for this population. Second, AD deaths are typically underreported on vital statistics. AD is more likely to be reported on death certificates of individuals with severe AD or those living in long-term care facilities.40 Third, we only had data on county of residence for decedents at the time of death. County at the time of death can only represent overall area characteristics at a single point in a decedent’s lifetime. Using this information, we created a single timepoint measure of rurality, ADI, and access to PCPs, and neurologists but these measures may change overtime. Fourth, our analysis included trends in the number of AD deaths adjusted by county population. We did not calculate age-adjusted mortality rate for PRCDA counties because of small number of deaths among AI/AN people within some counties. Fifth, relying on mortality data to estimate the burden of AD in AI/AN or other communities may introduce bias. Accurate and timely data on incidence and prevalence of ADRD is essential not only for examining factors contributing to the development or progression of AD but also for estimating communities’ needs and resources regarding AD. Lastly, our findings may not be generalizable to other settings with different population groups.
In conclusion, mortality rates associated with AD among AI/AN people increased between 2011–2019. A higher risk for AD mortality was observed in counties with a lower concentration of AI/AN people, in more deprived, and in metro counties. These findings have implications for prioritizing areas where more resources for AD care, education, or outreach is needed.
Funding/Support:
This work was funded by University of Colorado Denver / National Institute on Minority Health and Health Disparities (U54MD000507, PI: Spero Manson).
Role of the Funder/Sponsor:
The funder has no role in the design, data collection, analysis, and interpretation of the results; preparation, review, or approval of the manuscript; and decision to submit the manuscript for publication.
Conflict of interest:
S.A. was supported by a subcontract from the University of Colorado Denver. D.B, L.J., and S.M. were supported by the National Institute on Minority Health and Health Disparities (U54MD000507). D.B. was funded by grants from the National Institute of Aging (P01AG066584, P50AG005136).
Footnotes
Original Submission Statement: The work presented in the manuscript has not been published elsewhere and is not being considered by another journal.
Contributor Information
Solmaz Amiri, Institute for Research and Education to Advance Community Health (IREACH), Elson S. Floyd College of Medicine, Washington State University, Seattle, WA, USA.
Luohua Jiang, Department of Epidemiology & Biostatistics, Susan and Henry Samueli College of Health Sciences, University of California, Irvine, CA, USA.
Spero M. Manson, Centers for American Indian and Alaska Native Health, Department of Community & Behavioral Health, University of Colorado, Aurora, CO, USA.
Dedra S. Buchwald, Institute for Research and Education to Advance Community Health (IREACH), Elson S. Floyd College of Medicine, Washington State University, Seattle, WA, USA.
References
- 1.2020 Alzheimer’s disease facts and figures. 10.1002/alz.12068. Alzheimer’s & Dementia. 2020/March/01 2020;16(3):391–460. doi: 10.1002/alz.12068 [DOI] [PubMed] [Google Scholar]
- 2.CDC. Leading Causes of Death. Accessed 7/12, 2021. https://www.cdc.gov/nchs/fastats/leading-causes-of-death.htm
- 3.Taylor CA, Greenlund S, McGuire LC, Lu H, Greenlund K, Croft JB. DEATHS FROM ALZHEIMER’S DISEASE—UNITED STATES, 1999–2014. Innovation in Aging. 2017;1(Suppl 1):343–344. doi: 10.1093/geroni/igx004.1259 [DOI] [Google Scholar]
- 4.US Census. Facts for Features: American Indian and Alaska Native Heritage Month: November 2021. United States Census Bureau. https://www.census.gov/newsroom/facts-for-features/2021/aian-month.html [Google Scholar]
- 5.CDC. Road Map for Indian Country. Accessed September 25, 2020. https://www.cdc.gov/aging/healthybrain/Indian-country-roadmap.html
- 6.Silva MVF, Loures CMG, Alves LCV, de Souza LC, Borges KBG, Carvalho MDG. Alzheimer’s disease: risk factors and potentially protective measures. J Biomed Sci. May 9 2019;26(1):33. doi: 10.1186/s12929-019-0524-y [DOI] [PMC free article] [PubMed] [Google Scholar]
- 7.Mendez MF. What is the Relationship of Traumatic Brain Injury to Dementia? J Alzheimers Dis. 2017;57(3):667–681. doi: 10.3233/jad-161002 [DOI] [PubMed] [Google Scholar]
- 8.Aschenbrenner AJ, Balota DA, Gordon BA, Ratcliff R, Morris JC. A diffusion model analysis of episodic recognition in preclinical individuals with a family history for Alzheimer’s disease: The adult children study. Neuropsychology. 2016;30(2):225–238. doi: 10.1037/neu0000222 [DOI] [PMC free article] [PubMed] [Google Scholar]
- 9.Dai MH, Zheng H, Zeng LD, Zhang Y. The genes associated with early-onset Alzheimer’s disease. Oncotarget. Mar 13 2018;9(19):15132–15143. doi: 10.18632/oncotarget.23738 [DOI] [PMC free article] [PubMed] [Google Scholar]
- 10.Eid A, Mhatre I, Richardson JR. Gene-environment interactions in Alzheimer’s disease: A potential path to precision medicine. Pharmacol Ther. Jul 2019;199:173–187. doi: 10.1016/j.pharmthera.2019.03.005 [DOI] [PMC free article] [PubMed] [Google Scholar]
- 11.Bradford A, Kunik ME, Schulz P, Williams SP, Singh H. Missed and delayed diagnosis of dementia in primary care: prevalence and contributing factors. Alzheimer Dis Assoc Disord. Oct-Dec 2009;23(4):306–14. doi: 10.1097/WAD.0b013e3181a6bebc [DOI] [PMC free article] [PubMed] [Google Scholar]
- 12.Dall TM, Storm MV, Chakrabarti R, et al. Supply and demand analysis of the current and future US neurology workforce. Neurology. Jul 30 2013;81(5):470–8. doi: 10.1212/WNL.0b013e318294b1cf [DOI] [PMC free article] [PubMed] [Google Scholar]
- 13.Alzheimer’s Association. Native Americans and Alzheimer’s. Accessed 2/11, 2022. https://www.alz.org/help-support/resources/native-americans
- 14.Chung S-C, Providencia R, Sofat R, et al. Incidence, morbidity, mortality and disparities in dementia: A population linked electronic health records study of 4.3 million individuals. 10.1002/alz.12635. Alzheimer’s & Dementia. 2022/March/15 2022;n/a(n/a)doi: 10.1002/alz.12635 [DOI] [PMC free article] [PubMed] [Google Scholar]
- 15.Cadar D, Lassale C, Davies H, Llewellyn DJ, Batty GD, Steptoe A. Individual and Area-Based Socioeconomic Factors Associated With Dementia Incidence in England: Evidence From a 12-Year Follow-up in the English Longitudinal Study of Ageing. JAMA Psychiatry. Jul 1 2018;75(7):723–732. doi: 10.1001/jamapsychiatry.2018.1012 [DOI] [PMC free article] [PubMed] [Google Scholar]
- 16.Dalton J, Pfoh E, Berg K, et al. Neighborhood Deprivation and Incident Alzheimer’s Disease: A Regional Cohort Study of Electronic Medical Records. Innovation in Aging. 2021;5(Supplement_1):60–60. doi: 10.1093/geroni/igab046.230 [DOI] [Google Scholar]
- 17.Vassilaki M, Aakre J, Castillo A, et al. Area Deprivation Index and Progression to Dementia (S2.007). Neurology. 2022;98(18 Supplement):1244. [Google Scholar]
- 18.Kulshreshtha A, Ramer S, Cato S, Hajjar I. Alzheimer’s disease mortality high in rural areas in South: 1999-2019. 10.1002/alz.054933. Alzheimer’s & Dementia. 2021/December/01 2021;17(S10):e054933. doi: 10.1002/alz.054933 [DOI] [Google Scholar]
- 19.U.S. Census Bureau. Quick Facts: Washington 2019. U.S. Census Bureau. Accessed June 8, 2020. https://www.census.gov/quickfacts/WA [Google Scholar]
- 20.Melkonian SC, Jim MA, Haverkamp D, et al. Disparities in Cancer Incidence and Trends among American Indians and Alaska Natives in the United States, 2010-2015. Cancer Epidemiol Biomarkers Prev. Oct 2019;28(10):1604–1611. doi: 10.1158/1055-9965.epi-19-0288 [DOI] [PMC free article] [PubMed] [Google Scholar]
- 21.Erdrich J, Cordova-Marks F, Monetathchi AR, Wu M, White A, Melkonian S. Disparities in Breast-Conserving Therapy for Non-Hispanic American Indian/Alaska Native Women Compared with Non-Hispanic White Women. Annals of Surgical Oncology. 2021/September/06 2021;doi: 10.1245/s10434-021-10730-7 [DOI] [PMC free article] [PubMed] [Google Scholar]
- 22.Arias E, Schauman WS, Eschbach K, Sorlie PD, Backlund E. The validity of race and Hispanic origin reporting on death certificates in the United States. Vital Health Stat 2. Oct 2008;(148):1–23. [PubMed] [Google Scholar]
- 23.Jiang L, Chang J, Beals J, Bullock A, Manson SM, Special Diabetes Program for Indians Diabetes Prevention Demonstration P. Neighborhood characteristics and lifestyle intervention outcomes: Results from the Special Diabetes Program for Indians. Preventive medicine. 2018;111:216–224. doi: 10.1016/j.ypmed.2018.03.009 [DOI] [PMC free article] [PubMed] [Google Scholar]
- 24.HRSA. Area Health Resources Files. Health Resources and Services Administration. Accessed 2021, https://data.hrsa.gov/topics/health-workforce/ahrf [Google Scholar]
- 25.Knighton AJ, Savitz L, Belnap T, Stephenson B, VanDerslice J. Introduction of an Area Deprivation Index Measuring Patient Socioeconomic Status in an Integrated Health System: Implications for Population Health. eGEMs. August/11 2016;4(3)doi: 10.13063/2327-9214.1238 [DOI] [PMC free article] [PubMed] [Google Scholar]
- 26.USDA. Rural-Urban Continuum Codes. United States Department of Agriculture. Accessed December 10, 2020. https://www.ers.usda.gov/data-products/rural-urban-continuum-codes/documentation/ [Google Scholar]
- 27.Koeze E, Patel JK, Singhvi A. Where Americans Live Far From the Emergency Room. The New York Times. [Google Scholar]
- 28.Steenland K, MacNeil J, Vega I, Levey A. Recent trends in Alzheimer disease mortality in the United States, 1999 to 2004. Alzheimer disease and associated disorders. Apr-Jun 2009;23(2):165–170. doi: 10.1097/wad.0b013e3181902c3e [DOI] [PMC free article] [PubMed] [Google Scholar]
- 29.Vincent GK, Velkoff VA. Current population reports. Washington, DC: US Census Bureau. 2010:25–1138. [Google Scholar]
- 30.CDC. U.S. burden of Alzheimer’s disease, related dementias to double by 2060. Centers for Disease Control and Prevention. Accessed September, 25, 2020. https://www.cdc.gov/media/releases/2018/p0920-alzheimers-burden-double-2060.html [Google Scholar]
- 31.Alzheimer’s Association. Milestones. Accessed March 11th, 2022. https://www.alz.org/alzheimers-dementia/research_progress/milestones
- 32.Pyenson B, Sawhney TG, Steffens C, et al. The real-world Medicare costs of Alzheimer disease: considerations for policy and care. Journal of managed care & specialty pharmacy. 2019;25(7):800–809. [DOI] [PMC free article] [PubMed] [Google Scholar]
- 33.Oré CE, Teufel-Shone NI, Chico-Jarillo TM. American Indian and Alaska Native resilience along the life course and across generations: A literature review. American Indian and Alaska native mental health research (Online). 2016;23(3):134–157. doi: 10.5820/aian.2303.2016.134 [DOI] [PMC free article] [PubMed] [Google Scholar]
- 34.Kramarow EA, Tejada-Vera B. Dementia Mortality in the United States, 2000–2017. National Vital Statistics Report. Accessed September, 25, 2020. https://www.cdc.gov/nchs/data/nvsr/nvsr68/nvsr68_02-508.pdf [PubMed] [Google Scholar]
- 35.HHS. A Big Sky Approach to a National Challenge before Committee on Aging United States Senate. US Department of Health and Human Services. https://www.ihs.gov/sites/newsroom/themes/responsive2017/display_objects/documents/testimony/113/113th-August-13-2014.pdf [Google Scholar]
- 36.Jernigan M, Boyd AD, Noonan C, Buchwald D. Alzheimer’s disease knowledge among American Indians and Alaska Natives. Alzheimer’s & dementia (New York, N Y). 2020;6(1):e12101–e12101. doi: 10.1002/trc2.12101 [DOI] [PMC free article] [PubMed] [Google Scholar]
- 37.Jitlal M, Amirthalingam GNK, Karania T, et al. The Influence of Socioeconomic Deprivation on Dementia Mortality, Age at Death, and Quality of Diagnosis: A Nationwide Death Records Study in England and Wales 2001–2017. Journal of Alzheimer’s Disease. 2021;81:321–328. doi: 10.3233/JAD-210089 [DOI] [PubMed] [Google Scholar]
- 38.Pugazhenthi S, Qin L, Reddy PH. Common neurodegenerative pathways in obesity, diabetes, and Alzheimer’s disease. Biochim Biophys Acta Mol Basis Dis. May 2017;1863(5):1037–1045. doi: 10.1016/j.bbadis.2016.04.017 [DOI] [PMC free article] [PubMed] [Google Scholar]
- 39.Jim MA, Arias E, Seneca DS, et al. Racial misclassification of American Indians and Alaska Natives by Indian Health Service Contract Health Service Delivery Area. American journal of public health. 2014;104 Suppl 3(Suppl 3):S295–S302. doi: 10.2105/AJPH.2014.301933 [DOI] [PMC free article] [PubMed] [Google Scholar]
- 40.Gao L, Calloway R, Zhao E, Brayne C, Matthews FE, Medical Research Council Cognitive Function and Ageing C. Accuracy of death certification of dementia in population-based samples of older people: analysis over time. Age and ageing. 2018;47(4):589–594. doi: 10.1093/ageing/afy068 [DOI] [PMC free article] [PubMed] [Google Scholar]