Abstract
BodyMap is a human and mouse gene expression database that has been maintained since 1993. It is based on site-directed 3′-ESTs collected from non-biased cDNA libraries constructed at Osaka University and contains >270 000 sequences from 60 human and 38 mouse tissues. The site-directed nature of the sequence tags allows unequivocal grouping of tags representing the same transcript and provides abundance information for each transcript in different parts of the body. Our collection of ESTs was compared periodically with other public databases for cross referencing. The histological resolution of source tissues and unique cloning strategy that minimized cloning bias enabled BodyMap to support three unique mRNA based experiments in silico. First, the recurrence information for clones in each library provides a rough estimate of the mRNA composition of each source tissue. Second, a user can search the entire data set with nucleotide sequences or keywords to assess expression patterns of particular genes. Third, and most important, BodyMap allows a user to select genes that have a desired expression pattern in humans and mice. BodyMap is accessible through the WWW at http://bodymap.ims.u-tokyo.ac.jp
INTRODUCTION
The genome contains not only a series of blueprints for the building of individual proteins but also a coordinated program of protein synthesis and the means for controlling its execution. To deduce the functions of genes from their nucleotide sequences, decoding of these two independent pieces of genomic information is necessary because the former, the structural information, defines the action of each gene product and the latter, the regulatory information, determines the consequence of the action in the context of life. Knowledge of the codon rules, secondary structure prediction methods, and libraries of functional peptide motifs have made the extraction of the structural information from genomic sequences possible. In contrast, the paucity of information about cis-elements that define the execution of genetic programs have made it difficult to understand regulation of expression based on genomic sequence alone, especially in higher eukaryotes. Accordingly, the importance of systematic collection of gene expression data in parallel with the genome sequencing effort has been emphasized (1).
BodyMap is the first systematic effort to identify genes and collect gene expression information for the human and mouse genomes (2–4). During collection of expressed sequence tags (EST) for construction of the BodyMap database, non-structural information contained in the mRNA, transcript abundance and anatomical distribution were carefully preserved. The libraries were constructed from well characterized sources so as to minimize the differences in cloning efficiencies among transcripts, and libraries were never amplified prior to sequencing. Accordingly, BodyMap has characteristics distinct from those of other public EST data sets, which favor gene variety at the cost of quantitative expression information by normalizing libraries and using highly complex sources.
CONSTRUCTING THE DATABASE
Primary data
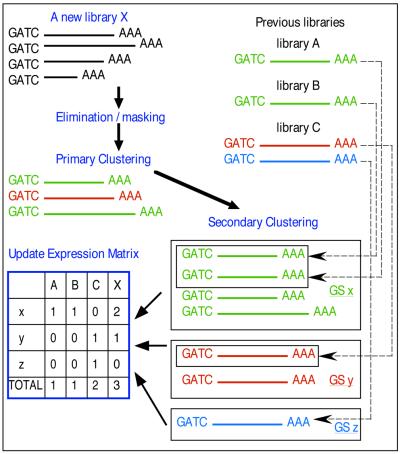
The 3′-EST data accumulated in BodyMap were all collected from locally-produced 3′-directed libraries that contain only the most 3′-terminal MboI fragments of cDNAs. They all started with GATC and were read toward the polyA tail. As of July 1999, BodyMap contained 159 429 human and 123 468 mouse ESTs. The steps in construction of the database that are described below are illustrated in Figure 1.
Figure 1.
Steps in construction of the database
Elimination/masking of uninformative sequences
Before storing the sequences in the database, uninformative sequences were identified and eliminated or separated to maintain the quality of the data. Those sequences with >5% Ns, not starting with GATC, or having more than one GATC were eliminated. We then eliminated those sequences having >90% similarity in a overlap longer than 50 bp or 70% of the EST length with libraries of vector and ribosomal sequences. Sequences for mitochondrial transcripts were separated from the analysis flow. The lengths of ESTs in BodyMap were determined primarily by the location of MboI sites in the cDNAs, and those sequences with a GATC site located within 20 bp of the polyA tail were separated out because they were considered too short for gene identification. Lastly, sequences were compared with a library of repetitive sequences based on REPBASE (5) using BLAST (6), and repetitive regions were masked. The repeat masking task was carried out as follows. Matching regions of no less than 20 bp overlap were identified. To simulate our judgement and the tendency of repeats to have many variations, we defined the threshold for similarity as a function of the length of the overlap. It started at 95% for 20 bp, and the threshold declined until it reached 70% for overlaps of >100 bp. Finally, the matched regions were masked.
The inspection of most sequences was carried out automatically, but ~1% of the sequences were reviewed manually. The inspected sequences are stored in the database.
Transcript counting/EST clustering
Newly-submitted tag sequences, ~1000 from each new library, were compared using FASTA (7). When the similarity exceeded 95% in a overlap longer than 50 bp or 70% of tag length and the overlap started at a GATC, they were considered the same tag and clustered (primary cluster). From each cluster one representative tag sequence was selected and compared with the representative sequences from previously generated clusters.
Using the same criteria, clusters of the same tags were grouped, and a new representative tag was selected from the new cluster (secondary cluster). A five figure cluster ID referred to as the Gene Signature (GS) number was assigned to each independent cluster.
Cross references/searching for equivalents in other data sets
Representative sequences for the GS clusters were compared periodically with the primate division of GenBank and ESTs used in the latest version of UniGene. The criteria for identity were the same as those for clustering. Based on the identities, links to one GenBank entry and one Hs_sequence in UniGene were made.
Expression matrix
As a result of the similarity searches, all GS clusters are indicated with their recurrence in all libraries in BodyMap, their identity in GenBank, and their corresponding UniGene sequence. All data are stored in a relational database (Sybase). A spreadsheet showing the occurrence of each tag in each library (GS versus sources), referred to as the expression matrix, was generated periodically. For efficiency, every query from the user interface concerning expression patterns is processed using the latest expression matrix.
GS card
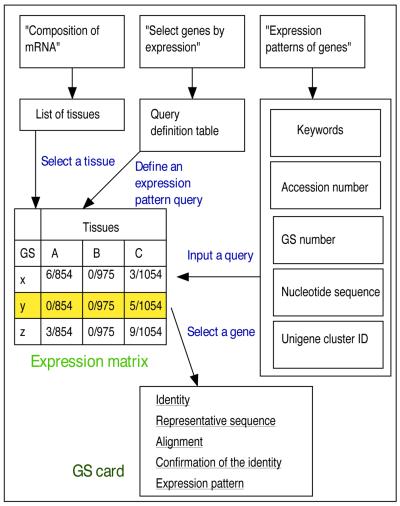
Detailed information for each GS cluster is presented in the form of a ‘GS card’ that shows the representative sequence, presence or absence of repetitive sequences, the multiple alignment of the tag sequences represented by the GS, and the distribution across all analyzed libraries.
DATABASE USAGE
BodyMap serves as computerized multi-tissue mRNA. Three types of sheets are prepared for each query. For every query, a portion of the compressed expression matrix is returned. From each compressed matrix, detailed information for each GS can be selected (Fig. 2).
Figure 2.
The navigation map in the database
Composition of mRNA
In the query sheet, by selecting one source tissue from a menu, a GS list is created in descending order of recurrence in the selected library. This list shows the most abundant transcripts in the selected tissue and their rough concentrations in total mRNA. Such data are useful as a reference for microarray hybridizations or for promoter selection in gene transfer experiments.
Expression patterns of genes
GS can be searched by nucleotide sequences, keywords, GenBank accession numbers or UniGene IDs. Accession numbers and keywords are converted to nucleotide sequences using GenBank annotations prior to searching. Matches are returned in the form of an expression matrix from which a user can go into the GS cards for details.
Select genes by expression patterns
The query sheet allows users to define expression patterns by complex logical expressions regarding presence or absence of the tags in each library.
Although the total numbers of analyzed clones are ~1000 for each library, the well-defined nature and the relative homogeneity of cell types allows joining of multiple libraries into a hypothetical tissue or tissues that makes the selection more sensitive. For example, to select genes active preferentially in nervous tissues, the corresponding query would be ‘find those genes present in sources from nervous system and absent in the rest’. In the same manner, users can select the transcripts unique to some systems as well as those common across different systems. To facilitate writing such complex expressions, the web page provides a form for pattern definition that can be filled quickly by checks of radio buttons. On the form, each library is provided with a set of boxes representing one of three conditions: absent in any, present in some and present in all.
FUTURE DEVELOPMENT
Analysis of regulated transcription based on statistical models (8) is currently in progress. In the coming update, prior to gene selection users will be able to set a confidence level for the inference about the differential expression between two libraries. For example, presence of a tag in brain will not affect the selection of the gastrin gene as preferentially expressed in gastric mucosa.
Incorporation of the emerging expression information into the coordinates of BodyMap expression matrix is also scheduled. PCR-based gene-by-gene analysis of expression pattern data that is being collected at Osaka University will be the first data to be included.
SUPPLEMENTARY MATERIAL
Supplementary Material available at NAR Online consists of four figures representing (i) GS cluster; (ii) expression matrix; (iii) GS card and (iv) a summary of statistics.
REFERENCES
- 1.Okubo K. and Matsubara,K. (1997) FEBS Lett., 403, 225–229. [DOI] [PubMed] [Google Scholar]
- 2.Bortoluzzi S. and Danieli,G.A. (1999) Trends Genet., 15, 118–119. [DOI] [PubMed] [Google Scholar]
- 3.Okubo K., Hori,N., Matoba,R., Niiyama,T., Fukushima,A., Kojima,Y. and Matsubara,K. (1992) Nature Genet., 2, 173–179. [DOI] [PubMed] [Google Scholar]
- 4.Kawamoto S., Matsumoto,Y., Mizuno,K., Okubo,K. and Matsubara,K. (1996) Gene, 174, 151–158. [DOI] [PubMed] [Google Scholar]
- 5.Jurka J. (1998) Curr. Opin. Struct. Biol., 8, 333–337. [DOI] [PubMed] [Google Scholar]
- 6.Altschul S.F., Madden,T.L., Schaffer,A.A., Zhang,J., Zhang,Z., Miller,W. and Lipman,D.J. (1997) Nucleic Acids Res., 25, 3389–3402. [DOI] [PMC free article] [PubMed] [Google Scholar]
- 7.Pearson W.R. and Lipman,D.J. (1988) Proc. Natl Acad. Sci. USA, 85, 2444–2448. [DOI] [PMC free article] [PubMed] [Google Scholar]
- 8.Audic S. and Claverie,J.M. (1997) Genome Res., 7, 986–995. [DOI] [PubMed] [Google Scholar]
Associated Data
This section collects any data citations, data availability statements, or supplementary materials included in this article.


