


Abstract
The UK Crop Plant Bioinformatics Network (UK CropNet) was established in 1996 in order to harness the extensive work in genome mapping in crop plants in the UK. Since this date we have published five databases from our central UK CropNet WWW site (http://synteny.nott.ac.uk/ ) with a further three to follow shortly. Our resource facilitates the identification and manipulation of agronomically important genes by laying a foundation for comparative analysis among crop plants and model species. In addition, we have developed a number of software tools that facilitate the visualisation and analysis of our data. Many of our tools are made freely available for use with both crop plant data and with data from other species.
INTRODUCTION
UK CropNet was established in 1996, initially with 3 years funding from the BBSRC PAGA II initiative and latterly with continued BBSRC funding until 2003. UK CropNet is a collaborative project with a membership of six groups, each making a major contribution to plant genome analysis in the UK. The six groups are Arabidopsis (University of Nottingham), Barley and Potato (Scottish Crop Research Institute), Brassicas (John Innes Centre), Cereals (John Innes Centre), Comparative Genome Analysis (John Innes Centre) and Forage Grasses (Institute of Grassland and Environmental Research). The project is tripartite involving the creation and population of databases, the development of novel graphical interfaces (with special emphasis on comparative mapping) and training.
A suite of new graphical tools for data interpretation and display has been developed. The tools, which have been written in the Java language to give platform independence, have been designed to maximise their use both within UK CropNet and throughout the wider bioinformatics community. They are currently being interfaced to the UK CropNet databases in prototype applications. It is hoped that these will become publicly available in the near future, once thorough testing and optimisation has been carried out.
UK CropNet CROP PLANT DATABASES
The six UK CropNet groups have developed eight UK databases using the ACEDB (http://www.sanger.ac.uk/Software/Acedb/ ) database management system (DBMS) (Richard Durbin, Sanger Centre, UK and Jean Thierry-Mieg, CNRS, Montpellier, France). ACEDB is a popular choice of DBMS for crop plant information worldwide and by using it we gain compatibility with many international data sources. The UK CropNet databases are the Arabidopsis Genome Resource (AGR), BarleyDB, BrassicaDB, CerealsDB, Comparative Mapping (ComapDB), Forage Grasses (FoggDB), MilletGenes and SpudBase. Table 1 gives a summary of the information held within each of these resources, together with the availability of each database.
Table 1. A summary of data published in the UK CropNet databases.

The UK CropNet WWW server (http://synteny.nott.ac.uk/ ) is the central repository for the UK CropNet databases and project information. We have established pages to outline our project mission, to give contact details for our members and latterly, to download UK CropNet software (http://synteny.nott.ac.uk/software.html ) (see software section below). The database section (http://synteny.nott.ac.uk/db.html ) gives access to the five public UK CropNet databases and mirrors of nine USDA-funded crop plant databases. Access over the WWW currently uses the recently developed AceBrowser interface (http://stein.cshl.org/AcePerl/AceBrowser/ ) (Lincoln Stein, Cold Spring Harbor Laboratory, NY). In future, we will provide CORBA-based interfaces (see software section below), so that our users may carry out fully interactive interrogation of the databases. To supplement the ACEDB interfaces, we also provide various searching facilities both on our WWW pages and across the multiple databases simultaneously.
In addition to being accessible through the UK CropNet WWW server, the databases may be accessed through the website of the USDA-ARS Center for Bioinformatics and Comparative Genomics (http://genome.cornell.edu/ ). In a reciprocal agreement, nine USDA crop plant databases are mirrored at the UK CropNet site. This provides faster access to these databases for UK users and also provides a cross-querying search facility in which the UK CropNet and USDA databases can be queried singly or in combination.
UK CropNet SOFTWARE
We have adopted a Java/CORBA framework for our software, to enable cross-platform applicability. We endeavour to write our software so that it can be interfaced to any data source and consequently used by a wider community. We have written Java graphical components that will give the user considerable power for both general and fine-grained comparative analyses of many different types of data. Our Circles Engine (http://jiio8.jic.bbsrc.ac.uk/bioinformatics/developers/miscellaneous/circleengine/index.html ) has a special multi-layered software specification that enables it to display entities that have a ring structure. One instance of it is the Circular Genome Display (CGD) (http://jiio8.jic.bbsrc.ac.uk/bioinformatics/developers/comparative/cgmd/index.html ) (e.g., Fig. 1) which is a dynamic, interactive version of the display seen in a series of papers by Moore and colleagues and is the ‘gateway’ to our other comparative displays. CGD has a new CORBA interface to the ComapDB database and consequently displays may be drawn ‘on-the-fly’ within a user’s WWW browser
Figure 1.

A Circular Genome Display of rice, foxtail millet and sugar cane.
The GridMap (http://synteny.nott.ac.uk/gridmap/grid-top.htm ) is a powerful generic tool that represents similarities and differences between pairs of objects, including genomes and sequences, in a grid form. It is particularly useful for graphical analysis of comparative mapping data and can be used to represent displays such as Oxford Grids and Species Grids. The Recombinant Viewer (http://synteny.nott.ac.uk/software.html ) is a tool for analysing genetic segregation data from a mapping population. By applying user-definable rules to colour-code symbols according to their context it can highlight areas of special interest such as double crossover events or highly heterozygous plants. The flexibility of data type built in to this viewer also enables it to be used as a tool to display multiple DNA sequence alignments. ‘Gel Sketch’ is a simple tool which displays a representation of a gel when given a table of bands with associated molecular weights. The Pairwise Comparative Map (PCM) (http://synteny.nott.ac.uk/pairwise/Welcome.html ) displays two maps of any type and draws lines between the homologous loci on each map (Fig. 2). Maps may be resized, inverted or swapped. Clicking on a locus highlights it along with any homologues on the same map (paralogues) and on the opposite one (orthologues). The Multi PCM allows a number of PCMs to be placed in a scrollpane. Highlighting a locus in one PCM has the effect of highlighting all the homologues across all of the PCMs. The maps are colour co-ordinated across the Multi PCM to unify the maps originating from the same database. A new prototype application in Java 3D enables us to visualize high-density genomic data. We have developed a Perl module, and more recently a Java interface, to carry out Quick and Dirty (QAD) genetic mapping. This can rapidly map new markers using a simplified approach based on contextual comparison with existing scoring data. All these displays have been designed to give maximum power for displaying UK CropNet data but with the wider community also in mind. Consequently, our displays are configurable and are made publicly and freely available through the UK CropNet software repository.
Figure 2.
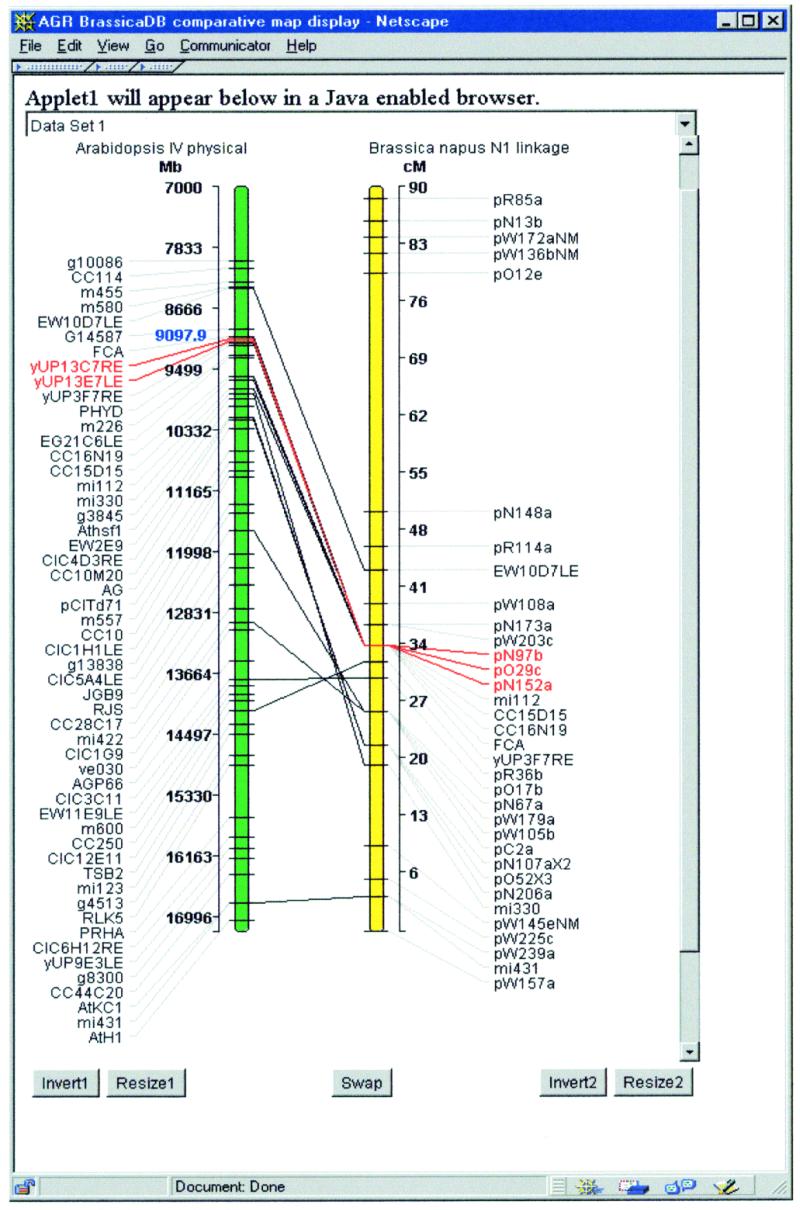
A Pairwise Comparative Map of the physical map of Arabidopsis chromosome IV and the genetic map of Brassica napus N1.
Inter-operability within UK CropNet, to facilitate comparative mapping and genomics, centres on our newly developed CORBA interface to ACEDB (CITA) (http://jiio16.jic.bbsrc.ac.uk/BrassicaDB/CITA/index.html ). This provides the infrastructure for cross-database querying. Prototype CITA servers have been written in Perl and C that allow simultaneous connections to multiple ACEDB databases. In addition, a general-purpose Java client (GFace) that is launched through a user’s WWW browser has been developed. This allows both simple and advanced querying, the display of simple text objects as well as the invocation of UK CropNet graphical displays such as the PCM and GridMap. GFace thus reinstates, and enhances, for the remote user much of the graphical interactivity that local use of an ACEDB database offers and which, to some extent, has been lost in the Webace and AceBrowser implementations. A new tool, ARCADE (A Real-time Comparative Analysis Display Environment), will use CITA to facilitate querying of multiple databases, so that complex comparative queries and analyses may be performed. The functional specification of ARCADE is currently being written in collaboration with other interested parties. Our data interfaces will use the forthcoming standards to be made by the OMG’s Life Sciences Special Interest Group.
FUTURE INITIATIVES
Access to the databases
We will enable CITA access (through the Gface client) to both the UK CropNet databases and the USDA crop plant databases at the UK CropNet WWW site.
User-training
We will shortly begin training courses for current and potential users of the UK CropNet resources. Training will begin with a widely publicised one-day dissemination event to alert potential users to the databases and resources of UK CropNet and those of our sister UK Animal Bioinformatics Network (http://www.ri.bbsrc.ac.uk/bioinformatics/databases.html ). Following this, two-day training meetings will be held at UK CropNet sites at three-monthly intervals. Users will register for their site of interest (for their species of interest) 3 months in advance. Users with pertinent data to be input will be particularly encouraged to register and attend.
Acknowledgments
ACKNOWLEDGEMENT
We would like to thank the BBSRC for their continued support of this project.