

Abstract
Human microproteins encoded by long non‐coding RNAs (lncRNA) have been increasingly discovered, however, complete functional characterization of these emerging proteins is scattered. Here, we show that LINC00493‐encoded SMIM26, an understudied microprotein localized in mitochondria, is tendentiously downregulated in clear cell renal cell carcinoma (ccRCC) and correlated with poor overall survival. LINC00493 is recognized by RNA‐binding protein PABPC4 and transferred to ribosomes for translation of a 95‐amino‐acid protein SMIM26. SMIM26, but not LINC00493, suppresses ccRCC growth and metastatic lung colonization by interacting with acylglycerol kinase (AGK) and glutathione transport regulator SLC25A11 via its N‐terminus. This interaction increases the mitochondrial localization of AGK and subsequently inhibits AGK‐mediated AKT phosphorylation. Moreover, the formation of the SMIM26‐AGK‐SCL25A11 complex maintains mitochondrial glutathione import and respiratory efficiency, which is abrogated by AGK overexpression or SLC25A11 knockdown. This study functionally characterizes the LINC00493‐encoded microprotein SMIM26 and establishes its anti‐metastatic role in ccRCC, and therefore illuminates the importance of hidden proteins in human cancers.
Keywords: clear cell renal cell carcinoma, hidden proteins, metastasis, microproteins, SMIM26
Subject Categories: Cancer, RNA Biology, Signal Transduction
LINC00493‐derived mitochondrial microprotein SMIM26 suppresses clear cell renal cell carcinoma metastasis via interaction with AGK and SLC25A11 to inactivate AKT signaling.
Introduction
Clear cell renal cell carcinoma (ccRCC) is the main histological subtype of renal cell carcinoma (Sato et al, 2013; Hsieh et al, 2017), accounting for 70–80% of all cases (Rini et al, 2009). Approximately 30% of ccRCC cases display tumor metastasis when diagnosed. The 5‐year survival rate of advanced‐stage ccRCC patients is 10–20% (Jonasch et al, 2014; Wettersten et al, 2017). Therefore, a more refined understanding of ccRCC progression is urgently needed. The kidney is the organ with mitochondrial content second only to the heart (Galvan et al, 2017), thus ccRCC is considered a metabolic disease with mitochondrial dysfunction (Kinnaird et al, 2016). Reactivation of mitochondrial function has been proposed to be an effective therapeutic strategy for ccRCC (Tran et al, 2016; Zong et al, 2016). More than 1,000 annotated proteins have been identified in mitochondria, and hundreds of them are microproteins with less than 100 amino acids (Stein et al, 2018; van Heesch et al, 2019; Miller et al, 2022). Mitochondrial microproteins play important roles in the assembly of respiratory chain complex and ion import machinery and are therefore implicated in mitochondrial deficiency that contributes to cancer (Ge et al, 2021; Makarewich et al, 2022; Xie et al, 2022).
Recently, novel microproteins translated from small open reading frames (smORFs) within long non‐coding RNAs (lncRNAs) have been continually identified (Wang et al, 2013; Sousa & Farkas, 2018; Martinez et al, 2020) to exert functions in cell metabolism (Lee et al, 2015; Polycarpou‐Schwarz et al, 2018) and tumor progression (Guo et al, 2020; Ge et al, 2021; Zhang et al, 2022). Our previous systematical study testified the authentic existence of a hidden human proteome containing 314 microproteins encoded by lncRNAs (Lu et al, 2019). These lncRNA‐derived microproteins are highly conserved across human chromosomes and may function in cellular activities (Lu et al, 2019). However, the biological functions of these proteins in the initiation and development of cancers are still largely unknown.
SMIM26, one of the microproteins identified in our previous study, was reported to be involved in the regulation of cell viability (Konina et al, 2021; Yeasmin et al, 2021). In this study, we validated that microprotein SMIM26 was derived from lncRNA LINC00493 and resided in mitochondria. SMIM26 is dysregulated in ccRCC and exerts anti‐metastatic activity via interactions with acylglycerol kinase AGK and glutathione transport regulator SLC25A11 to maintain respiratory efficiency and deactivate the AKT signaling. Our findings functionally characterize the newly identified mitochondrial microprotein as an important tumor suppressor that is of therapeutic potential in the clinical management of ccRCC.
Results
SMIM26 is a microprotein encoded by LINC00493 and localizes to mitochondria
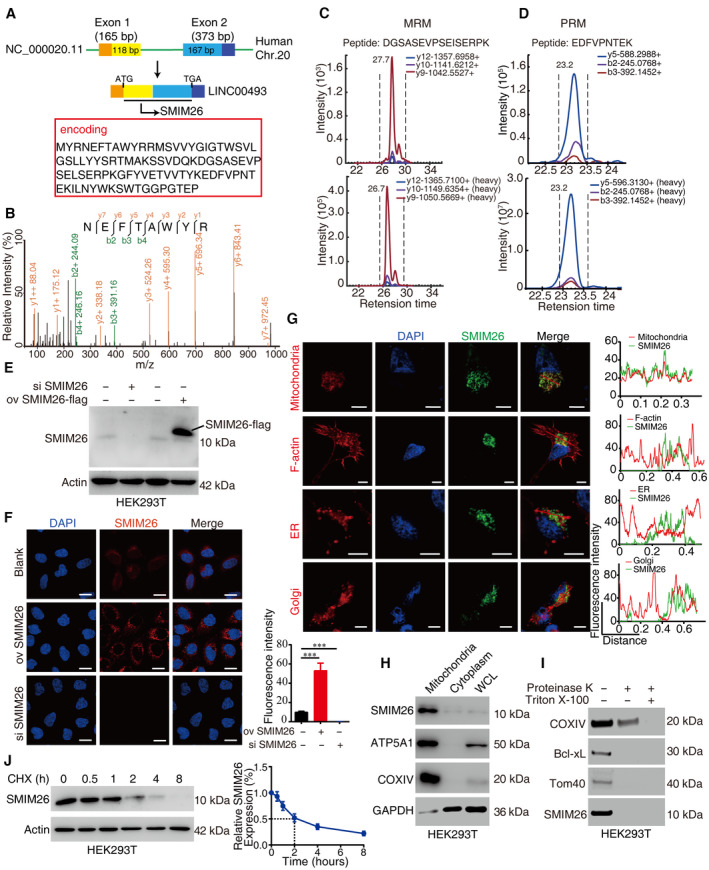
We previously reported a hidden human proteome containing 314 new microproteins encoded by lncRNAs (Wang et al, 2013; Lu et al, 2019). Further analyses verified that a smORF within LINC00493 could be translated into a microprotein SMIM26 that is constructed by 95 amino acids spanning the terminal 118 bp in exon 1 to initial 167 bp in exon 2 of LINC00493 in human Chr.20 (Fig 1A). Analyses of the protein‐coding sequence revealed that N‐terminus (1–35 aa) and C‐terminus (52–95 aa) of SMIM26 are evolutionarily conserved (Appendix Fig S1A). The prediction of SMIM26 transmembrane helical segments using TMHMM software (Krogh et al, 2001) showed two alpha helixes (1–12 aa and 36–95 aa) and a transmembrane domain (13–35 aa) (Appendix Fig S1B). To provide solid evidence of SMIM26 protein, we performed shotgun‐mass spectrometry, using enriched cell lysates (molecular weight lower than 25 kDa) to detect the amino acid sequences of SMIM26. Three unique peptides of SMIM26 were identified (Fig 1B and Appendix Fig S2A and B). Multiple reactions monitoring mass spectrometry (MRM) and parallel reaction monitoring mass spectrometry (PRM) were further employed to confirm those unique peptides. The results showed that the unique peptides matching the synthesized standard peptides were detectable in human cells (Fig 1C and D). To explore whether SMIM26 formed dimers, we purified SMIM26‐His protein recombinant proteins in vitro (Appendix Fig S3A). Native‐PAGE electrophoresis assay showed that SMIM26 could not form multimers in vitro (Appendix Fig S3B).
Figure 1. SMIM26 is a microprotein encoded by LINC00493 and localizes to mitochondria.
-
ASchematic representation of SMIM26 translated from LINC00493 located in Chr.20. The SMIM26 comprises the end of exon 1 and the head of exon 2.
-
BThe SMIM26 unique peptide was identified by shotgun mass spectrometry in HEK293T cells.
-
CMRM mass spectrometry verification of the unique peptide (heavy) of SMIM26 in HEK293T cells.
-
DPRM mass spectrometry verification of the unique peptide (heavy) of SMIM26 in HEK293T cells.
-
EImmunoblotting verification of the SMIM26 in HEK293T with overexpression or knockdown of SMIM26 by using SMIM26‐specific antibody.
-
FImmunofluorescence staining of SMIM26 with anti‐SMIM26 antibody in the cell with overexpression or knockdown of SMIM26. Nuclei were stained with DAPI (blue), and SMIM26 staining intensity (red) was quantified. Data are representative of three biological replicates. Unpaired two‐tailed Student's t‐test, ***P < 0.001; Bar, SEM; Scale bar, 20 μm.
-
GImmunofluorescence detected subcellular localization of SMIM26 (green) with mitochondria, F‐actin, ER, and Golgi. Nuclei were stained with DAPI (blue), and the co‐localization between red (mitochondria, F‐actin, ER, and Golgi) and green (SMIM26) was measured. Scale bar, 10 μm. The co‐localization of SMIM26 with mitochondria, F‐actin, ER, and Golgi in cells was measured by fluorescence intensity analysis with ImageJ software. The red line of statistical analysis centers on the co‐location of SMIM26 and indicates cell organelle.
-
H, IMitochondria were purified and SMIM26 was enriched in mitochondria fractions (H), SMIM26 is a mitochondrial outer membrane protein as detected by proteinase K and Triton X‐100 assay in HEK293T cells (I).
-
JThe degradation half‐life of SMIM26 was detected in HEK293T. Three biological replicates. Data are shown as mean ± SEM.
Source data are available online for this figure.
We next generated an anti‐SMIM26 polyclonal rabbit antibody, using the full‐length SMIM26 protein derived from a prokaryotic protein expression and purification system (Appendix Fig S4A and B). SMIM26 was detectable with a molecular weight around 10 kDa by western blotting in HEK293T and cancer cells (Fig 1E and Appendix Fig S4C). Results of immunofluorescence demonstrated that SMIM26 displayed vigorous staining intensity in SMIM26‐overexpressing cells (Fig 1F). Cytoplasmic localization of SMIM26 was recognized by the anti‐SMIM26 antibody (Fig 1F). Confocal data showed that SMIM26 was co‐localized with mitochondria tracker, rather than trackers of F‐actin, ER, and Golgi (Fig 1G). Using antibodies specific to mitochondria (ATP5A1 and COXIV) and cytoplasm (GAPDH), we further verified that SMIM26 was enriched in the mitochondrial fraction (Fig 1H). To further specialize the mitochondrial localization of SMIM26, the mitochondria were purified and exposed to proteinase K proteolysis in the presence or absence of the detergent Triton X‐100. Results indicated that SMIM26 was sensitive to proteinase K treatment and solubilized by the Triton X‐100 (Fig 1I), suggesting that SMIM26 is a mitochondrial outer membrane protein. In addition, upon the treatment of cycloheximide, the half‐life of SMIM26 protein was about 2 h in HEK293T cells (Fig 1J). Collectively, our data suggest that SMIM26 is a microprotein encoded by LINC00493 and predominantly located in the mitochondrial outer membrane.
SMIM26 is specifically downregulated in ccRCC and its low expression correlates with poor prognosis
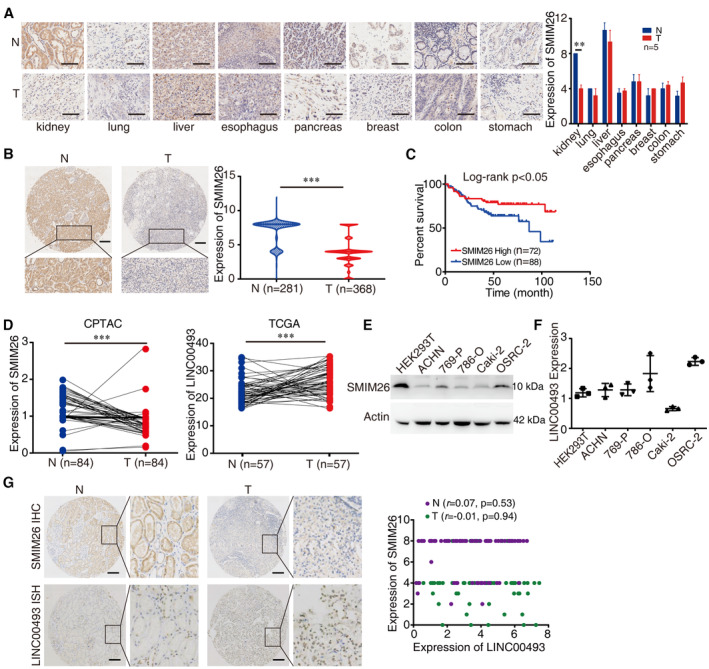
To determine the clinical significance of SMIM26 in human cancers, we compared the expression of SMIM26 in pan‐cancer tissue microarray containing kidney, lung, liver, esophagus, pancreas, breast, colon, and stomach cancers. The results showed that the expression of SMIM26 was significantly decreased only in kidney cancer tissues, compared to the corresponding non‐tumorous tissues (Fig 2A). We then examined the expression of SMIM26 in an extensive tissue microarray containing 368 ccRCC and 281 non‐tumorous renal samples (Appendix Table S1). We found that SMIM26 expression was remarkably lower in the primary ccRCC tissues than that in non‐tumoral ones (Fig 2B). Kaplan–Meier survival analysis revealed that patients with less SMIM26 expression were at increased risk of ccRCC‐related death (Fig 2C; P < 0.05, log‐rank test).
Figure 2. SMIM26 is specifically downregulated in ccRCC and its low expression is correlated with poor prognosis.
-
ARepresentative immunohistochemistry (IHC) images of SMIM26 protein level in multiple types of tumoral tissues (T) and adjacent non‐tumorous tissues (N), showing that SMIM26 has significantly decreased expression in kidney cancer only. Mann–Whitney test, **P < 0.01; n = 5; Bar, SEM; Scale bar, 100 μm.
-
BRepresentative IHC images of SMIM26 protein levels in 368 ccRCC tissues (T) and 281 non‐tumorous renal tissues (N). Mann–Whitney test, ***P < 0.001; Scale bar, 200 μm.
-
CA Kaplan–Meier survival analysis of ccRCC patients with high or low expression levels of SMIM26 (P < 0.05, log‐rank test).
-
DThe expression of SMIM26 proteins level (left) and RNA level (right) in paired ccRCC and adjacent non‐tumor tissues were analyzed by CPTAC and TCGA databases, respectively. Mann–Whitney test, ***P < 0.001.
-
E, FThe protein level (E) and RNA level (F) of SMIM26 were detected in five ccRCC cell lines by western blotting and qRT–PCR. Data are shown as mean ± SEM of three biological replicates.
-
GThe protein level of SMIM26 (up) and RNA level of LINC00493 (down) in ccRCC tissues (T) and their adjacent non‐tumoral tissues (N) were detected by IHC staining and RNA in situ hybridization (ISH) staining. The right scatter plot shows no significant correlation between SMIM26 protein expression and LINC00493 RNA expression in ccRCC tissues (green dots, P = 0.94) and adjacent non‐tumorous renal tissues (purple dots, P = 0.53). n = 72. Scale bar, 200 μm.
Source data are available online for this figure.
Strikingly, the protein level of SMIM26 was downregulated in ccRCC CPTAC proteomic datasets, but the mRNA level of LINC00493 was upregulated in the TCGA database (Fig 2D). The expression of SMIM26 protein was not correlated with LINC00493 in HEK293T and ccRCC cells (Fig 2E and F). As indicated by IHC and in situ hybridization (ISH) data, no significant correlation between SMIM26 protein and LINC00493 RNA in ccRCC tissues and adjacent non‐tumorous renal tissues (Fig 2G). These data suggest that the translation of SMIM26 may be modulated at the post‐transcriptional level.
SMIM26 translation is regulated by PABPC4 in ccRCC
We next performed RNA pulldown coupled with stable isotope labeling by amino acids in cell culture (SILAC) mass spectrometric analysis (RNA pulldown‐SILAC‐MS) to identify the post‐transcriptional regulators of SMIM26. SILAC has been widely used in the identification of RNA‐binding proteins (RBPs) that are involved in protein translation (Boulon et al, 2010; Casas‐Vila et al, 2020; Kurosaki et al, 2022). Biotinylated LINC00493 RNA was employed for pulldown in the equal lysates of SILAC labeling HEK293T (heavy) and ACHN (light), followed by mass spectrometric identification (Appendix Fig S5). Gene ontology analysis showed that LINC00493‐binding proteins were most enriched in translation‐related pathways (Fig 3A). A total of 91 LINC00493‐binding proteins were identified. Compared with those in ACHN cells, the LINC00493‐binding capabilities of 25 RNA‐binding proteins (RBPs) were enhanced in HEK293T cells (Appendix Table S2). When these 25 RBPs were subjected to analysis by the protein–RNA interactions software catRAPID (Armaos et al, 2021), two reliable candidates, PABPC4 and nucleolin (NCL), were predicted as LINC00493 regulators (Fig 3B). Knockdown of PABPC4, but not NCL, noticeably decreased the protein expression of SMIM26 (Fig 3C). Therefore, PABPC4 was chosen for further investigation.
Figure 3. SMIM26 translation is regulated by PABPC4 in ccRCC.
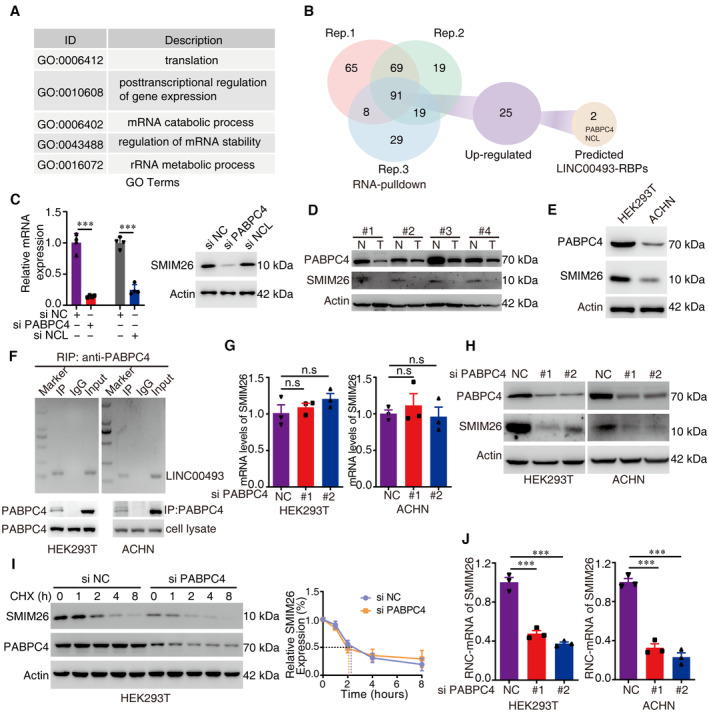
- Gene ontology analysis showed that LINC00493‐binding proteins were most enriched in translation‐related pathways.
- RNA‐binding proteins of LINC00493 were identified by RNA pulldown coupled with SILAC‐MS. A total of 91 LINC00493‐binding proteins were identified, 25 proteins of which were upregulated in HEK293T compared with ACHN cells, and 2 reliable LINC00493‐binding proteins were further presented by using protein–RNA interactions software.
- Silenced PABPC4 rather than NCL decreased SMIM26. The left histogram shows the level of PABPC4 and NCL, data are shown as mean ± SEM of four biological replicates. Unpaired two‐tailed Student's t‐test, ***P < 0.001.
- The expression of PABPC4 and SMIM26 in ccRCC tissues compared with adjacent non‐tumor tissues was detected by western blotting.
- The expression of PABPC4 and SMIM26 was downregulated in ACHN cells compared with HKE293T cells.
- RIP assay showing a strong binding of LINC00493 with PABPC4 in HEK293T and ACHN cells.
- RNA levels of SMIM26 were determined by qRT–PCR in PABPC4 knockdown cells. Data are shown as mean ± SEM of three biological replicates. Unpaired two‐tailed Student's t‐test. n.s, non‐significant. Bars, SEM.
- Western blotting validation of SMIM26 expression in cells upon knockdown of PABPC4.
- Knocking down PABPC4 could not significantly alter the degradation half‐life of SMIM26 protein. Data are shown as mean ± SEM of three biological replicates.
- RNC of SMIM26 was detected in HEK293T and ACHN cells transfected with anti‐PABPC4 siRNAs. Unpaired two‐tailed Student's t‐test, ***P < 0.001. Data are shown as mean ± SEM of three biological replicates.
Source data are available online for this figure.
The expression of SMIM26 was positively correlated with PABPC4 in the CPTAC database (Appendix Fig S6A) and in 96 ccRCC samples by IHC (Appendix Fig S6B). Results of western blotting in clinical fresh tissues and ccRCC cell lines showed that PABPC4 expression was downregulated in ccRCC tissues and correlated with SMIM26 expression (Fig 3D and E). RNA‐binding protein immunoprecipitation assay (RIP) presented a strong binding of PABPC4 to LINC00493 in HEK293T and ACHN cells (Fig 3F). Treatment of PABPC4 siRNAs in HEK293T and ACHN cells did not change the expression level of LINC00493 (Fig 3G) but markedly decreased SMIM26 protein expression (Fig 3H). To determine whether PABPC4 affected the protein degradation of SMIM26, CHX assays were performed. Results showed that knockdown of PABPC4 could not alter the half‐life of SMIM26 protein (Fig 3I), indicating that PABPC4 may modulate the translation of SMIM26. Ribosome–nascent chain complex (RNC) was next extracted to demonstrate that upon PABPC4 knockdown, SMIM26 mRNA complexed with the ribosome dramatically reduced (Fig 3J). Collectively, our findings suggest that SMIM26 is regulated by RNA‐binding protein PABPC4 in ccRCC.
SMIM26 is an anti‐metastatic factor in ccRCC
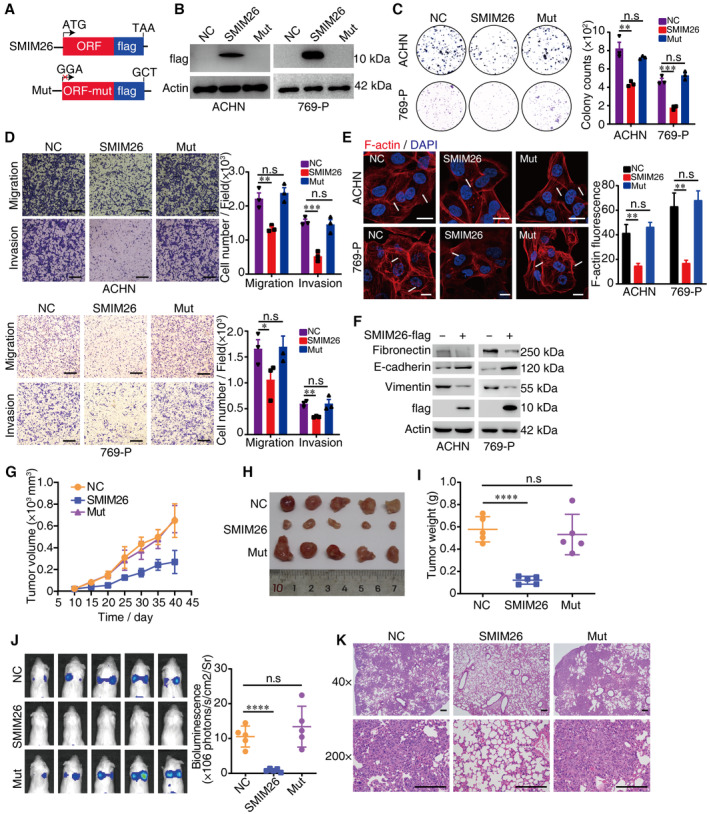
To further disclose the biological function of SMIM26 in ccRCC, we generated SMIM26‐flag and SMIM26‐mut‐flag plasmids (Fig 4A). Western blotting confirmed the stable overexpression of SMIM26 in ACHN and 769‐P cells (Fig 4B). We then observed that the transfection of SMIM26‐flag, but not SMIM26‐mut‐flag, inhibited colony formation ability (Fig 4C) and cell migration and invasion (Fig 4D). In contrast, silence of SMIM26 promoted cell colony formation ability, migration, and invasion in ACHN and 769‐P cells (Appendix Fig S7A–C). Immunofluorescence staining showed that F‐actin polymerization was decreased in SMIM26‐overexpressing cells, but not in control and SMIM26‐mut‐flag groups (Fig 4E). The expressions of mesenchymal markers, vimentin and fibronectin, were decreased, whereas the expression of epithelial marker E‐cadherin was increased in SMIM26‐overexpressing cells (Fig 4F). Conversely, silencing of SMIM26 induced vimentin and fibronectin and reduced E‐cadherin (Appendix Fig S7D), suggesting a suppressive role of SMIM26 in epithelial–mesenchymal transition (EMT).
Figure 4. SMIM26 is an anti‐metastatic factor in ccRCC.
-
ATwo vectors including SMIM26‐flag (SMIM26) and SMIM26‐mut‐flag (Mut) were constructed. For the mutation, start codon ATG was mutated to GGA and stop codon TAA was mutated to GCT to abolish the protein expression from LINC00493.
-
BImmunoblotting validation of SMIM26 expression using anti‐flag antibody in both ACHN and 769‐P cells transfected with indicated constructs.
-
CClonogenic assays were performed to test the colony formation ability of both ccRCC cells transfected with indicated constructs. Unpaired two‐tailed Student's t‐test, **P < 0.01, ***P < 0.001. n.s, non‐significant. Data are shown as mean ± SEM of three biological replicates.
-
DTranswell assays were used to test the migration and invasion abilities of both ccRCC cells transfected with indicated constructs. Unpaired two‐tailed Student's t‐test, *P < 0.05, **P < 0.01, ***P < 0.001. n.s, non‐significant. Data are shown as mean ± SEM of three biological replicates. Scale bar, 600 μm.
-
EImmunofluorescence staining of F‐actin (red) in ACHN and 769‐P cells transfected with indicated constructs. Nuclei were stained with DAPI (blue). The intensity of F‐actin fluorescence was statistically plotted. Unpaired two‐tailed Student's t‐test, **P < 0.01, n.s, non‐significant. Data are shown as mean ± SEM of three biological replicates. Scale bar, 20 μm.
-
FWestern blotting showed that mesenchymal marker of vimentin and fibronectin was decreased, and E‐cadherin was increased in SMIM26‐overexpressing cells.
-
G–IXenograft mouse model using control or SMIM26‐overexpressing ACHN cells. Analyses of tumor growth (G), tumor volume (H), and tumor weight (I) are shown. Data are shown as mean ± SD of five mice per group. Unpaired two‐tailed Student's t‐test, ****P < 0.0001. n.s, non‐significant.
-
JNOD‐SCID mice were transplanted with ACHN‐luci cells with or without overexpression of SMIM26 via tail vein injection, respectively. Bioluminescent was visualized 5 weeks later by using an IVIS 200 Imaging System. Data are shown as mean ± SD of five mice per group. Unpaired two‐tailed Student's t‐test, ****P < 0.0001. n.s, non‐significant.
-
KHematoxylin and eosin (H&E) staining of pulmonary metastases in the mouse model. Scale bar, 200 μm.
Source data are available online for this figure.
In vivo data demonstrated that SMIM26 overexpression significantly inhibited xenograft ccRCC tumor growth (Fig 4G–I). SMIM26‐overexpressing ACHN cells displayed an inferior ability to metastasize to the lung after tail vein injection, as supported by weaker bioluminescence signals in the lung (Fig 4J). Furthermore, histologic analyses revealed that the number of metastatic foci was decreased in the lung of mice injected with SMIM26‐expressing cells (Fig 4K). Taken together, these results indicate that SMIM26 protein but not LINC00493 suppresses ccRCC growth and metastasis.
SMIM26 maintains mitochondrial function via interactions with SLC25A11
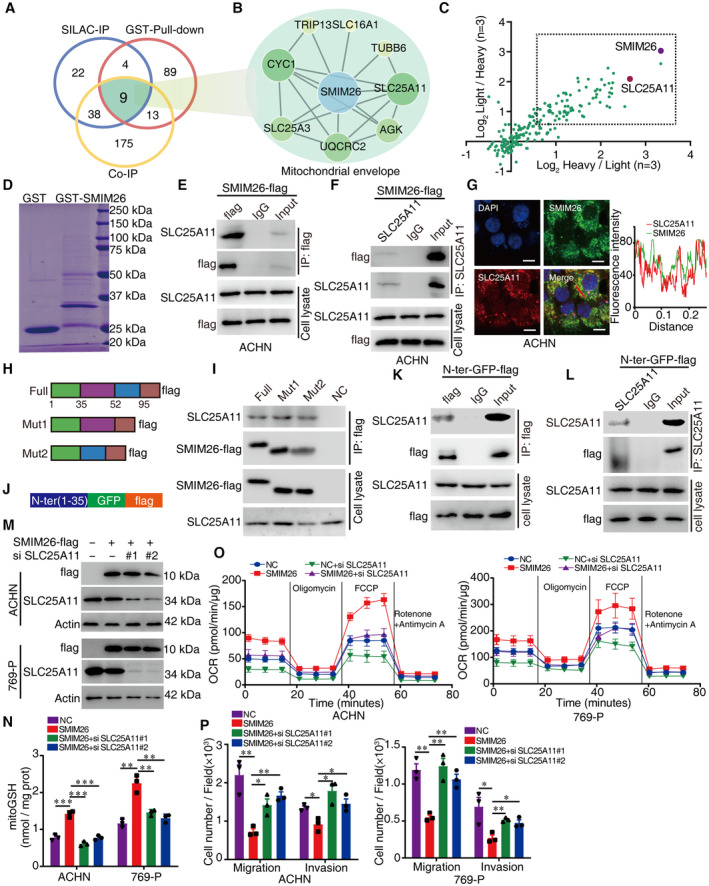
To explore the underlying mechanism of SMIM26‐mediated suppression of tumor progression, we explored the interactome of SMIM26, using the immunoprecipitation MS method (Fig EV1A and B, Appendix Table S3), SLAC‐based IP‐MS (Fig EV1C, Appendix Table S4) and GST‐pulldown MS (Fig EV1D, Appendix Table S5). A total of 235 potential binding partners of SMIM26 were identified to establish SMIM26‐associated protein–protein interaction (PPI) network (Fig EV1E). SILAC‐based IP‐MS showed that 24 of the 73 binding partners were functionally involved in mitochondria (Fig EV1F). As indicated by integrated analysis of the above MS results, nine candidates were overlapped (Fig 5A). Gene ontology analysis showed that eight proteins were functionally linked to the mitochondrial envelope (Fig 5B). Among them, AGK and SLC25A11 presented higher ratios of heavy/light in SILAC‐based IP‐MS and specific bands in Coomassie brilliant blue staining in GST‐SMIM26 pulldown (Figs 5C and D, and EV1G), and thus were chosen for further investigations.
Figure EV1. The interaction network of SMIM26.
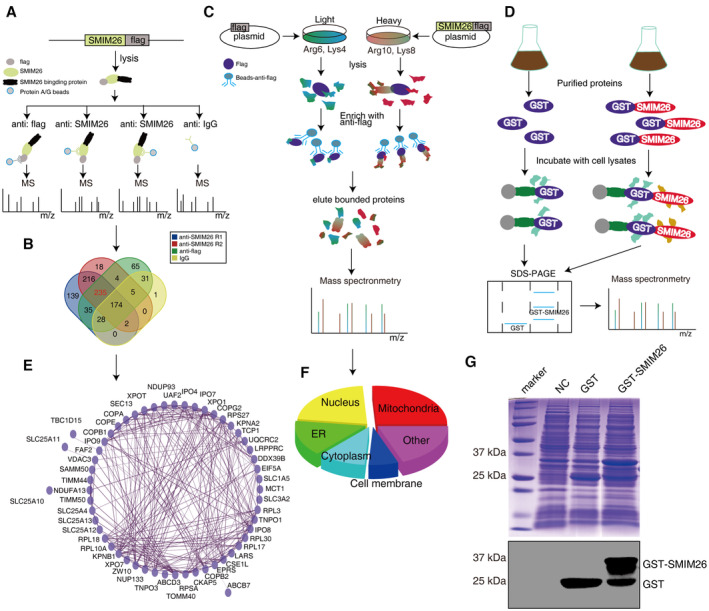
- The diagram depicting the workflow of identifying SMIM26‐interacting proteins. The SMIM26‐flag plasmid was transfected into HEK293T cells, anti‐flag and anti‐SMIM26 antibodies were used for immunoprecipitation, and anti‐IgG was used as the control; the immunoprecipitated proteins were identified by mass spectrometry.
- Venn diagram showing 235 proteins potentially interacted with SMIM26.
- SILAC‐CoIP was used to identify SMIM26‐interacting proteins. HEK293T cells cultured in heavy medium (Arg10 and Lys8) or light medium (Arg6 and Lys4) were transfected with control plasmid or SMIM26‐flag plasmid, respectively. After anti‐flag antibody was used for immunoprecipitation, lysates were mixed and subjected to mass spectrometric analysis.
- The diagram showing the workflow of GST pulldown. GST and GST‐SMIM26 expression were induced by IPTG and purified in prokaryotic cells BL21, then subjected to pulldown experiments with cell lysates, and the products were subjected to mass spectrometric analysis.
- The PPI network of SMIM26 was constructed by Cytoscape software.
- GO analysis (cellular components) of SMIM26 interacting proteins was shown in the pie chart.
- Coomassie blue staining showing the expression of GST‐SMIM26 protein in BL21 cells was successfully induced by IPTG.
Figure 5. SMIM26 maintains mitochondrial function via interactions with SLC25A11.
-
AThe Venn diagram showing the overlap of SMIM26‐binding proteins identified by three strategies including SILAC‐IP, Co‐IP, and GST pulldown; 9 candidate proteins were co‐identified.
-
BEight binding partners of SMIM26 associated with PPI network were established.
-
CThe candidate binding proteins of SMIM26 were plotted according to H/L and L/H ratios by SILAC‐CoIP MS.
-
DGST pulldown of the binding proteins of SMIM26.
-
E, FCo‐IP assays were performed to detect the interaction between SMIM26 and SLC25A11. Lysates from ACHN cells expressing SMIM26‐flag were co‐immunoprecipitated by anti‐flag antibody (E) and anti‐SLC25A11 antibody (F), respectively, SMIM26 and SLC25A11 were detected by western blotting.
-
GCo‐localization of SMIM26 (green) with SLC25A11 (red) in ACHN was determined by immunofluorescence. Nuclei were stained with DAPI (blue). Scale bar, 10 μm. The red line of statistical analysis centers on the co‐location of SMIM26 and SLC25A11.
-
HDiagram of SMIM26 wild‐type and domain deletion mutation constructs.
-
IThe indicated flag‐tagged wild‐type and mutants of SMIM26 were transfected into HEK293T cells, SMIM26‐flag complexes were Co‐IP by anti‐flag antibody, and SLC25A11 and SMIM26‐flag were then detected.
-
JDiagram of GFP‐flag fusion constructs with the N‐ter domain of SMIM26 (1–35 aa).
-
K, LN‐ter domain of SMIM26 fused with GFP‐flag interacted with SLC25A11. The N‐ter SMIM26‐GFP‐flag construct was transfected into HEK293T cells, co‐immunoprecipitation was performed by using anti‐flag antibody (K) and anti‐SLC25A11 antibody (L).
-
MACHN and 769‐P cells were transfected with SMIM26‐flag and si‐SLC25A11 as indicated, SMIM26 and SLC25A11 were detected by western blotting.
-
NThe mitoGSH level of ACHN and 769‐P cells with indicated treatment was detected. Unpaired two‐tailed Student's t‐test, **P < 0.01, ***P < 0.001. Data are shown as mean ± SEM of three biological replicates.
-
OOxygen consumption rate profile was monitored in cells with indicated treatment by using a Seahorse XF24 analyzer. The metabolic inhibitors were injected at different time points, as indicated. Data are shown as mean ± SD of three biological replicates.
-
PTranswell assays were used to test the migration and invasion abilities of both ccRCC cells with indicated treatment. Unpaired two‐tailed Student's t‐test, *P < 0.05, **P < 0.01. Data are shown as mean ± SEM of three biological replicates.
Source data are available online for this figure.
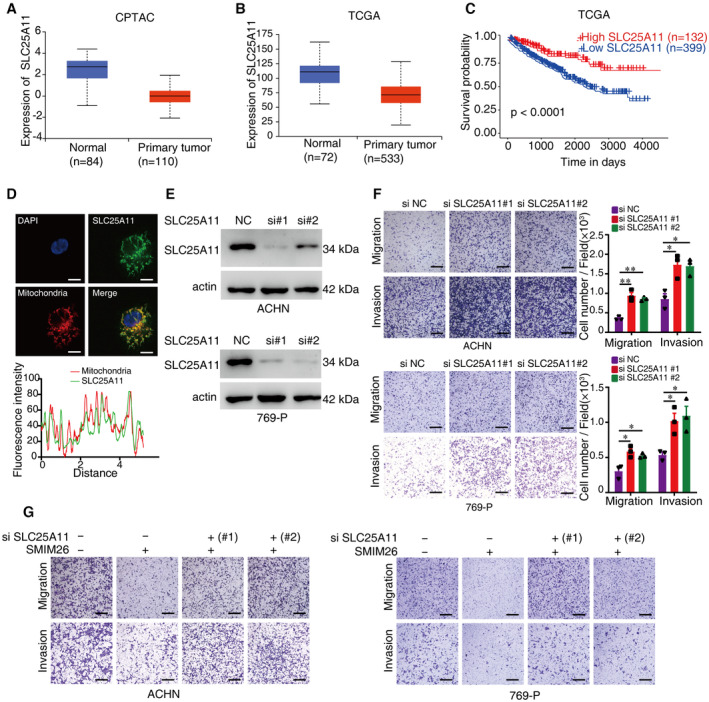
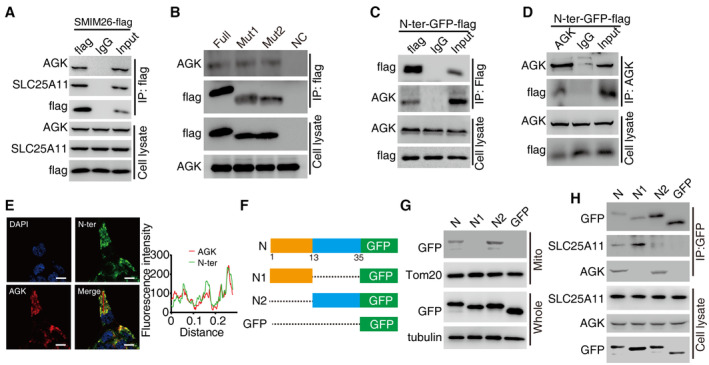
SLC25A11 is an SLC25 family member that mainly regulates mitochondrial glutathione (GSH) transportation (Jang et al, 2021). In TCGA and CPTAC cohorts, the mRNA and protein expressions of SLC25A11 were significantly decreased in ccRCC tissues, compared with the non‐tumorous tissues (Fig EV2A and B). Low SLC25A11 mRNA expression in ccRCC was correlated with an unfavorable overall survival (Fig EV2C). The interaction of SMIM26 with SLC25A11 was confirmed by co‐immunoprecipitation (CoIP) in ACHN cells (Fig 5E and F). Confocal assays demonstrated the co‐localization of SLC25A11 and SMIM26 or mitochondria in ccRCC cells (Figs 5G and EV2D). According to the features of SMIM26 protein sequence (Appendix Fig S1A and B), we generated two overexpression vectors encoding flag‐fusing SMIM26‐truncated mutants, including C‐terminal deletion (Mut1) and middle domain (36–51 aa) deletion (Mut2) (Fig 5H). Results of CoIP indicated that the mutant containing the N‐terminal (N‐ter) of SMIM26 retained the ability to interact with SLC25A11 (Fig 5I). Next, the N‐ter fragment of SMIM26 was fused to GFP and flag (Fig 5J). According to the Co‐IP assay using specific antibody of flag or SLC25A11, SMIM26‐N‐ter‐GFP‐flag strongly bound to SLC25A11 (Fig 5K and L). These findings suggest that SMIM26 interacts with SLC25A11 via its N‐terminal.
Figure EV2. SLC25A11 is a tumor suppressor in ccRCC.
-
A, BThe comparisons of SLC25A11 expression in ccRCC tissue and normal tissue from CPTAC (A) and TCGA databases (B). The central lines reflect the median, and the bottom and top of the box represent the first and third quartiles, respectively. The whiskers reflect the min‐to‐max distribution of expression.
-
CThe TCGA database depicts that the low expression of SLC25A11 is associated with a poor prognosis of ccRCC patients.
-
DImmunofluorescence of SLC25A11 (green) and mitochondria (red) in ACHN cells. Nuclei were stained with DAPI (blue). Scale bar, 10 μm.
-
EImmunoblotting validation of the knockdown effect of SLC25A11 in ACHN and 769‐P cells.
-
FMigration and invasion abilities of ACHN and 769‐P cells with or without knockdown of SLC25A11 were detected by transwell assays. Unpaired two‐tailed Student's t‐test, *P < 0.05, **P < 0.01. Scale bar, 600 μm. Data are shown as mean ± SEM of three biological replicates.
-
GTranswell assays were used to test the migration and invasion abilities of both ccRCC cells with indicated treatment. Scale bar, 600 μm.
The involvement of SLC25A11 in the uptake of mitochondrial GSH (mitoGSH) has been documented (Baulies et al, 2018; Sreekumar et al, 2020). SMIM26 overexpression in ccRCC cells was capable of enhancing the transport of mitoGSH into mitochondria, which was markedly inhibited by SCL25A11 siRNAs (Fig 5M and N). In addition, SMIM26‐overexpressing cells had increased basal and maximal mitochondrial respiration rates, which were significantly reduced by the silence of SCL25A11 (Fig 5O), suggesting a role of the interaction of SMIM26‐SCL25A11 in regulation of OXPHOS. Functionally, the knockdown of SLC25A11 in ACHN and 769‐P cells led to increases in cell migration and invasion (Fig EV2E and F). Furthermore, we found that SLC25A11 siRNAs dramatically abrogated the SMIM26‐mediated suppression of cell migration and invasion (Figs 5P and EV2G).
Next, we explored whether SMIM26 exerted the function of inhibiting ccRCC by binding to SLC25A11. According to the annotated SLC25A11 in UniPort (https://www.uniprot.org/), we constructed plasmids encoding truncated SLC25A11 fused with Myc‐tags (Fig EV3A). We verified the interaction between SMIM26 with truncated SLC25A11 in HEK293 cells, and the results showed that the R1 domain of SLC25A11 was essential for the binding of SLC25A11 to SMIM26 (Fig EV3B). Re‐expression of full‐length SLC25A11 but not ΔR1 SLC25A11 mutant in ccRCC cells with SLC25A11 depletion restored SMIM26‐mediated inhibition of cell migration and invasion (Fig EV3C and D). Taken together, these data implicate that SMIM26 plays a role in cell migration by interacting with SCl25A11.
Figure EV3. SMIM26 inhibits ccRCC by binding to SLC25A11.
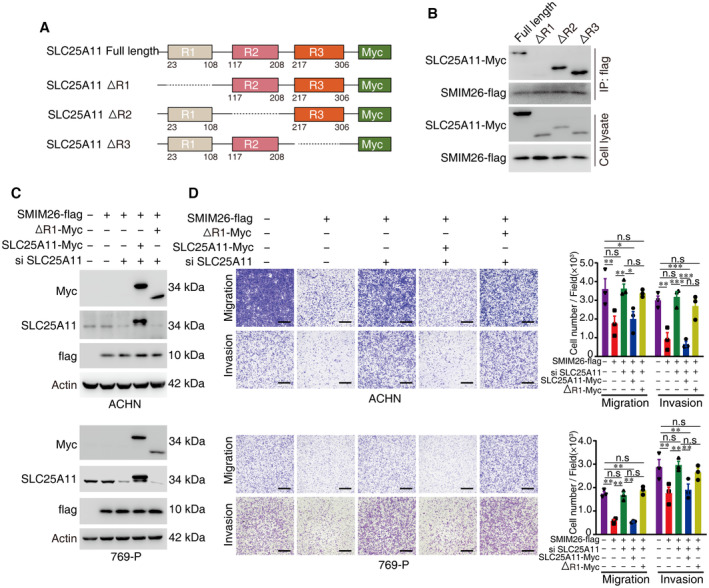
- Diagram of SLC25A11 wild‐type and domain deletion mutation constructs.
- The indicated Myc‐tagged wild‐type and mutants of SLC25A11 were transfected with SMIM26‐flag into HEK293T cells, and SMIM26‐flag complexes were Co‐IP by anti‐flag antibody, truncated SLC25A11 and SMIM26‐flag were then detected.
- Overexpression of wild‐type and R1‐domain deleted truncated SLC25A11 with SMIM26‐flag in endogenously SLC25A11 knockdown ccRCC cells.
- Overexpression of wild‐type SLC25A11 but not R1‐domain deleted SLC25A11 in endogenous SLC25A11 knockdown ccRCC cells can restore the SMIM26‐mediated inhibition of migration and invasion. Two‐way ANOVA, *P < 0.05, **P < 0.01, ***P < 0.001. n.s, non‐significant. Scale bar, 600 μm. Data are shown as mean ± SEM of three biological replicates.
SMIM26 interacts with AGK to deactivate AKT signaling
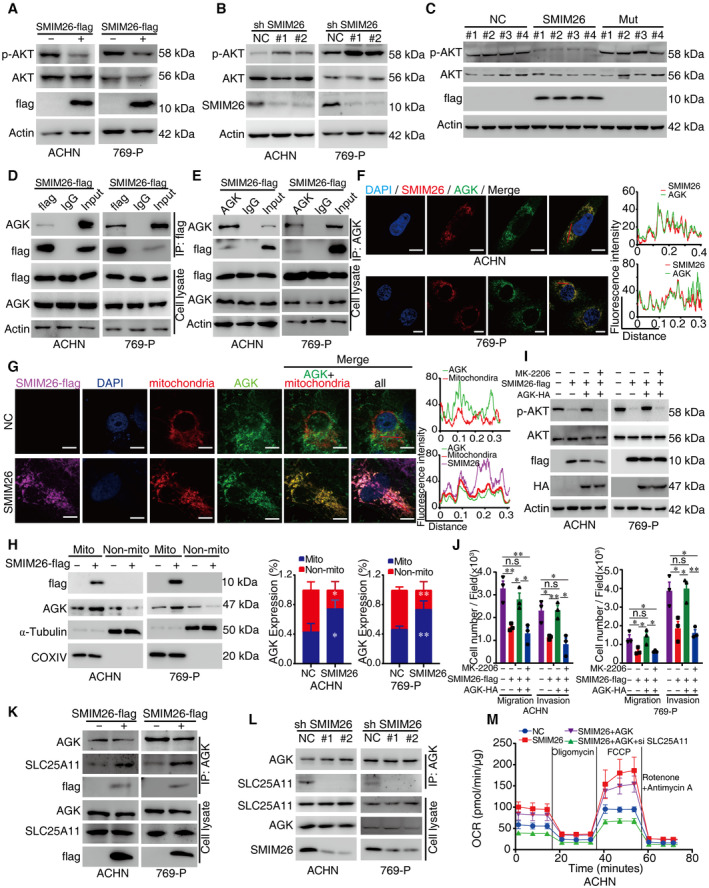
We then performed RNA‐seq in SMIM26‐overexpressing ACHN cells to disclose the downstream pathway through which SMIM26 inhibits cell migration. A total of 539 differentially expressed genes (DEGs, fold change ≥ 2 and P < 0.05) were identified, consisting of 167 upregulated genes and 372 downregulated genes (Appendix Fig S8A). KEGG analysis showed that PI3K/AKT pathway was remarkably enriched as the top pathway (Appendix Fig S8B). The phosphorylation of AKT at Ser473 was reduced in ACHN and 769‐P cells with SMIM26 overexpression (Fig 6A). In contrast, knockdown of SMIM26 increased the expression of p‐AKT at Ser473 (Fig 6B). Overexpression of SMIM26 suppressed the phosphorylation of AKT at Ser473 in xenograft tumor samples (Fig 6C). Collectively, these results suggest that SMIM26 suppresses ccRCC metastasis by interfering with AKT signaling.
Figure 6. SMIM26 interacts with AGK to deactivate AKT signaling.
-
A, BImmunoblotting validation of the p‐AKT at Ser473 expression in ACHN and 769‐P cells with overexpression (A) or knockdown (B) of SMIM26 compared with their corresponding control.
-
CWestern blotting validation of the p‐AKT at Ser473 expression in xenograft tumor samples.
-
DCo‐IP assays were performed to detect the interaction between SMIM26 and AGK in ACHN and 769‐P cells expressing SMIM26‐flag. Lysates were co‐immunoprecipitated by anti‐flag antibody.
-
ECo‐IP assays were performed to detect the interaction between SMIM26 and AGK in ACHN and 769‐P cells expressing SMIM26‐flag. Lysates were co‐immunoprecipitated by anti‐AGK antibody.
-
FSubcellular localization of SMIM26 and AGK was determined by immunofluorescence in ACHN and 769‐P cells. Red, flag‐SMIM26; Green, AGK; Blue, nuclei stained with DAPI. Scale bar, 20 μm. The red line of statistical analysis centers on the co‐location of SMIM26 (red) and AGK (green).
-
GImmunofluorescence of SMIM26 (purple), AGK (green), and mitochondrial (red) in ACHN cells with or without overexpression of SMIM26. Scale bar, 10 μm. Fluorescence intensity analysis of co‐localization of AGK and mitochondria in cells treated with control or SMIM26. ImageJ software was used to analyze the fluorescence co‐localization. The red line of statistical analysis centers on the co‐location of AGK and mitochondria.
-
HImmunoblotting validation of AGK enriched in purified mitochondria from ACHN and 769‐P cells with or without the overexpression of SMIM26. Data are representative of three biological replicates. Two‐way ANOVA, *P < 0.05, **P < 0.01. Bars, SEM;
-
I, JAKT inhibitor of MK‐2206 dramatically abrogated the AGK‐mediated promotion of the phosphorylation of AKT (I) and cell migration and invasion (J). Unpaired two‐tailed Student's t‐test, *P < 0.05, **P < 0.01. n.s, non‐significant. Data are shown as mean ± SEM of three biological replicates.
-
K, LThe interaction of AGK and SLC25A11 was determined by immunoblotting in ACHN and 769‐P cells with control or SMIM26 overexpressing (K), and control or SMIM26 knockdown (L).
-
MOxygen consumption rate profile was monitored in ACHN cells with indicated treatment by using a Seahorse XF24 analyzer. The metabolic inhibitors were injected at different time points, as indicated. Data are shown as mean ± SD of three biological replicates.
Source data are available online for this figure.
AGK, a mitochondrial acylglycerol kinase, was reported to promote RCC metastasis by activating PI3K/AKT/GSK3β pathway (Zhu et al, 2020). The cytosolic localization of AGK is required. CoIP assays were used to verify the interaction between exogenous SMIM26 and endogenous AGK in ACHN and 769‐P cells (Fig 6D and E) and xenograft tumor samples (Fig EV4A). Confocal assays demonstrated a strong co‐localization between SMIM26 and AGK in the cytoplasm of ACHN and 769‐P cells (Fig 6F). Two overexpression vectors encoding flag‐fusing SMIM26‐truncated mutants were transfected in HEK293T cells (Fig 5H). SMIM26 mutant containing N‐terminal (N‐ter) retained the ability to interact with AGK (Fig EV4B), and transfection of SMIM26‐flag did not change the expression level of AGK. Co‐IP assay using specific antibody of flag or AGK showed that N‐ter of SMIM26 bound to AGK (Figs 5J and EV4C and D). Moreover, co‐localization of SMIM26‐N‐ter‐GFP‐flag and AGK was revealed by confocal experiments (Fig EV4E). We further constructed truncated N‐ter of SMIM26 with GFP‐tags (Fig EV4F), according to the structure of SMIM26 (Appendix Fig S1B). The results of CoIP assays indicated that N‐ter of SMIM26 lacking transmembrane domain (N1) lost mitochondrial localization (Fig EV4G) and the interaction with AGK (Fig EV4H), but retained the binding ability to SLC25A11 (Fig EV4H).
Figure EV4. SMIM26 interacts with AGK.
-
ACoIP assays were used to verify the interaction between exogenous SMIM26 and endogenous AGK in xenograft tumor samples.
-
BThe indicated flag‐tagged wild‐type and mutants of SMIM26 were transfected into HEK293T cells, and SMIM26‐flag complexes were Co‐IP by anti‐flag antibody, and AGK and SMIM26‐flag were then detected.
-
C, DN‐ter domain of SMIM26 fused with GFP‐flag interacted with AGK. The N‐ter SMIM26‐GFP‐flag construct was transfected into HEK293T cells, and co‐immunoprecipitation was performed by using anti‐flag antibody (C) and anti‐AGK antibody (D).
-
EImmunofluorescence of N‐ter SMIM26 (green) co‐localized with AGK (red) in ACHN cells. Nuclei were stained with DAPI (blue). Scale bar, 10 μm. The red line of statistical analysis centers on the co‐location of AGK (red) and N‐ter of SMIM26 (green).
-
FDiagram of truncated N‐ter SMIM26.
-
GCoIP assays indicated that N‐ter of SMIM26 missing transmembrane domain (N1) lost the function of interaction with AGK, but retained the ability to bind SLC25A11.
-
HSubcellular fractionation assay indicated that N‐ter of SMIM26 missing transmembrane domain (N1) lost the function of translocation to mitochondria.
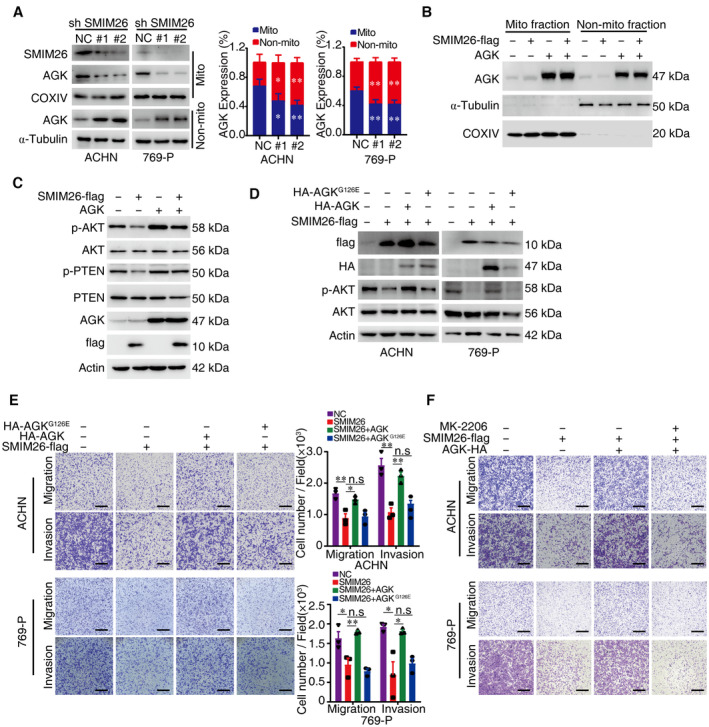
The co‐localization of SMIM26 and AGK in mitochondria was enhanced by SMIM26 overexpression in ccRCC cells (Fig 6G). Cellular fractionation experiments showed that overexpression of SMIM26 noticeably increased the expression level of mitochondrial AGK in ACHN and 769‐P cells (Fig 6H). In contrast, the silence of SMIM26 decreased the level of mitochondrial AGK (Fig EV5A). Literature reported that AGK phosphorylated PTEN to restrict its function of activating AKT (Hu et al, 2019; Ning et al, 2022). Overexpression of AGK increased the mitochondrial and non‐mitochondrial AGK levels (Fig EV5B). Strikingly, overexpression of AGK dramatically abrogated the SMIM26‐mediated suppression of the phosphorylation of PTEN at Thr382/383 and AKT at Ser473 (Fig EV5C). In addition, overexpression of AGK in SMIM26‐overexpressing cells restored cell migration and invasion (Fig EV5D and E). This was mimicked by AGKG126E, an AGK mutant that lacks kinase activity (Fig EV5D and E). To further illustrate that AGK promotes metastasis through the AKT pathway, we performed the rescue assay of AKT inhibitor (MK‐2206). The results show that MK‐2206 dramatically abrogated the AGK‐mediated phosphorylation of AKT and cell migration and invasion (Figs 6I and J, and EV5F). These findings indicate that SMIM26 retains AGK in mitochondria to inhibit its capability of catalyzing AKT phosphorylation, and consequently restricts ccRCC metastasis.
Figure EV5. SMIM26 suppressed ccRCC through the AGK/AKT pathway.
-
ACellular fractionation experiments showed that silencing SMIM26 noticeably decreased the expression level of mitochondrial AGK in ACHN and 769‐P cells. Data are representative of three biological replicates. Two‐way ANOVA, *P < 0.05, **P < 0.01. Bars, SEM.
-
BOverexpression of AGK increased the mitochondrial and non‐mitochondrial AGK levels in ACHN cells.
-
COverexpression of AGK abrogated the SMIM26‐mediated suppression of the phosphorylation of PTEN at Thr382/383 and AKT at Ser473 in ACHN cells.
-
D, EAGK, but not AGKG126E, rescues the anti‐cancer effect of SMIM26. ACHN and 769‐P cells were transfected with SMIM26 and/or AGK or AGKG126E as indicated. The p‐AKT expression was determined by western blotting assay (D), and their migration and invasion abilities were detected by transwell assays (E). Two‐way ANOVA, *P < 0.05, **P < 0.01. n.s, non‐significant. Scale bar, 600 μm. Data are shown as mean ± SEM of three biological replicates.
-
FTranswell assays were used to test migration and invasion abilities of both ccRCC cells with indicated treatment. Scale bar, 600 μm.
Since SMIM26 interacted with both AGK and SLC25A11, we determined whether SMIM26 forms a protein complex with AGK and SLC25A11. CoIP assays showed that SLC25A11 and SMIM26 were detected in the precipitant mediated by AGK‐specific antibodies. Once SMIM26 was overexpressed in ccRCC cells, the binding of AGK and SCL25A11 was enhanced (Fig 6K). Silencing of SMIM26 suppressed the binding of AGK and SLC25A11 (Fig 6L), indicating that SMIM26 functions as a tumor suppressor in ccRCC by bridging the activities of AGK and SCL25A11.
To determine the effect of SMIM26‐SLC25A11‐AGK complex on mitochondrial respiration, the mitochondrial oxygen consumption rate (OCR) was measured. Overexpression of SMIM26 enhanced OCR before treatment with oligomycin and the ATP synthase inhibitor (Fig 6M). As a result, proton leak (Appendix Fig S9A), spare respiratory capacity (Appendix Fig S9B), basal respiration (Appendix Fig S9C), and maximal respiration (Appendix Fig S9D) were increased in SMIM26‐overexpressing ccRCC cells. Improvement of respiratory efficiency caused by SMIM26 was destroyed by the combination of AGK overexpression and SLC25A11 knockdown (Fig 6M and Appendix Fig S9). Collectively, SMIM26 maintains mitochondria activation by forming a complex with AGK and SLC25A11.
Discussion
Accumulating shreds of evidence revealed that non‐canonical ncRNAs can encode microproteins (Huang et al, 2017; Lu et al, 2019; Pang et al, 2020; Spencer et al, 2020; Sun et al, 2021; Li et al, 2021b). These “dark proteins” with completely unknown functions constitute a biological treasure resource that may contain key functional molecules associated with human pathology and physiology. Recently, scientists from six countries jointly proposed an initiative to focus on “understudied proteins” (Kustatscher et al, 2022a,b), which apparently includes characterizing these emerging proteins. The current study represents one of our continuous efforts in the identification and characterization of new microproteins encoded by lncRNAs. We demonstrated that LINC00493‐derived microprotein SMIM26 can be detected in human cells and tissues, and exerts an important function as a novel tumor suppressor specifically in kidney cancer (Fig 7). Loss of SMIM26 was associated with poor prognosis in ccRCC patients. SMIM26 resides in outer membrane of mitochondria and forms a complex with AGK‐SLC25A11 to maintain the mitoGSH import and enhance mitochondrial metabolism in ccRCC. As a tumor suppressor, SMIM26 binds AGK to promote the mitochondrial localization of AGK and thus inactivates the AKT signaling, consequently repressing cancer metastasis. This work characterizes that mitochondrial SMIM26 plays an important role in the mitochondrial protein machinery and restoration of SMIM26 serves as an option for ccRCC treatment.
Figure 7. Hypothetical model.
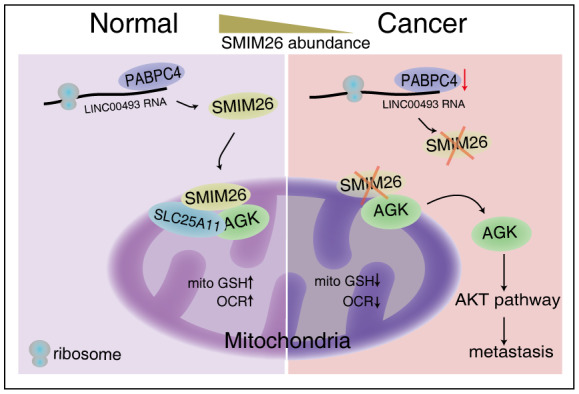
Mitochondrial microprotein SMIM26 encoded by LINC00493 as a tumor suppressor protein specifically in ccRCC. SMIM26 forms a triple complex with AGK‐SLC25A11 to maintain mitochondrial mitoGSH import and inhibit the AGK/AKT signaling‐mediated cancer metastasis.
A recent study observed that knockdown of LINC00493 slightly inhibited cell growth in A375 and MDA‐MB‐231 cell lines (Konina et al, 2021), indicating that LINC00493 is functional and activated in mammalian cells. Our earlier works dedicated to the global discovery of new smORFs by using full‐length translating mRNA sequencing and ribosome profiling (Wang et al, 2013), and reported a total of 314 lncRNA‐encoded new microproteins (Lu et al, 2019). As one of these microproteins, we first provided evidence of translation and MS to support the existence of SMIM26 as smORF in LINC00493 (Lu et al, 2019), which was further confirmed by another group (Yeasmin et al, 2021). However, the detailed molecular function of SMIM26 remains unclear. Here, the biological function of SMIM26 was systematically characterized. We interestingly found that the protein level of SMIM26 was specifically reduced in kidney cancer, but not in other cancer types including lung, liver, esophagus, pancreas, breast, colon, and stomach cancers. Moreover, the RNA level of SMIM26 (LINC00493) was not significantly changed in various cell lines and clinical samples, suggesting that SMIM26 level is post‐transcriptionally regulated. We then identified PABPC4, a member of Poly (A)‐binding proteins family (PABPs) that sustains the stability and translation of mRNAs by binding on the tails of mRNA (Li et al, 2021a), which interacts with LINC00493 to accelerate the expression of SMIM26.
Mitochondria are highly dynamic organelles in mammalian cells that play critical roles in energy production (Sun et al, 2022). As a hallmark of cancer, abnormality in mitochondrial energy metabolism predominately contributes to the pathogenesis of ccRCC. Reactivating mitochondrial function can reduce ccRCC tumor size and angiogenesis (Kinnaird et al, 2016). Effective and timely replenishment of GSH in mitochondria is essential for mitochondria function to offset the high level of OXPHOS. GSH is synthesized in the cytoplasm and transported into mitochondria by mitoGSH transporter, such as SLC25A11 (Baulies et al, 2018). SLC25A11 is a key player in malate–aspartate shuttle that regulates ATP generation, its loss‐of‐function mutation was reported to negatively correlate with metastatic paraganglioma (Buffet et al, 2018). We here found that SMIM26 is deeply involved in molecular transportation and tumor suppressive activity by SLC25A11. SLC25A11 is a binding protein of SMIM26, and the interaction of SLC25A11 with SMIM26 in mitochondria increased the mitoGSH, ATP, and OCR levels in ccRCC cells, and its knockdown rescued cancer migration and invasion suppressed by SMIM26.
AGK is a multisubstrate kinase that phosphorylates acylglycerol to phosphatidic acid and lysophosphatidic acid, which is key for lipid signaling and tumorigenesis (Ding et al, 2022). AGK can activate JAK2/STAT3 and AKT signaling pathways (Chen et al, 2013; Zhu et al, 2020). As an upstream negative regulator of AKT, PTEN is phosphorylated and subsequently inactivated by AGK at the plasma membrane (Zhou & Chi, 2019), suggesting that subcellular localization of AGK determines its kinase activity. On the other hand, the kinase‐independent activity of AGK was achieved by its translocation to mitochondria, as a subunit of TIM22 complex to mediate the insertion of metabolite carrier proteins into the mitochondrial membrane (Vukotic et al, 2017). However, how AGK switches its kinase function via its subcellular localization remains unclear. The kinase activity of AGK was involved in the activation of PI3K/AKT pathway (Hu et al, 2019; Zhu et al, 2020), and AGK seems to exhibit kinase‐independent function when located in mitochondria. We here found that SMIM26 can inhibit AGK‐mediated activation of AKT pathway, thereby suppressing cancer metastasis of ccRCC. Mechanically, SMIM26 mediates the formation of SMIM26‐SLC25A11‐AGK complex on mitochondrial membrane, functioning to promote mitochondrial OXPHOS by increasing the levels of mitoGSH, ATP, and OCR in mitochondria.
In summary, we revealed a novel mitochondrial microprotein SMIM26 encoded by LINC00493, as a tumor suppressor protein specifically in ccRCC. Frequent loss of SMIM26 in ccRCC clinical tissues is post‐transcriptionally regulated by PABPC4. SMIM26 bearing a highly conserved single‐pass transmembrane peptide (1–35 aa) is located in the mitochondria. SMIM26 forms a triple complex with AGK‐SLC25A11 to maintain mitochondrial mitoGSH import and inhibit the AGK/AKT signaling‐mediated cancer metastasis. This work represents a complete functional characterization of the dark microprotein SMIM26 translated from a non‐canonical lncRNA, illustrating that restoration of SMIM26 serves as an option for ccRCC treatment.
Materials and Methods
Cell culture and treatments
ACHN, 769‐P, and HEK293T were grown in DMEM medium (Gibco) containing 10% fetal bovine serum (Gibco) and 1% penicillin and streptomycin (Gibco) at 37°C under 5% CO2. All cells were authenticated by short tandem repeat profiling. SMIM26 was cloned into pEGFP‐N1 for immunofluorescent assay. SMIM26, truncated SMIM26, and AGK were generated by PCR amplification and cloned into the pLVX‐puro vector for overexpression. The shRNA for SMIM26 knockdown was cloned into pLKO.1 vector. For purification of SMIM26, glutathione S‐transferases (GST)‐tagged SMIM26 and SMIM26‐His was performed using the pGEX‐4T‐1 vector and pET‐28b vector. All constructs were validated by DNA sequencing and listed in Appendix Table S6. Plasmid transfection and RNA interference were operated with Lipofectamine 3000 (Invitrogen), according to the manufacturer's instructions.
Patient samples
Human ccRCC and normal renal tissues were surgically collected from ccRCC patients at Sun Yat‐sen University Cancer Center. The written informed consent form was obtained from each participant. This study was approved by the institutional research ethics committee of Sun Yat‐sen University Cancer Center. The procedure was in accordance with the provisions of the Declaration of Helsinki of 1975.
Western blotting and immunoprecipitation
Western blotting was performed as described before (Meng et al, 2020). In brief, equal proteins were separated by SDS–PAGE and transferred into 0.2 μm PVDF membranes (Bio‐Rad). The membranes were blocked with 5% skim milk and immunoblotted with primary antibodies overnight at 4°C. The membranes were then washed with TBST three times, followed by secondary antibodies incubation for another 2 h. The membranes were visualized by using the Chemiluminescence Western Blotting Substrates (Bio‐Rad), and imaged by Luminescence Imaging System (Tanon, China).
Antibodies used in the experiments include anti‐flag (MBL, M185‐3L), anti‐SMIM26 antibody (in‐house developed), anti‐Actin (CST, #4970), anti‐AGK (Abcam, ab137616), anti‐SLC25A11 (Proteintech, 12253‐1‐AP), anti‐AKT (CST, #2920), anti‐phospho‐AKT (CST, #4060), anti‐PABPC4 (Proteintech, 14960‐1‐AP), anti‐ATP5A1 (Proteintech, 14676‐1‐AP), anti‐COXIV (Proteintech, 11242‐1‐AP), anti‐TOM20 (Proteintech, 11802‐1‐AP), anti‐GAPDH (Proteintech, 10494‐1‐AP), anti‐Bcl‐xL (CST, #2762), anti‐TOM40 (Proteintech, 18409‐1‐AP), anti‐HA (CST, #3724), anti‐α‐Tubulin (CST, #77763), anti‐PTEN (Proteintech, 22034‐1‐AP), and anti‐phospho‐PTEN (Proteintech, 29246‐1‐AP). HRP‐linked goat anti‐rabbit/mouse IgG was used as the secondary antibody. For immunoprecipitation assay, light‐/heavy‐chain specific secondary antibodies were used (Abbkine).
For immunoprecipitation, cells were lysed with IP lysis buffer (50 mM Tris–HCl pH 7.4, 2 mM EDTA, 137 mM NaCl, 1% NP‐40, and 10% glycerol) supplemented with Protease Inhibitor Cocktail (Roche), and then rotated with primary antibodies overnight at 4°C. The antibody‐bound protein of interaction in lysis buffer was incubated with 30 μl of Protein A/G Beads (Santa Cruz Biotechnology). After five washes with IP Lysis Buffer, protein‐bound beads were mixed with 1× loading buffer (Fdbio science) and boiled for 10 min at 100°C. The samples were separated with SDS–PAGE.
Immunofluorescence assays
After washing with PBS, cells were fixed with 4% paraformaldehyde at room temperature for 30 min, followed by permeabilization using 0.5% TrionX‐100 for 10 min at room temperature. The samples were then blocked with 5% BSA for 1 h at room temperature, followed by incubation with primary antibodies overnight at 4°C. After washing with 1 × TBST three times, the samples were incubated with fluorescent secondary antibodies at room temperature for 1 h, and then subjected to confocal microscope for observation. The nuclear staining was performed with DAPI for 10 min.
Phalloidin staining of filamentous actin (F‐Actin)
Cells were fixed with 4% paraformaldehyde for 10 min and permeabilization with 0.1% Triton X‐100 for 5 min at room temperature, then washed three times with PBS. F‐actin was subsequently stained with 1× phalloidin‐rhodamine (Beyotime) in 1% bovine serum albumin solution for 1 h at room temperature. Cells were washed, counterstained with DAPI, and photographs were captured using confocal microscope. The F‐actin microfilaments staining intensity of each cell was measured by Image J software.
Animal experiments
Four‐week‐old male NCG mice (Stock# T001475) and nude mice (Stock# D000521) used in this study were purchased from GemPharmatech, Nanjing, China. The animal studies were approved by the Ethics Committee for Animal Experiments of Jinan University (Approval No. IACUC‐20221116‐11), and all of the animal research were conducted complying with the Guidance for the Care and Use of Laboratory Animals of Jinan University. And animal experiments were conducted as described before (Wang et al, 2021b). The ACHN cells labeled with luciferase were stably SMIM26, mut, and control, respectively. For xenograft experiment, cells resuspended with 100 μl per 5 million cells were injected through the subcutaneous of mice, and observed for the next 5 weeks. For tumor metastasis experiment, cells resuspended with 100 μl per 1 million cells were injected through the tail vein of mice, and observed for next 5 weeks. Metastasis cells were monitored by bioluminescent imaging (IVIS Lumina Series III Pre‐clinical in vivo imaging system, PerkinElmer, Hopkinton, MA). At the end of the experiment, the lungs were dissected and examined histologically for the presence of metastasis.
Mitochondrial respiration rate measurement
Seahorse XFe96 Extracellular Flux Analyzer (Agilent Technologies) was used for mitochondrial metabolic experiments. Cells were seeded at a density of 1 × 10³ per well. The oxygen consumption rate (OCR) for each well was calculated, while the cells were subjected to the XF Cell Mito stress test using the following concentrations of injected compounds: 2 μM oligomycin, 1 μM FCCP, and 0.5 μM rotenone. The XF Cell Mito stress test kits were purchased from Agilent Technologies.
Anti‐SMIM26 antibody generation
The GST‐SMIM26 recombinant proteins were purified from the pGEX‐4T‐1 system (GE Healthcare) and cleaved by Thrombin (Sigma Aldrich) to remove the GST tag. The polyclonal antibodies against SMIM26 were obtained from recombinant proteins inoculated rabbits. Anti‐SMIM26 antibodies were further purified using affinity chromatography on columns containing the corresponding recombinant proteins.
RNA‐seq
The RNA‐seq was performed by LC Sciences (Houston, TX, USA). Gene profiles in two conditions were analyzed by the DESeq R package (4.0.3). The genes with a P‐value less than 0.05 and fold change more than 2 determined by DESeq were represented as differentially expressed RNAs. Three independent biological repeats were performed.
Migration and invasion assay in vitro
Cell migration and invasion were tested using transwell chambers (8 μm, BD Biosciences) as described before (Wang et al, 2021a). For migration, cells were seeded in the upper chamber with FBS‐free medium, and 10% FBS was added into the below chamber. The transwell with cells was fixed with methanol and then stained with crystal violet. For invasion, the matrigel gel (Corning, #354234) was used to coat chambers before adding FBS‐free medium. The images of each transwell were photographed in three fields.
Immunohistochemistry and RNA in situ hybridization
Immunohistochemistry was performed to detect SMIM26 protein levels as described before (Zhang et al, 2020). RNA in situ hybridization (ISH) experiments were performed to detect LINC00493 RNA in tissue microarray (TMA) slides using the ISH Detection Kit (Servicebio) according to the protocol. Probe sequence: CCAACACAGACCAGGUGCCGAUCCCGUAGA.
RNA pulldown
For pulldown assay, LINC00493 was transcribed in vitro using TranscriptAid T7 High Yield Transcription (Thermo, K0441). Then, RNAs were biotinylated with Pierce RNA 3′ ‐End Desthiobiotinylation (Thermo, 20163) overnight at 16°C. After the biotinylated RNAs and streptavidin magnetic beads (Thermo, 20164) were mixed for 30 min at room temperature, isotope‐labeled cell lysates and RNase inhibitor were added and rotated for another 1 h at 4°C. Then, the magnetic beads complex was washed three times with wash buffer. After the mixture was boiled in the SDS buffer, the proteins were further tryptic digested and identified via the Orbitrap Fusion Lumos mass spectrometer.
RNA immunoprecipitation
RNA immunoprecipitation (RIP) assays were performed with the manufacturer's protocol by RNA Immunoprecipitation Kit (Bersinbio). In brief, HEK293 and ACHN cells were dissolved by polysome lysis buffer with protease inhibitor and RNase inhibitor for 20 min at 4°C, then DNA was removed by DNase, and the lysis supernatants were incubated with magnetic beads conjugated with the appropriate primary antibodies or IgG overnight at 4°C. The magnetic beads were washed and incubated with proteinase K, and the purified RNA was eluted and analyzed.
Ribosome–nascent chain complex extraction
Cells were pre‐treated with 100 μg/ml cycloheximide for 15 min, then washed with pre‐cooled PBS twice and added with 2 ml lysis buffer (20 mM HEPES‐KOH, 200 mM KCl, 15 mM MgCl2, 100 μg/ml cycloheximide, 2 mM dithiothreitol, and 1% Triton X‐100) and lysed on ice for 30 min. Collect cell lysate and centrifuge at 12,000 g for 10 min at 4°C. Transfer the supernatant on the surface of 20 ml 30% sucrose buffer; RNC was pelleted by ultra‐centrifugation at 185,000 g for 5 h at 4°C.
Mitochondrial GSH levels
Mitochondria in ACHN and 769‐P cells were isolated with sucrose density gradient centrifugation as described in our previous study. One to ten micrometer GSH was used as standard, then Glutathione Assay Kit (Beyotime) was used to measure GSH levels. The concentrations of GSH were normalized to protein quantified by BCA assay (Thermo).
SILAC labeling, mass spectrometry, and bioinformatics analyses
For SILAC labeling, cells were cultured in SILAC (Thermo) media, “heavy” and “light,” supplemented with dialyzed fetal bovine for six‐cell passages. DMEM medium containing 13C6 15N2 (Lys8) and arginine 13C6 15N4 (Arg10) was used for heavy (H) labeling as the heavy SILAC medium, and light DMEM lysine 4, 4, 5, 5‐2D4 (Lys4) and arginine 13C6 14N4 (Arg6) were used for light (L) labeling. The treated cells and control cells were separately lysed by 2% SDS lysis buffer, the two lysates were combined in a 1:1 ratio and tryptic digestion through filtered sample preparation (FASP) method, and the tryptic peptides were dissolved in 0.1% formic acid. Next, the peptides were detected in the mode of data‐dependent acquisition (DDA) by Orbitrap Fusion Lumos mass spectrometer (Thermo). The MaxQuant software platform was used for quantification.
Statistics
The statistical analysis was performed using GraphPad Prism 8, and values of P < 0.05 were considered statistically significant. Results were analyzed by paired/unpaired two‐tailed Student's t‐test, Mann–Whitney test, and two‐way ANOVA. Survival studies were analyzed by log‐rank test. The number of samples is shown in the corresponding figure legends.
Author contributions
Kun Meng: Data curation; investigation; visualization; writing – original draft. Shaohua Lu: Formal analysis; investigation; visualization. Yu‐Ying Li: Investigation. Li‐Ling Hu: Investigation. Jing Zhang: Investigation. Yun Cao: Resources. Yang Wang: Supervision; writing – review and editing. Chris Zhiyi Zhang: Supervision; writing – review and editing. Qing‐Yu He: Conceptualization; funding acquisition; writing – review and editing.
Disclosure and competing interests statement
The authors declare that they have no conflict of interest.
Supporting information
Appendix
Expanded View Figures PDF
PDF+
Source Data for Figure 1
Source Data for Figure 2
Source Data for Figure 3
Source Data for Figure 4
Source Data for Figure 5
Source Data for Figure 6
Acknowledgements
This work was supported by the National Key Research and Development Program of China (2020YFE0202200 and 2017YFA0505100), the National Natural Science Foundation of China (82002949, 31770888, and 31570828), the Guangdong Natural Science Foundation (2022A15150123), the Guangdong Basic and Applied Basic Research Foundation (2022A1515111106), and the Guangzhou Science and Technology Project (202102020752).
EMBO reports (2023) 24: e56282
Contributor Information
Yang Wang, Email: wangyang0507@jnu.edu.cn.
Chris Zhiyi Zhang, Email: zhangzy@jnu.edu.cn.
Qing‐Yu He, tqyhe@email.jnu.edu.cn.
Data availability
RNA‐Seq data: Sequence Read Archive SRP420957 (https://www.ncbi.nlm.nih.gov/sra/?term=SRP420957).
Mass spectrometry proteomic data have been deposited at ProteomeXchange Consortium PXD039890 (https://www.ebi.ac.uk/pride/archive/projects/PXD039890), PXD039926 (https://www.ebi.ac.uk/pride/archive/projects/PXD039926), and PXD039891 (https://www.ebi.ac.uk/pride/archive/projects/PXD039891).
References
- Armaos A, Colantoni A, Proietti G, Rupert J, Tartaglia GG (2021) catRAPID omics v2.0: going deeper and wider in the prediction of protein‐RNA interactions. Nucleic Acids Res 49: W72–W79 [DOI] [PMC free article] [PubMed] [Google Scholar]
- Baulies A, Montero J, Matias N, Insausti N, Terrones O, Basanez G, Vallejo C, Conde de La Rosa L, Martinez L, Robles D et al (2018) The 2‐oxoglutarate carrier promotes liver cancer by sustaining mitochondrial GSH despite cholesterol loading. Redox Biol 14: 164–177 [DOI] [PMC free article] [PubMed] [Google Scholar]
- Boulon S, Ahmad Y, Trinkle‐Mulcahy L, Verheggen C, Cobley A, Gregor P, Bertrand E, Whitehorn M, Lamond AI (2010) Establishment of a protein frequency library and its application in the reliable identification of specific protein interaction partners. Mol Cell Proteomics 9: 861–879 [DOI] [PMC free article] [PubMed] [Google Scholar]
- Buffet A, Morin A, Castro‐Vega LJ, Habarou F, Lussey‐Lepoutre C, Letouze E, Lefebvre H, Guilhem I, Haissaguerre M, Raingeard I et al (2018) Germline mutations in the mitochondrial 2‐Oxoglutarate/malate carrier SLC25A11 gene confer a predisposition to metastatic Paragangliomas. Cancer Res 78: 1914–1922 [DOI] [PubMed] [Google Scholar]
- Casas‐Vila N, Sayols S, Perez‐Martinez L, Scheibe M, Butter F (2020) The RNA fold interactome of evolutionary conserved RNA structures in S. cerevisiae . Nat Commun 11: 2789 [DOI] [PMC free article] [PubMed] [Google Scholar]
- Chen X, Ying Z, Lin X, Lin H, Wu J, Li M, Song L (2013) Acylglycerol kinase augments JAK2/STAT3 signaling in esophageal squamous cells. J Clin Invest 123: 2576–2589 [DOI] [PMC free article] [PubMed] [Google Scholar]
- Ding N, Wang K, Jiang H, Yang M, Zhang L, Fan X, Zou Q, Yu J, Dong H, Cheng S et al (2022) AGK regulates the progression to NASH by affecting mitochondria complex I function. Theranostics 12: 3237–3250 [DOI] [PMC free article] [PubMed] [Google Scholar]
- Galvan DL, Green NH, Danesh FR (2017) The hallmarks of mitochondrial dysfunction in chronic kidney disease. Kidney Int 92: 1051–1057 [DOI] [PMC free article] [PubMed] [Google Scholar]
- Ge Q, Jia D, Cen D, Qi Y, Shi C, Li J, Sang L, Yang L‐J, He J, Lin A et al (2021) Micropeptide ASAP encoded by LINC00467 promotes colorectal cancer progression by directly modulating ATP synthase activity. J Clin Invest 131: e152911 [DOI] [PMC free article] [PubMed] [Google Scholar]
- Guo B, Wu S, Zhu X, Zhang L, Deng J, Li F, Wang Y, Zhang S, Wu R, Lu J et al (2020) Micropeptide CIP2A‐BP encoded by LINC00665 inhibits triple‐negative breast cancer progression. EMBO J 39: e102190 [DOI] [PMC free article] [PubMed] [Google Scholar]
- van Heesch S, Witte F, Schneider‐Lunitz V, Schulz JF, Adami E, Faber AB, Kirchner M, Maatz H, Blachut S, Sandmann C‐L et al (2019) The translational landscape of the human heart. Cell 178: 242–260 [DOI] [PubMed] [Google Scholar]
- Hsieh JJ, Purdue MP, Signoretti S, Swanton C, Albiges L, Schmidinger M, Heng DY, Larkin J, Ficarra V (2017) Renal cell carcinoma. Nat Rev Dis Primers 3: 17009 [DOI] [PMC free article] [PubMed] [Google Scholar]
- Hu Z, Qu G, Yu X, Jiang H, Teng XL, Ding L, Hu Q, Guo X, Zhou Y, Wang F et al (2019) Acylglycerol kinase maintains metabolic state and immune responses of CD8(+) T cells. Cell Metab 30: 290–302 [DOI] [PubMed] [Google Scholar]
- Huang JZ, Chen M, Chen GXC, Zhu S, Huang H, Hu M, Zhu H, Yan GR (2017) A peptide encoded by a putative lncRNA HOXB‐AS3 suppresses colon cancer growth. Mol Cell 68: 171–184 [DOI] [PubMed] [Google Scholar]
- Jang S, Chapa‐Dubocq XR, Tyurina YY, St Croix CM, Kapralov AA, Tyurin VA, Bayır H, Kagan VE, Javadov S (2021) Elucidating the contribution of mitochondrial glutathione to ferroptosis in cardiomyocytes. Redox Biol 45: 102021 [DOI] [PMC free article] [PubMed] [Google Scholar]
- Jonasch E, Gao J, Rathmell WK (2014) Renal cell carcinoma. BMJ 349: g4797 [DOI] [PMC free article] [PubMed] [Google Scholar]
- Kinnaird A, Dromparis P, Saleme B, Gurtu V, Watson K, Paulin R, Zervopoulos S, Stenson T, Sutendra G, Pink DB et al (2016) Metabolic modulation of clear‐cell renal cell carcinoma with Dichloroacetate, an inhibitor of pyruvate dehydrogenase kinase. Eur Urol 69: 734–744 [DOI] [PubMed] [Google Scholar]
- Konina D, Sparber P, Viakhireva I, Filatova A, Skoblov M (2021) Investigation of LINC00493/SMIM26 gene suggests its dual functioning at mRNA and protein level. Int J Mol Sci 22: 8477 [DOI] [PMC free article] [PubMed] [Google Scholar]
- Krogh A, Larsson B, von Heijne G, Sonnhammer EL (2001) Predicting transmembrane protein topology with a hidden Markov model: application to complete genomes. J Mol Biol 305: 567–580 [DOI] [PubMed] [Google Scholar]
- Kurosaki T, Mitsutomi S, Hewko A, Akimitsu N, Maquat LE (2022) Integrative omics indicate FMRP sequesters mRNA from translation and deadenylation in human neuronal cells. Mol Cell 82: 4564–4581 [DOI] [PMC free article] [PubMed] [Google Scholar]
- Kustatscher G, Collins T, Gingras AC, Guo T, Hermjakob H, Ideker T, Lilley KS, Lundberg E, Marcotte EM, Ralser M et al (2022a) An open invitation to the understudied proteins initiative. Nat Biotechnol 40: 815–817 [DOI] [PubMed] [Google Scholar]
- Kustatscher G, Collins T, Gingras AC, Guo T, Hermjakob H, Ideker T, Lilley KS, Lundberg E, Marcotte EM, Ralser M et al (2022b) Understudied proteins: opportunities and challenges for functional proteomics. Nat Methods 19: 774–779 [DOI] [PubMed] [Google Scholar]
- Lee C, Zeng J, Drew BG, Sallam T, Martin‐Montalvo A, Wan J, Kim SJ, Mehta H, Hevener AL, de Cabo R et al (2015) The mitochondrial‐derived peptide MOTS‐c promotes metabolic homeostasis and reduces obesity and insulin resistance. Cell Metab 21: 443–454 [DOI] [PMC free article] [PubMed] [Google Scholar]
- Li C, Han T, Li Q, Zhang M, Guo R, Yang Y, Lu W, Li Z, Peng C, Wu P et al (2021a) MKRN3‐mediated ubiquitination of poly(a)‐binding proteins modulates the stability and translation of GNRH1 mRNA in mammalian puberty. Nucleic Acids Res 49: 3796–3813 [DOI] [PMC free article] [PubMed] [Google Scholar]
- Li Y, Zhang J, Sun H, Chen Y, Li W, Yu X, Zhao X, Zhang L, Yang J, Xin W et al (2021b) Lnc‐Rps4l‐encoded peptide RPS4XL regulates RPS6 phosphorylation and inhibits the proliferation of PASMCs caused by hypoxia. Mol Ther 29: 1411–1424 [DOI] [PMC free article] [PubMed] [Google Scholar]
- Lu S, Zhang J, Lian X, Sun L, Meng K, Chen Y, Sun Z, Yin X, Li Y, Zhao J et al (2019) A hidden human proteome encoded by ‘non‐coding’ genes. Nucleic Acids Res 47: 8111–8125 [DOI] [PMC free article] [PubMed] [Google Scholar]
- Makarewich CA, Munir AZ, Bezprozvannaya S, Gibson AM, Young Kim S, Martin‐Sandoval MS, Mathews TP, Szweda LI, Bassel‐Duby R, Olson EN (2022) The cardiac‐enriched microprotein mitolamban regulates mitochondrial respiratory complex assembly and function in mice. Proc Natl Acad Sci U S A 119: e2120476119 [DOI] [PMC free article] [PubMed] [Google Scholar]
- Martinez TF, Chu Q, Donaldson C, Tan D, Shokhirev MN, Saghatelian A (2020) Accurate annotation of human protein‐coding small open reading frames. Nat Chem Biol 16: 458–468 [DOI] [PMC free article] [PubMed] [Google Scholar]
- Meng K, Lu S, Yan X, Sun Y, Gao J, Wang Y, Yin X, Sun Z, He QY (2020) Quantitative mitochondrial proteomics reveals ANXA7 as a crucial factor in Mitophagy. J Proteome Res 19: 1275–1284 [DOI] [PubMed] [Google Scholar]
- Miller B, Kim S‐J, Kumagai H, Yen K, Cohen P (2022) Mitochondria‐derived peptides in aging and healthspan. J Clin Invest 132: e158449 [DOI] [PMC free article] [PubMed] [Google Scholar]
- Ning N, Zhang S, Wu Q, Li X, Kuang D, Duan Y, Xia M, Liu H, Weng J, Ba H et al (2022) Inhibition of acylglycerol kinase sensitizes DLBCL to venetoclax via upregulation of FOXO1‐mediated BCL‐2 expression. Theranostics 12: 5537–5550 [DOI] [PMC free article] [PubMed] [Google Scholar]
- Pang Y, Liu Z, Han H, Wang B, Li W, Mao C, Liu S (2020) Peptide SMIM30 promotes HCC development by inducing SRC/YES1 membrane anchoring and MAPK pathway activation. J Hepatol 73: 1155–1169 [DOI] [PubMed] [Google Scholar]
- Polycarpou‐Schwarz M, Gross M, Mestdagh P, Schott J, Grund SE, Hildenbrand C, Rom J, Aulmann S, Sinn HP, Vandesompele J et al (2018) The cancer‐associated microprotein CASIMO1 controls cell proliferation and interacts with squalene epoxidase modulating lipid droplet formation. Oncogene 37: 4750–4768 [DOI] [PubMed] [Google Scholar]
- Rini BI, Campbell SC, Escudier B (2009) Renal cell carcinoma. Lancet 373: 1119–1132 [DOI] [PubMed] [Google Scholar]
- Sato Y, Yoshizato T, Shiraishi Y, Maekawa S, Okuno Y, Kamura T, Shimamura T, Sato‐Otsubo A, Nagae G, Suzuki H et al (2013) Integrated molecular analysis of clear‐cell renal cell carcinoma. Nat Genet 45: 860–867 [DOI] [PubMed] [Google Scholar]
- Sousa ME, Farkas MH (2018) Micropeptide. PLoS Genet 14: e1007764 [DOI] [PMC free article] [PubMed] [Google Scholar]
- Spencer HL, Sanders R, Boulberdaa M, Meloni M, Cochrane A, Spiroski AM, Mountford J, Emanueli C, Caporali A, Brittan M et al (2020) The LINC00961 transcript and its encoded micropeptide, small regulatory polypeptide of amino acid response, regulate endothelial cell function. Cardiovasc Res 116: 1981–1994 [DOI] [PMC free article] [PubMed] [Google Scholar]
- Sreekumar PG, Wang M, Spee C, Sadda SR, Kannan R (2020) Transporter‐mediated mitochondrial GSH depletion leading to mitochondrial dysfunction and rescue with αB Crystallin peptide in RPE cells. Antioxidants 9: 411 [DOI] [PMC free article] [PubMed] [Google Scholar]
- Stein CS, Jadiya P, Zhang X, McLendon JM, Abouassaly GM, Witmer NH, Anderson EJ, Elrod JW, Boudreau RL (2018) Mitoregulin: a lncRNA‐encoded microprotein that supports mitochondrial Supercomplexes and respiratory efficiency. Cell Rep 23: 3710–3720 [DOI] [PMC free article] [PubMed] [Google Scholar]
- Sun L, Wang W, Han C, Huang W, Sun Y, Fang K, Zeng Z, Yang Q, Pan Q, Chen T et al (2021) The oncomicropeptide APPLE promotes hematopoietic malignancy by enhancing translation initiation. Mol Cell 81: 4493–4508 [DOI] [PubMed] [Google Scholar]
- Sun Y, Yang YM, Hu YY, Ouyang L, Sun ZH, Yin XF, Li N, He QY, Wang Y (2022) Inhibition of nuclear deacetylase Sirtuin‐1 induces mitochondrial acetylation and calcium overload leading to cell death. Redox Biol 53: 102334 [DOI] [PMC free article] [PubMed] [Google Scholar]
- Tran MT, Zsengeller ZK, Berg AH, Khankin EV, Bhasin MK, Kim W, Clish CB, Stillman IE, Karumanchi SA, Rhee EP et al (2016) PGC1α drives NAD biosynthesis linking oxidative metabolism to renal protection. Nature 531: 528–532 [DOI] [PMC free article] [PubMed] [Google Scholar]
- Vukotic M, Nolte H, Konig T, Saita S, Ananjew M, Kruger M, Tatsuta T, Langer T (2017) Acylglycerol kinase mutated in Sengers syndrome is a subunit of the TIM22 protein translocase in mitochondria. Mol Cell 67: 471–483 [DOI] [PubMed] [Google Scholar]
- Wang T, Cui Y, Jin J, Guo J, Wang G, Yin X, He QY, Zhang G (2013) Translating mRNAs strongly correlate to proteins in a multivariate manner and their translation ratios are phenotype specific. Nucleic Acids Res 41: 4743–4754 [DOI] [PMC free article] [PubMed] [Google Scholar]
- Wang Y, Zhang J, Li Y‐J, Yu N‐N, Liu W‐T, Liang J‐Z, Xu WW, Sun Z‐H, Li B, He Q‐Y (2021a) MEST promotes lung cancer invasion and metastasis by interacting with VCP to activate NF‐κB signaling. J Exp Clin Cancer Res 40: 301 [DOI] [PMC free article] [PubMed] [Google Scholar]
- Wang Y, Zhang J, Li YJ, Yu NN, Liu WT, Liang JZ, Xu WW, Sun ZH, Li B, He QY (2021b) MEST promotes lung cancer invasion and metastasis by interacting with VCP to activate NF‐kappaB signaling. J Exp Clin Cancer Res 40: 301 [DOI] [PMC free article] [PubMed] [Google Scholar]
- Wettersten HI, Aboud OA, Lara PN, Weiss RH (2017) Metabolic reprogramming in clear cell renal cell carcinoma. Nat Rev Nephrol 13: 410–419 [DOI] [PubMed] [Google Scholar]
- Xie C, Wang F‐Y, Sang Y, Chen B, Huang J‐H, He F‐J, Li H, Zhu Y, Liu X, Zhuang S‐M et al (2022) Mitochondrial micropeptide STMP1 enhances mitochondrial fission to promote tumor metastasis. Cancer Res 82: 2431–2443 [DOI] [PubMed] [Google Scholar]
- Yeasmin F, Imamachi N, Tanu T, Taniue K, Kawamura T, Yada T, Akimitsu N (2021) Identification and analysis of short open reading frames (sORFs) in the initially annotated noncoding RNA LINC00493 from human cells. J Biochem 169: 421–434 [DOI] [PubMed] [Google Scholar]
- Zhang J, Zhou Y, Li N, Liu WT, Liang JZ, Sun Y, Zhang WX, Fang RD, Huang SL, Sun ZH et al (2020) Curcumol overcomes TRAIL resistance of non‐small cell lung cancer by targeting NRH: Quinone oxidoreductase 2 (NQO2). Adv Sci (Weinh) 7: 2002306 [DOI] [PMC free article] [PubMed] [Google Scholar]
- Zhang C, Zhou B, Gu F, Liu H, Wu H, Yao F, Zheng H, Fu H, Chong W, Cai S et al (2022) Micropeptide PACMP inhibition elicits synthetic lethal effects by decreasing CtIP and poly(ADP‐ribosyl)ation. Mol Cell 82: 1297–1312 [DOI] [PubMed] [Google Scholar]
- Zhou P, Chi H (2019) AGK unleashes CD8(+) T cell glycolysis to combat tumor growth. Cell Metab 30: 233–234 [DOI] [PubMed] [Google Scholar]
- Zhu Q, Zhong AL, Hu H, Zhao JJ, Weng DS, Tang Y, Pan QZ, Zhou ZQ, Song MJ, Yang JY et al (2020) Acylglycerol kinase promotes tumour growth and metastasis via activating the PI3K/AKT/GSK3beta signalling pathway in renal cell carcinoma. J Hematol Oncol 13: 2 [DOI] [PMC free article] [PubMed] [Google Scholar]
- Zong WX, Rabinowitz JD, White E (2016) Mitochondria and cancer. Mol Cell 61: 667–676 [DOI] [PMC free article] [PubMed] [Google Scholar]