

Abstract
High‐fat diets (HFD) adversely affect organ systems. Several studies have examined HFD‐related disorders in animals but only in a few organs and time points. Herein, we evaluated disease development with time‐dependent HFD‐induced pathological, cardiovascular, and morphological changes in rabbits with lipid metabolism similar to that in humans for 9 weeks. The body weights and waist ratio of the HFD group were higher than those in the control group. HFD significantly increased the total cholesterol, low‐density lipoprotein, high‐density lipoprotein, and phospholipid levels after 3 weeks. Liver enzyme levels increased with hepatomegaly, steatosis, and fibrosis after 3 or 6 weeks. RBCs and hemoglobin decreased, while platelets increased in the HFD group with atherosclerosis and inflammatory cell infiltration in the aorta after 6 weeks. Ejection fraction and fractional shortening values decreased in the HFD group after 9 weeks. Creatinine increased with glomerulosclerosis in the kidneys of the HFD groups after 3 weeks, indicating renal dysfunction. Lipid accumulation was found in the pancreas after 9 weeks. Lipid accumulation and hypertrophy were observed in the adrenal glands after 3 weeks. Overall, our findings provide global reference data on the time‐dependent effects of HFD on the body and may serve as a guide for future HFD risk prevention.
Keywords: atherosclerosis, cardiac contractility, high‐density lipoprotein, high‐fat diet, hyperlipidemia, renal dysfunction
High‐fat diet (HFD) increased body weight and waist ratio. HFD induced hyperlipidemia and an increase in liver enzymes with hepatomegaly, steatosis, and fibrosis. HFD induced a decrease in RBCs and hemoglobin, and an increase in platelets with atherosclerosis in the aorta. HFD induced a decrease in cardiac contractility and an increase in creatinine with glomerulosclerosis. HFD induced lipid accumulation in the pancreas and adrenal glands.

Abbreviations
- ALT
alanine aminotransferase
- AST
aspartate aminotransferase
- BUN
blood urea nitrogen
- CETP
cholesteryl ester transfer protein
- EF
ejection fraction
- ESC/EAS
European Society of Cardiology/European Atherosclerosis Society
- FS
fractional shortening
- H&E
hematoxylin and eosin
- HDL
high‐density lipoprotein
- HDLs
high‐density lipoproteins
- HFD
high‐fat diets
- IACUC
Institutional Animal Care and Use Committee
- LDL
low‐density lipoprotein
- LDLs
low‐density lipoproteins
- MAP
mean arterial pressure
- NAFLD
nonalcoholic fatty liver disease
- NEFA
high‐plasma nonesterified fatty acid
- NZW
New Zealand White
- RBC
red blood cells
- ROS
reactive oxygen species
- SEM
standard error of the mean
- SPF
specific pathogen‐free
- TCHOL
total cholesterol
- TG
triglyceride
- vWF
von Willebrand factor
High‐fat diet (HFD)‐induced obesity has become a global epidemic and is a risk factor for metabolic disorders, such as cardiovascular disease, neurovascular disease, diabetes mellitus dyslipidemia, metabolic syndrome, and fatty liver disease [1, 2, 3, 4, 5, 6]. The prevalence of Class III obesity has steadily increased in the past 40 years, reaching epidemic proportions worldwide. More than 1.9 billion adults over the age of 18 are overweight (39%), and 650 million adults are obese (13%) [7]. For every 1% increase in obesity prevalence, the mortality rate for people infected with COVID‐19 increased by 8.3% and the incidence by 6.6% [8]. Obesity can be caused by a modern lifestyle dominated by sedentary activities and increasing food overconsumption in the absence of hunger [9]. Owing to the large increase in the worldwide prevalence of obesity, it is important to elucidate the comprehensive adverse effects of an HFD [1, 10, 11].
Characterizing animal disease models is a significant technique for advancing clinical intervention development and understanding disease pathophysiology [1, 12]. Considering the characteristics of each laboratory animal species, the most appropriate animal species should be studied to stimulate human diseases with similar pathophysiologies and complications and discover innovative prevention, treatment, and monitoring measures. Rodents are the predominant animal models for preclinical studies owing to their short lifespan, high fertility, and short duration for disease progression [13, 14, 15, 16]. However, rodents are not suitable laboratory animals for studying HFD‐induced biological changes. Rodents lack plasma cholesteryl ester transfer protein (CETP), which regulates lipoprotein metabolism, and possess more high‐density lipoproteins (HDLs) than low‐density lipoproteins (LDLs), unlike humans [1, 17, 18]. By contrast, rabbits are a well‐known animal model for studying HFD‐induced dyslipidemia or atherosclerosis as their lipoprotein metabolism is similar to that of humans. Rabbits have abundant plasma CETP and LDLs‐rich lipoprotein profiles and high plasma nonesterified fatty acid (NEFA) and triglyceride (TG) levels, similar to those observed in humans with obesity [1, 17]. In addition, rabbits are suitable laboratory animals for studying changes in heart function because the heartbeat mechanism in rabbits is more similar to that in humans than in rodents. The action potential morphology, repolarization mechanism mediated by rectifier K+ currents, and Ca2+ transporter function in rabbit ventricular myocardium are more similar to those in the human ventricle than in the rodent ventricle. Therefore, rabbits are widely used to study heart diseases, such as aortic constriction, myocardial ischemia followed by reperfusion, and atrial fibrillation [19, 20, 21, 22].
Although some studies have released data on HDF‐induced changes in rabbits, their findings are fragmented. For example, Abdelhalim and Moussa studied only biochemical changes in red blood cells (RBC) after HFD, Zarzoso et al. revealed only HFD‐induced ventricular changes, and Birkner et al. studied only the liver for metabolic and antioxidative changes [4, 23, 24]. In addition, observing changes in two or more factors cannot validate the change based on the cumulative exposure time of HFD. Sibouakaz et al. analyzed the results of biochemical assays, thin‐layer chromatography, and transmission electron microscopy. However, time‐course changes in the body after HFD exposure were not confirmed because these analyses were performed only 3 months after HFD induction. Shao et al. observed growth, behavior, and serum biochemical and morphological changes after an HFD. Although many factors were observed, only the changes after 5 weeks of HFD were confirmed [25, 26].
In this study, a time‐dependent rabbit hyperlipidemic model was designed to investigate comprehensive, time‐dependent pathophysiological changes, including blood components, cardiovascular system, and histopathologic evaluation, for 9 weeks. This early‐phase hyperlipidemic rabbit model will increase our understanding of the progression of this disease in the body after HFD and aid the development of drugs for patients with metabolic syndrome in the early stages of hyperlipidemia. Furthermore, therapeutic strategies for the prevention of metabolic syndrome are expected to improve clinical outcomes in patients.
Materials and methods
Husbandry
Male specific‐pathogen‐free (SPF) New Zealand White (NZW) rabbits with an average weight of 2.5 kg were used in this study. The NZW rabbits were bred in a room with 50 ± 20% humidity, 21 ± 3 °C temperature, 10–20 cycles·h−1 ventilation rate, and a 12‐h light/dark cycle. After 1 week of acclimatization, the rabbits were randomly divided into HFD and control groups. The control group (n = 11) was fed normal rabbit chow (#38302, Purina Rabbit Chow, Purina Co., Ltd., St. Louis, MO, USA), and the animals were divided into three subgroups based on the diet period [3 weeks (n = 3), 6 weeks (n = 4), and 9 weeks (n = 4)]. The rabbits in the HFD group (n = 22) were fed 250 g of pellets of a custom‐made Purina Rabbit Chow (#5321, supplemented with 1% cholesterol and 5% corn oil) every day and divided into three subgroups based on the diet period [3 weeks (n = 6), 6 weeks (n = 8), and 9 weeks (n = 7)]. All rabbits were provided with water ad libitum. The rabbits were euthanatized on the last day of their dietary schedule for histopathological analysis and autopsy.
This study was approved by the K‐MEDI Hub Institutional Animal Care and Use Committee (IACUC approval number: DGMIF‐17061001, approval date: September 13, 2017). All animal experiments were conducted per the Regulations for Animal Experimentation of the K‐MEDI hub.
Body weight and waist ratio
The body weights of all animals were determined at 0 (prediet), 1, 2, 3, 6, and 9 weeks during the experimental period. To assess waist ratio changes, X‐ray digital radiography (ELMO‐T3, DK Medical Systems, Seoul, Korea) was performed. The waist ratio was calculated as follows: [waist diameter measured at the midpoint from the first lumbar to top edge of the iliac crest/distance from the first lumbar to top edge of the iliac crest].
Blood test: hematology and serum biochemistry
Blood was withdrawn from the auricular artery of all rabbits and collected in EDTA‐K2 tubes (BD, East Rutherford, NJ, USA) containing an anticoagulant at the prediet stage (week 0) and then at 3‐week intervals after commencing the HFD. RBC, hemoglobin, and platelets were measured using a hematology analyzer (ADVIA2120i; Siemens, Munich, Germany). Plasma was separated by centrifugation at 2000 g for 10 min at 4 °C. Total cholesterol (TCHOL), low‐density lipoprotein (LDL), high‐density lipoprotein (HDL), phospholipid, blood urea nitrogen (BUN), and creatinine concentrations, as well as aspartate aminotransferase (AST) and alanine aminotransferase (ALT) activities, were measured using an automated biochemistry analyzer (TBA 120FR, Toshiba, Tokyo, Japan).
Echocardiography
Cardiac function was tested at the prediet stage (week 0) and then at 3‐week intervals after starting the HFD until week 9 using the Vevo 2100 ultrasound system with an MS200 transducer (VisualSonics, Toronto, ON, Canada). The rabbits were placed in a right lateral recumbency position under 1.5% isoflurane anesthesia and left ventricular contractility was measured in triplicate. The interventricular septum, left ventricular internal dimension, and left ventricular free wall thickness in diastole and systole were measured using two‐dimensional guided M‐mode tracings from the right parasternal short‐axis view just below the mitral valve at the level of the papillary muscle to calculate the ejection fraction (EF) and fractional shortening (FS).
Necropsy and histopathology
All rabbits were euthanized by intravenously injecting pentobarbitone sodium (Lethabarb, Virbac Australia, Milperra, NSW, Australia). The liver was dissected, and the relative organ weight was determined. For histopathological analysis, the liver, pancreas, aorta, kidney, and adrenal gland were fixed in 10% neutral buffered formalin (BBC Biochemical, Mount Vernon, WA, USA) and embedded in paraffin wax. Tissue sections were cut to a thickness of 4 μm, and hematoxylin and eosin (H&E) staining and Masson's trichrome staining were performed using an automated staining machine (DAKO Coverstainer, WA, USA).
Statistical analysis
All data are expressed as mean ± standard error of the mean (SEM). Statistical analyses were performed with multiple t‐tests using graphpad prism 8 (GraphPad Software Inc., San Diego, CA, USA). Statistical significance was set at P < 0.05.
Results
HFD increased weight gain and waist ratio
The body weights of both groups gradually increased until the third week of the diet treatment, with no significant differences between the control and HFD groups. However, the body weight of the HFD group continued to increase after 6 weeks and was significantly higher than that of the control group, whereas the body weight of the control group reached a plateau and remained constant until the end of the experiment (Fig. 1A). The waist ratio of the HFD group continued to increase in contrast to the control group and significantly higher than that of the control group at 9 weeks (Fig. 1B).
Fig. 1.
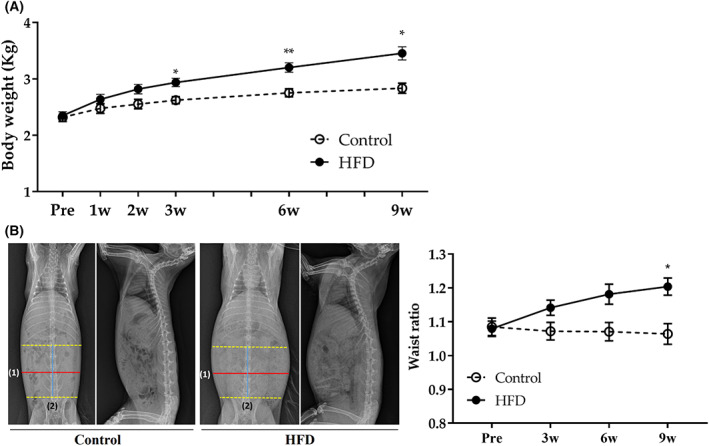
Change of body weight and Waist ratio. Changes in (A) body weight and (B) waist ratio. The representative picture of radiography at 9 weeks. The waist ratio was calculated as follows: [(1) waist diameter measured at midpoint from the first lumbar to top edge of the iliac crest/(2) distance from the first lumbar to top edge of the iliac crest]. Control group (n = 11) [3 weeks (n = 3), 6 weeks (n = 4), and 9 weeks (n = 4)]. HFD group (n = 22) [3 weeks (n = 6), 6 weeks (n = 8), and 9 weeks (n = 7)]. Statistical analyses were performed with multiple t‐tests. Data are expressed as mean ± SEM. **P < 0.01 or *P < 0.05 versus the control group.
HFD significantly increased serum lipid profiles
The plasma of rabbits in the HFD group became cloudy and milky after 3 weeks, in contrast to those in the control group, which remained clear throughout the experiment (Fig. 2A). The TCHOL, LDL, HDL, and phospholipid concentrations in the plasma of HFD rabbits were significantly higher than those of the control group after 3 weeks and by 58‐, 388‐, 42‐, and 12‐fold at 9 weeks, respectively (Fig. 2B). These findings suggest that aberrant lipid metabolism is related to diet‐induced changes in the liver. Therefore, we next evaluated the time‐course changes in liver enzyme levels and hepatic pathology.
Fig. 2.

Change of lipid profile. Changes in (A) Gross inspection of serum in all groups at 0 (Pre), 3, 6, and 9 weeks in rabbits. (B) Changes in lipid profiles. Changes in the TCHOL, LDL, HDL, and phospholipid levels at 0 (Pre), 3, 6, and 9 weeks in rabbits. Control group (n = 11) [3 weeks (n = 3), 6 weeks (n = 4), and 9 weeks (n = 4)]. HFD group (n = 22) [3 weeks (n = 6), 6 weeks (n = 8), and 9 weeks (n = 7)]. Statistical analyses were performed with multiple t‐tests. Data are expressed as mean ± SEM. ****P < 0.0001 versus the control group.
HFD‐induced hepatomegaly, alterations in liver enzymes activities, and steatosis
The relative weight of the liver to the body was significantly higher in the HFD group than in the control group at 6 and 9 weeks. The liver/body weight ratio was 1.49‐ and 1.46‐fold higher on average in the HFD group at 6 and 9 weeks compared with the control group, respectively (Fig. 3A). The livers of rabbits fed HFD exhibited features of fatty liver with pale color and blunted edges, contrary to the normal features of the control groups (Fig. 3B). Only the HFD group developed Lipid accumulation (microvesicular steatosis predominantly), hepatocyte hypertrophy, loss of lobular structure, and fibrosis at 3, 6, and 9 weeks (Fig. 3C,D). ALT and AST activities and AST/ALT of the HFD group were significantly elevated than those of the control group at 3, 6, and 9 weeks (Fig. 3E).
Fig. 3.

Pathological and morphological changes in the liver. (A) Ratios of liver/body weight at 0 (Pre), 3, 6, and 9 weeks in rabbits. (B) Gross appearance of liver, (C) Histopathological changes in the liver. H&E staining of liver in rabbits fed HFD [original magnifications were ×200 and ×600]. Liver from rabbits in the control group and those fed HFD for 3, 6, and 9 weeks. Lipid accumulation (microvesicular steatosis predominantly), hepatocyte hypertrophy, and loss of lobular structure were observed in the liver of rabbits fed the HFD for 3, 6, and 9 weeks compared with the control. Scale bars = 100 μm. (D) Masson's trichome staining of liver from rabbits fed HFD [original magnification was ×200]. Liver from rabbits in the control and those fed HFD for 3, 6, and 9 weeks. Fibrogenesis (blue) was observed in the liver of rabbits fed the HFD for 3, 6, and 9 weeks compared with control. Scale bars = 250 μm. (E) ALT, AST, and AST/ALT levels in the blood at 0, 3, 6, and 9 weeks in rabbits. Statistical analyses were performed with multiple t‐tests. Control group (n = 11) [3 weeks (n = 3), 6 weeks (n = 4), and 9 weeks (n = 4)]. HFD group (n = 22) [3 weeks (n = 6), 6 weeks (n = 8), and 9 weeks (n = 7)]. Statistical analyses were performed with multiple t‐tests. Data are expressed as mean ± SEM. **P < 0.01 or *P < 0.05 versus the control group.
HFD significantly decreased RBC and hemoglobin concentrations and increased platelet concentration
The HFD induced significant differences in the RBC, hemoglobin, and platelet concentrations in the blood compared with the control group. After 3 weeks, RBC and hemoglobin concentrations in the plasma of the HFD group were significantly lower than those of the control group and gradually decreased in contrast to the control group (Fig. 4A,B). The platelet concentration in the plasma was significantly higher in the HFD group than in the control group after 6 weeks (Fig. 4C).
Fig. 4.

Changes in (A) RBC, (B) hemoglobin, and (C) platelet concentrations in the blood at 0 (Pre), 3, 6, and 9 weeks in rabbits. Control group (n = 11) [3 weeks (n = 3), 6 weeks (n = 4), and 9 weeks (n = 4)]. HFD group (n = 22) [3 weeks (n = 6), 6 weeks (n = 8), and 9 weeks (n = 7)]. Statistical analyses were performed with multiple t‐tests. Data are expressed as mean ± SEM. **P < 0.01, or *P < 0.05 versus the control group.
HFD‐induced histopathological and functional changes in the cardiovascular system
Ejection fraction (EF)% and fractional shortening (FS)%, indicating the function of cardiac contractility, gradually decreased in the HFD group compared with those in the control group. EF% and FS% of the HFD group were significantly lower than those of the control group at 9 weeks (Fig. 5A,B). Atherosclerotic plaques were found in the aorta at 3, 6, and 9 weeks, with inflammatory cell infiltration at 9 weeks in the HFD group, contrary to the normal aorta features in the control group, while there were no pathological lesions in the carotid artery in either group (Fig. 5C). The mean arterial pressure (MAP) in both groups increased, and there was no significant difference between the groups (Fig. 5D).
Fig. 5.

Changes in the cardiovascular system. (A) Echocardiography of the left parasternal short‐axis view (upper) with two‐dimensional guided M‐mode tracing (lower) at the level of the papillary muscle in the left ventricle. (B) Index of cardiac contractility. EF% and FS%. (C) Transverse section of the H&E‐stained aorta of the control and HFD‐fed rabbits at 3, 6, and 9 weeks. In the 6 and 9 weeks HFD groups, atherosclerotic lesions represent proliferated collagen fibers, lipid accumulation (6, 9 weeks), and infiltrated inflammatory cells (9 weeks). Scale bars = 250 μm. (D) Mean arterial pressure (MAP) measured in the auricular artery. Values are means of three measurements taken within 3 min in all rabbits. Statistical analyses were performed with multiple t‐tests. Control group (n = 11) [3 weeks (n = 3), 6 weeks (n = 4), and 9 weeks (n = 4)]. HFD group (n = 22) [3 weeks (n = 6), 6 weeks (n = 8), and 9 weeks (n = 7)]. Data are expressed as mean ± SEM. *P < 0.05 versus the control group.
HFD‐induced histopathological changes in the lipid accumulation in the pancreas and adrenal gland and vacuolation in the pancreas
Lipid accumulation was observed in the pancreas, adrenal gland, and liver of the HFD group at 3, 6, and 9 weeks. Significant pathological changes such as hypertrophy, inflammatory cell infiltration, fibrosis, and hemorrhage in the adrenal gland were also observed. β‐Islet vacuolation was found in the pancreas of the HFD group at 3, 6, and 9 weeks. There was no statistical difference in fasting blood glucose between the two groups (Fig. 6).
Fig. 6.

H&E staining of the pancreas and zona fasciculata of the adrenal gland and fasting blood glucose concentration in rabbits. (A) Negative control and HFD groups at 3, 6, and 9 weeks. In HFD groups, β‐islet represented vacuolization (3, 6, and 9 weeks) and lipid accumulation (9 weeks) in the pancreas. Scale bars = 200 μm. Black circle = β‐islet, yellow quadrangle = lipid accumulation. (B) Lipid accumulation, hypertrophy, and loss of lobular structure were observed in the adrenal gland of HFD‐fed rabbits. Scale bars = 50 μm. (C) Changes in fasting blood glucose concentrations at 0 (Pre), 3, 6, and 9 weeks in rabbits. Data are expressed as mean ± SEM.
HFD‐induced clinical and histopathological changes in the kidney
Creatinine concentration in the serum of the HFD group was significantly higher than that of the control group at 3, 6, and 9 weeks. The blood urea nitrogen (BUN) concentration between HFD and control groups was not significantly different. Glomerulosclerosis was observed in the kidneys of the HFD group at 3, 6, and 9 weeks (Fig. 7).
Fig. 7.

H&E staining of the kidney (cortex), creatinine, and BUN concentration in rabbits. H&E staining of the kidney cortex of rabbits in the negative control and HFD‐fed groups at 3, 6, and 9 weeks. (A) In the HFD groups, the glomerulus represents glomerulosclerosis (3, 6, and 9 weeks). Scale bars = 200 μm. Black circle = glomerulosclerosis. (B) Changes in creatinine concentrations at 0 (Pre), 3, 6, and 9 weeks in rabbits. (C) Changes in BUN concentrations at 0 (Pre), 3, 6, and 9 weeks in rabbits. Control group (n = 11) [3 weeks (n = 3), 6 weeks (n = 4), and 9 weeks (n = 4)]. HFD group (n = 22) [3 weeks (n = 6), 6 weeks (n = 8), and 9 weeks (n = 7)]. Statistical analyses were performed with multiple t‐tests. *P < 0.05 versus the control group.
Discussion
Obesity, which is attributed to the consumption of an HFD, is a risk factor associated with fatty liver diseases, diabetes, and atherosclerosis in industrialized societies, with a dramatically increasing prevalence in the United States, Asia, and Europe [27, 28, 29]. Diabetes can be induced by DNA methylation, thereby reducing the transcriptional activity of beta cell genes and inducing insulin resistance after the consumption of an HFD. HFD‐associated obesity primarily causes nonalcoholic fatty liver disease (NAFLD) owing to endoplasmic stress, perturbation of autophagy, mitochondrial dysfunction, and inflammatory responses, causing abdominal pain, nausea, jaundice, and edema [30]. In addition, HFD induces pro‐inflammatory conditions that develop atherosclerosis with aberrant inflammatory responses in the arterial walls. Atherosclerosis is responsible for myocardial infarction, cerebral infarction, and stroke, leading to temporary vision loss, difficulty speaking, and kidney failure [31]. Pre‐emptive efforts are required to reduce HFD exposure because of the interrelated networks of metabolic syndromes in other diseases [1, 10, 11]. In this study, we characterized multiple time‐dependent HFD‐induced pathological, cardiovascular, and morphological changes to provide basic data showing the progression from an acute response to adaptation and aid the development of novel drugs using a hyperlipidemia rabbit model.
We observed that HFD significantly increased the body weight and waist ratio compared with the body weight plateau of the control after 3 and 9 weeks, respectively. The energy density of fat (9 kcal·g−1) was more than twice that of carbohydrate or protein (4 kcal·g−1) [32], validating the relatively high‐fat composition in the body weight of HFD‐fed rabbits. The finding that HFD increased body weight or waist ratio is consistent with many previous findings [1, 4, 23, 25, 26].
High‐fat diets remarkably altered the lipid profile compared with the results of previous studies [6, 26, 33]. TCHOL, LDL, HDL, and phospholipids were significantly higher in the HFD group than in the control group at 3 weeks and continued to increase until 9 weeks. Lipid dysregulation is a risk factor for the cardiovascular system, liver, pancreas, and kidney [3, 34, 35, 36]. Recent reports observed that HFD first alters the lipid profile, followed by other factors such as histopathology. Prim et al. [37] reported a high lipid profile, with no histopathological changes in the aorta 56 days after HFD consumption in rabbits.
Lipid dyslipidemia and steatosis of the liver appeared at 3 weeks, whereas atherosclerotic plaques with proliferated collagen fiber and lipid accumulation, and inflammatory cell infiltration in the aorta were observed at 6 and 9 weeks after HFD consumption, respectively. These results suggest that feeding an HFD for a longer period is recommended for histopathological research related to the cardiovascular system.
Hypercholesterolemia is the most evident cause of cardiovascular diseases [38]. Cholesterol is a required component of the animal cell membrane, where it maintains the barrier function to the environment and modulates fluidity and signaling molecules. Cholesterol is also the sole precursor of steroid hormones and plays a major role in myelin sheath formation surrounding axons [39]. In the bloodstream of humans and other vertebrates, cholesterol is transported as lipoprotein particles, which are divided into two major proteins: LDL and HDL [40]. The normal physiological mechanisms of LDL are associated with its ability to transport cholesterol to cells when the cell requires more cholesterol [41]. However, the relationship between high levels of plasma LDL‐cholesterol and the risk of cardiovascular disease is well‐established. Oxidized LDL particles result in endothelial dysfunction, leading to the expression of adhesion molecules with monocyte recruitment from the subendothelial space, inducing atherosclerosis [42, 43]. LDL levels are also associated with diabetes, myocardial infarction, and hypertension. By contrast, there has been ongoing controversy surrounding the benefits and risks of HDL [44]. HDL is an essential component that mediates cellular cholesterol efflux, delivers cholesterol from extrahepatic tissues to the liver, and serves as a preferential precursor for bile acid biosynthesis with other beneficial mechanisms, including anti‐oxidation, anti‐thrombosis, and anti‐inflammation [45]. Blood HDL levels are considered strong inverse predictors of future cardiovascular morbidity and mortality because HDLs have multiple anti‐atherogenic effects by taking up cholesterol from foam cells localized to lipid accumulation on blood vessel walls, inhibiting LDL oxidation, and limiting the inflammatory process underlying atherosclerosis [44, 46, 47, 48]. However, despite the beneficial effect of HDL on the body, high HDF concentration may adversely affect the cardiovascular system.
Low or extremely high HDL levels are associated with all‐cause mortality, including cardiovascular disease, while slightly high HDL level suppresses mortality [49]. Atherosclerotic disease is responsible for the increased risk of mortality associated with very high HDL levels. HDL may be functionally compromised owing to an extremely high HDL level, inducing normal HDLs to be detrimental [50], which may be associated with a higher risk of atherosclerosis [51]. Endothelial function impairment has been observed in patients with extremely high and low HDL concentrations [52]. Although HDL has anti‐inflammatory benefits in the absence of inflammation, when inflammation arises, HDL exacerbates inflammation, such as atherosclerosis [53]. The European Society of Cardiology/European Atherosclerosis Society (ESC/EAS) dyslipidemia guidelines reported that the risk of atherosclerosis is elevated when the HDL concentration exceeds 90 mg·dL−1. Our data showed that HFD substantially increased TCHOL, LDL, HDL, and phospholipid levels, by 58‐, 388‐, 42‐, and 12‐fold, respectively, compared with the control group at week 9. Phospholipids and cholesterols, one of the major structure of cell membranes, should exist in a constant ratio in the cell membrane such as erythrocytes. However, Hypercholesterolemia can induce the irreversible change in cell membrane due to excessive cholesterol proportion in cell membrane. It can consequently induce a morphological change in red blood cell aggregability and atherosclerosis [54, 55]. Our experimental results, in which the cholesterol elevation rate is much higher than the phospholipid elevation rate in serum, predict the occurrence of atherosclerosis. Therefore, we can predict the adverse effects of severe hyperlipidemia, including extremely high concentrations of LDL and HDL, in the body.
Consuming excess fat is toxic to the liver because of the harmful fat accumulation, causing damage and building scar tissue in the liver [56]. In this study, HFD resulted in blunted, obtuse, and rounded lobe tips, indicating hepatomegaly and hepatic steatosis with the pale color of the liver and alteration of liver enzyme activities. ALT and AST activities were significantly higher in the HFD group than in the control group at 3 and 6 weeks, respectively. Surprisingly, the AST/ALT ratio in the HFD group was significantly higher than that in the control group. This biochemical change is a diagnostic marker for alcoholic fatty liver disease in the medical population [57]. As fibrosis progresses in the liver, ALT activity commonly decreases and AST to ALT gradually increases due to ALT production decrease [58]. We observed fibrosis in the liver at 3, 6, and 9 weeks. In addition, the half‐life of ALT in rabbits is about 5 h, which is relatively very short compared with other species, about 50 h for dogs or humans, or about 25 h for mice [59]. Therefore, the transient increase of ALT at 3 weeks was due to liver fibrosis and its short life.
Steatosis was observed within 3 weeks, with microvacuoles detected in hepatocytes. The presence of microvacuoles in HFD‐induced steatosis in rabbits indicates reactive oxygen species (ROS) stress, which can affect lipid metabolism in the mitochondria [60, 61]. An HFD can induce liver injury and insulin resistance by oxidative stress, and increased ROS level may cause lipid peroxidation and subsequent inflammatory response, leading to fibrogenesis, followed by activation of stellate cells [62].
We observed comprehensive changes in the entire body system induced by high lipid profile levels. First, the hematologic evaluation showed a decrease in RBC and hemoglobin concentrations, an increase in platelet concentration over 9 weeks, and an increase in white blood cells (WBCs), monocytes, and lymphocytes up to 6 weeks in rabbits fed HFD. These results are highly similar to those of previous studies [23, 63]. Studies have reported that an HFD induces the production of oxygen species, increasing the auto‐oxidation rate of hemoglobin, which promotes the conversion of HbO2 to methemoglobin. This conversion leads to a decrease in RBC and hemoglobin concentrations, and oxidative stress can cause hemolytic anemia in a high‐cholesterol diet [64]. The increase in platelets in the blood after HFD consumption can be affected by atherosclerosis pathogenesis [63, 65]. Changes in the microenvironment, such as hyperlipidemia, can induce endothelial damage, increasing adhesion molecules, such as intercellular adhesion molecule‐1, vascular cell adhesion molecule‐1, and P‐selectin, and adhesion proteins, such as von Willebrand factor (vWF) and fibrin, thereby activating the adhesion of platelets to the damaged site [65].
Furthermore, we observed functional and pathological changes in the cardiovascular system. Atherosclerotic plaques and inflammatory cell infiltration in the aorta can decrease blood flow velocity [43]. Therefore, we observed dynamic blood flow changes using echocardiography to calculate EF% and FS%. Echocardiography is a noninvasive method for measuring cardiac function with gentle restraint or light anesthesia, which does not affect cardiac function [66]. EF and FS are commonly used parameters to evaluate contractility as they are related to the end‐diastolic volume and are influenced by changes in afterload. Because cardiac output is the main parameter determining total oxygen delivery to the tissues, FS and EF values can indicate alterations in the blood delivery system in the body [67]. In the present study, we demonstrated that HFD‐induced atherosclerosis resulted in decreased cardiac contractility, consistent with the findings of many previous studies [2, 68].
A decrease in EF of 50% or more is required to be diagnosed as cardiac dysfunction [69]. However, the reduction of about 12% in this study is relatively small. In addition, it is difficult to define heart failure because there were no clinical symptoms such as dyspnea, fatigue, and edema due to cardiac dysfunction. However, the EF and FS values of the HFD group continued to decrease on average during the experiment period, and in the 9th week, the last week of the experiment, they decreased significantly compared with the control group. Therefore, the EF value may be reduced to less than 50%, which can be diagnosed as heart abnormality with long‐term HFD. Also, there was no difference in blood pressure between the two groups in this study. EF reduction at week 9 and confirmation of atherosclerosis may predict further EF reduction and hypertension in the future.
Creatinine is a nonprotein nitrogenous substance produced by muscle metabolism in which creatine in the muscle is converted into creatinine. Urea is the primary serum metabolite derived from the breakdown of dietary protein by the liver, and the BUN level indicates the concentration of urea nitrogen in the blood [70]. Our data showed that creatinine levels significantly increased with glomerulosclerosis and lipid accumulation in the kidney in the HFD group, consistent with multiple previous studies [71, 72, 73]. Glomerulosclerosis is a histologic lesion in which scar tissue and thickness of the glomerular basement membrane develop on the glomeruli, causing them to lose function. The pathological lesion might increase the creatinine level in the blood through anatomic‐physiologic dysfunction of creatinine excretion from the renal tubule. No difference was observed in the BUN levels in both groups. Although creatinine and BUN levels are key factors in determining renal function, creatinine level is a more important factor than BUN level because BUN is affected by extrarenal factors [74]. BUN may increase gastrointestinal bleeding, dehydration, and catabolic states and decrease severe liver failure by impaired conversion of ammonia to urea in the liver [75]. Therefore, creatinine is considered a specific indicator of renal glomerular filtration rate [74].
HFD aggravates pancreatic injury in animal models because dietary fat is a highly stimulating factor for pancreatic secretion. A previous study demonstrated that an HFD induces hyperlipidemia with changes in pancreatic endocrine and exocrine functions. In addition, relationships between HFD‐induced hyperlipidemia and oxidative stress, followed by microcirculation, are well‐established.
Our study revealed that HFD induced substantial cytomorphologic changes in the pancreas, although the glucose levels did not differ between HFD and control groups. Pancreatic β‐cell islet vacuolation was observed in the HFD group at 3, 6, and 9 weeks through β‐cell autophagy, which integrates processes in the regulation of cell growth, development, and homeostasis, where it helps to maintain a balance between biogenesis and cellular component degradation [76]. HFD can stimulate the autophagy of β‐cells, whereas β‐cell dysfunction induced glucose intolerance in autophagy‐deficient mutant animals [76]. Therefore, we determined that the cytomorphological changes in β‐cell islet vacuolation in the pancreas with normal glucose levels in our study were normal responses to protect the body. However, lipid accumulation in the pancreas was observed in the HFD group at 9 weeks, suggesting that lipotoxicity should be considered in the future. Long‐term HFD exceeding the normal pancreatic autophagy capacity causes oxidative stress and microcirculatory blood flow disturbances in the pancreas, inducing fat accumulation with lipotoxicity and a cascade of pancreatic dysfunction, such as chronic nonalcoholic fatty pancreas disease [62].
Our study results revealed the adverse effects of HFD and demonstrated time‐dependent changes in many organs to predict disease development. However, the long‐term effects of HFD could not be predicted because more than 9 weeks of HFD could not be confirmed. Therefore, we need further study to confirm the changes in the whole body system by exposure to long‐term HFD.
Conclusions
Overall, our comprehensive investigation provides useful global reference data on the time‐dependent effects of HFD on the body. First, we observed hyperlipidemia, steatosis, and fibrogenesis with ALT activity elevation, β‐islet vacuolization, lipid accumulation and hypertrophy in the adrenal gland, and glomerulosclerosis and creatinine level elevation in the kidney at 3 weeks. Second, we recorded decreases in RBC and hemoglobin levels with increased platelet levels, atherosclerosis, hepatomegaly, and AST activity elevation at 6 weeks. Third, we detected a decrease in the contractility of the heart and lipid accumulation in the pancreas at 9 weeks. This is the first observation of lots of factors including blood parameter; including lipid and liver function enzyme, cardiodynamic, and pathological changes in multiple organs; including the liver, aorta, pancreas, adrenal gland, and kidney, over time after exposure to an HFD. These comprehensive results of multiple time‐dependent pathophysiological changes will contribute to the prediction of disease development by HFD and establish a rabbit model for the efficacy evaluation of new drugs associated with obesity.
Conflict of interest
The authors declare no conflict of interest.
Author contributions
WJ and TO conceived and designed the project. G‐HL wrote and edited the paper. G‐HL and HHY conducted animal studies and acquired data. K‐KK performed tissue slide preparation and pathology. G‐HL analyzed and interpreted the data.
Acknowledgements
This research was supported by the 2015 Korea Health Technology R&D Project, through the Korea Health Industry Development Institute (HI15C0001), funded by the Ministry of Health and Welfare, Republic of Korea.
Contributor Information
Woori Jo, Email: c2dar@kmedihub.re.kr.
Taeho Oh, Email: thoh@knu.ac.kr.
Data accessibility
The data presented in this study are available upon request from the corresponding author.
References
- 1. Arias‐Mutis OJ, Marrachelli VG, Ruiz‐Saurí A, Alberola A, Morales JM, Such‐Miquel L, Monleon D, Chorro FJ, Such L and Zarzoso M (2017) Development and characterization of an experimental model of diet‐induced metabolic syndrome in rabbit. PLoS ONE 12, e0178315. [DOI] [PMC free article] [PubMed] [Google Scholar]
- 2. Zheng S, Tan W, Li X, Li B, Gong B, Pyle WG, Wu J, Li L, Luo T and Zou Y (2021) Aged monkeys fed a high‐fat/high‐sugar diet recapitulate metabolic disorders and cardiac contractile dysfunction. J Cardiovasc Transl Res 14, 799–815. [DOI] [PubMed] [Google Scholar]
- 3. Han Q, Yeung SC, Ip MS and Mak JC (2018) Dysregulation of cardiac lipid parameters in high‐fat high‐cholesterol diet‐induced rat model. Lipids Health Dis 17, 1–10. [DOI] [PMC free article] [PubMed] [Google Scholar]
- 4. Birkner E, Kasperczyk S, Kasperczyk A, Zalejska‐Fiolka J, Zwirska‐Korczala K, Stawiarska‐Pieta B and Grucka‐Mamczar E (2005) Metabolic and antioxidative changes in liver steatosis induced by high‐fat, low‐carbohydrate diet in rabbits. J Physiol Pharmacol 56, 45–58. [PubMed] [Google Scholar]
- 5. Li W, Prakash R, Chawla D, Du W, Didion SP, Filosa JA, Zhang Q, Brann DW, Lima VV and Tostes RC (2013) Early effects of high‐fat diet on neurovascular function and focal ischemic brain injury. Am J Physiol Regul Integr Comp Physiol 304, R1001–R1008. [DOI] [PMC free article] [PubMed] [Google Scholar]
- 6. Zheng H, Zhang C, Yang W, Wang Y, Lin Y, Yang P, Yu Q, Fan J and Liu E (2009) Fat and cholesterol diet induced lipid metabolic disorders and insulin resistance in rabbit. Exp Clin Endocrinol Diabetes 117, 400–405. [DOI] [PubMed] [Google Scholar]
- 7. WHO (2021) Obesity and Overweight. World Health Organization, Geneva. [Google Scholar]
- 8. Foo O, Hiu S, Teare D, Syed AA and Razvi S (2021) A global country‐level analysis of the relationship between obesity and COVID‐19 cases and mortality. Diabetes Obes Metab 23, 2697–2706. [DOI] [PMC free article] [PubMed] [Google Scholar]
- 9. Chaput JP, Klingenberg L, Astrup A and Sjödin AM (2011) Modern sedentary activities promote overconsumption of food in our current obesogenic environment. Obes Rev 12, e12–e20. [DOI] [PubMed] [Google Scholar]
- 10. Yang R‐l, Li W, Shi Y‐H and Le G‐W (2008) Lipoic acid prevents high‐fat diet–induced dyslipidemia and oxidative stress: a microarray analysis. Nutrition 24, 582–588. [DOI] [PubMed] [Google Scholar]
- 11. Ogawa T, Fujii H, Yoshizato K and Kawada N (2010) A human‐type nonalcoholic steatohepatitis model with advanced fibrosis in rabbits. Am J Pathol 177, 153–165. [DOI] [PMC free article] [PubMed] [Google Scholar]
- 12. Knight A (2007) Systematic reviews of animal experiments demonstrate poor human clinical and toxicological utility. Altern Lab Anim 35, 641–659. [DOI] [PubMed] [Google Scholar]
- 13. Sundberg JP, Berndt A, Sundberg BA, Silva KA, Kennedy V, Bronson R, Yuan R, Paigen B, Harrison D and Schofield PN (2011) The mouse as a model for understanding chronic diseases of aging: the histopathologic basis of aging in inbred mice. Pathobiol Aging Age Relat Dis 1, 7179. [DOI] [PMC free article] [PubMed] [Google Scholar]
- 14. Flurkey K, Currer JM and Harrison D (2007) Mouse models in aging research. In The Mouse in Biomedical Research (Fox JG, Barthold SW, Davisson MT, Newcomer CE, Quimby FW and Smith AL, eds), pp. 637–672. Elsevier, New York. [Google Scholar]
- 15. Brandon‐Warner E, Schrum LW, Schmidt CM and McKillop IH (2012) Rodent models of alcoholic liver disease: of mice and men. Alcohol 46, 715–725. [DOI] [PMC free article] [PubMed] [Google Scholar]
- 16. Lewis JH (2013) Comparative Hemostasis in Vertebrates. Springer Science & Business Media, Berlin. [Google Scholar]
- 17. Zhang X‐j, Chinkes DL, Aarsland A, Herndon DN and Wolfe RR (2008) Lipid metabolism in diet‐induced obese rabbits is similar to that of obese humans. J Nutr 138, 515–518. [DOI] [PubMed] [Google Scholar]
- 18. Ning B, Wang X, Yu Y, Waqar AB, Yu Q, Koike T, Shiomi M, Liu E, Wang Y and Fan J (2015) High‐fructose and high‐fat diet‐induced insulin resistance enhances atherosclerosis in Watanabe heritable hyperlipidemic rabbits. Nutr Metab 12, 1–11. [DOI] [PMC free article] [PubMed] [Google Scholar]
- 19. Nerbonne JM and Kass RS (2005) Molecular physiology of cardiac repolarization. Physiol Rev 85, 1205–1253. [DOI] [PubMed] [Google Scholar]
- 20. Mohammadi K, Rouet‐Benzineb P, Laplace M and Crozatier B (1997) Protein kinase C activity and expression in rabbit left ventricular hypertrophy. J Mol Cell Cardiol 29, 1687–1694. [DOI] [PubMed] [Google Scholar]
- 21. Minatoguchi S, Takemura G, Chen X‐H, Wang N, Uno Y, Koda M, Arai M, Misao Y, Lu C and Suzuki K (2004) Acceleration of the healing process and myocardial regeneration may be important as a mechanism of improvement of cardiac function and remodeling by postinfarction granulocyte colony–stimulating factor treatment. Circulation 109, 2572–2580. [DOI] [PubMed] [Google Scholar]
- 22. Allessie MA, Bonke F and Schopman F (1977) Circus movement in rabbit atrial muscle as a mechanism of tachycardia. III. The “leading circle” concept: a new model of circus movement in cardiac tissue without the involvement of an anatomical obstacle. Circ Res 41, 9–18. [DOI] [PubMed] [Google Scholar]
- 23. Abdelhalim M and Moussa SA (2010) Biochemical changes of hemoglobin and osmotic fragility of red blood cells in high fat diet rabbits. Pak J Biol Sci 13, 73–77. [PubMed] [Google Scholar]
- 24. Zarzoso M, Mironov S, Guerrero‐Serna G, Willis BC and Pandit S (2014) Ventricular remodelling in rabbits with sustained high‐fat diet. Acta Physiol 211, 36–47. [DOI] [PubMed] [Google Scholar]
- 25. Sibouakaz D, Othmani‐Mecif K, Fernane A, Taghlit A and Benazzoug Y (2018) Biochemical and ultrastructural cardiac changes induced by high‐fat diet in female and male prepubertal rabbits. Anal Cell Pathol 2018, 6430696. [DOI] [PMC free article] [PubMed] [Google Scholar]
- 26. Shao J, Wang J, Li Y, Elzo MA, Tang T, Lai T, Ma Y, Gan M, Wang L and Jia X (2021) Growth, behavioural, serum biochemical and morphological changes in female rabbits fed high‐fat diet. J Anim Physiol Anim Nutr 105, 345–353. [DOI] [PubMed] [Google Scholar]
- 27. Hammond RA and Levine R (2010) The economic impact of obesity in the United States. Diabetes Metab Syndr Obes 3, 285–295. [DOI] [PMC free article] [PubMed] [Google Scholar]
- 28. Fan J‐G, Kim S‐U and Wong VW‐S (2017) New trends on obesity and NAFLD in Asia. J Hepatol 67, 862–873. [DOI] [PubMed] [Google Scholar]
- 29. Pineda E, Sanchez‐Romero LM, Brown M, Jaccard A, Jewell J, Galea G, Webber L and Breda J (2018) Forecasting future trends in obesity across Europe: the value of improving surveillance. Obes Facts 11, 360–371. [DOI] [PMC free article] [PubMed] [Google Scholar]
- 30. Lian C‐Y, Zhai Z‐Z, Li Z‐F and Wang L (2020) High fat diet‐triggered non‐alcoholic fatty liver disease: a review of proposed mechanisms. Chem Biol Interact 330, 109199. [DOI] [PubMed] [Google Scholar]
- 31. Ross R (1999) Atherosclerosis—an inflammatory disease. N Engl J Med 340, 115–126. [DOI] [PubMed] [Google Scholar]
- 32. Yaqoob P (2013) Role of lipids in human nutrition. In Handbook of Olive Oil (Aparicio R and Harwood J, eds), pp. 655–675. Springer, Berlin. [Google Scholar]
- 33. Liang S‐N, Xu K and Zhong H‐S (2015) Establishment of rabbit abdominal aortic atherosclerosis model by pancreatic elastase infiltration associated with high fat diet. Acta Cardiol Sin 31, 406–413. [DOI] [PMC free article] [PubMed] [Google Scholar]
- 34. Longo M, Crosignani A and Podda M (2001) Hyperlipidemia in chronic cholestatic liver disease. Curr Treat Options Gastroenterol 4, 111–114. [DOI] [PubMed] [Google Scholar]
- 35. Gelrud A and Whitcomb D (2019) Hypertriglyceridemia‐induced acute pancreatitis. UpToDate Inc, Waltham, MA. www.uptodate.com/contents/hypertriglyceridemia‐induced‐acute‐pancreatitison.20 [Google Scholar]
- 36. Sahadevan M and Kasiske BL (2002) Hyperlipidemia in kidney disease: causes and consequences. Curr Opin Nephrol Hypertens 11, 323–329. [DOI] [PubMed] [Google Scholar]
- 37. Prim CR, Baroncini LAV, Précoma LB, Caron PHL, Winter G, Poletti MODO and Précoma DB (2012) Effects of linseed consumption for a short period of time on lipid profile and atherosclerotic lesions in rabbits fed a hypercholesterolaemic diet. Br J Nutr 107, 660–664. [DOI] [PubMed] [Google Scholar]
- 38. Katz J, Chaushu G and Sharabi Y (2001) On the association between hypercholesterolemia, cardiovascular disease and severe periodontal disease. J Clin Periodontol 28, 865–868. [DOI] [PubMed] [Google Scholar]
- 39. Rone MB, Fan J and Papadopoulos V (2009) Cholesterol transport in steroid biosynthesis: role of protein–protein interactions and implications in disease states. Biochim Biophys Acta 1791, 646–658. [DOI] [PMC free article] [PubMed] [Google Scholar]
- 40. Goldstein JL and Brown MS (2009) The LDL receptor. Arterioscler Thromb Vasc Biol 29, 431–438. [DOI] [PMC free article] [PubMed] [Google Scholar]
- 41. Anderson RG, Brown MS and Goldstein JL (1977) Role of the coated endocytic vesicle in the uptake of receptor‐bound low density lipoprotein in human fibroblasts. Cell 10, 351–364. [DOI] [PubMed] [Google Scholar]
- 42. Stocker R and Keaney JF Jr (2004) Role of oxidative modifications in atherosclerosis. Physiol Rev 84, 1381–1478. [DOI] [PubMed] [Google Scholar]
- 43. Li X, Liu X, Zhang P, Feng C, Sun A, Kang H, Deng X and Fan Y (2017) Numerical simulation of haemodynamics and low‐density lipoprotein transport in the rabbit aorta and their correlation with atherosclerotic plaque thickness. J R Soc Interface 14, 20170140. [DOI] [PMC free article] [PubMed] [Google Scholar]
- 44. Barter P, Gotto AM, LaRosa JC, Maroni J, Szarek M, Grundy SM, Kastelein JJ, Bittner V and Fruchart J‐C (2007) HDL cholesterol, very low levels of LDL cholesterol, and cardiovascular events. N Engl J Med 357, 1301–1310. [DOI] [PubMed] [Google Scholar]
- 45. Barter P (2005) The role of HDL‐cholesterol in preventing atherosclerotic disease. Eur Heart J Suppl 7, F4–F8. [Google Scholar]
- 46. Gomaraschi M, Calabresi L and Franceschini G (2007) Endothelial Protection by High‐Density Lipoproteins, High‐Density Lipoproteins: From Basic Biology to Clinical Aspects. 375–398. [DOI] [PubMed]
- 47. Lemieux I, Lamarche B, Couillard C, Pascot A, Cantin B, Bergeron J, Dagenais GR and Després J‐P (2001) Total cholesterol/HDL cholesterol ratio vs LDL cholesterol/HDL cholesterol ratio as indices of ischemic heart disease risk in men: the Quebec cardiovascular study. Arch Intern Med 161, 2685–2692. [DOI] [PubMed] [Google Scholar]
- 48. White R, Giordano S and Datta G (2017) Role of HDL‐associated proteins and lipids in the regulation of inflammation. Adv Lipoprot Res 10, 67141. [Google Scholar]
- 49. Madsen CM, Varbo A and Nordestgaard BG (2017) Extreme high high‐density lipoprotein cholesterol is paradoxically associated with high mortality in men and women: two prospective cohort studies. Eur Heart J 38, 2478–2486. [DOI] [PubMed] [Google Scholar]
- 50. Trimarco V, Izzo R, Morisco C, Mone P, Virginia Manzi M, Falco A, Pacella D, Gallo P, Lembo M and Santulli G (2022) High HDL (high‐density lipoprotein) cholesterol increases cardiovascular risk in hypertensive patients. Hypertension 79, 2355–2363. [DOI] [PMC free article] [PubMed] [Google Scholar]
- 51. Rosenson RS, Brewer HB, Ansell BJ, Barter P, Chapman MJ, Heinecke JW, Kontush A, Tall AR and Webb NR (2016) Dysfunctional HDL and atherosclerotic cardiovascular disease. Nat Rev Cardiol 13, 48–60. [DOI] [PMC free article] [PubMed] [Google Scholar]
- 52. Takaeko Y, Matsui S, Kajikawa M, Maruhashi T, Kishimoto S, Hashimoto H, Kihara Y, Hida E, Chayama K and Goto C (2019) Association of extremely high levels of high‐density lipoprotein cholesterol with endothelial dysfunction in men. J Clin Lipidol 13, 664–672.e1. [DOI] [PubMed] [Google Scholar]
- 53. Navab M, Anantharamaiah G and Fogelman AM (2005) The role of high‐density lipoprotein in inflammation. Trends Cardiovasc Med 15, 158–161. [DOI] [PubMed] [Google Scholar]
- 54. Martinez M, Vaya A, Gil L, Martí R, Dalmau J and Aznar J (1998) The cholesterol/phospholipid ratio of the erythrocyte membrane in children with familial hypercholesterolemia. Its relationship with plasma lipids and red blood cell aggregability. Clin Hemorheol Microcirc 18, 259–263. [PubMed] [Google Scholar]
- 55. Kanakaraj P and Singh M (1989) Influence of hypercholesterolemia on morphological and rheological characteristics of erythrocytes. Atherosclerosis 76, 209–218. [DOI] [PubMed] [Google Scholar]
- 56. Zarei L, Farhad N and Abbasi A (2022) All‐trans retinoic acid (atRA) effectively improves liver steatosis in a rabbit model of high fat induced liver steatosis. Arch Physiol Biochem 128, 1010–1015. [DOI] [PubMed] [Google Scholar]
- 57. Nyblom H, Berggren U, Balldin J and Olsson R (2004) High AST/ALT ratio may indicate advanced alcoholic liver disease rather than heavy drinking. Alcohol Alcohol 39, 336–339. [DOI] [PubMed] [Google Scholar]
- 58. Park SH (2011) Implication of liver enzymes in viral and alcoholic liver diseases. Korean J Hepatol 17, 237–242. [Google Scholar]
- 59. York MJ (2017) Clinical pathology. In A Comprehensive Guide to Toxicology in Nonclinical Drug Development (Faqi AS, ed.), pp. 325–374. Elsevier, Amsterdam. [Google Scholar]
- 60. Bedossa P (2017) Pathology of non‐alcoholic fatty liver disease. Liver Int 37, 85–89. [DOI] [PubMed] [Google Scholar]
- 61. Koo S‐H (2013) Nonalcoholic fatty liver disease: molecular mechanisms for the hepatic steatosis. Clin Mol Hepatol 19, 210–215. [DOI] [PMC free article] [PubMed] [Google Scholar]
- 62. Yan M‐X, Li Y‐Q, Meng M, Ren H‐B and Kou Y (2006) Long‐term high‐fat diet induces pancreatic injuries via pancreatic microcirculatory disturbances and oxidative stress in rats with hyperlipidemia. Biochem Biophys Res Commun 347, 192–199. [DOI] [PubMed] [Google Scholar]
- 63. Mohamed AKA (2010) The potential influence of high cholesterol diet‐induced oxidative stress on composition and properties of red blood cells in rabbits. Afr J Microbiol Res 4, 836–843. [Google Scholar]
- 64. Balkan J, Öztezcan S, Aykaç‐Toker G and Uysal M (2002) Effects of added dietary taurine on erythrocyte lipids and oxidative stress in rabbits fed a high cholesterol diet. Biosci Biotechnol Biochem 66, 2701–2705. [DOI] [PubMed] [Google Scholar]
- 65. Wang L and Tang C (2020) Targeting platelet in atherosclerosis plaque formation: current knowledge and future perspectives. Int J Mol Sci 21, 9760. [DOI] [PMC free article] [PubMed] [Google Scholar]
- 66. Hanton G, Eder V, Rochefort G, Bonnet P and Hyvelin J‐M (2008) Echocardiography, a non‐invasive method for the assessment of cardiac function and morphology in preclinical drug toxicology and safety pharmacology. Expert Opin Drug Metab Toxicol 4, 681–696. [DOI] [PubMed] [Google Scholar]
- 67. Tissot C, Singh Y and Sekarski N (2018) Echocardiographic evaluation of ventricular function—for the neonatologist and pediatric intensivist. Front Pediatr 6, 79. [DOI] [PMC free article] [PubMed] [Google Scholar]
- 68. Berthiaume JM, Bray MS, McElfresh TA, Chen X, Azam S, Young ME, Hoit BD and Chandler MP (2010) The myocardial contractile response to physiological stress improves with high saturated fat feeding in heart failure. Am J Physiol Heart Circ Physiol 299, H410–H421. [DOI] [PMC free article] [PubMed] [Google Scholar]
- 69. Paulus WJ, Tschöpe C, Sanderson JE, Rusconi C, Flachskampf FA, Rademakers FE, Marino P, Smiseth OA, De Keulenaer G and Leite‐Moreira AF (2007) How to diagnose diastolic heart failure: a consensus statement on the diagnosis of heart failure with normal left ventricular ejection fraction by the heart failure and echocardiography associations of the European Society of Cardiology. Eur Heart J 28, 2539–2550. [DOI] [PubMed] [Google Scholar]
- 70. Feher JJ (2017) Quantitative Human Physiology: An Introduction. Academic Press, Cambridge, MA. [Google Scholar]
- 71. Liu Y, Wang Z, Yin W, Li Q, Cai M, Zhang C, Xiao J, Hou H, Li H and Zu X (2007) Severe insulin resistance and moderate glomerulosclerosis in a minipig model induced by high‐fat/high‐sucrose/high‐cholesterol diet. Exp Anim 56, 11–20. [DOI] [PubMed] [Google Scholar]
- 72. Popov D, Simionescu M and Shepherd P (2003) Saturated‐fat diet induces moderate diabetes and severe glomerulosclerosis in hamsters. Diabetologia 46, 1408–1418. [DOI] [PubMed] [Google Scholar]
- 73. Jiang T, Wang Z, Proctor G, Moskowitz S, Liebman SE, Rogers T, Lucia MS, Li J and Levi M (2005) Diet‐induced obesity in C57BL/6J mice causes increased renal lipid accumulation and glomerulosclerosis via a sterol regulatory element‐binding protein‐1c‐dependent pathway. J Biol Chem 280, 32317–32325. [DOI] [PubMed] [Google Scholar]
- 74. Gounden V, Bhatt H and Jialal I (2018) Renal Function Tests. StatPearls Publishing, Treasure Island, FL. [PubMed] [Google Scholar]
- 75. Constable PD, Hinchcliff KW, Done SH and Grünberg W (2016) Veterinary Medicine: A Textbook of the Diseases of Cattle, Horses, Sheep, Pigs and Goats. Elsevier Health Sciences, Amsterdam. [Google Scholar]
- 76. Ebato C, Uchida T, Arakawa M, Komatsu M, Ueno T, Komiya K, Azuma K, Hirose T, Tanaka K and Kominami E (2008) Autophagy is important in islet homeostasis and compensatory increase of beta cell mass in response to high‐fat diet. Cell Metab 8, 325–332. [DOI] [PubMed] [Google Scholar]
Associated Data
This section collects any data citations, data availability statements, or supplementary materials included in this article.
Data Availability Statement
The data presented in this study are available upon request from the corresponding author.