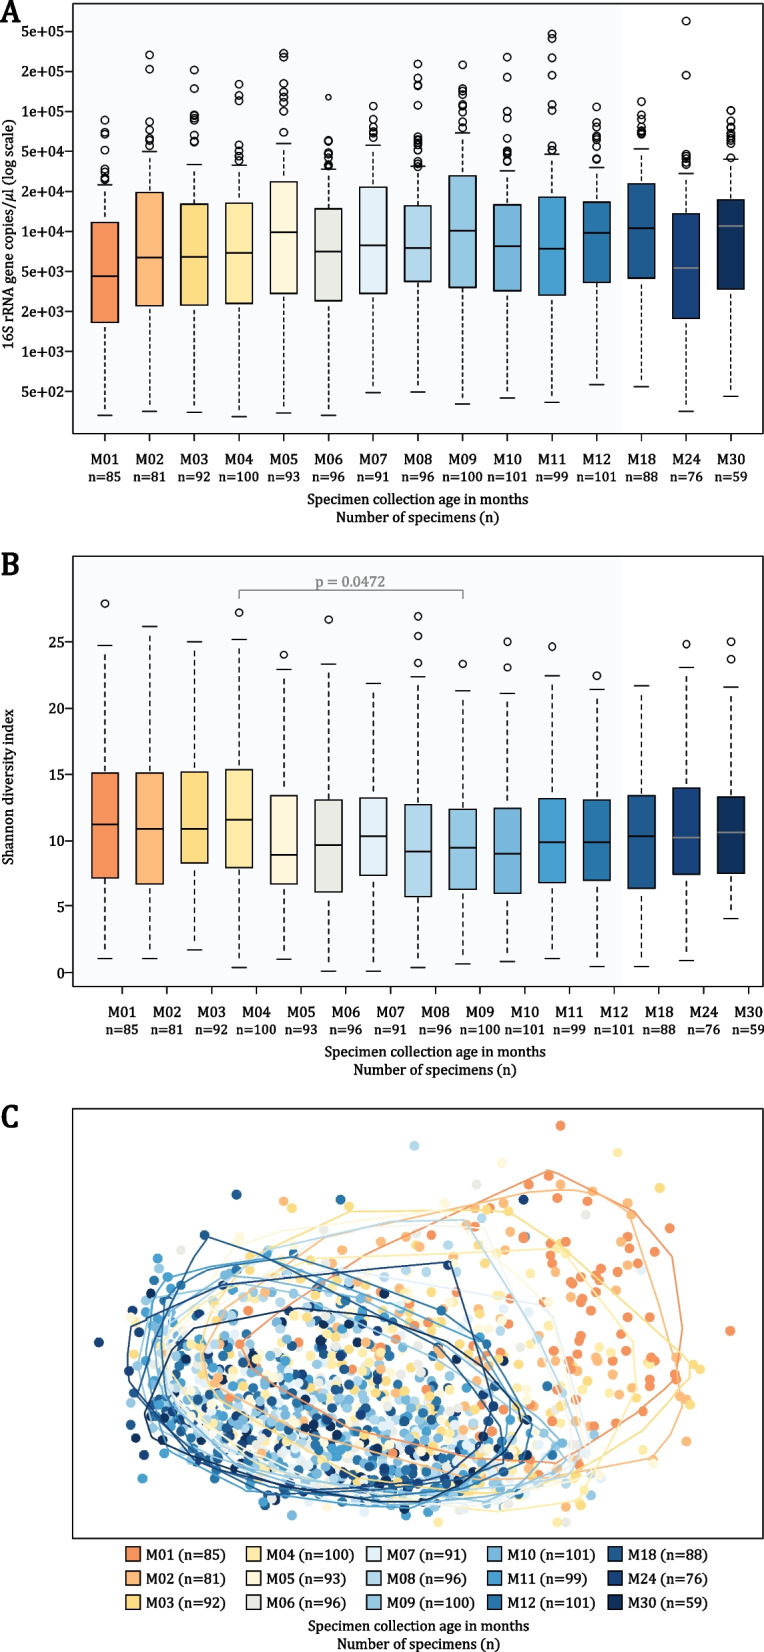
Fig. 2.

Bacterial density and diversity measured during the first 30 months of life. A Bacterial density (16S rRNA gene copies/μl) compared across timepoints. B Within-specimen bacterial diversity (Shannon diversity) compared across timepoints. One-way analysis of variance (ANOVA) was used to compare alpha diversity indices between timepoints. Tukey’s Honest Significant Difference test was implemented to compare each pair of timepoints simultaneously pairwise. Median values are presented by horizontal lines within each of the boxplots while upper and lower ranges of the boxplots represent the 75% and 25% quartiles, respectively. Maximum and minimum values, excluding outliers, are presented by whiskers. C Principal coordinate analysis of between-specimen bacterial diversity (Aitchison distance). Alpha bags (90%) are used to enclose observations from each of the timepoints, excluding the 10% of the observations at the extremes of each cluster. Specimen collection age (in months) and the number of specimens included at each timepoint are shown at the bottom of each panel
