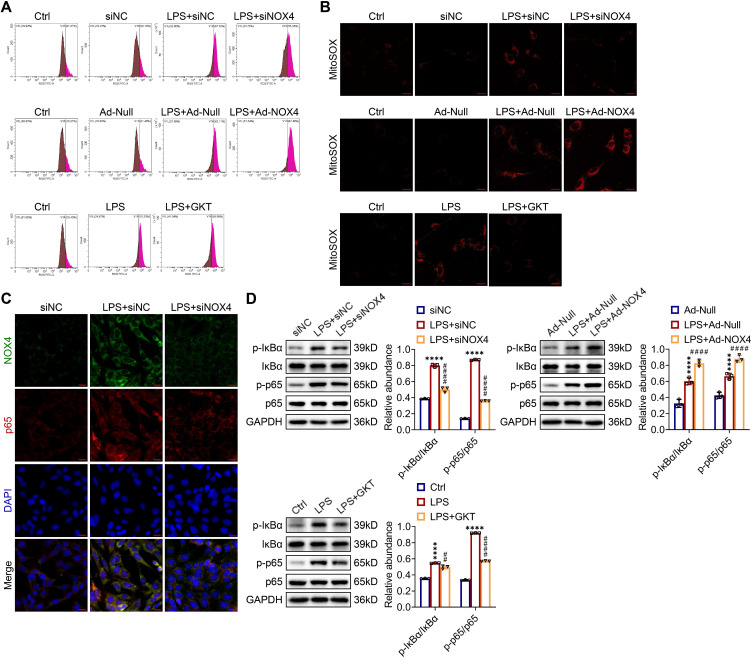
Figure 9.
NOX4 expression modulated ROS production and NF-κB p65 signaling activation in LPS-stimulated TCMK-1 cells. (A) ROS levels in TCMK-1 cells were determined by flow cytometry. (B) Representative confocal images of MitoSOX staining in TCMK-1 cells (×630, scale bars = 20 μm). (C) Representative micrographs of double immunofluorescence staining of NOX4 (green) and p65 (red) in TCMK-1 cells (×400, scale bars = 20 μm). (D) The protein expression levels of p-IκBα, IκBα, p-p65 and p65 in TCMK-1 cells were analyzed by western blot analysis and quantified by densitometry. Data are represented as the mean ± SD, n = 3. ****P < 0.0001 for LPS + siNC vs siNC, LPS + Ad-Null vs Ad-Null, or LPS vs Ctrl; ##P < 0.01, ####P < 0.0001 for LPS + siNOX4 vs LPS + siNC, LPS + Ad-NOX4 vs LPS + Ad-Null, or LPS + GKT vs LPS.

