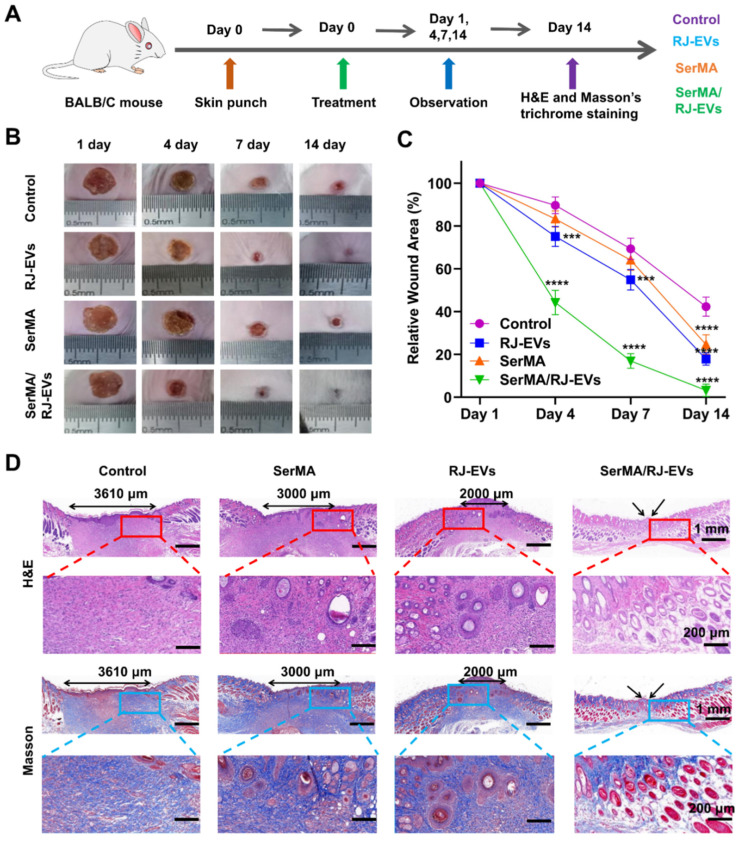
Figure 6.
Healing process and histological evaluation of the SerMA/RJ-EVs in the mouse full-thickness wound model. (A) Schematically illustrated construction of the treatment procedure. (B) Representative images of the wound surface in four treated groups at day 1, 4, 7, and 14 post-treatment. (C) Relative wound area at different time points of four group. (D) Representative H&E and Masson staining images of different wound samples at day 14. Red and bule border image at the bottom of the panel is a partial enlargement of the image above. All data were presented as mean ± SD (n = 5). *** for P < 0.001, and **** for P < 0.0001.

