Abstract
The human cerebral cortex undergoes dramatic and critical development during early postnatal stages. Benefiting from advances in neuroimaging, many infant brain magnetic resonance imaging (MRI) datasets have been collected from multiple imaging sites with different scanners and imaging protocols for investigation of normal and abnormal early brain development. However, it is extremely challenging to precisely process and quantify infant brain development with these multi-site imaging data, because infant brain MRIs: a) exhibit extremely low and dynamic tissue contrast caused by ongoing myelination and maturation, and b) suffer from large inter-site data heterogeneity caused by diverse imaging protocols/scanners across sites. Consequently, existing computational tools and pipelines typically perform poorly on infant MRI data. To address these challenges, we propose a robust, multi-site-applicable, infant-tailored computational pipeline that leverages powerful deep learning techniques. The main functionality of the proposed pipeline includes preprocessing, brain skull stripping, tissue segmentation, topology correction, cortical surface reconstruction, and measurement. Our pipeline can well handle both T1w and T2w structural infant brain MR images in a wide age range (from birth to 6 years of age) and is effective for different imaging protocols/scanners, despite being trained only on the data from the Baby Connectome Project. Extensive comparisons with existing methods on multi-site, multimodal, and multi-age datasets demonstrate superior effectiveness, accuracy, and robustness of our pipeline. We have maintained a website iBEAT Cloud1 for users to process their images with our pipeline, which has successfully processed 16,000+ infant MRI scans from 100+ institutions with various imaging protocols/scanners.
Keywords: Infant brain MRI, tissue segmentation, cortical surface reconstruction, cortex measurement
1. Introduction
The human brain undergoes dynamic growth and expansion during the early postnatal years (Garcia et al., 2018; Gilmore et al., 2018; Li et al., 2014, 2019; Lyall et al., 2015; F. Wang et al., 2019). During this stage, elementary but critical cognitive skills, e.g., visual perception, motion control, expressive and receptive language, and early composite learning abilities, develop rapidly along with brain maturation (Shaw et al., 2006). Benefiting from advances in pediatric neuroimaging techniques, many large-scale infant brain magnetic resonance image (MRI) datasets (Howell et al., 2019; Makropoulos et al., 2018) have been collected from multiple institutes with different imaging protocols and scanners, which provides an unprecedented opportunity to investigate dynamic and critical early brain development in vivo.
The human brain structure is extremely complex, especially for the cerebral cortex, which is highly convoluted with huge variability across individuals. Cortical surface-based analysis, which explicitly reconstructs topologically correct and geometrically accurate surface representations of the highly-folded, thin cerebral cortex, is the preferred approach for precisely measuring, integrating, and mapping brain structural, functional, and connectivity information from MRI. This is because surface-based analysis respects the topological and geodesic properties of the cortex, facilitates accurate alignment, parcellation, and visualization of the highly-folded cortical regions, and enables precise measurement of multiple biologically distinct cortical properties. Thus, cortical surface-based analysis has several advantages that make it ideally suited for revealing the dynamic and complex neurobiological changes during early brain development.
Previously, several computational pipelines for cortical surface reconstruction have been proposed, for example, a) the FreeSurfer pipeline (Dale et al., 1999; Fischl et al., 1999), which is highly effective for adult brain MR image computation; b) the ABCD image processing pipeline (Hagler et al., 2019), which is focused on the adolescent brain (from 9 to 17 years of age); c) the HCP pipeline (Glasser et al., 2013), which is focused on the young adult brain and relies on FreeSurfer for cortical surface reconstruction; and d) the dHCP image processing pipeline (Makropoulos et al., 2018), which is used for handling neonatal brains. However, unlike brain images for the above-mentioned age groups, infant brain images have specialized characteristics that introduce unique challenges in image processing. First, due to the rapid tissue maturation and undergoing myelination process in the infant brain, the appearance of the images varies dramatically with strong age-dependency in the first postnatal year, and the corresponding tissue contrast is very low. Fig. 1 shows typical T1w and T2w images after intensity inhomogeneity correction and their intensity histograms for different tissue types at different ages from the same subject with the same imaging protocol. The white matter exhibits higher changes in both the T1w and T2w images during the early brain development. As can be seen in the T1w images, at the age of 1 month, white matter exhibits lower intensity values than gray matter does. From 3 to 9 months of age, the gray matter and white matter have very similar intensity ranges. After 9 months, the white matter exhibits higher intensity values than gray matter does. Second, available infant images are typically acquired with different scanners and imaging protocols at different imaging sites, which leads to extremely heterogeneous imaging appearance across datasets, thus posing a significant challenge to image processing, especially for tissue segmentation. For example, Fig. 2 shows three 6-month infant images (acquired with different scanners and different imaging protocols). As reported in our organized MICCAI grand challenge on 6-month infant brain MRI segmentation for multi-site data (iSeg-2019, http://iseg2019.web.unc.edu) (Y. Sun et al., 2021), the trained deep learning models based on a specific-site dataset generally perform well for testing subjects from the same site but poorly for testing subjects from other sites with different imaging protocols/scanners due to domain differences, which is known as the “multi-site issue”. In addition, due to subject-specific dynamic development, inter-individual variations in size, shape, and cortex folding of the infant brain are much larger than those for brains from other age groups. Consequently, conventional pipelines, which generally assume consistent imaging appearance, high tissue contrast, and less variable brain size, are not suitable for the challenging complexities of infant brain imaging. Therefore, an infant dedicated pipeline is critically needed to handle the challenges of extremely low tissue contrast, dynamic appearance and shape, and inter-site heterogeneity.
Fig. 1.
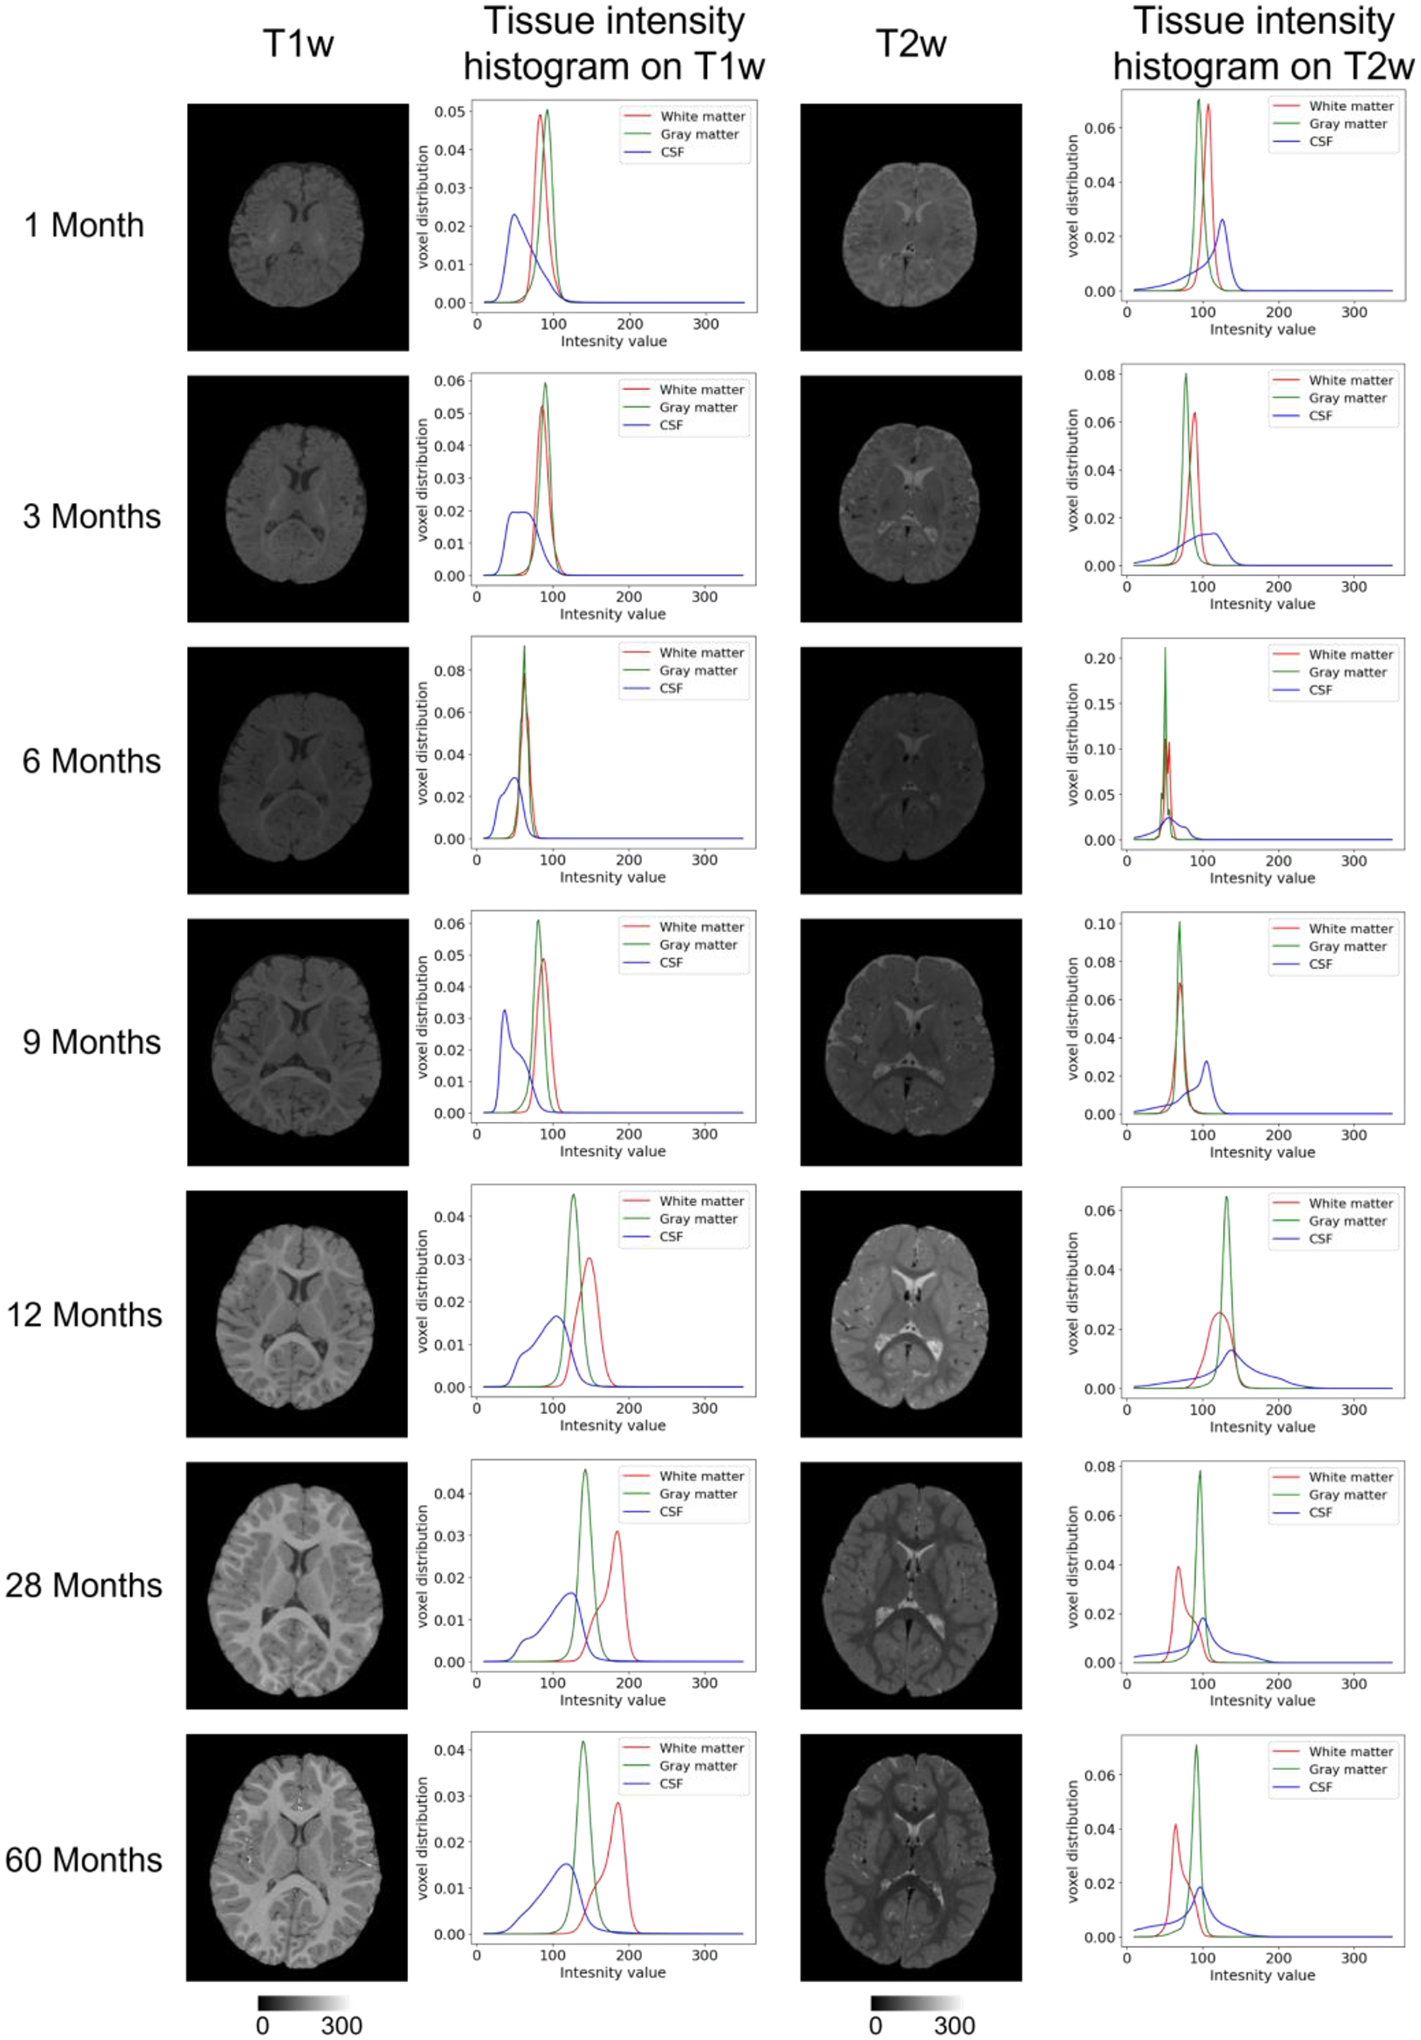
Typical T1w and T2w infant brain MR images (from different subjects) after intensity inhomogeneity correction and their intensity histograms for different brain tissues at different ages.
Fig. 2.
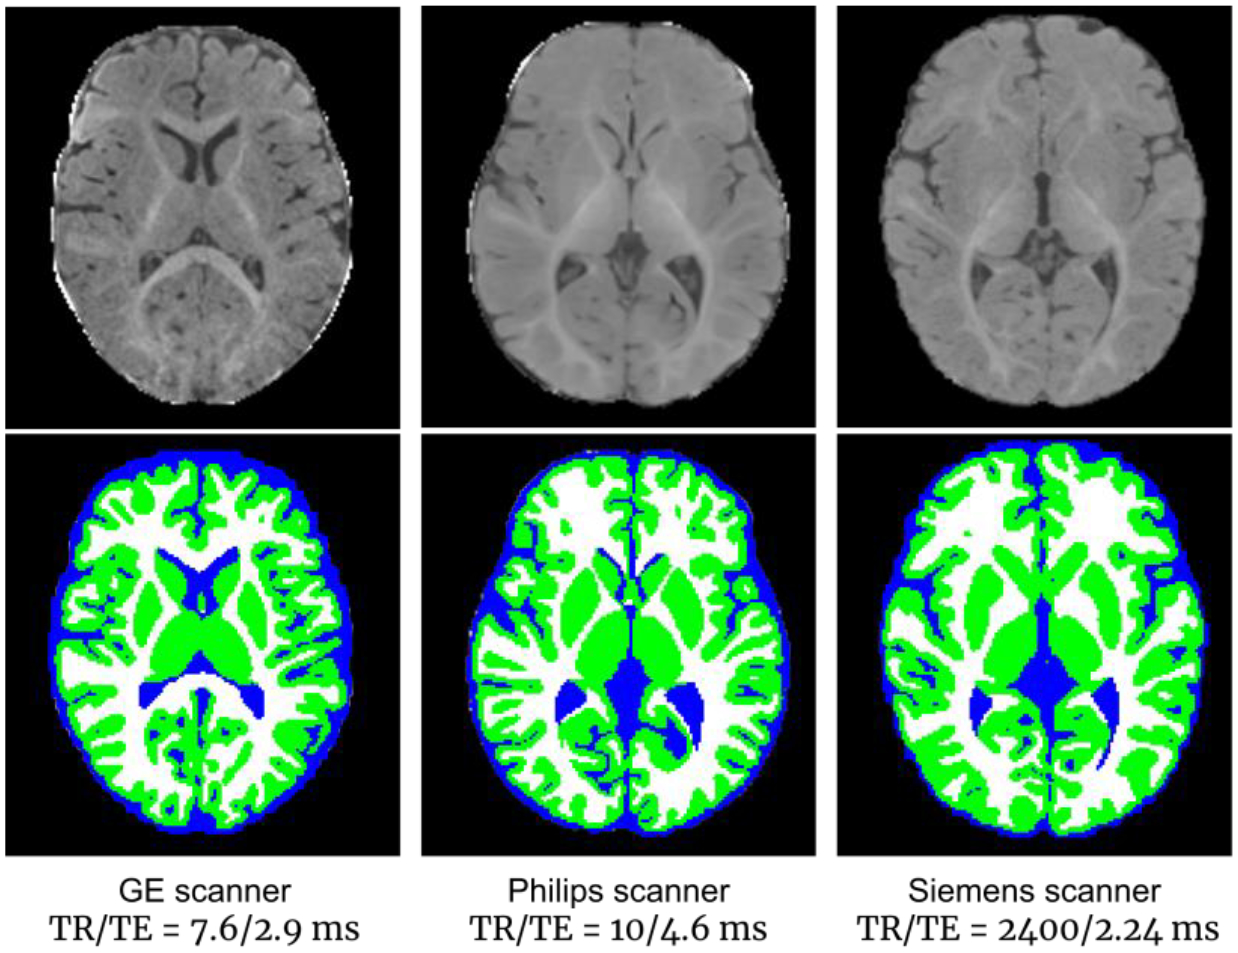
Three 6-month-old brain images acquired with different scanners and imaging protocols, showing highly variable appearance patterns (upper row), with tissue segmentation maps by iBEAT V2.0 (lower row).
In 2012, we released the Infant Brain Extraction and Analysis Toolbox (iBEAT) dedicated for processing and analyzing infant brain MRIs in NITRC (https://www.nitrc.org/projects/ibeat/), which has been widely used in the research community (6,000+ downloads). However, it suffers from several limitations, including a) the unsatisfactory generalizability for images acquired by different protocols and scanners; b) lack of cortical surface-based analysis tools; and c) requirement of the pre-installation of the commercial software MATLAB. To address these issues, we redesigned and developed this iBEAT V2.0 pipeline. There are 3 major improvements. 1) The image segmentation model is completely redesigned. We have leveraged the cutting-edge deep learning method to address the extremely challenging tissue segmentation problem for the infant brain, which significantly improves the accuracy and further extends the functionality of iBEAT; 2) The cortical surface reconstruction and measurement computation components are incorporated into the pipeline to better serve the community for brain cortical surface analysis; 3) The iBEAT V2.0 no longer needs the commercial software MATLAB, which is a substantial barrier for many users and can introduce many incompatible issues between different versions. Meanwhile, we have maintained a cloud server (www.ibeat.cloud) for image processing for users without sufficient computational resources, and also a local software package as a Docker container (https://hub.docker.com/repository/docker/zhwwu/ibeat200).
Fig. 3 illustrates the overall flowchart of iBEAT V2.0, which takes structural T1w and/or T2w infant brain MR images as input and includes two major components: image segmentation and cortical surface reconstruction. For the image segmentation component, iBEAT V2.0 removes the brain skull and cerebellum and then segments the cerebrum into three tissue types, i.e., gray matter, white matter, and cerebrospinal fluid (CSF). To efficiently address the distinct MRI appearance patterns at different ages of the brain, we have trained multiple age-dependent brain tissue segmentation models instead of training a single network model. For the cortical surface reconstruction component, using accurately segmented tissues, iBEAT V2.0 reconstructs topologically correct and geometrically accurate cortical surfaces, including the inner surface (the interface between white matter and cortical gray matter), the outer/pial surface (the interface between cortical gray matter and CSF), as well as the middle surface (the geometric center of the inner and outer surfaces). With the reconstructed cortical surfaces, iBEAT V2.0 then computes multiple biologically meaningful cortical measurements for brain development quantification, including the cortical thickness, cortical surface area, mean curvature, sulcal depth, gyrification index, myelin content, etc. It is worth noting that, to maximally avoid any unnecessary image interpolation during computation, the tissue segmentation map and the reconstructed cortical surfaces are obtained in the individual native space, which can then be easily aligned to any standard space for further analysis.
Fig. 3.
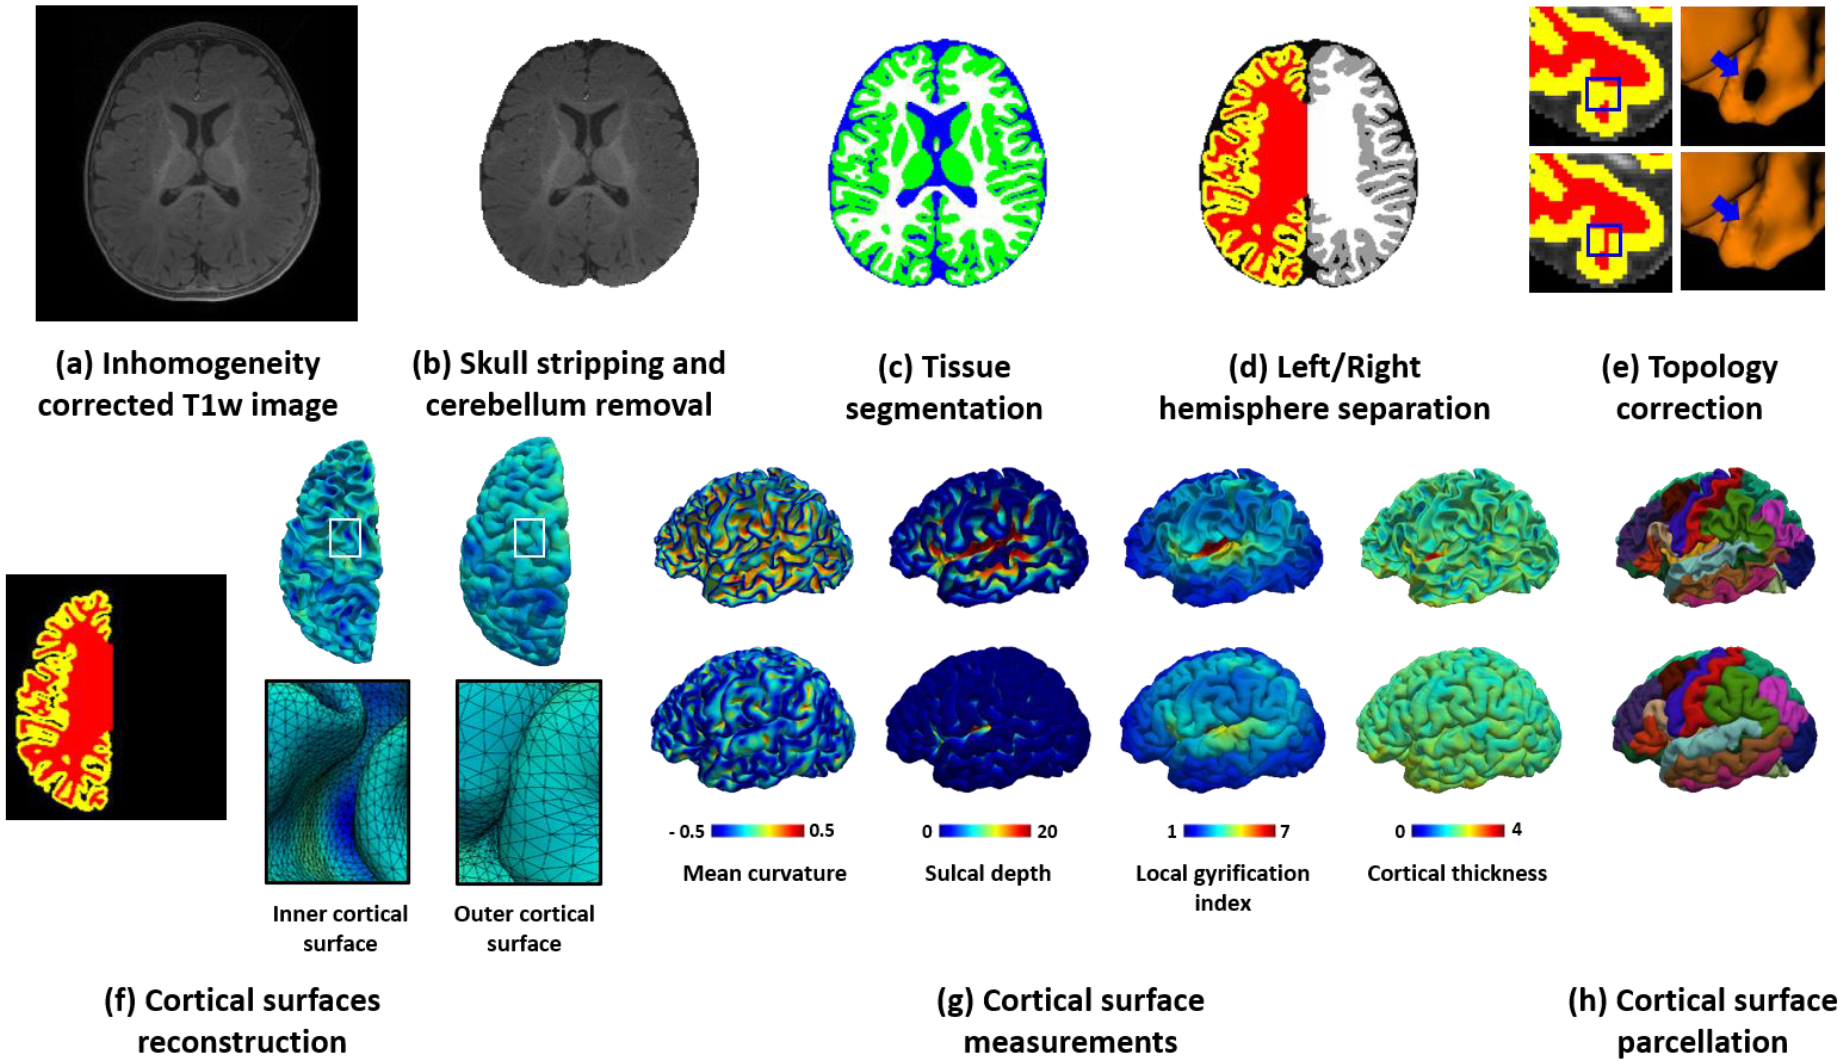
The framework of the iBEAT V2.0 computational pipeline. The framework includes an image segmentation component: (a) Input inhomogeneity-corrected T1w image (also applicable to T2w images, or both), (b) T1w image after skull stripping and cerebellum removal, and (c) Tissue segmentation map, with green indicating gray matter, white indicating white matter, and blue indicating cerebrospinal fluid; and a cortical surface reconstruction component: (d) Left/right hemisphere separation and filling of the noncortical regions with white matter, (e) Topology correction of white matter volume, (f) Reconstructed inner and outer cortical surfaces represented by triangular meshes, (g) Color-coded derived representative cortical properties, e.g., mean curvature, sulcal depth, local gyrification index, and cortical thickness, and (h) Parcellated cortical surfaces based on Desikan scheme.
We have extensively validated our pipeline with more than 16,000+ infant MRI scans in different age groups from 100+ institutions and imaging centers. These large-scale multi-site, multi-age, and multimodal infant brain MRI datasets have demonstrated that our pipeline is highly effective and robust. Our pipeline has been adopted in many infant neuroimaging studies, resulting in high-impact publications (Ellis et al., 2021; Grotheer et al., 2022; Hu et al., 2022; Jiang et al., 2022; Na et al., 2021; Natu et al., 2021; Y. Wang et al., 2022). For example, the reconstructed cortical surfaces were used to study the retinotopic organization of the visual cortex in infants (Ellis et al., 2021) and functional connectome fingerprint during infancy (Hu et al., 2022). The computed cortical thickness and surface area were used to investigate the relationships between maternal obesity during pregnancy and neonatal cortical development (Na et al., 2021) and the developmental abnormality of structural covariance networks in infants with autism (Y. Wang et al., 2022). The segmentation maps were used in the analysis of the infant cortex microstructural development (Natu et al., 2021) and the white matter myelination during infancy (Grotheer et al., 2022), The segmentation maps were also employed to accurately align the individual brains to the atlas for functional networks construction (Jiang et al., 2022).
2. Materials
To quantitatively validate our pipeline, we adopted 3 public datasets: 1) The BCP dataset (https://nda.nih.gov/edit_collection.html?id=2848), which includes typically-developing brains from term birth to 6 years of age; 2) The dHCP dataset (http://www.developingconnectome.org/data-release/second-data-release/), which includes preterm and term-born neonatal brains; and 3) A multi-site multi-scanner 6-month dataset, MSMS6 (https://iseg2019.web.unc.edu/data/), which includes normal brain images acquired at about 6 months of age from different sites with 4 different scanners, manufactured by Siemens, GE, and Philips. Notably, among these 3 datasets, the dHCP dataset has released its processed results, which can be used as a reference to evaluate our pipeline. Furthermore, for the MSMS6 dataset, the brain tissues were manually labeled by experts, thus providing a reference for quantitatively evaluating the tissue segmentation performance.
The BCP dataset includes 623 longitudinal scans from 288 subjects (136 males/152 females) from term birth to 6 years of age. For each scan, both T1w and T2w images were collected with 3T Siemens Prisma MRI scanners using a 32 channel head coil. The T1w images were collected with parameters: TR/TE/TI=2400/2.24/1060 ms and flip angle=8°, with a spatial resolution of isotropic 0.8 mm. The T2w images were collected with parameters: TR/TE=3200/564 ms and flip angle=VAR, with a spatial resolution of isotropic 0.8 mm.
The dHCP dataset (the second data release) includes 558 longitudinal scans acquired from 505 (283 males/222 females) preterm and term born neonates from 29 to 45 weeks in post-menstrual age (Makropoulos et al., 2018). Among these scans, 492 have both T1w and T2w images, while the remaining scans have only T2w images. The T1w images were acquired using an IR (Inversion Recovery) TSE sequence, with TR/TE/TI = 4795/8.7/1740 ms and a resolution of 0.8×0.8×1.6 mm3. The T2w images were obtained using a Turbo Spin Echo (TSE) sequence to alleviate the motion effects, with TR/TE = 12000/156 ms and a resolution of 0.8× 0.8×1.6 mm3. In the released dataset, both T1w and T2w images were resampled to a resolution of isotropic 0.5 mm for the tissue segmentation and cortical surface reconstruction.
The MSMS6 (Multi-site multi-scanner subjects at 6 months) dataset includes 22 normal 6-month-old infant brain images, collected at different sites with 4 different scanners and different imaging protocols. For each brain, both T1w and T2w images were acquired. Based on their imaging protocols, these 22 scans can be partitioned into 4 groups: 1) six brains scanned with a Siemens PRISMA scanner, with T1w imaging parameters: TR/TE/TI=2400/2.24/1060 ms, flip angle=8°, resolution=0.8×0.8×0.8 mm3; and T2w imaging parameters: TR/TE=3200/564 ms, flip angle=VAR, resolution=0.8×0.8×0.8 mm3; 2) five brains scanned with a Siemens Trio scanner, with T1w imaging parameters: TR/TE/TI=2400/2.19/1000 ms, flip angle=8°, resolution=1×1×1 mm3; and T2w imaging parameters: TR/TE=3200/561 ms, flip angle=120°, resolution=1×1×1 mm3; 3) five brains scanned with a GE scanner, with T1w imaging parameters: TR/TE=7.6/2.9 ms, flip angle=11°, resolution=0.94×0.94×0.8 mm3; and T2w imaging parameters: TR/TE=2502/91.4 ms, flip angle=90°, resolution=1×1×0.8 mm3; 4) six brains scanned with a Phillips scanner, with T1w imaging parameters: TR/TE=10/4.6 ms, flip angle=8°, resolution=1×1×1 mm3; and T2w imaging parameters: TR/TE=2500/310 ms, flip angle=90°, resolution=1×1×1 mm3. For all images in this dataset, the gray matter, white matter, and CSF were manually labeled and cross-checked by 3 experienced experts and were used in MICCAI Grand Challenge on 6-month Infant Brain MRI Segmentation 2019.
For a concise comparison, we summarize the three datasets used for our pipeline evaluation in Table 1. It is worth noting that these 3 evaluation datasets include images from major scanner manufacturers, and the images were obtained with varying imaging parameters. Also, these 3 evaluation datasets cover pediatric brains with ages ranging from preterm birth to 6 years. Therefore, they enable a comprehensive examination of how our pipeline performs on different early developing brains with varying imaging protocols over a wide age range.
Table 1.
Summary of three datasets used in the pipeline evaluation.
| Dataset | Age | #Subjects | #Scans | T1w | T2w | Scanner |
|---|---|---|---|---|---|---|
| BCP | 0 – 6 years | 288 (136 males, 152 females) | 623 | MPRAGE | TSE | Siemens PRISMA |
| TR: 2400 ms | TR: 3200 ms | |||||
| TE: 2.24 ms | TE: 564 ms | |||||
| TI: 1060 ms | n/a | |||||
| Flip angle: 8° | Flip angle: VAR | |||||
| 0.8 mm isotropic | 0.8 mm isotropic | |||||
| dHCP | 29 – 45 postmenstrual weeks | 505 (283 males, 222 females) | 558 | IR-TSE | TSE | Philips |
| TR: 4795 ms | TR: 12000 ms | |||||
| TE: 8.7 ms | TE: 156 ms | |||||
| TI: 1740 ms | TI: n/a | |||||
| 0.5 mm isotropic | 0.5 mm isotropic | |||||
| MSMS6 | About 6 months of age | 6 | 6 | MPRAGE | TSE | Siemens PRISMA |
| TR: 2400 ms | TR: 3200 ms | |||||
| TE: 2.24 ms | TE: 564 ms | |||||
| TI: 1060 ms | TI: n/a | |||||
| Flip angle: 8° | Flip angle: VAR | |||||
| 0.8 mm isotropic | 0.8 mm isotropic | |||||
| 5 | 5 | MPRAGE | TSE | Siemens Trio | ||
| TR: 2400 ms | TR: 3200 ms | |||||
| TE: 2.19 ms | TE: 561 ms | |||||
| TI: 1000 ms | TI: n/a | |||||
| Flip angle: 8° | Flip angle: 120° | |||||
| 1 mm isotropic | 1 mm isotropic | |||||
| 5 | 5 | GR | SE | GE | ||
| TR: 7.6 ms | TR: 2502 ms | |||||
| TE: 2.9 ms | TE: 91.4 ms | |||||
| TI: n/a | TI: n/a | |||||
| Flip angle: 11° | Flip angle: 90° | |||||
| 0.94×0.94×0.8 mm3 | 1×1×0.8 mm3 | |||||
| 6 | 6 | GR | SE | Philips | ||
| TR: 10 ms | TR: 2500 ms | |||||
| TE: 4.6 ms | TE: 310 ms | |||||
| TI: n/a | TI: n/a | |||||
| Flip angle: 8° | Flip angle: 90° | |||||
| 1 mm isotropic | 1 mm isotropic |
3. Procedure
1). Preprocess the image (--Timing, 10 min).
(i) Reorient and resample the original 3D image into a consistent direction and resolution. First, according to the slicing strategy and head orientation, reorient the original 3D image so that: a) the first dimension of the volume corresponds to sagittal slices, which goes from left to right as the index increases; b) the second dimension corresponds to coronal slices, which goes from posterior to anterior as the index increases; c) the third dimension corresponds to transverse slices, which goes from inferior to superior as the index increases. Second, unify the resolution by resampling each image to be 0.8 mm isotropic for consistency with the image resolution as we used for model training.
(ii) Correct the intensity inhomogeneity. Both the N3 (Sled et al., 1998) and N4 (Tustison et al., 2010) methods can be used for this task2. Based on our experiences, setting the default distance parameter and running N3 three times achieves similar performance with N4. Since we trained our models based on training images corrected by N3, to be consistent with the training, we used N3 for removing the bias field in the pipeline.
(iii) Align T1w and T2w images when two modalities are available. In many studies, both T1w and T2w images are acquired to provide complementary information for neuroimaging analysis. In this case, we leverage information from both T1w and T2w images to improve the processing accuracy. Because two modalities present the same brain, a linear registration is sufficient to align them. Therefore, we use “FLIRT” in FSL to linearly align the T2w image onto the corresponding T1w image (Jenkinson et al., 2002; Jenkinson & Smith, 2001). Notably, to reduce multiple-interpolation errors, the alignment and resampling are combined to form a single transformation, which leads to one-time interpolation to generate the resampled and aligned T2w image.
2). Strip the non-brain structures (including head-neck tissues, brain skull, scalp, and dura) and then remove the cerebellum from the image (as illustrated in Fig. 3(b)) (--Timing, 10 min).
We formulate skull stripping and cerebellum removal as two segmentation problems and train a patch-based deep learning method (please refer to the supplementary files for method details) for this step.
3). Segment the cerebrum into gray matter (GM), white matter (WM) and cerebrospinal fluid (CSF) (as illustrated in Fig. 3(c)) (--Timing, 20 min).
This step is the most challenging task in infant MRI processing, due to three major reasons: a) the appearance pattern of the same tissue type varies across different age groups due to the undergoing myelination process; b) the image contrast among different tissues during infancy is extremely low, especially in the 6-month-old brain; and c) the cerebral cortex is a highly convoluted structure with large inter-subject variability and is only a few voxels in thickness.
To address these challenges, instead of training a single neural network model for all age groups like skull stripping, we train a specialized deep learning-based tissue segmentation model for each representative age group. More details about the segmentation network are illustrated in the supplementary files.
4). Separate the tissue map into left and right hemispheres (as illustrated in Fig. 3(d)) (--Timing, 5 min).
To better characterize medial cortical structures, the cerebrum is split into the left and right hemispheres, and subcortical regions and lateral ventricles are filled with white matter to facilitate surface reconstruction. We split the brain into the left and right hemispheres by registration (see registration method details in the supplementary files) of an age-matched template onto the individual brain. The labels of hemispheres, subcortical regions and ventricles in the template are propagated to the individual brain based on the obtained transformation, as shown in Fig. 3(d).
5). Correct the topological errors of the left and right hemispheres (as illustrated in Fig. 3(e)) (--Timing, 15 min).
While embedded in 3D space, the cortical surface of each hemisphere is topologically equivalent to a sphere, i.e., a 2D closed surface (Fischl et al., 1999). We first locate where the topological errors occurred are by deforming an initial surface with a sphere topology (i.e., an ellipsoid) to closely wrap the segmented white matter volume, while preserving its initial topology, by using a shrinking-wrapping topology-preserving level set method (more details can be referred to supplementary files). Then, we can employ a learning-based method to adaptively correct the detected topological errors (L. Sun et al., 2019).
6). Reconstruct the cortical surfaces (as illustrated in Fig. 3(f)) (--Timing, 1.5h).
Two cortical surfaces enclosing the cerebral cortex, i.e., the outer/pial surface (the interface between gray matter and CSF) and the inner surface (the interface between gray matter and white matter) for each hemisphere are reconstructed. In some applications, the middle/central cortical surface, which is defined as the geometric center of the outer and inner cortical surfaces, also needs to be reconstructed for a more balanced representation of sulcal and gyral regions. Specifically, after correction of topological errors, we reconstruct cortical surfaces, represented by triangular meshes, by first reconstructing the inner surface and then reconstructing the middle and outer/pial surfaces. More details of this step can be referred to the supplementary files. Fig. 4 shows the reconstructed inner and outer cortical surfaces (color-coded by cortical thickness) overlayed on corresponding T1w MR images from the same subject at different ages.
Fig. 4.
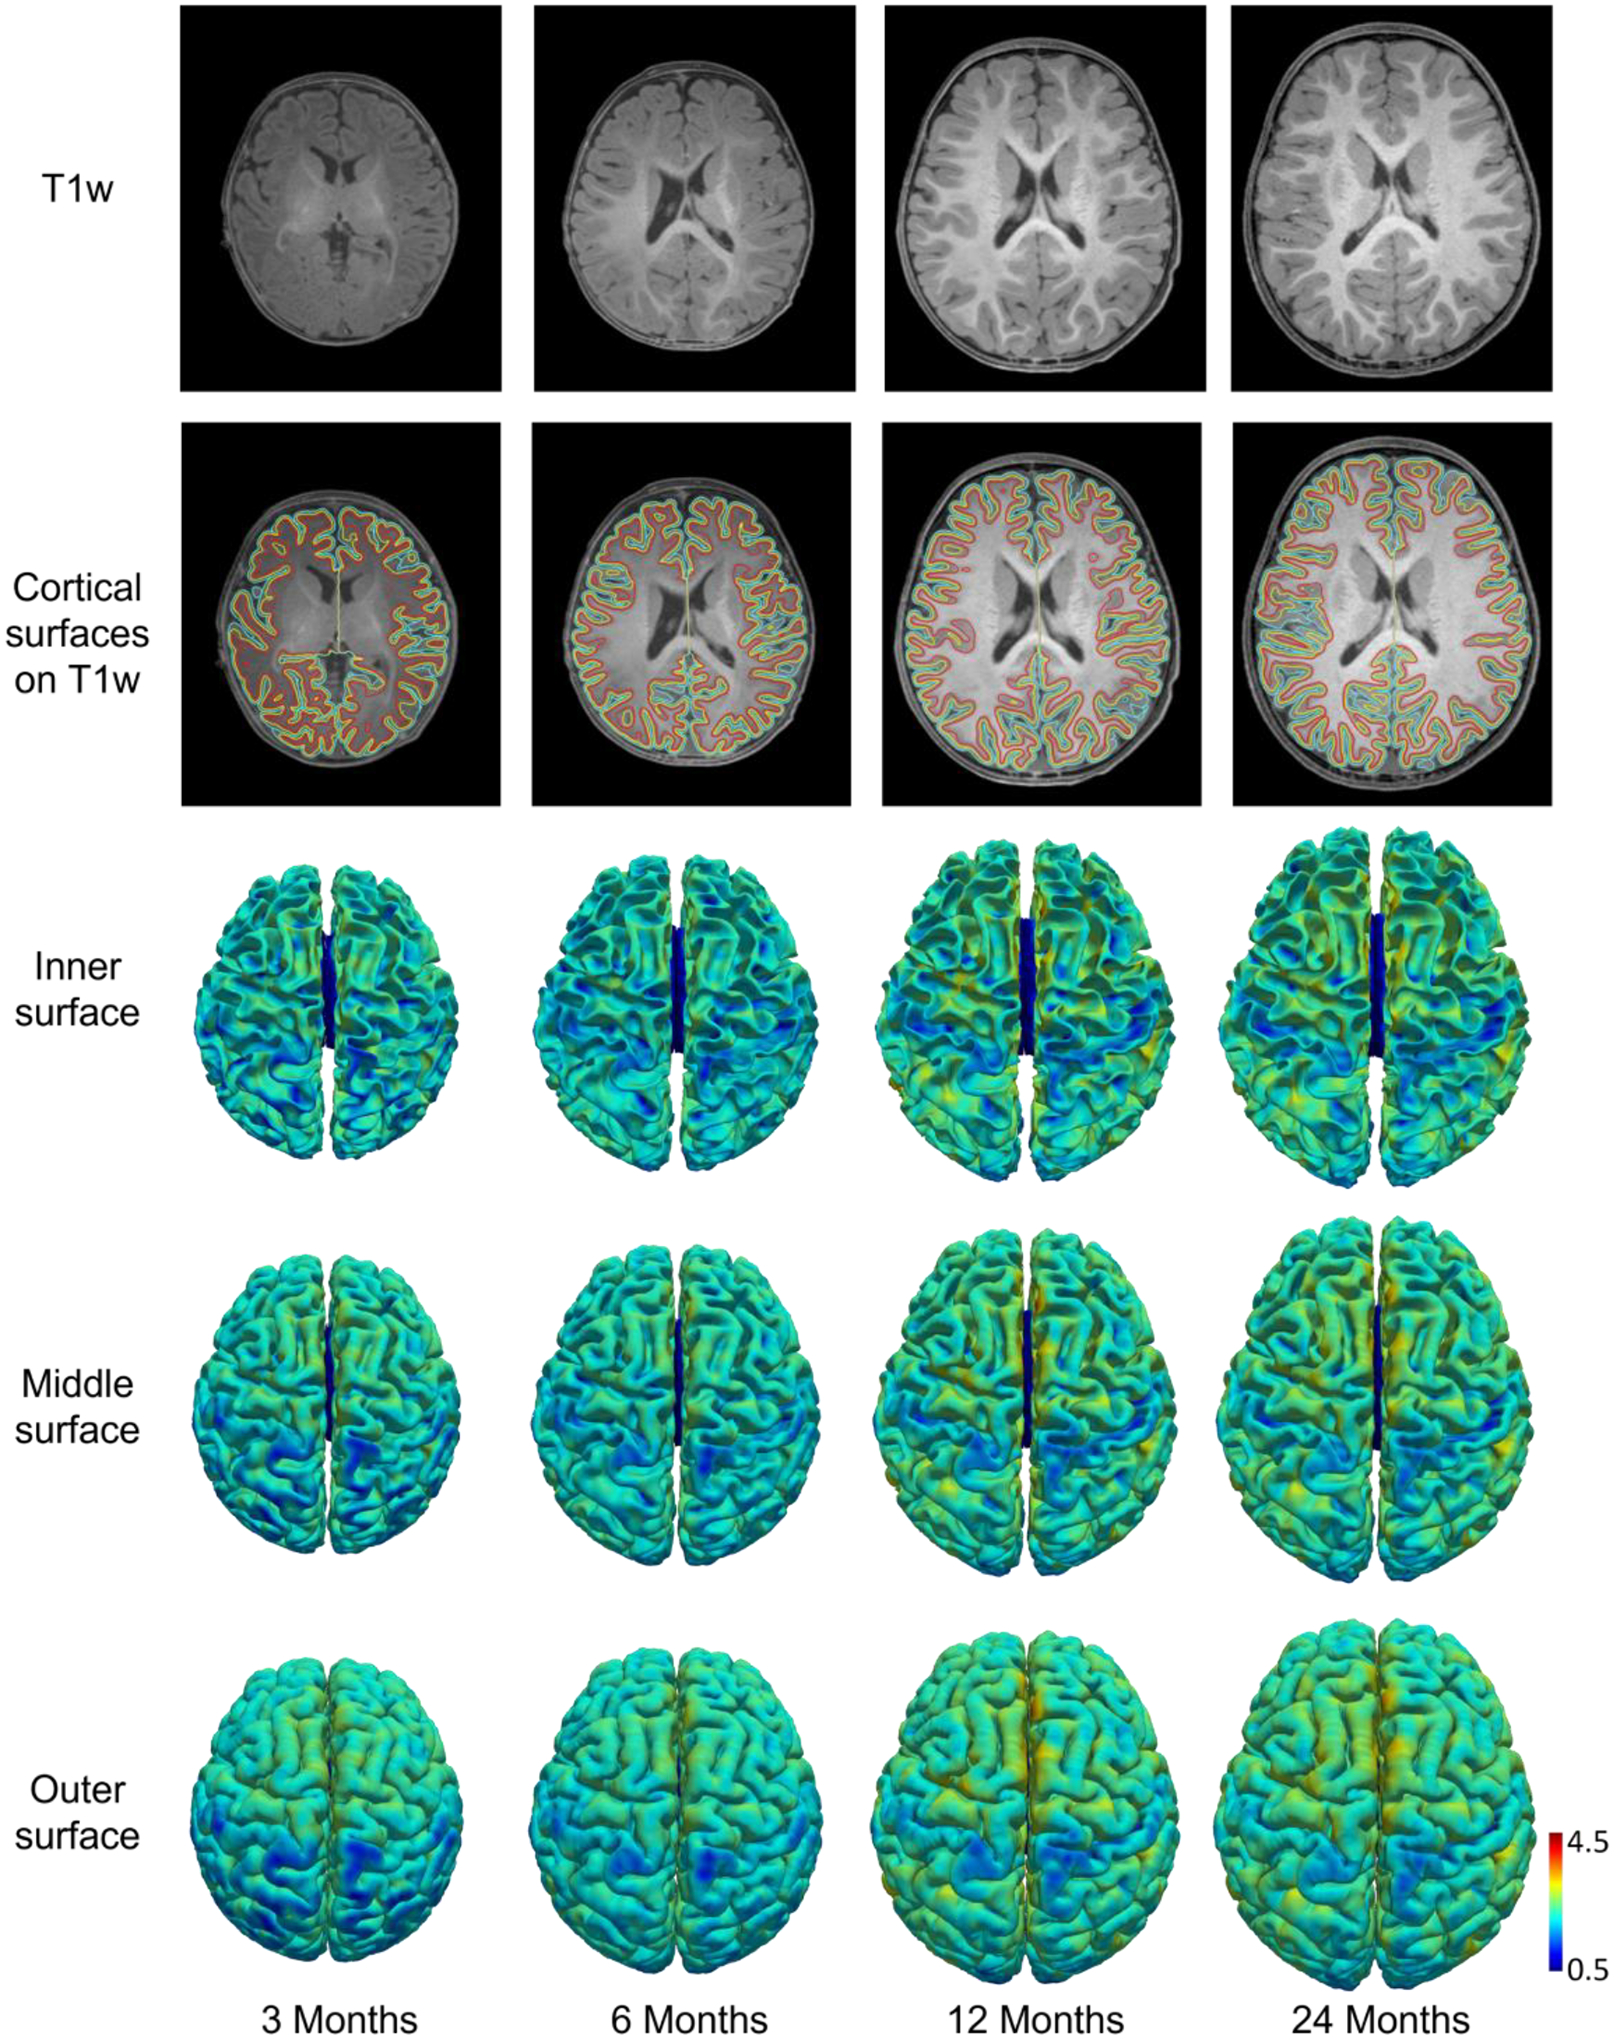
T1w images, reconstructed inner, middle, and outer cortical surfaces (color-coded by cortical thickness in mm) from a subject at different ages. Red, yellow, and cyan contours indicate inner, middle, and outer cortical surfaces, respectively, overlaid on T1w images.
7). Compute the cortical properties (as illustrated in Fig. 3(g) and Fig. 3(h)) (--Timing, 30 min).
Once cortical surfaces are reconstructed, we compute multiple biologically distinct and meaningful cortical properties for each vertex, e.g., cortical thickness, surface area, myelin content, sulcal depth, gyrification index, and curvatures, to comprehensively characterize the complex development of the cerebral cortex during infancy (please refer to supplementary files for their detailed definitions and computations). Also, we use the typical surface registration methods (Fischl et al., 1999; Robinson et al., 2014; Yeo et al., 2010; Zhao, Wu, Wang, Lin, Gilmore, et al., 2021; Zhao, Wu, Wang, Lin, Xia, et al., 2021) to propagate different parcellations on atlases onto the reconstructed cortical surfaces. Some typical cortical properties and parcellations are presented in Fig. 3 (g) and (h).
4. Troubleshooting
| Step | Problem | Possible reason | Solution |
|---|---|---|---|
| 1) | Orientation/resampling cannot be performed. | Non-raw images were provided. | We need images with correct header to extract the brain information (size, resolution, datatype, orientation, etc.). Use the raw images as the input and rerun the pipeline. |
| 2) | Non-brain structures or the cerebellum are not well removed. | The brain image is scanned with too large obliquity or may contain large area of the shoulder structures. | 1. Manually rotate the image to constrain the brain obliquity less than 30 degrees and then rerun the pipeline with the manually rotated image. 2. Crop the raw image to remove shoulder structures and then rerun the pipeline with the cropped image. 3. Manually edit the mask for the brain or the cerebellum generated from the pipeline with the interactive toolkit ITK-snap (http://www.itksnap.org), then rerun the pipeline by providing the corrected brain or cerebellum mask as additional input. |
| 3) | The tissue segmentation map contains some errors. | The brain image is with severe motions. | 1. If one modality was corrupted with severe motions while the other one was with free or moderate motions, run the pipeline with only the modality with free or moderate motions. 2. If only one modality is available but with severe motions, try to run the pipeline with downsampled modality (e.g., 1*1*1mm3). 3. Manually edit the segmentation map with the interactive toolkit ITK-snap (http://www.itksnap.org) and then rerun the pipeline using the corrected segmentation map as an additional input. |
| 3) | Out of memory issue. | The GPU memory is too small. | 1. Equip the GPU with at least 4GB memory. 2. Use our pipeline’s online version (www.ibeat.cloud) to conduct the processing. |
| 6) | The reconstructed cortical surface has incorrect topology. | The topology correction may involve some errors. | Manually edit the left and right hemisphere tissue maps to remove topological errors. |
| 6) | The reconstructed cortical surface is not aligned with the images. | The segmentation image has incorrect header. | Do not change the segmentation header when manually editing the segmentation map. |
5. Anticipated Results
5.1. Comparison with Existing Pipelines
Currently, there are very few processing pipelines that are available for infant brains. Previous studies have shown that adult brain MRI processing pipelines, like FSL and FreeSurfer, do not work well for infant brains (L. Wang et al., 2015; Zöllei et al., 2020). Therefore, we compared our pipeline with the recently developed infant pipelines, including the Infant FreeSurfer and dHCP pipelines. In addition, we compared our results with FastSurfer which uses deep learning for tissue segmentation but mainly handles the adult brain, and other top deep learning algorithms in the MICCAI iSeg-2019 challenge.
5.1.1. Comparison with Infant FreeSurfer
We compared our pipeline with the Infant FreeSurfer pipeline on the above mentioned 3 datasets. Our pipeline flexibly accepts different combinations of MRI modalities for processing, i.e., a) both T1w and T2w images, b) single T1w image, and c) single T2w image; in contrast, the Infant FreeSurfer pipeline only takes T1w images as the input. As a fair comparison, we only used T1w images for comparison with Infant FreeSurfer. However, we should emphasize that our pipeline generates even better results when inputting both T1w and T2w images.
Fig. 5 shows typical processing results of our pipeline and the Infant FreeSurfer pipeline on images at different ages in the BCP dataset. We compared these pipelines at 9 time points, i.e., around 1 month, 3 months, 6 months, 9 months, 12 months, 18 months, 24 months, 36 months, and 60 months of age. Fig. 5 (b) and (c) demonstrate that our pipeline achieves much better segmentation performance than the Infant FreeSurfer does, especially for brains before 12 months. This is because the Infant FreeSurfer pipeline uses the multi-atlas and label fusion strategy, which is highly dependent on the registration accuracy when aligning the atlases onto individual brains, to build the mapping from the image appearance and tissue labels. However, in the first postnatal year, the T1w image has poor tissue contrast due to the underlying myelination process; furthermore, the image appearance undergoes a dramatic change due to individualized, regionally heterogeneous development. These two factors make accurate registration from the atlases onto individual brains a challenging task. On the contrary, our pipeline leverages the powerful learning ability of deep learning-based methods to directly learn the complex mapping from the intensity images to tissue labels. Compared to registration-based tissue segmentation, our deep learning-based method can automatically discover and capture more reliable semantic information from images, which leads to much better tissue segmentation performance and more robust generalizability for multi-site images.
Fig. 5.
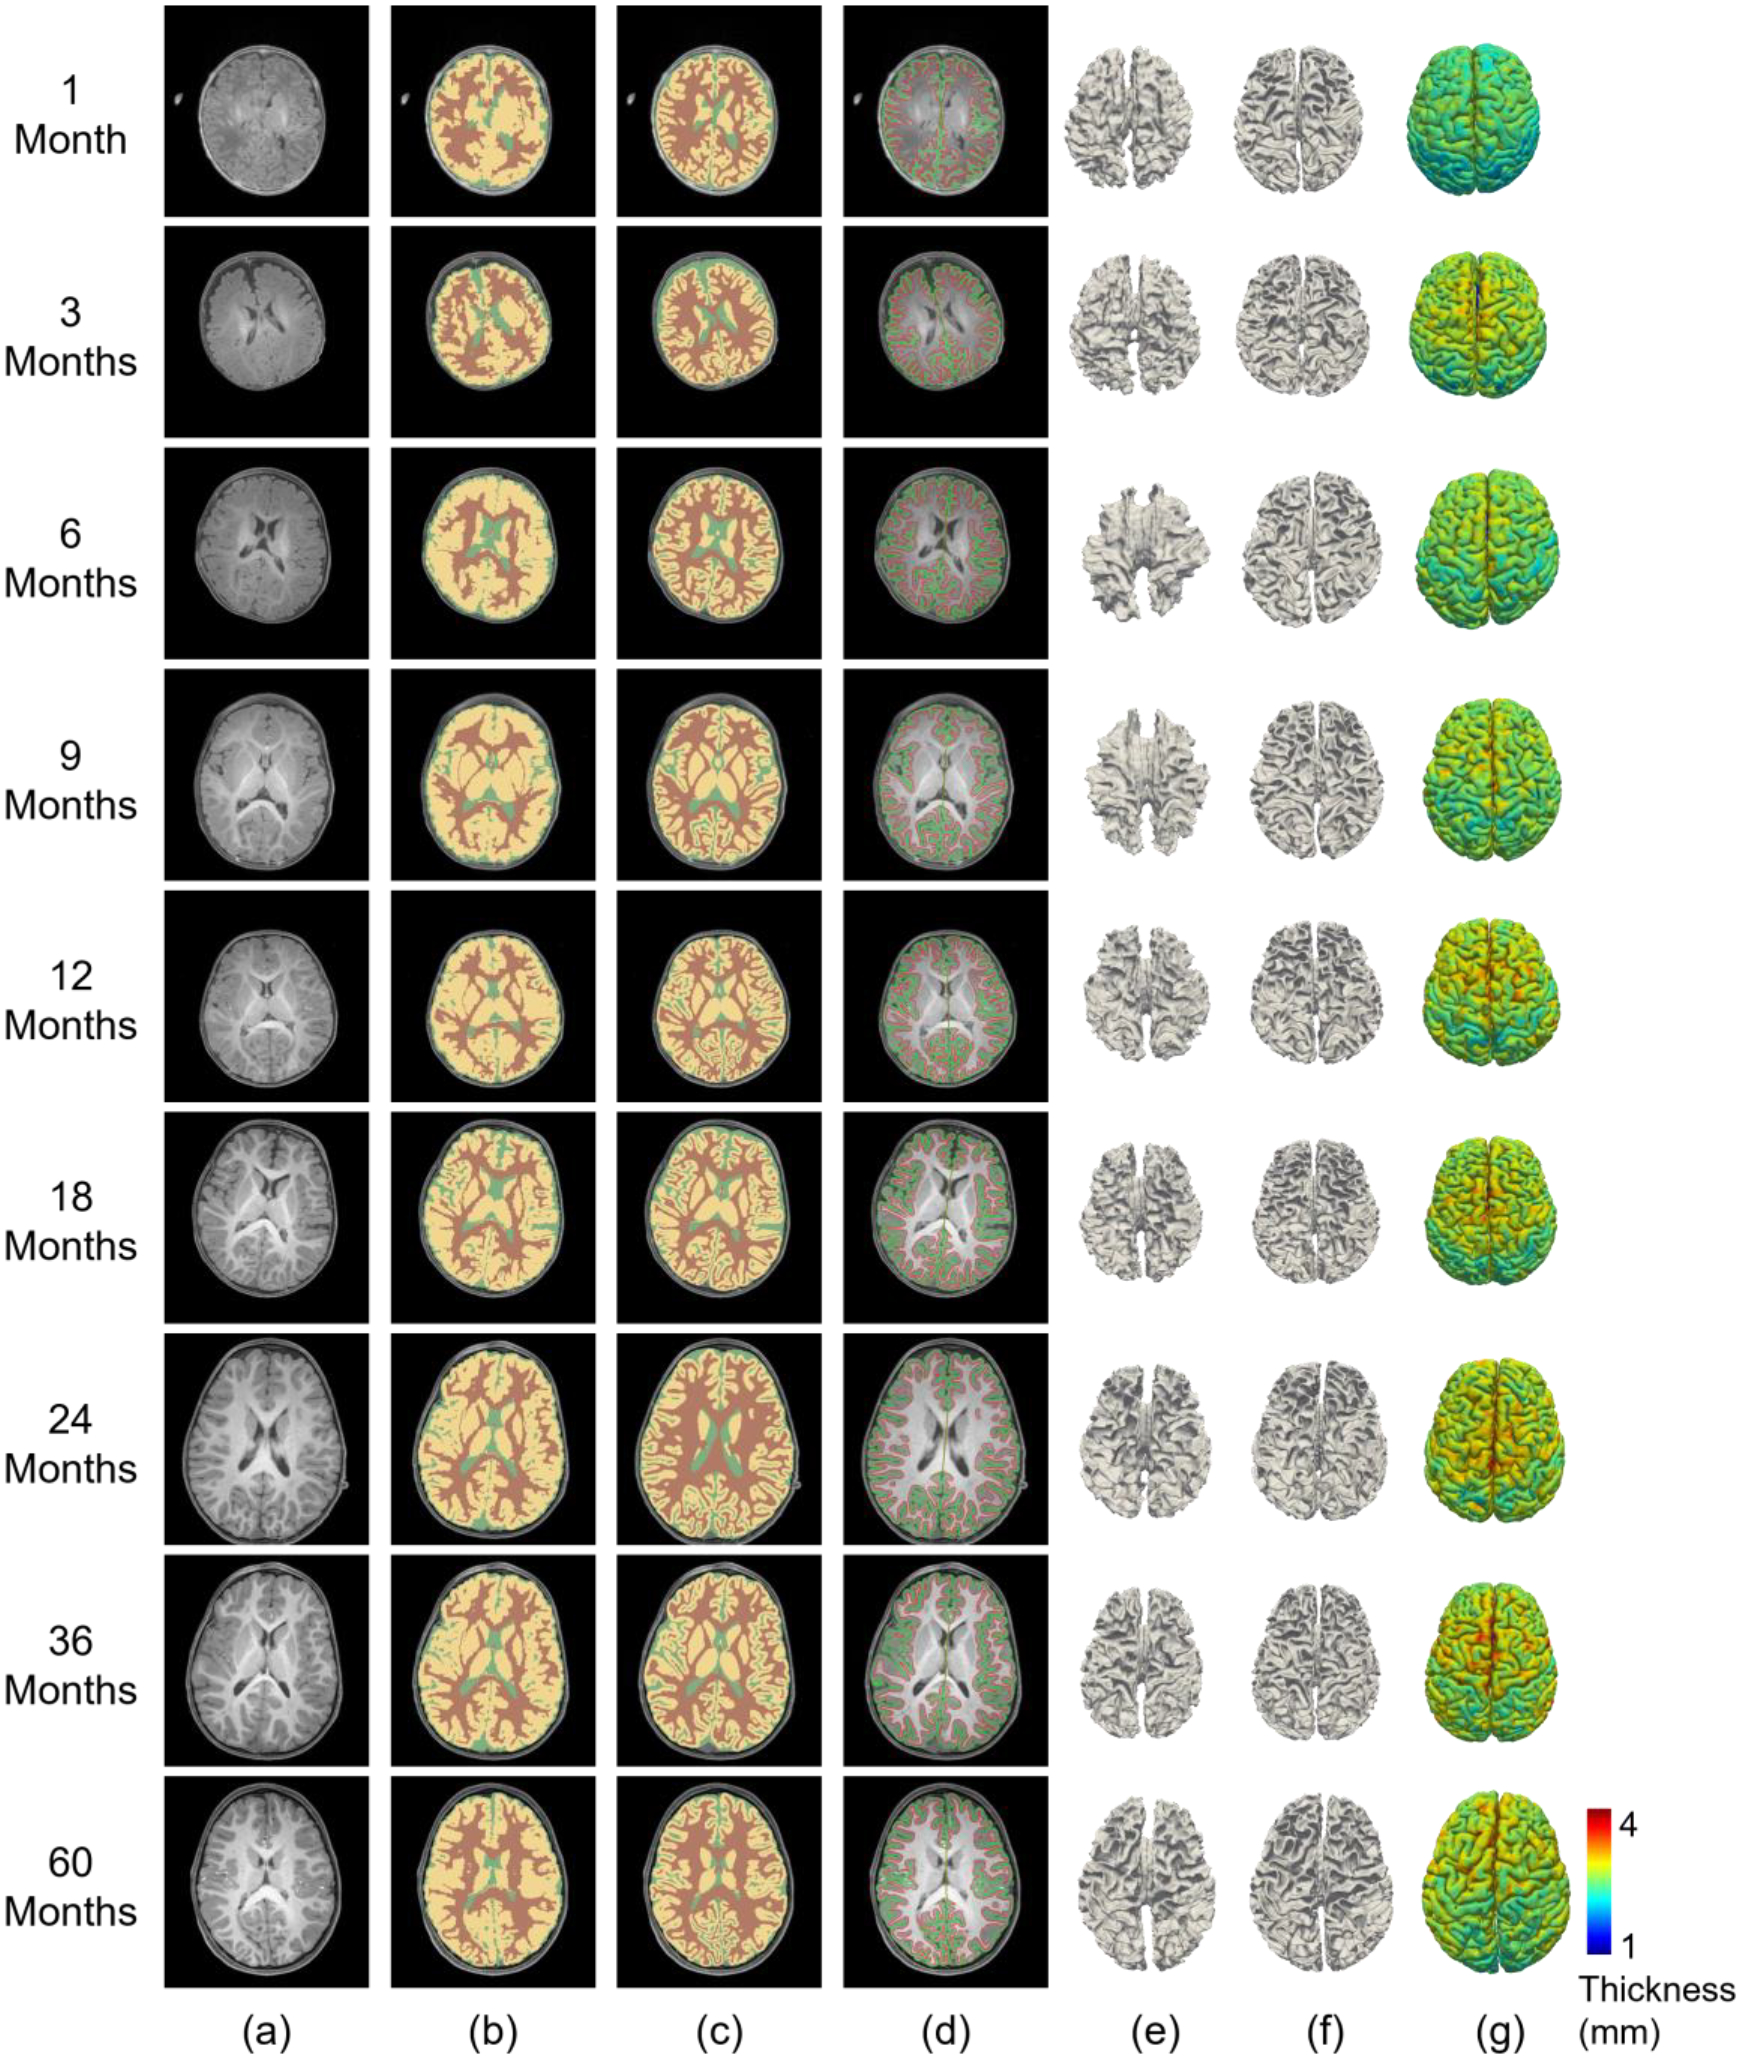
Comparison of processing results from Infant FreeSurfer and our pipeline for BCP scans at different age groups. (a) T1w images. (b) Tissue segmentation by Infant FreeSurfer. (c) Tissue segmentation by our pipeline. (d) Our reconstructed cortical surfaces overlayed on intensity images, with red contours indicating inner surfaces and green contours indicating outer surfaces. (e) Reconstructed inner cortical surfaces by Infant FreeSurfer. (f) Reconstructed inner cortical surfaces by our pipeline. (g) Reconstructed outer cortical surfaces (color-coded with cortical thickness) by our pipeline.
We also reconstructed the inner and outer cortical surfaces and visualized the reconstructed inner cortical surfaces. In Fig. 5 (d), we overlapped the reconstructed cortical surfaces on intensity images. From the figure, we observe that our reconstructed cortical surfaces are well aligned with tissue boundaries. In Fig. 5 (e) and (f), we visualized the inner cortical surfaces reconstructed by our pipeline and Infant FreeSurfer, respectively. From these figure panels, we observe that our pipeline achieves much more reasonable results by accurately capturing the major gyral and sulcal folding, which is established at term birth, according to existing neuroscientific knowledge.
A comparison of the results from Infant FreeSurfer and our pipeline shows that around 6 months of age, our pipeline performs significantly better than Infant FreeSurfer does. This is not surprising, given that the extremely low tissue contrast in 6-month-old infant brain MRIs generally severely degrades the atlas-to-individual registration performance. After 1 year of age, the Infant FreeSurfer gradually achieves improved results, due to the increased tissue contrast. However, many cortical details that are still missing in the Infant FreeSurfer results are well revealed by our pipeline.
In addition to the BCP dataset, Fig. 6 shows typical processing results from the Infant FreeSurfer and our pipeline for two representative dHCP scans and two representative MSMS6 scans (using their T1w images). Similarly, we observed that our pipeline achieves superior performance. It is worth noting that the dHCP scans were acquired with a Philips MRI scanner, 1 MSMS6 scan (MSMS6–1) was acquired with a GE scanner and the other MSMS6 scan (MSMS6–2) was acquired with a Siemens Trio scanner. Although our training data are from the Siemens PRISMA scanner, our pipeline trained with a single dataset adapted effectively to the intensity distribution variability caused by different scanners and achieved superior performance, which is further evaluated below, in section 5.3.
Fig. 6.
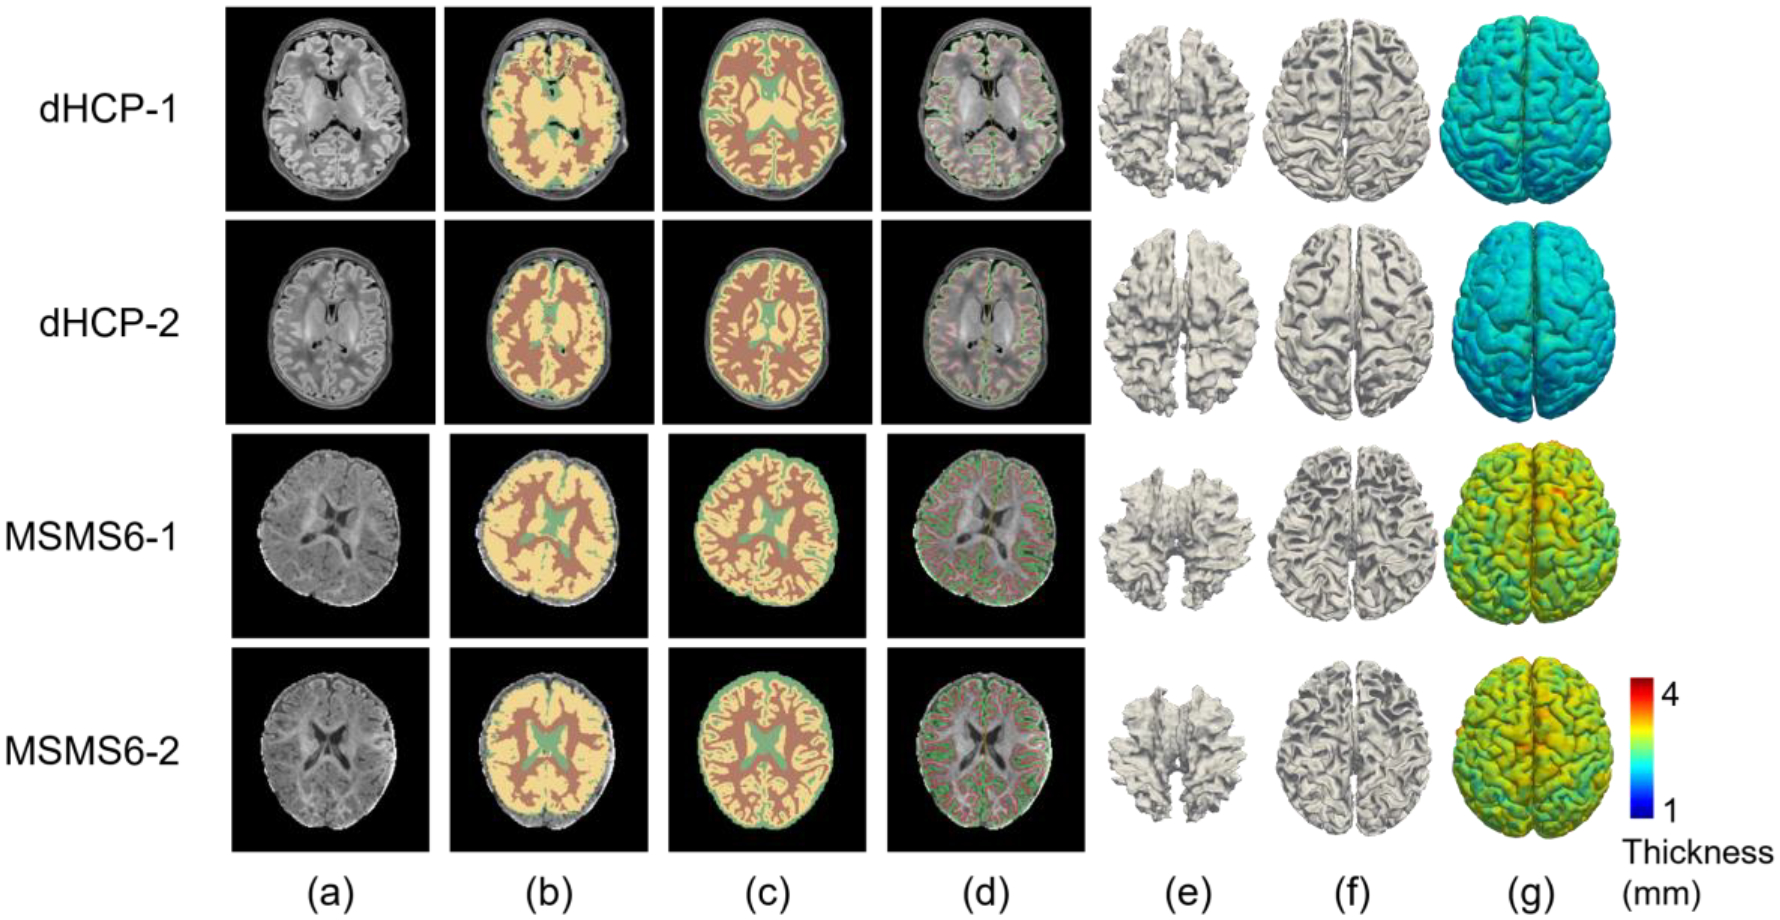
Processing results comparison between Infant FreeSurfer and our pipeline for 2 typical dHCP subjects and 2 typical MSMS6 subjects. (a) T1w images. (b) Tissue segmentation by Infant FreeSurfer. (c) Tissue segmentation by our pipeline. (d) Our reconstructed cortical surfaces overlayed on the intensity images, with red contours indicating inner cortical surfaces and green contours indicating outer cortical surfaces. (e) Reconstructed inner cortical surfaces by Infant FreeSurfer. (f) Reconstructed inner cortical surfaces by our pipeline. (g) Reconstructed outer cortical surfaces (color-coded with cortical thickness) by our pipeline.
5.1.2. Comparison with the dHCP Released Processed Data
We applied our pipeline to the dHCP dataset and compared our results with the released processing results from dHCP. Fig. 7 shows a visual comparison between our pipeline results and the dHCP released data for two randomly selected scans. From this figure, we observe that our results are consistent with the dHCP results, even though our pipeline was not trained using the dHCP dataset.
Fig. 7.
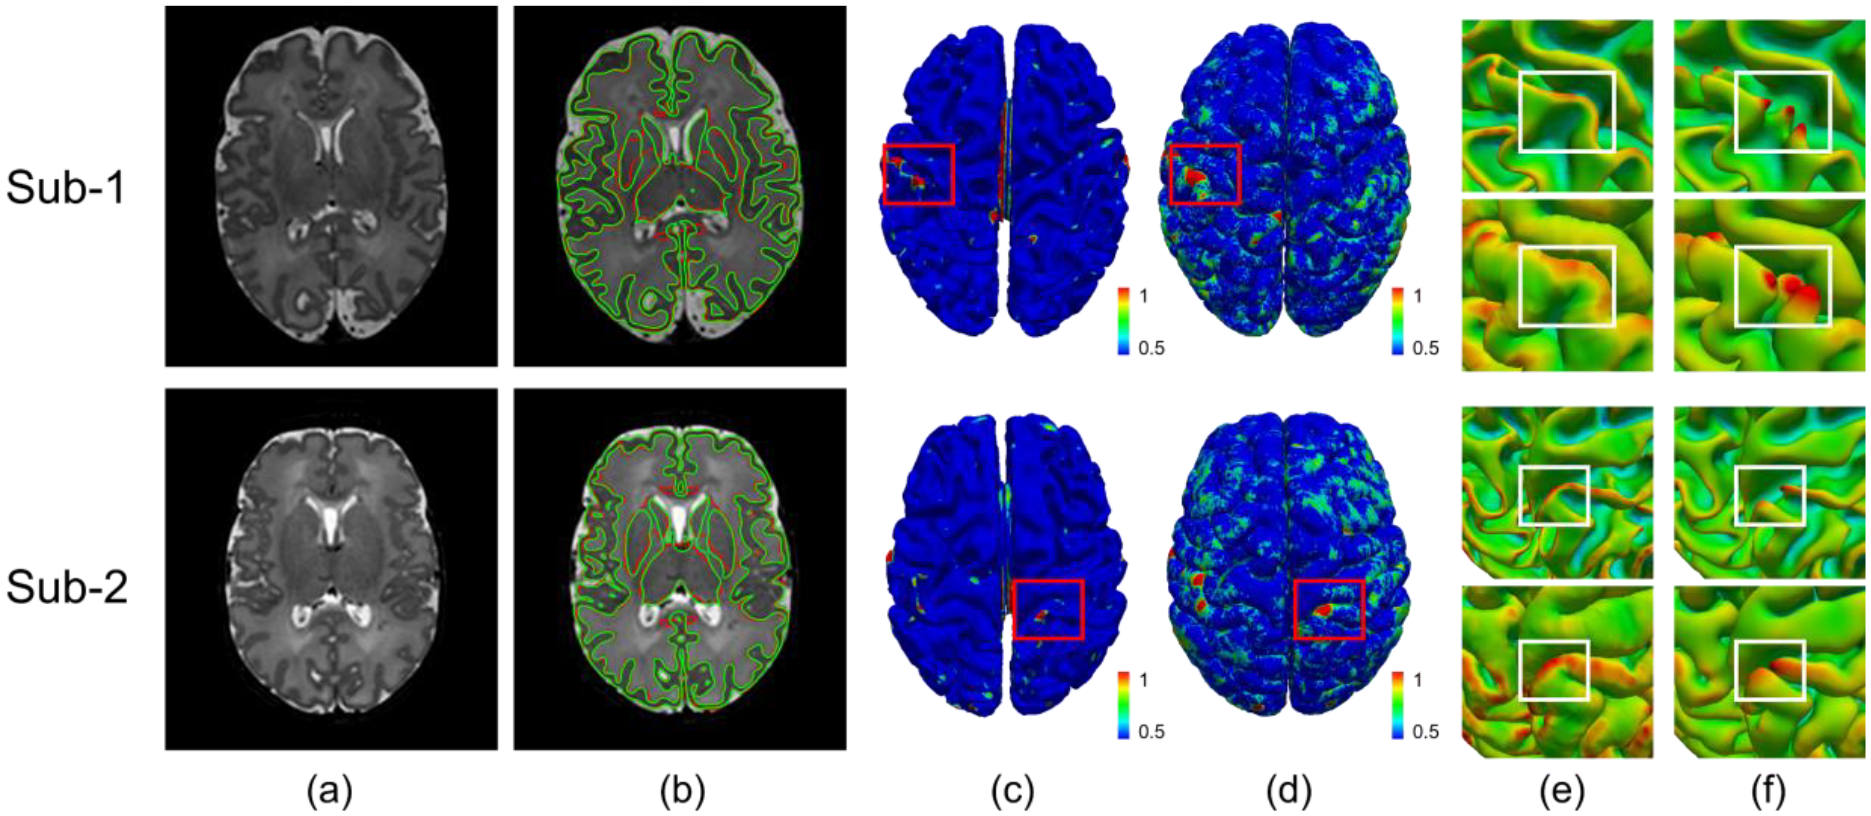
Comparison between our results and the dHCP released results. (a) T2w images; (b) Gray matter and white matter tissue boundaries from our segmentation (green) and the dHCP released segmentation (red); (c) Color-coded vertex-wise surface distance maps between our reconstructed inner surfaces and dHCP inner surfaces; (d) Color-coded vertex-wise surface distance maps between our reconstructed outer surfaces and dHCP outer surfaces; (e) Close-up views of our reconstructed inner and outer surfaces in (c) and (d); (f) Close-up views of the dHCP released inner and outer surfaces in (c) and (d).
To quantitatively evaluate the performance of our pipeline, we compared our results with the dHCP released results and evaluated their consistency by two measures, i.e., a) the Dice ratio (DSC) of the gray matter and white matter between our tissue segmentation and the dHCP released segmentation; and b) the average surface distance (ASD) between our reconstructed cortical surfaces and the dHCP released cortical surfaces. Higher DSC and the lower ASD indicate higher consistency of these two pipelines. Fig. 8 shows that our pipeline’s results are consistent with the dHCP pipeline’s results. Note that the dHCP pipeline is optimized for neonatal brains, while our pipeline can handle pediatric brains from preterm birth to 6+ years of age.
Fig. 8.
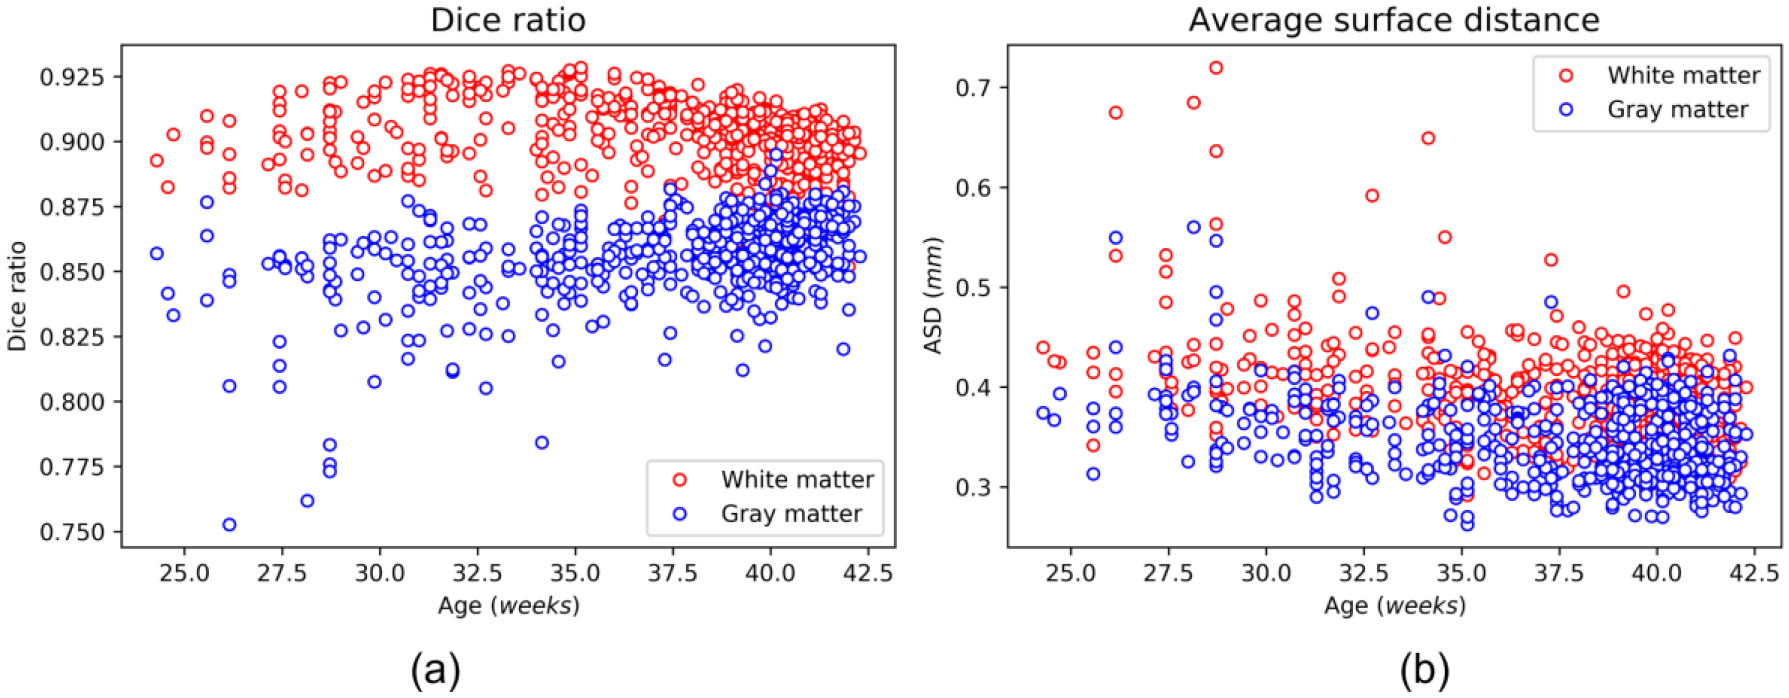
Quantitative comparison between our results and the dHCP released data with 558 scans. (a) Dice ratio of the gray matter and white matter; (b) The average surface distance (mm) between our reconstructed surfaces and the dHCP released surfaces.
Additionally, when comparing the reconstructed cortical surfaces between the dHCP pipeline and our pipeline, we found that our pipeline typically achieves better and more reasonable and detailed cortical folds in the occipital lobe. This is because compared to other regions, the occipital lobe has a thinner and more convoluted cortex, making it more difficult to accurately reconstruct, with a typical example shown in Fig. 9. The cortical surface reconstructed by the dHCP pipeline missed some gyri in both the left and right hemispheres, while our method successfully reconstructed them.
Fig. 9.
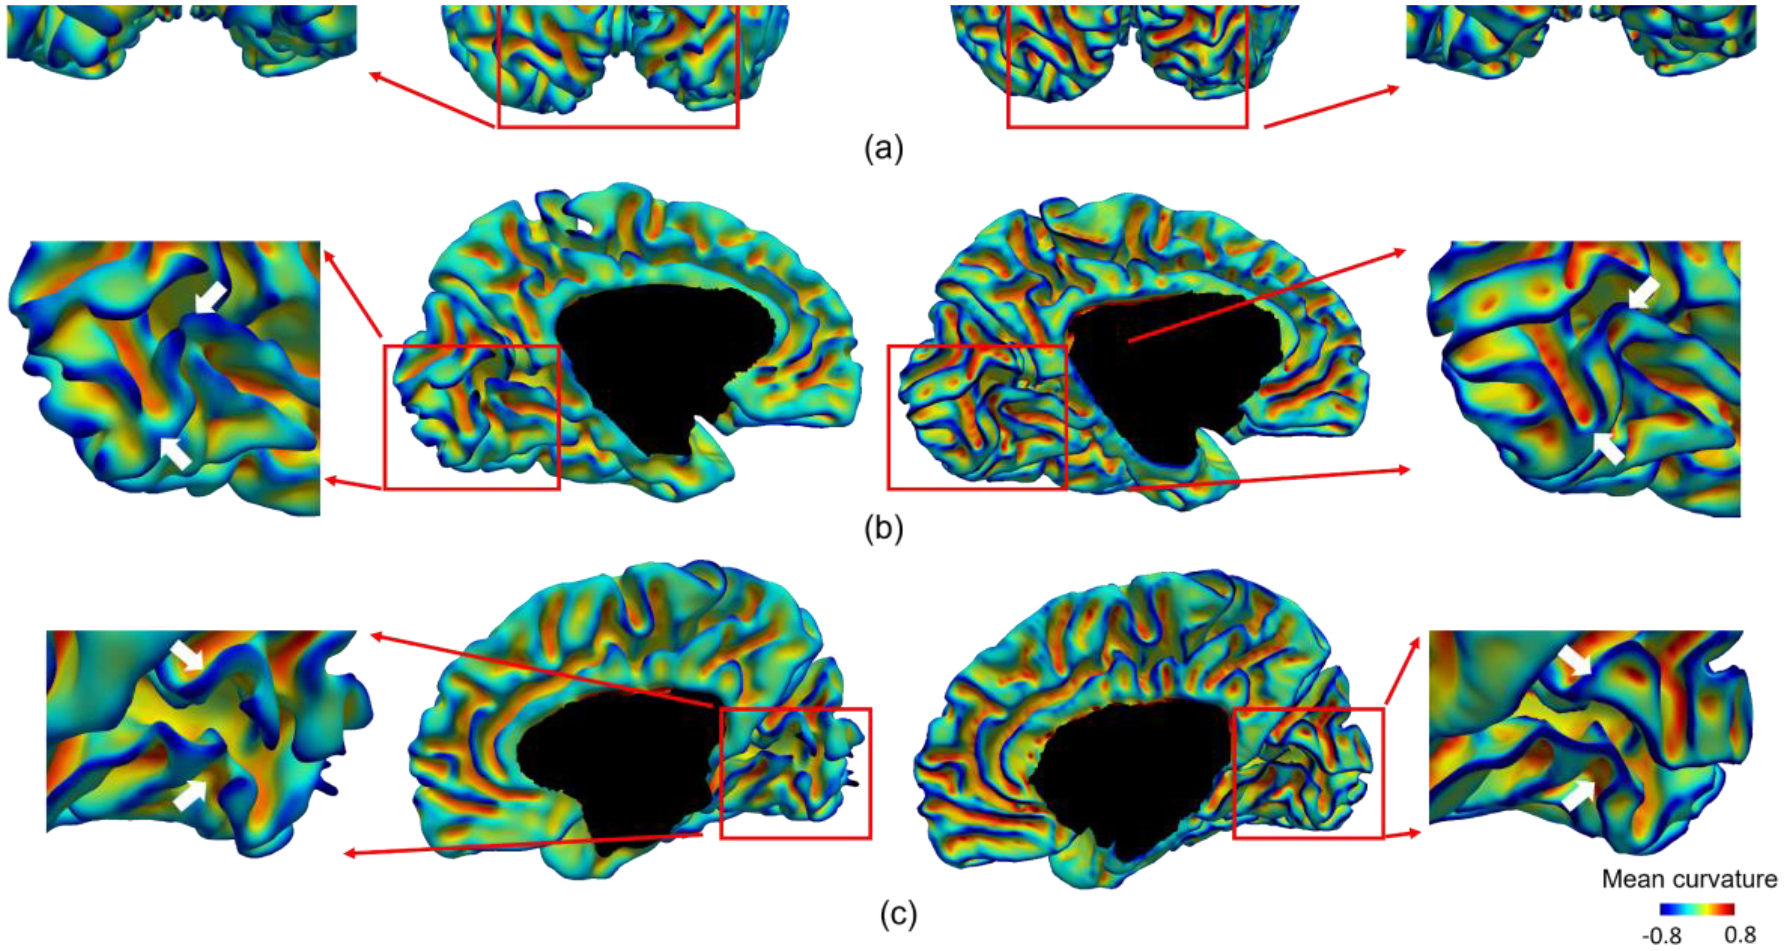
Comparison of the reconstructed cortical surfaces in the occipital lobe of a typical subject using the dHCP pipeline and our pipeline. All surfaces are color-coded by mean curvature. (a) The posterior view of both hemispheres. (b) The medial view of the left hemisphere. (c) The medial view of the right hemisphere. For each view, we have magnified the occipital lobe for a detailed comparison.
5.1.3. Comparison with FastSurfer
FastSurfer (Henschel et al., 2020) is a recently released pipeline that leverages the deep learning technique to accelerate the adult FreeSurfer pipeline. Although it is mainly designed for adult brains, it is the first publicly available pipeline that adopted the deep learning strategy for tissue segmentation. Fig. 10 shows a comparison of FastSurfer and our pipeline using BCP subjects at 5 different ages. We observe a relatively high consistency between our pipeline and FastSurfer for the early adult-like brain (the last row). However, for younger brains, especially before 12 months of age, FastSurfer performs not well. The reason is that the training for FastSurfer is based on adult MRIs, which have completely different MRI tissue contrast and appearances than those of infant MRIs before 1 year of age. At around 2 years of age, FastSurfer achieves relatively improved segmentation, and at around 6 years of age, FastSurfer and our pipeline perform similarly, achieving relatively consistent segmentation results for the gray matter and white matter.
Fig. 10.
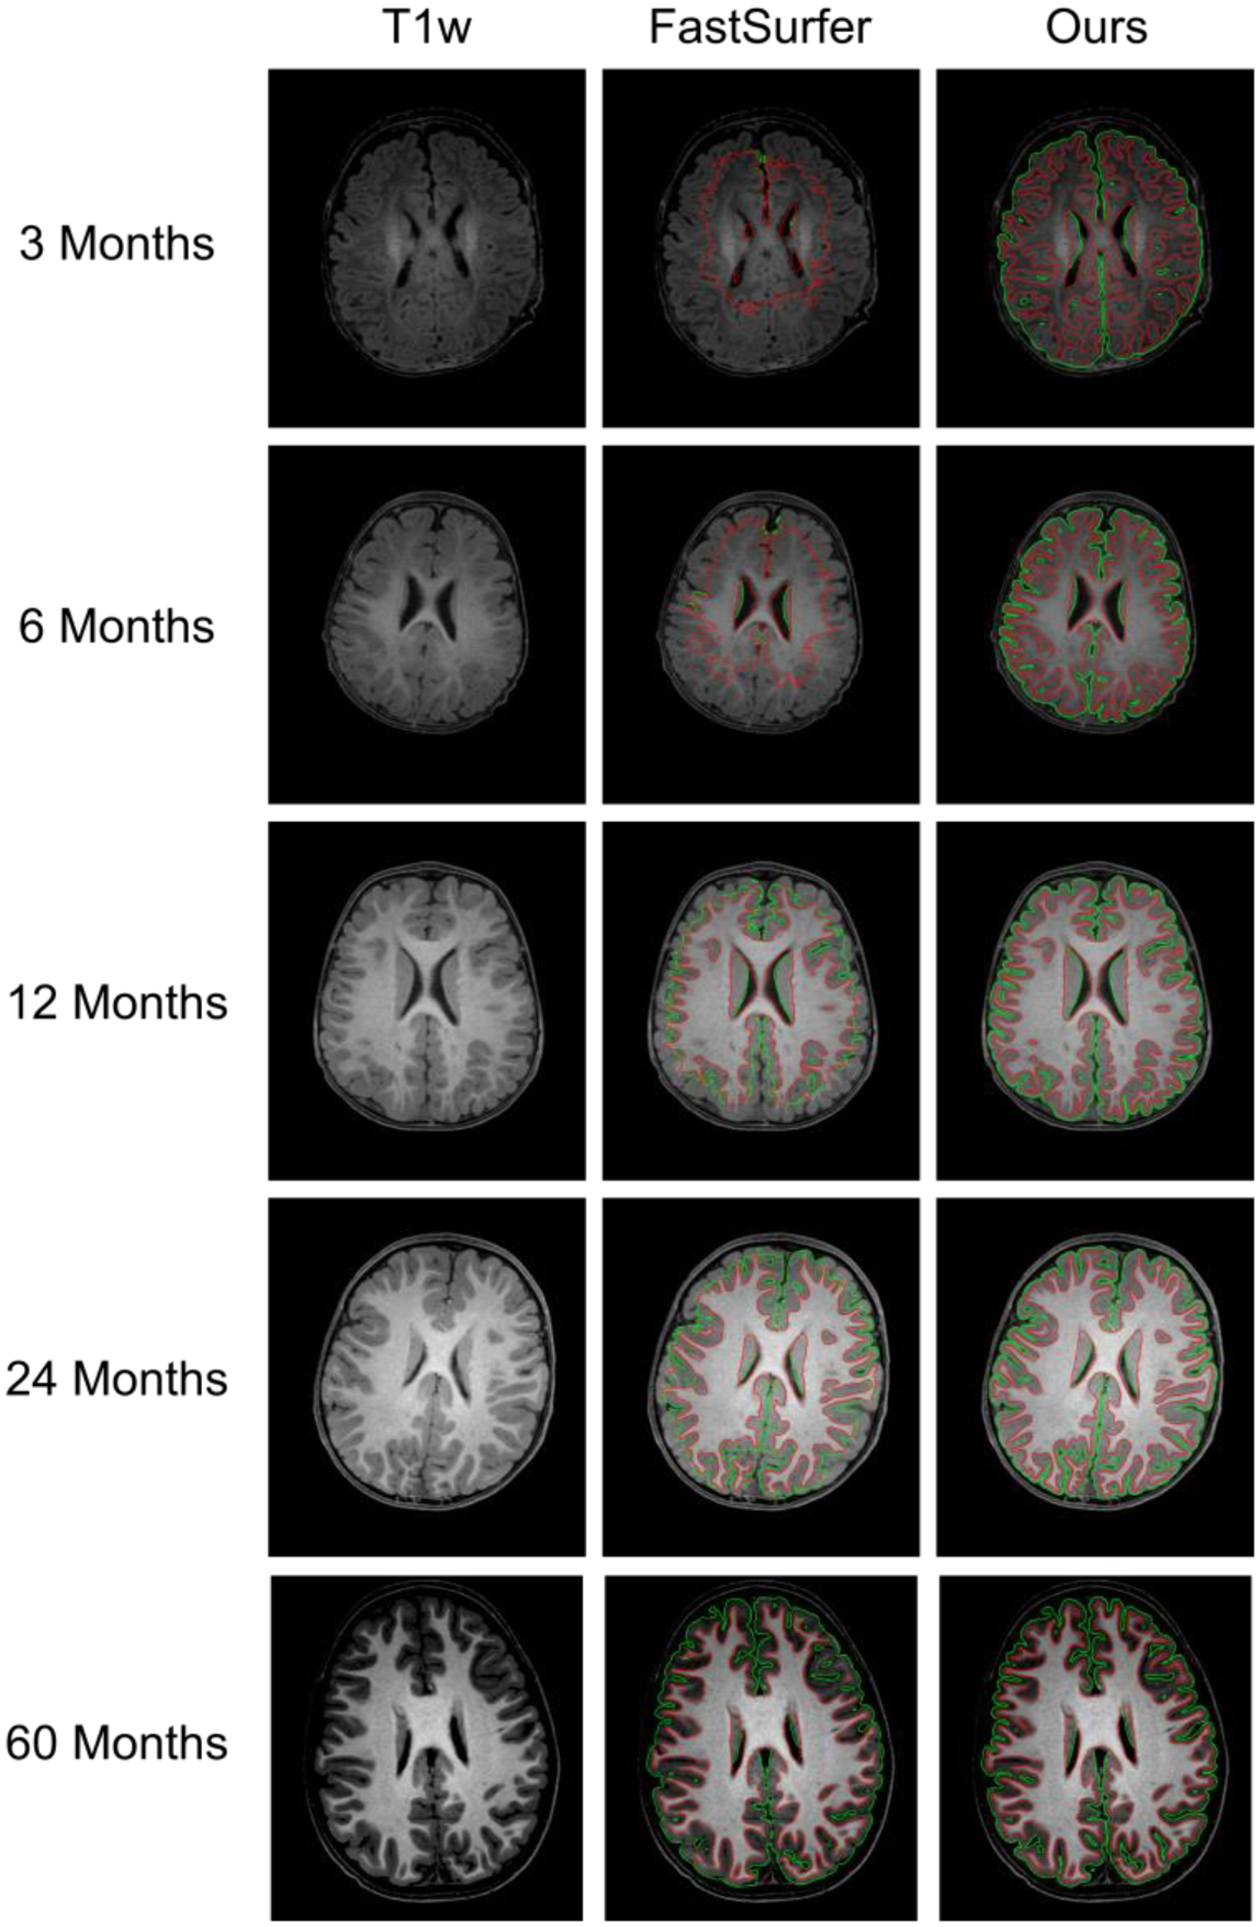
Comparison with deep learning-based FastSurfer at different ages. The green contours indicate gray matter boundaries, and the red contours indicate white matter boundaries.
Besides using the infant data for training, there are two important strategies that may be favorable for better adapting FastSurfer or similar methods on infant brain images, i.e., 1) training age-dependent segmentation models. Because image appearances and brain sizes change significantly over months for the infant brains, especially in the first two years, due to the undergoing myelination process and the substantial brain growth rate; b) boosting the neighboring information embedding using 3D images instead of 2D image slices. This is because the local tissue contrast varies dramatically across different brain regions due to the spatiotemporally heterogeneous development. As the hierarchical convolution and pooling in the 3D space can provide more informative patterns compared to those in the 2D space, richer neighboring information can be embedded and learned with 3D images.
5.2. Evaluation of Massive Multi-site Data
To better serve the early brain development research community, we maintain a web server (http://www.ibeat.cloud) to facilitate processing of infant brain MRIs by simply uploading user images through the website. We have successfully processed more than 16,000 infant brain images from 100+ universities and institutes worldwide. Notably, these infant images were acquired with varying imaging protocols using different scanners from multiple major manufactures. After processing and sending the results back to the users, we asked the users to provide feedback about the processing results so that we can further improve our pipeline. We have received a large number of positive comments from the community, and users are satisfied with our processing results. In the Supplementary Materials, we provide a more detailed evaluation of our pipeline from the community.
5.3. Quantitative Evaluation
5.3.1. Segmentation Accuracy Evaluation
In addition to comparing our pipeline with state-of-the-art pipelines, we performed a quantitative comparison on 22 infant brains (6-months of age) from the MSMS6 dataset. The reasons we selected these scans for quantitative evaluation are: a) at this age, the brain MR image has the lowest tissue contrast between gray matter and white matter; b) this dataset contains images from different scanners with different imaging protocols, which enables us to test the generalizability of our pipeline; and c) these 22 scans are a moderate number that we can afford to conduct the manual delineation and have been successfully used to hold MICCAI iSeg-2019 Challenge, as it is extremely time-consuming to manually label (each scan costs about one week for a well-trained neuroanatomist) infant brain tissues.
We also compared our method with the top 8 teams in the MICCAI iSeg-2019 challenge. Of note, all of these comparison methods are deep learning-based methods and use both T1w and T2w images. The training data are from the Siemens PRISMA scanner, and the testing data are from 3 different scanners and protocols. Three representative testing images are shown in Fig. 2, with tissue segmentation maps by iBEAT V2.0. Fig. 11 shows the quantitative comparisons with other methods. Our method achieved not only higher accuracy but also more consistent performance across the 3 scanners, demonstrating the robustness of our method for different imaging scanners and protocols.
Fig. 11.
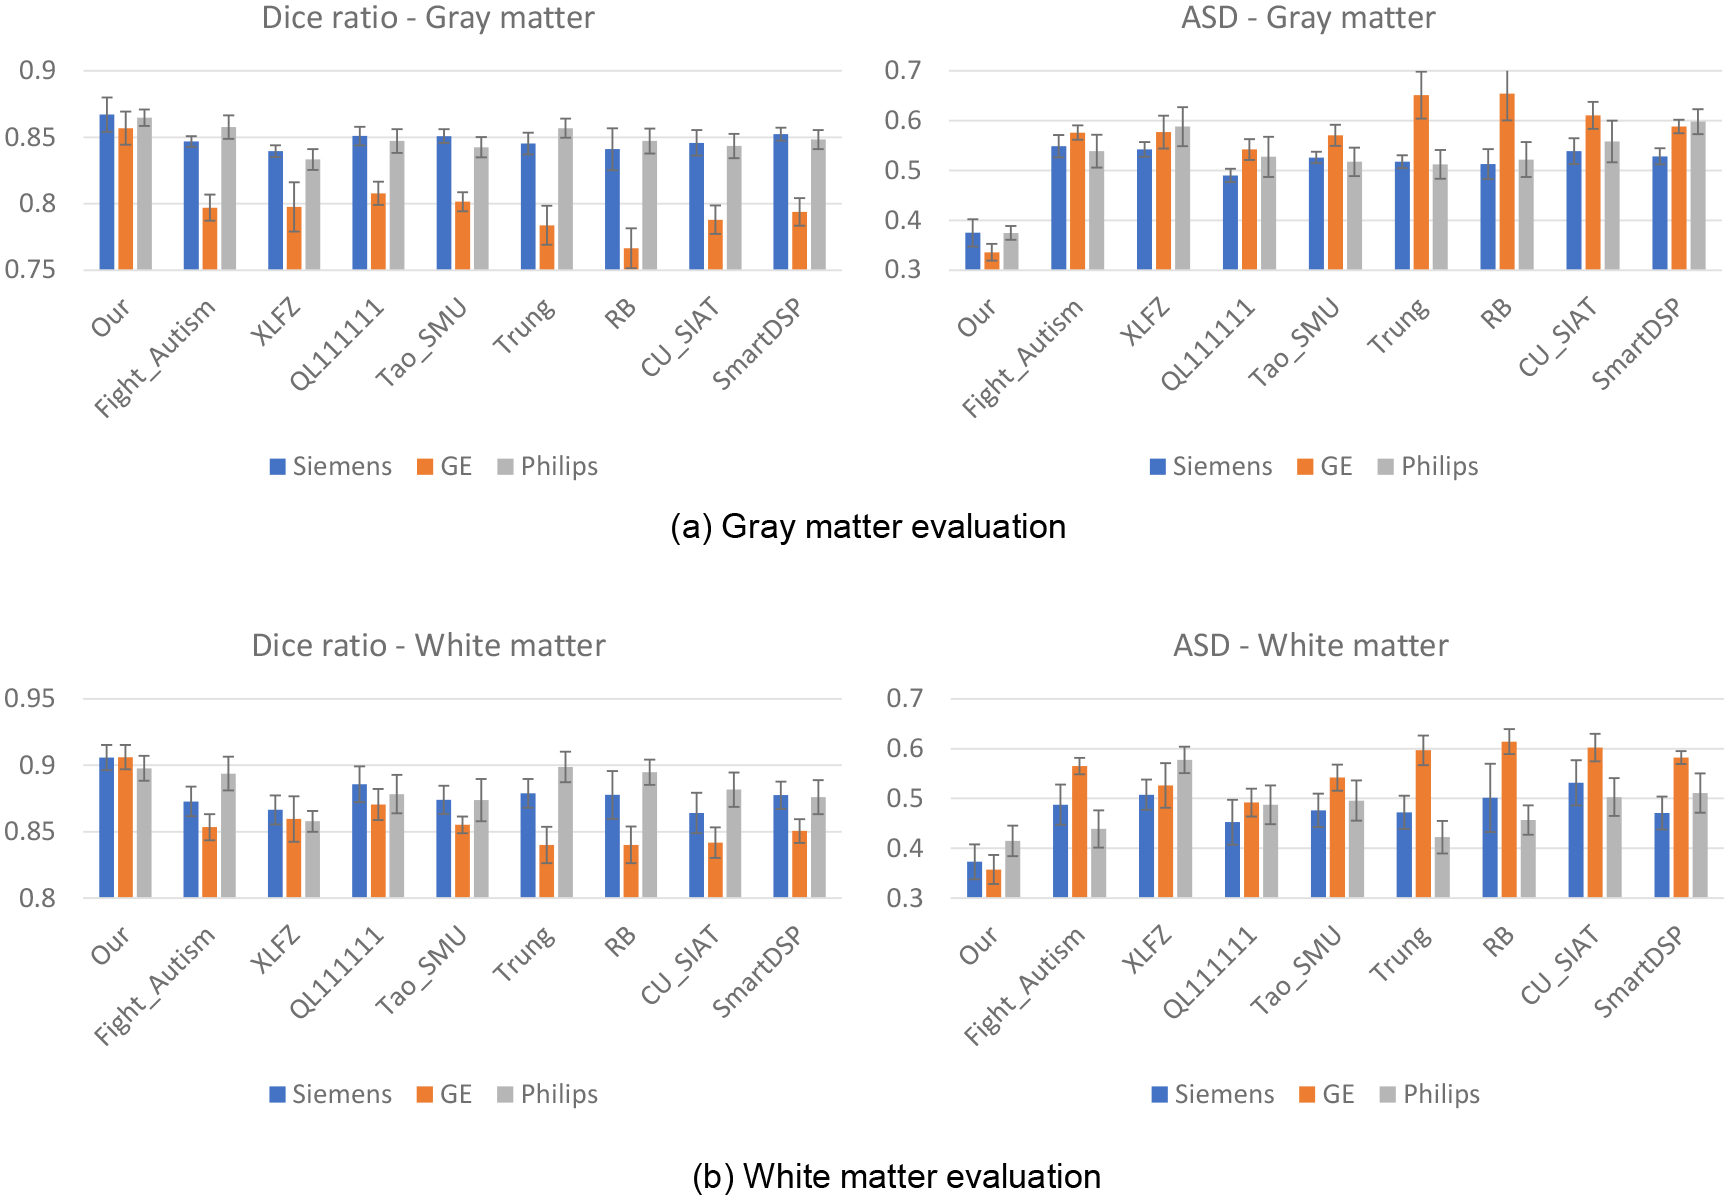
Quantitative evaluation of different methods on datasets from different scanners/protocols.
5.3.2. Evaluation using Multimodal Images
For many infant datasets, both T1w and T2w images are collected, which can provide complementary information for tissue segmentation. Therefore, we also test whether our pipeline works robustly and consistently with multimodal images. Specifically, for each brain, we fed 3 different combinations of T1w and T2w images, i.e., only T1w, only T2w, or both T1w and T2w, into our pipeline to generate corresponding segmentation results, which were then compared with manually labeled tissues for quantitative evaluation using the Dice ratio and ASD (L. Wang et al., 2019). Fig. 12 shows comparison results for the MSMS6 dataset. Only using T1w and only using T2w achieved comparably good segmentation performance, whereas the combination achieved even better results. Therefore, multimodal images are indeed beneficial for tissue segmentation.
Fig. 12.

Quantitative evaluation of the gray matter (GM) and white matter (WM) segmentation accuracy with different combinations of T1w and T2w images using two evaluation metrics.
5.3.3. Evaluation of Robustness to Motion Artifacts
For infant brain MRI studies, motion artifacts are frequently seen in acquired images, especially for older infants because it is difficult to keep them sleeping during scanning (Howell et al., 2019). Thus, it is naturally required that the processing pipeline tolerates motion artifacts. Therefore, we further evaluated our pipeline using images with motion artifacts. If a method is robust to the motion artifacts, it is expected that its segmentation result on a motion-free testing subject should be consistent with the segmentation result on the same subject with motion artifacts. To this end, we tested different methods on 5 testing subjects acquired at 24 months old. These 5 subjects are motion-free based on experts’ visual inspection and were manually labeled for evaluation. Then, we simulated motion with the popular K-space truncating and overlapping (Paschal & Morris, 2004; Zaitsev et al., 2015) with the following steps: 1) decomposing the MR images into the k-space; 2) overlapping the corresponding spectrum in the k-space; 3) reconstructing the MR images using the overlapped spectrum, thus simulating the images with motion artifacts. After that, we derived 5 motion-corrupted subjects. We applied Infant FreeSurfer, volBrain, FreeSurfer, FastSurfer, and our pipeline to the motion-free and motion-corrupted subjects to determine whether the segmentation results are consistent with manual labels. Fig. 13 shows representative segmentation results for one of 5 subjects with and without motion artifacts. Because the testing subject is a 24-month-old brain, all methods achieved reasonable segmentation results. The difference map between the segmentation results with and without motion artifacts for each method is shown in the last column of Fig. 13. The qualitative comparisons indicate that our results are highly consistent, supporting the robustness of our pipeline to motion artifacts. We further performed a quantitative evaluation as shown in Fig. 14. By comparing the performance gap between the results on the motion-free and motion-corrupted images, we find our method shows much better robustness to motion, with only a subtle performance drop in the Dice ratio and ASD, whereas for other methods, the performance for the motion-corrupted images shows a substantial decline.
Fig. 13.
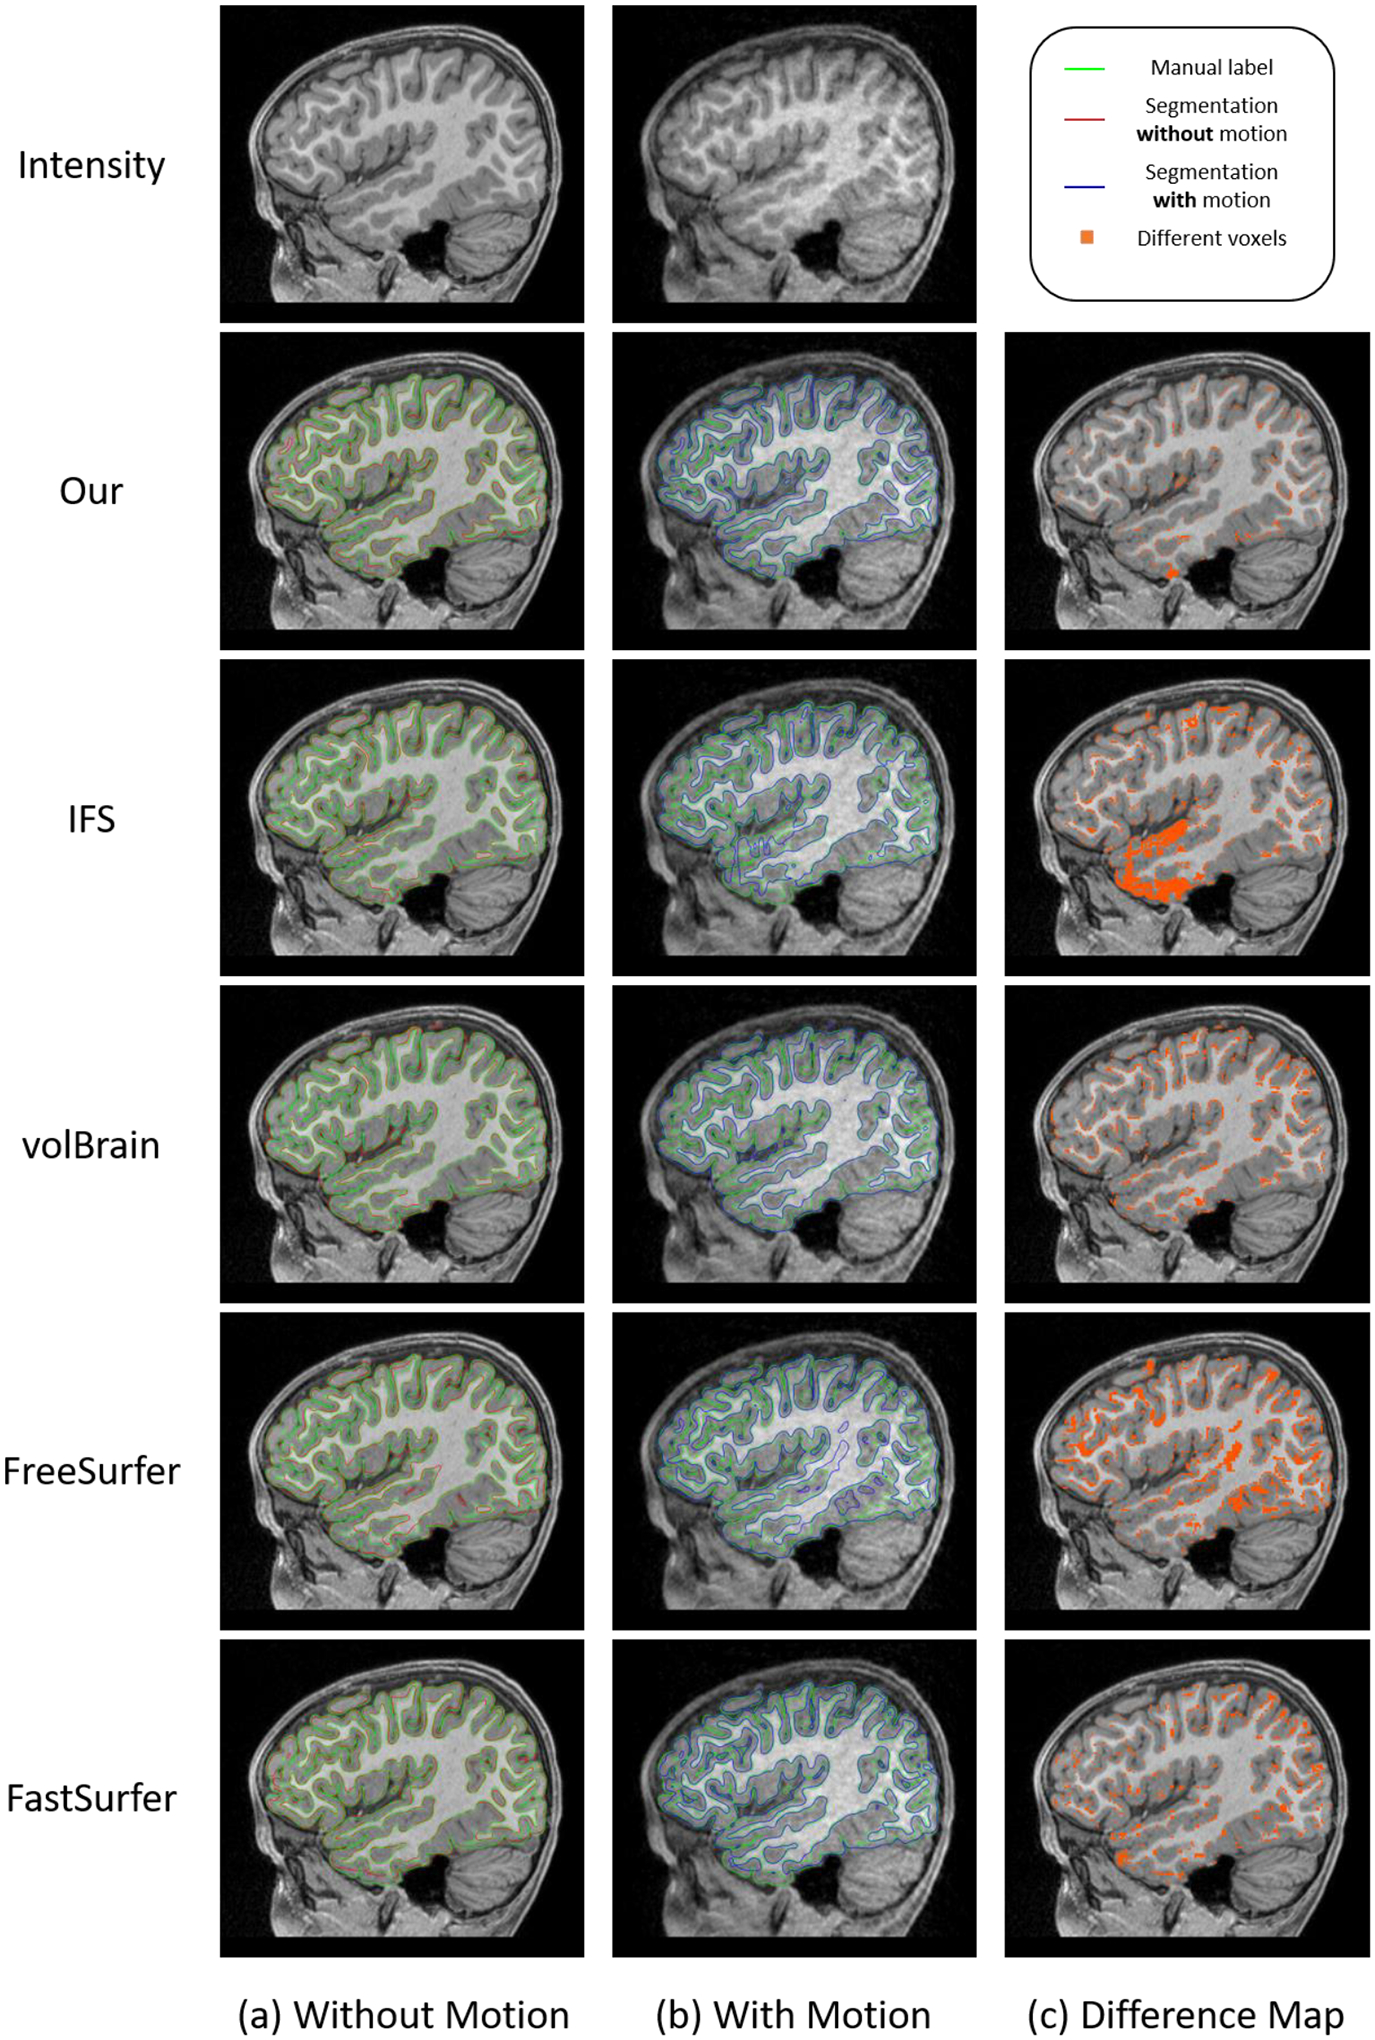
Comparison of segmentation results of typical pipelines for images with and without motion artifacts. (a) Results for images without motion artifacts. (b) Results for images with motion artifacts. (c) Difference maps of the segmentation results with and without motion artifacts.
Fig. 14.
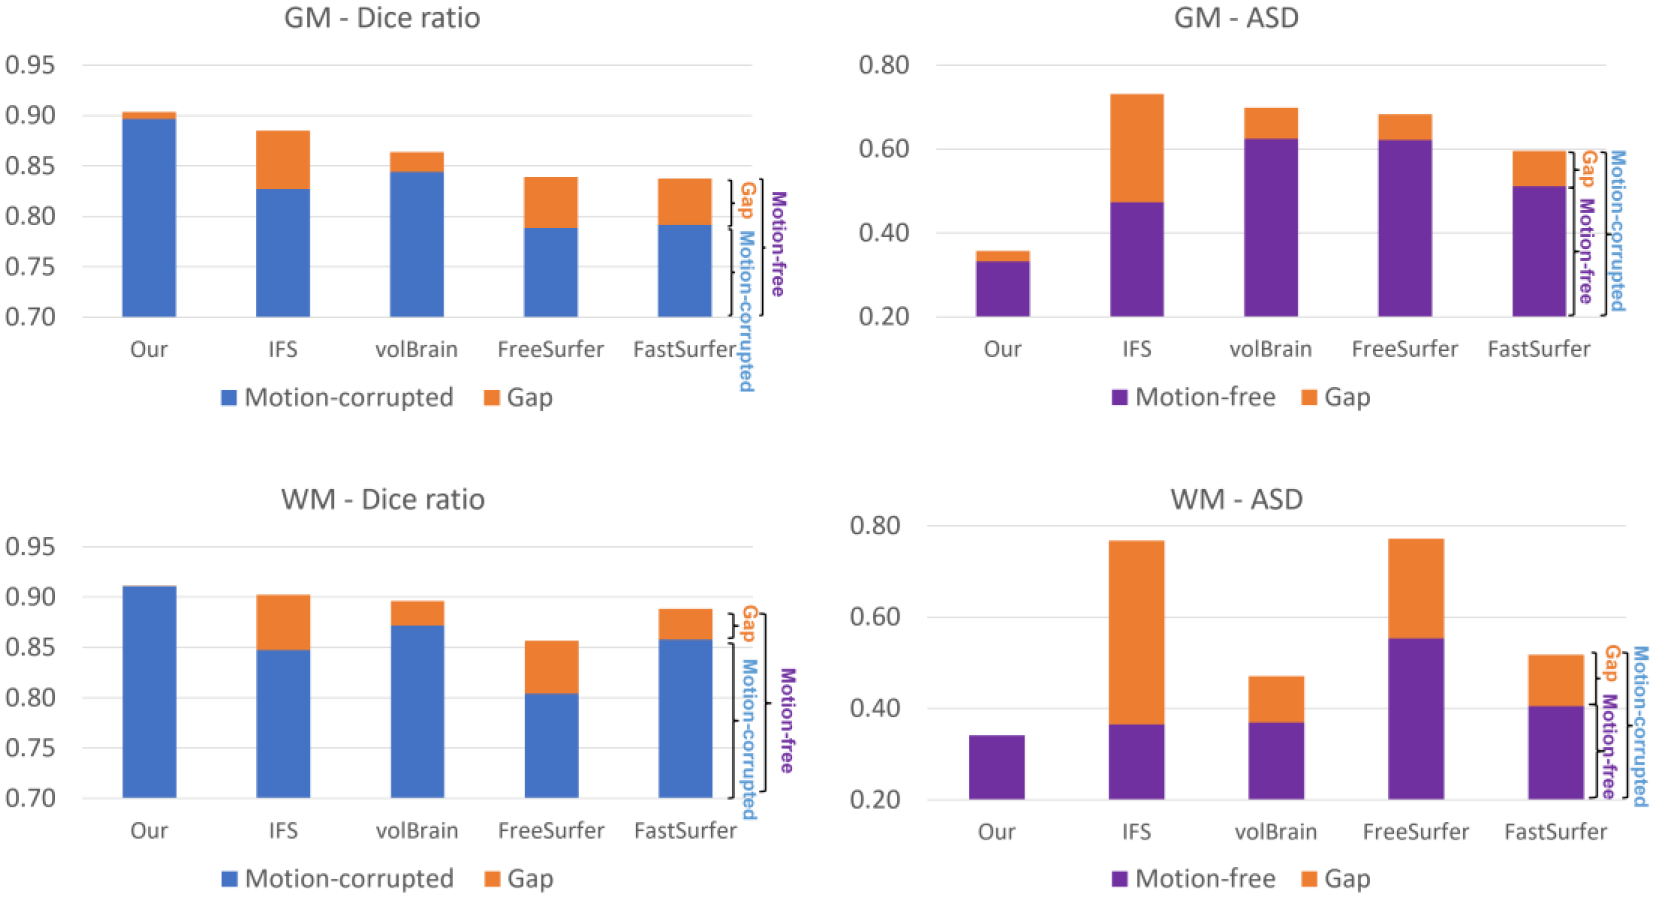
Quantitative comparison of different methods on motion-free and motion-corrupted images. For the Dice ratio metric, the value from motion-corrupted images is presented in blue and the performance gap between motion-free and motion-corrupted images is shown in orange; For the ASD metric, the value from motion-free images is presented in purple and the performance gap is shown in orange. Herein, the Dice ratio and the ASD are computed by considering the manual label as a reference.
5.3.4. Evaluation of Robustness of Motion Artifacts in different Modalities and Age Groups
Besides evaluating our pipeline with multimodal images at the age of 6 months and the robustness of the motion artifacts at age of 24 months, we have also validated our pipeline using motion-free/motion-corrupted images from different modalities and age groups. We hope this experiment can provide comprehensive insights for users to select the optimal modality images for infant brain analysis.
We randomly selected 30 scans from BCP dataset at 1, 6, 12, and 24 months of age under different modality combinations (T1w, T2w, and T1w+T2w). We first simulated the motion artifacts using the same strategy as in section 5.3.2. Then, we fed these images with simulated motion artifacts into our pipeline to derive the segmentation. After that, we can measure the pipeline performance in terms of motion artifacts by comparing the segmentation results (from motion-free images and motion-corrupted images) to the manual labels, respectively.
Fig. 15 shows the typical T1w images, T1w images with motions, and the segmentation (red contour) on T1w images with motions, compared to the manual ground truth (green contour) at different age groups. The stacked bar plot in Fig. 16 reports the comparison results. For the Dice ratio measurements of the GM and WM, the blue, purple, and green bars indicate the segmentation accuracy by different modality combinations on the motion-corrupted images (generally having lower Dice ratio), respectively. While the orange color indicates the accuracy gap between the results on the motion-free and the motion-corrupted images with the same modality configuration. For the ASD measurements of GM and WM, the blue, purple, and green bars indicate the segmentation accuracy by different modality combinations on the motion-free images (generally having lower ASD), respectively. While the orange color indicates the accuracy gap between the results on the motion-free and the motion-corrupted images with the same modality configuration.
Fig. 15.
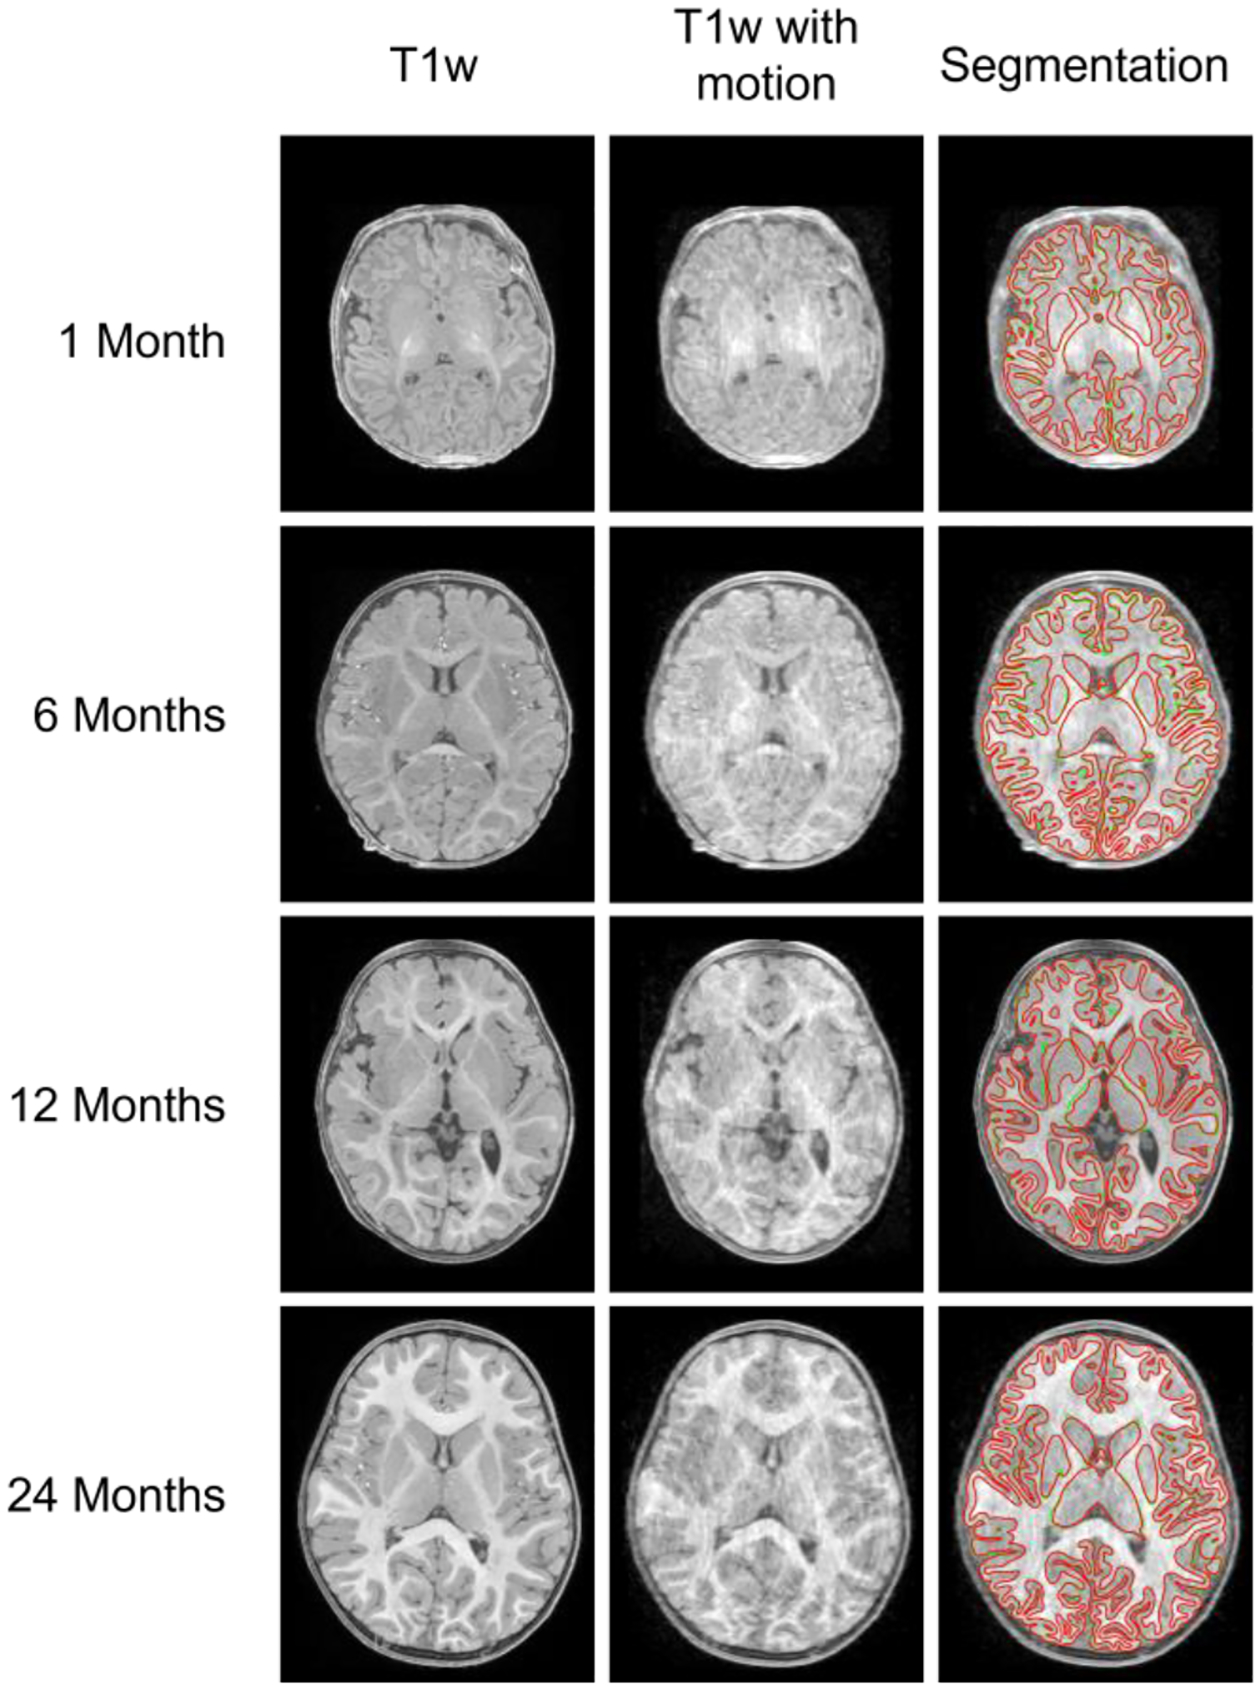
The T1w images (the first column), T1w images with motion (the second column), and the corresponding segmentation on T1w images with motion (with red contours indicating our segmentation, and the green contours indicating the manually labeled ground truth).
Fig. 16.
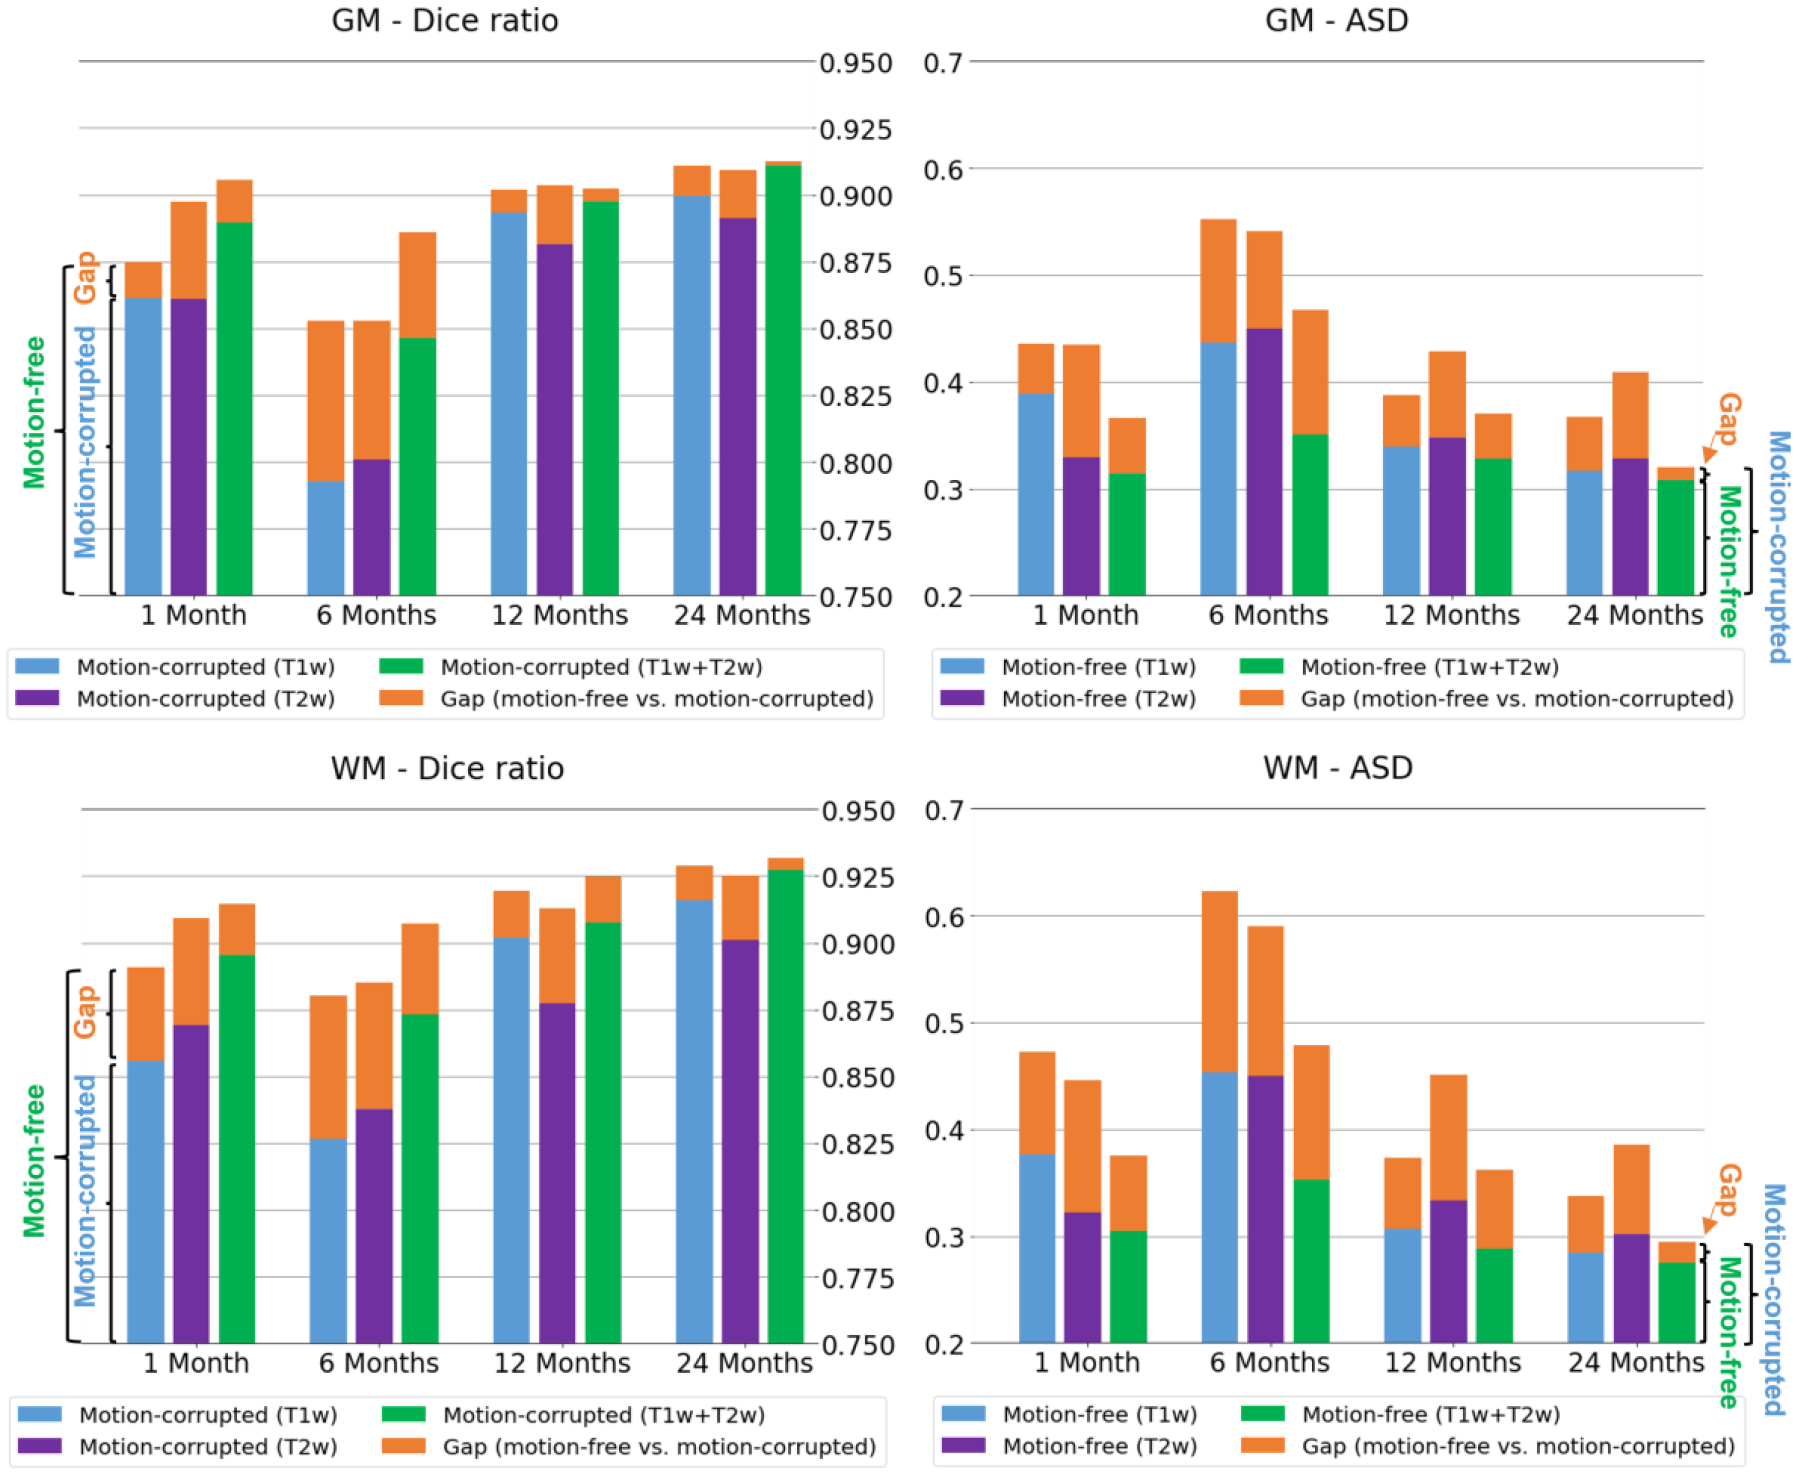
Quantitative comparison of segmentation differences (in terms of Dice ratio and Average Surface Distance (ASD) in mm) between motion-free and motion-corrupted images at 1, 6, 12, and 24 months of age.
From the modality perspective, before 3 months of age, the T2w modality achieves better segmentation performance than T1w modality, and it can even achieve comparable segmentation performance to the T1w+T2w modalities; At around 6 months of age, the T1w+T2w combined modalities have superior performance, compared to either the single T1w or T2w modality. After 1 year of age, the T1w, T2w and T1w+T2w modalities can achieve comparable segmentation performance.
From the motion robustness perspective, as we can see, a) our pipeline is very robust to the motion artifacts with different modality combinations at all ages, e.g., the Dice ratios of the GM and WM segmentation can reach over 85% at 1, 12 and 24 months even with the motion corruption. The performance at 6 months is slightly degraded, which is reasonable, because the tissue contrast is extremely low in this age group. b) The combined modalities (T1w + T2w) consistently have better segmentation performance compared to the single T1w or T2w modality when motion is present for all age groups, especially at age of 6 months.
5.3.5. Spatial Resolution Influence Evaluation
In different studies, the infant brain image can be acquired with different resolutions. Therefore, we have further validated of the spatial resolution influence on the segmentation using the BCP dataset. Specifically, we first down sample the BCP dataset to different resolutions, including 0.8×0.8×1.0 mm3, 1.0×1.0×1.0 mm3, 1.0×1.0×1.2 mm3, 1.0×1.0×1.5 mm3, 1.2×1.2×1.2 mm3, and 1.5×1.5×1.5 mm3, which are typically used in many infant brain studies. Then, we conduct the segmentation on the down sampled images using our pipeline and compare these segmentation results to the segmentation results on the original BCP dataset with an isotropic 0.8mm resolution.
Fig. 17 reports the comparison results at different resolutions. It can be seen the segmentation accuracy decreases as the resolution becomes coarse. Specifically, the segmentation on 0.8×0.8×1mm images has the most similar results with images with isotropic 0.8mm resolution, with the Dice ratio reaching around 0.97 for the gray matter and white matter. For the resolutions from 1.0×1.0×1.0 mm3 to 1.2×1.2×1.2 mm3, the Dice ratios are consistently close to 0.9, which drop significantly at the resolution 1.5×1.5×1.5 mm3. Therefore, based on the visual check of the segmentation and the quantitative evaluation, images with minimum 1.2mm resolution are recommended to get satisfactory processing results.
Fig. 17.

Quantitative comparison of segmentation differences using different image resolutions.
5.3.6. Image Contrast Influence Evaluation
During the early brain development, different brain regions exhibit different tissue contrasts due to the asynchronous maturation. Therefore, it would be very informative to provide the quantifications of the contrast and our pipeline segmentation performance in different brain regions. To achieve this objective, for the typical age groups of 1 month, 6 months, 12 months, and 24 months, we randomly selected 30 scans from the BCP dataset for each group for validation.
To quantify the contrast on T1w (or T2w) infant brain images, following the work in (Drakulich et al., 2021), we computed the intensity ratio of paracortical gray matter and white matter. Specifically, our pipeline has reconstructed the inner cortical surface (the boundary between the gray matter and the white matter), the outer surface (the boundary between the gray matter and the cerebrospinal fluid), and the middle cortical surface (the geometric center of the inner and outer cortical surfaces). Since the reconstructed cortical surfaces have the vertex-wise correspondence, for any vertex on the middle cortical surface, we can get the corresponding vertex on the inner cortical surface. Then, we deform each vertex inward along the opposite direction of the normal direction with the distance of its half cortical thickness and move the vertex into the white matter. After that, the intensity ratio of the gray matter vertex and the white matter vertex is computed as the contrast. The first two rows in Fig. 18 show the color-coded average contrast of the T1w and T2w images, averaging from the randomly selected 30 scans of each group. From the figure, different brain regions show different contrasts at different age groups. Particularly, at 6 months, both the T1w and T2w images have very low tissue contrast (where most vertices’ values are around 1) in the cortical regions.
Fig. 18.
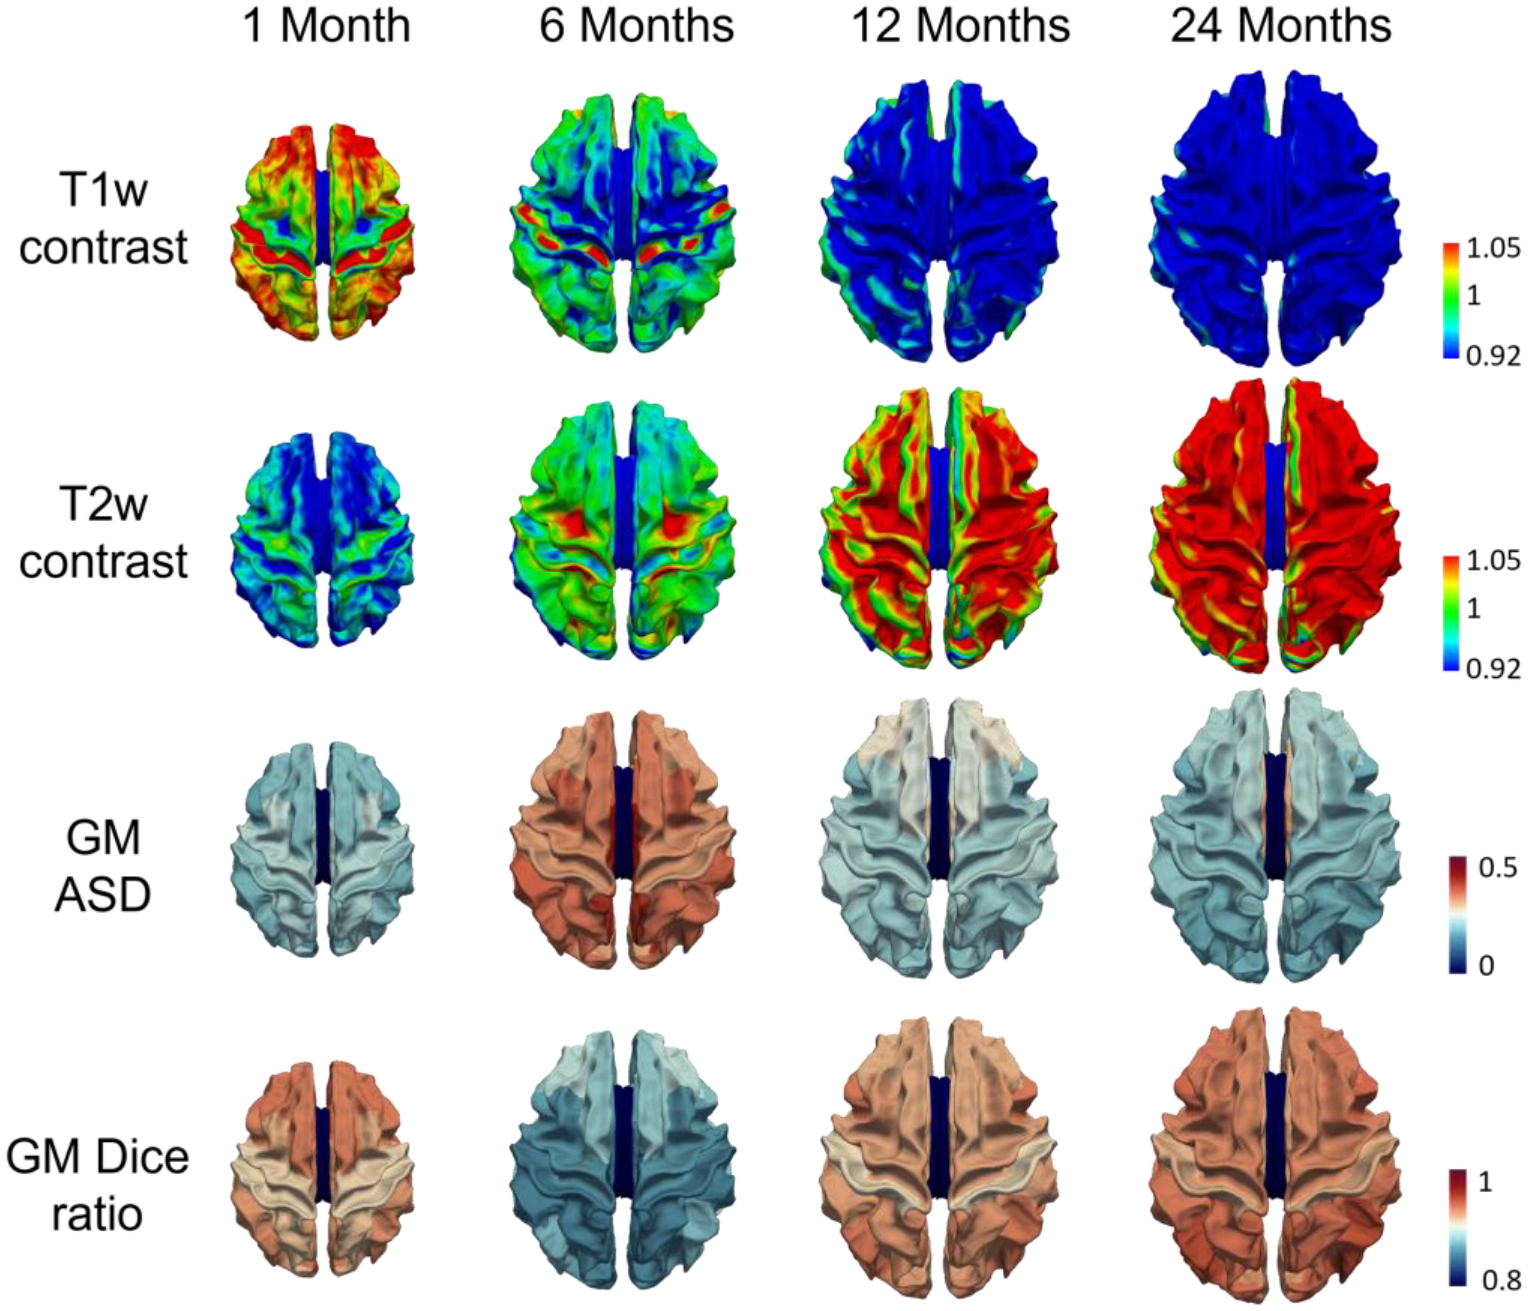
The tissue contrasts (values closing to 1 indicating low contrast) of different age groups on T1w (the first row) and T2w (the second row) images and the quantitative comparison of segmentation performance at different cortical regions (the third and fourth rows).
To evaluate the segmentation performance on different brain regions, we parcellated the cerebral cortex into 34 regions (using the Desikan-Killiany cortex parcellation protocol (Desikan et al., 2006)) for each hemisphere, by registering each reconstructed cortical surface onto the age-matched surface atlas (Wu et al., 2019) using the spherical demons (Yeo et al., 2010). We use the Desikan-Killiany parcellation protocol, because it is based on the sulci-gyri folding pattern, which has been established at term birth. Then, for each region, we evaluate the segmentation performance using the ASD (Average Surface Distance) and Dice ratio. The third and fourth rows in Fig. 18 show the color-coded average regional ASD and Dice ratio maps of the gray matter segmentation compared to the ground truth. From this figure, we can see that our pipeline consistently achieves accurate segmentation in most regions.
5.3.7. Cortical Surface Quality Evaluation
Small under- or over-segmentation errors in tissue maps can cause large cavities or lumps in the cortical folds, which are not well reflected by global evaluation metrics like DSC or ASD but could lead to inaccurate morphological measurements of the cerebral cortex. To verify the quality of cortical surfaces, three experts (with more than 5 years’ experiences on cortical surface analysis) visually inspected all of the reconstructed cortical surfaces from the BCP dataset. Each expert graded the reconstructed cortical surfaces using three scores, i.e., 1: Poor; 2; Fair; 3: Good. Score 3 indicates that the reconstructed cortical surface well represented the morphometry of the cerebral cortex, while score 1 indicates that the surface quality was poor and not useful.
Fig. 19 shows some typical examples of the reconstructed cortical surface of different quality levels, including poor, fair and good. Of note, the fair and good surfaces shown below are reconstructed from our pipeline, while the poor surfaces are not generated from our pipeline. They are merely for illustration purpose. From this figure, we can see that, a) poor surfaces have apparent wrong geometry (e.g., missing gyri or sulci) or topology, typically leading to inaccurate cortical measurements; b) for fair surfaces, most parts of the reconstructed surfaces are correct, while some small parts of gyri/sulci are missing; c) for good surfaces, the gyri and sulci are successfully reconstructed, from which, the cortical measurements, like the cortical thickness, sulcal depth, curvature, and local gyrification index, can be computed accurately.
Fig. 19.
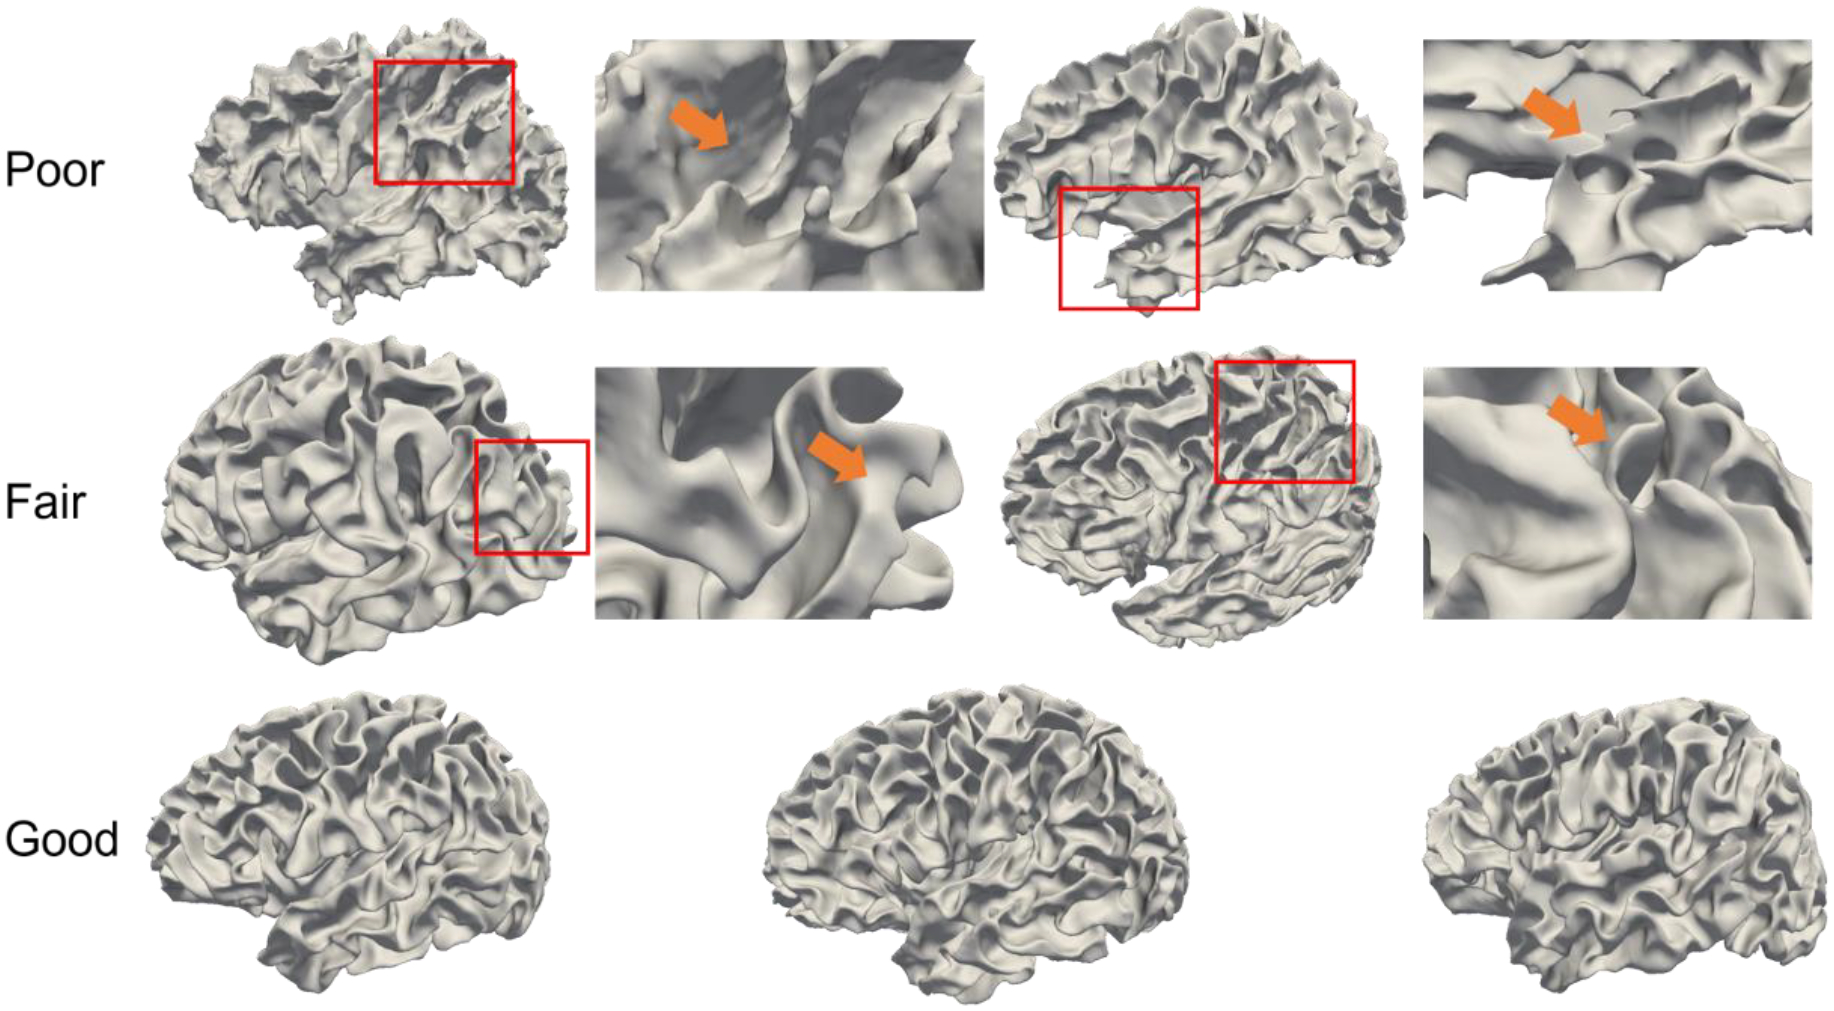
Typical reconstructed cortical surfaces with different levels of quality.
For each scan, the average score from the 3 experts was adopted as the final evaluation score. After evaluation, 598 scans out of the 623 total scans achieved a score of 3, while the remaining 25 scans achieved a score of 2. This suggests that our reconstructed cortical surfaces effectively represent the morphometry of developing infant brains.
5.4. Developmental Trajectory Comparison with Previous Studies
One of the major motivations for the infant MRI processing pipeline is to generate accurate quantitative measurements of infant brain development. With the accurate segmentation maps, we can measure the volume of the gray matter and white matter for the cerebrum. In addition, after cortical surfaces were reconstructed, we can compute the average cortical thickness and total cortical surface area. Their developmental trajectories can be used for the charting development pattern of a cohort. Fig. 20 shows the gray matter volume, white matter volume, cortical thickness, and the total cortical surface area of different scans at different ages from the BCP data set. From the figure, the gray matter increases about 3 times, while the white matter volume increases about 2 times from birth to the age of two years, respectively. The cortical thickness is projected to first increase rapidly from birth to reach a peak (around 14 months) and then slightly decrease thereafter; while the cortical surface area is projected to undergo a dramatic expansion in the first year followed by a continuous remarkable expansion with gradually reduced rates. These discoveries are not only consistent with previous findings using very sparse imaging time points (Li et al., 2013, 2015; Lyall et al., 2015; Nie et al., 2014; F. Wang et al., 2019), but also provide much more detailed developmental patterns, demonstrating the effectiveness of the proposed pipeline.
Fig. 20.
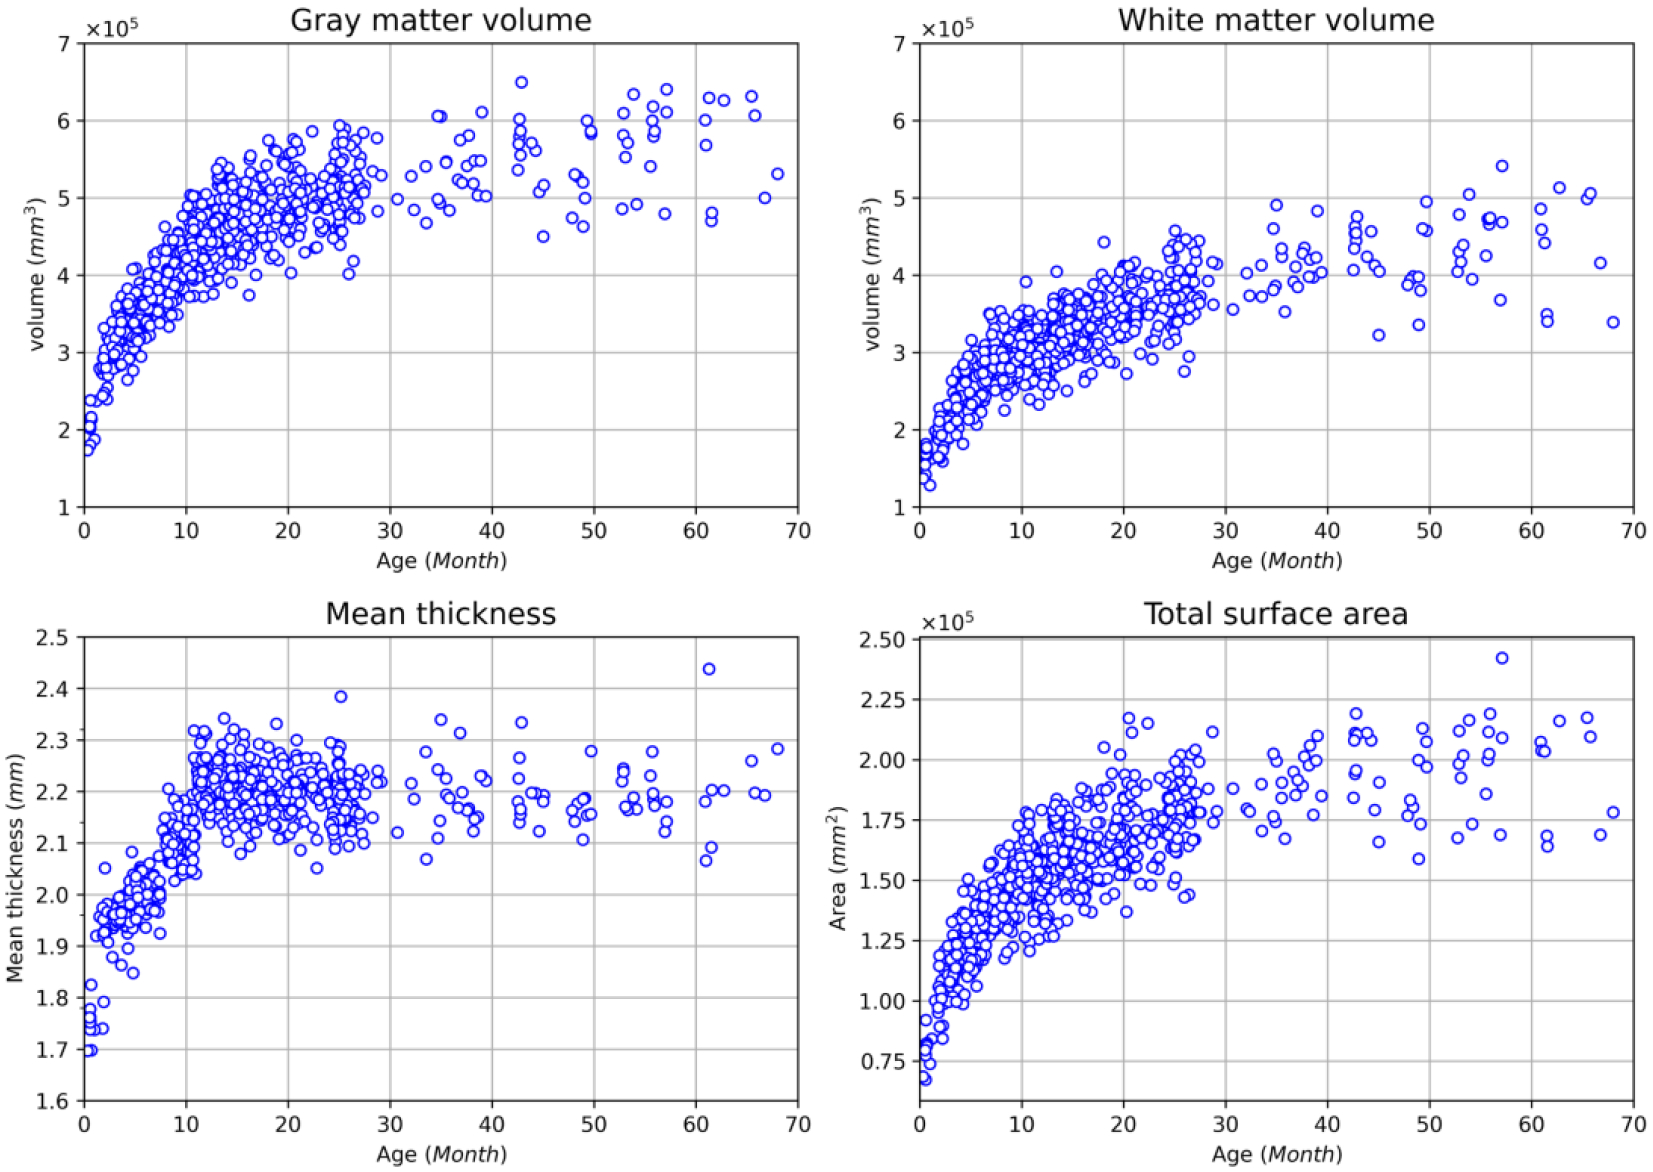
The developmental trajectories of the gray matter volume (mm3), white matter volume(mm3), the average cortical thickness (mm) and total cortical surface area (mm2) from the BCP dataset.
5.5. Computational Time
The running time of our pipeline is as follows. For the segmentation component (from skull-stripping to tissue segmentation), the average running time on a BCP scan is about 40 mins. For cortical surface reconstruction and measurement, the average running time is about 3 hours. In total, the pipeline takes about 4 hours to complete the processing for a single scan. The above computational time is measured on a PC with an i7-8700k CPU and an Nvidia Geforce 1080Ti GPU. By comparison, our pipeline is faster than other pipelines, which on average take about 6–9 hours on a BCP scan with the same PC.
6. Conclusions and Future Work
In this paper, we have presented a robust, widely applicable, deep learning-based, infant-dedicated cortical surface reconstruction pipeline, and we have extensively validated it using 16,000+ infant brain images acquired from different age groups and different imaging protocols and scanners worldwide. Our proposed pipeline leverages powerful deep learning techniques to overcome issues of extremely low and dynamic tissue contrast and includes training on multiple age-specific segmentation models in order to achieve accurate tissue segmentation results. Based on the accurately segmented brain tissues, we reconstructed topologically correct and geometrically accurate cortical surfaces using a deformable surface method. Then, with the reconstructed cortical surfaces, we computed multiple biologically meaningful cortical measurements for characterizing infant brain development. Compared to other state-of-the-art infant MRI processing pipelines, our pipeline is significantly more accurate for reconstructing and measuring early developing cerebral cortex, especially for the first postnatal year.
Currently, our pipeline has two limitations. a) We have not included the subcortical structure and the cerebellum segmentation components. For the subcortical structure segmentation, we are actively developing and have achieved some promising results (please refer to the supplementary files for more details). After intensive validation, we will incorporate this part into our pipeline too. For the cerebellum, we are also developing dedicated segmentation tools. b) We have not incorporated the longitudinal consistency constraints when dealing with longitudinal scans, which are generally required for longitudinal studies. In the future, we will continue working on this pipeline refinement and our plan is to have a longitudinally-consistent lifespan brain imaging computation pipeline for the cerebral cortex, subcortex, and cerebellum.
Supplementary Material
Acknowledgment
This work was partially supported by NIH grants (MH116225, MH117943, MH109773, and MH123202). This work also utilizes approaches developed by an NIH grant (1U01MH110274) and the efforts of the UNC/UMN Baby Connectome Project Consortium. The authors would also like to thank Dr. Dinggang Shen for an initial discussion of this work when he was with the University of North Carolina at Chapel Hill.
Footnotes
More details are provided in the supplementary files.
References
- Dale AM, Fischl B, & Sereno MI (1999). Cortical surface-based analysis: I. Segmentation and surface reconstruction. NeuroImage, 9(2), 179–194. 10.1006/nimg.1998.0395 [DOI] [PubMed] [Google Scholar]
- Desikan RS, Ségonne F, Fischl B, Quinn BT, Dickerson BC, Blacker D, Buckner RL, Dale AM, Maguire RP, & Hyman BT (2006). An automated labeling system for subdividing the human cerebral cortex on MRI scans into gyral based regions of interest. Neuroimage, 31(3), 968–980. [DOI] [PubMed] [Google Scholar]
- Drakulich S, Thiffault AC, Olafson E, Parent O, Labbe A, Albaugh MD, Khundrakpam B, Ducharme S, Evans A, Chakravarty MM, & Karama S (2021). Maturational trajectories of pericortical contrast in typical brain development. NeuroImage, 235. 10.1016/j.neuroimage.2021.117974 [DOI] [PMC free article] [PubMed] [Google Scholar]
- Ellis CT, Yates TS, Skalaban LJ, Bejjanki VR, Arcaro MJ, & Turk-Browne NB (2021). Retinotopic organization of visual cortex in human infants. Neuron, 109(16), 2616–2626.e6. 10.1016/j.neuron.2021.06.004 [DOI] [PubMed] [Google Scholar]
- Fischl B, Sereno MI, & Dale AM (1999). Cortical surface-based analysis: II. Inflation, flattening, and a surface-based coordinate system. NeuroImage, 9(2), 195–207. 10.1006/nimg.1998.0396 [DOI] [PubMed] [Google Scholar]
- Garcia KE, Robinson EC, Alexopoulos D, Dierker DL, Glasser MF, Coalson TS, Ortinau CM, Rueckert D, Taber LA, Van Essen DC, Rogers CE, Smysere CD, & Bayly PV (2018). Dynamic patterns of cortical expansion during folding of the preterm human brain. Proceedings of the National Academy of Sciences of the United States of America, 115(12), 3156–3161. 10.1073/pnas.1715451115 [DOI] [PMC free article] [PubMed] [Google Scholar]
- Gilmore JH, Knickmeyer RC, & Gao W (2018). Imaging structural and functional brain development in early childhood. Nature Reviews Neuroscience, 19(3), 123–137. 10.1038/nrn.2018.1 [DOI] [PMC free article] [PubMed] [Google Scholar]
- Glasser MF, Sotiropoulos SN, Wilson JA, Coalson TS, Fischl B, Andersson JL, Xu J, Jbabdi S, Webster M, Polimeni JR, Van Essen DC, & Jenkinson M (2013). The minimal preprocessing pipelines for the Human Connectome Project. NeuroImage, 80, 105–124. 10.1016/j.neuroimage.2013.04.127 [DOI] [PMC free article] [PubMed] [Google Scholar]
- Grotheer M, Rosenke M, Wu H, Kular H, Querdasi FR, Natu VS, Yeatman JD, & Grill-Spector K (2022). White matter myelination during early infancy is linked to spatial gradients and myelin content at birth. Nature Communications, 13(1), 1–12. 10.1038/s41467-022-28326-4 [DOI] [PMC free article] [PubMed] [Google Scholar]
- Hagler DJ, Hatton SN, Cornejo MD, Makowski C, Fair DA, Dick AS, Sutherland MT, Casey BJ, Barch DM, Harms MP, Watts R, Bjork JM, Garavan HP, Hilmer L, Pung CJ, Sicat CS, Kuperman J, Bartsch H, Xue F, … Dale AM (2019). Image processing and analysis methods for the Adolescent Brain Cognitive Development Study. NeuroImage, 202, 116091. 10.1016/j.neuroimage.2019.116091 [DOI] [PMC free article] [PubMed] [Google Scholar]
- Henschel L, Conjeti S, Estrada S, Diers K, Fischl B, & Reuter M (2020). FastSurfer - A fast and accurate deep learning based neuroimaging pipeline. NeuroImage, 219, 117012. 10.1016/j.neuroimage.2020.117012 [DOI] [PMC free article] [PubMed] [Google Scholar]
- Howell BR, Styner MA, Gao W, Yap PT, Wang L, Baluyot K, Yacoub E, Chen G, Potts T, Salzwedel A, Li G, Gilmore JH, Piven J, Smith JK, Shen D, Ugurbil K, Zhu H, Lin W, & Elison JT (2019). The UNC/UMN Baby Connectome Project (BCP): An overview of the study design and protocol development. NeuroImage, 185, 891–905. 10.1016/j.neuroimage.2018.03.049 [DOI] [PMC free article] [PubMed] [Google Scholar]
- Hu D, Wang F, Zhang H, Wu Z, Zhou Z, Li G, Wang L, Lin W, & Li G (2022). Existence of Functional Connectome Fingerprint during Infancy and Its Stability over Months. The Journal of Neuroscience : The Official Journal of the Society for Neuroscience, 42(3), 377–389. 10.1523/JNEUROSCI.0480-21.2021 [DOI] [PMC free article] [PubMed] [Google Scholar]
- Jenkinson M, Bannister P, Brady M, & Smith S (2002). Improved Optimization for the Robust and Accurate Linear Registration and Motion Correction of Brain Images. NeuroImage, 17(2), 825–841. 10.1006/nimg.2002.1132 [DOI] [PubMed] [Google Scholar]
- Jenkinson M, & Smith S (2001). A global optimisation method for robust affine registration of brain images. Medical Image Analysis, 5(2), 143–156. 10.1016/S1361-8415(01)00036-6 [DOI] [PubMed] [Google Scholar]
- Jiang W, Merhar SL, Zeng Z, Zhu Z, Yin W, Zhou Z, Wang L, He L, Vannest J, & Lin W (2022). Neural alterations in opioid-exposed infants revealed by edge-centric brain functional networks. Brain Communications, 4(3). 10.1093/BRAINCOMMS/FCAC112 [DOI] [PMC free article] [PubMed] [Google Scholar]
- Li G, Lin W, Gilmore JH, & Shen D (2015). Spatial patterns, longitudinal development, and hemispheric asymmetries of cortical thickness in infants from birth to 2 years of age. Journal of Neuroscience, 35(24), 9150–9162. 10.1523/JNEUROSCI.4107-14.2015 [DOI] [PMC free article] [PubMed] [Google Scholar]
- Li G, Nie J, Wang L, Shi F, Lin W, Gilmore JH, & Shen D (2013). Mapping region-specific longitudinal cortical surface expansion from birth to 2 years of age. Cerebral Cortex, 23(11), 2724–2733. 10.1093/cercor/bhs265 [DOI] [PMC free article] [PubMed] [Google Scholar]
- Li G, Wang L, Shi F, Lyall AE, Lin W, Gilmore JH, & Shen D (2014). Mapping longitudinal development of local cortical gyrification in infants from birth to 2 years of age. Journal of Neuroscience, 34(12), 4228–4238. 10.1523/JNEUROSCI.3976-13.2014 [DOI] [PMC free article] [PubMed] [Google Scholar]
- Li G, Wang L, Yap PT, Wang F, Wu Z, Meng Y, Dong P, Kim J, Shi F, Rekik I, Lin W, & Shen D (2019). Computational neuroanatomy of baby brains: A review. NeuroImage, 185, 906–925. 10.1016/j.neuroimage.2018.03.042 [DOI] [PMC free article] [PubMed] [Google Scholar]
- Lyall AE, Shi F, Geng X, Woolson S, Li G, Wang L, Hamer RM, Shen D, & Gilmore JH (2015). Dynamic Development of Regional Cortical Thickness and Surface Area in Early Childhood. Cerebral Cortex, 25(8), 2204–2212. 10.1093/cercor/bhu027 [DOI] [PMC free article] [PubMed] [Google Scholar]
- Makropoulos A, Robinson EC, Schuh A, Wright R, Fitzgibbon S, Bozek J, Counsell SJ, Steinweg J, Vecchiato K, Passerat-Palmbach J, Lenz G, Mortari F, Tenev T, Duff EP, Bastiani M, Cordero-Grande L, Hughes E, Tusor N, Tournier JD, … Rueckert D (2018). The developing human connectome project: A minimal processing pipeline for neonatal cortical surface reconstruction. Neuroimage, 173, 88–112. 10.1016/j.neuroimage.2018.01.054 [DOI] [PMC free article] [PubMed] [Google Scholar]
- Na X, Phelan NE, Tadros MR, Wu Z, Andres A, Badger TM, Glasier CM, Ramakrishnaiah RR, Rowell AC, Wang L, Li G, Williams DK, & Ou X (2021). Maternal Obesity during Pregnancy is Associated with Lower Cortical Thickness in the Neonate Brain. American Journal of Neuroradiology. 10.3174/ajnr.a7316 [DOI] [PMC free article] [PubMed] [Google Scholar]
- Natu VS, Rosenke M, Wu H, Querdasi FR, Kular H, Lopez-Alvarez N, Grotheer M, Berman S, Mezer AA, & Grill-Spector K (2021). Infants’ cortex undergoes microstructural growth coupled with myelination during development. Communications Biology, 4(1), 1–12. 10.1038/s42003-021-02706-w [DOI] [PMC free article] [PubMed] [Google Scholar]
- Nie J, Li G, Wang L, Shi F, Lin W, Gilmore JH, & Shen D (2014). Longitudinal development of cortical thickness, folding, and fiber density networks in the first 2 years of life. Human Brain Mapping, 35(8), 3726–3737. 10.1002/hbm.22432 [DOI] [PMC free article] [PubMed] [Google Scholar]
- Paschal CB, & Morris HD (2004). K-Space in the Clinic. In Journal of Magnetic Resonance Imaging (Vol. 19, Issue 2, pp. 145–159). John Wiley & Sons, Ltd. 10.1002/jmri.10451 [DOI] [PubMed] [Google Scholar]
- Robinson EC, Jbabdi S, Glasser MF, Andersson J, Burgess GC, Harms MP, Smith SM, Van Essen DC, & Jenkinson M (2014). MSM: A new flexible framework for multimodal surface matching. NeuroImage, 100, 414–426. 10.1016/j.neuroimage.2014.05.069 [DOI] [PMC free article] [PubMed] [Google Scholar]
- Shaw P, Greenstein D, Lerch J, Clasen L, Lenroot R, Gogtay N, Evans A, Rapoport J, & Giedd J (2006). Intellectual ability and cortical development in children and adolescents. Nature, 440(7084), 676–679. 10.1038/nature04513 [DOI] [PubMed] [Google Scholar]
- Sled JG, Zijdenbos AP, & Evans AC (1998). A nonparametric method for automatic correction of intensity nonuniformity in mri data. IEEE Transactions on Medical Imaging, 17(1), 87–97. 10.1109/42.668698 [DOI] [PubMed] [Google Scholar]
- Sun L, Zhang D, Lian C, Wang L, Wu Z, Shao W, Lin W, Shen D, & Li G (2019). Topological correction of infant white matter surfaces using anatomically constrained convolutional neural network. NeuroImage, 198, 114–124. 10.1016/j.neuroimage.2019.05.037 [DOI] [PMC free article] [PubMed] [Google Scholar]
- Sun Y, Gao K, Wu Z, Li G, Zong X, Lei Z, Wei Y, Ma J, Yang X, Feng X, Zhao L, Le Phan T, Shin J, Zhong T, Zhang Y, Yu L, Li C, Basnet R, Omair Ahmad M, … Wang L (2021). Multi-Site Infant Brain Segmentation Algorithms: The iSeg-2019 Challenge. IEEE Transactions on Medical Imaging, 40(5), 1363–1376. 10.1109/TMI.2021.3055428 [DOI] [PMC free article] [PubMed] [Google Scholar]
- Tustison NJ, Avants BB, Cook PA, Zheng Y, Egan A, Yushkevich PA, & Gee JC (2010). N4ITK: Improved N3 bias correction. IEEE Transactions on Medical Imaging, 29(6), 1310–1320. 10.1109/TMI.2010.2046908 [DOI] [PMC free article] [PubMed] [Google Scholar]
- Wang F, Lian C, Wu Z, Zhang H, Li T, Meng Y, Wang L, Lin W, Shen D, & Li G (2019). Developmental topography of cortical thickness during infancy. Proceedings of the National Academy of Sciences of the United States of America, 116(32), 15855–15860. 10.1073/pnas.1821523116 [DOI] [PMC free article] [PubMed] [Google Scholar]
- Wang L, Gao Y, Shi F, Li G, Gilmore JH, Lin W, & Shen D (2015). LINKS: Learning-based multi-source IntegratioN frameworK for Segmentation of infant brain images. NeuroImage, 108, 160–172. 10.1016/j.neuroimage.2014.12.042 [DOI] [PMC free article] [PubMed] [Google Scholar]
- Wang L, Nie D, Li G, Puybareau E, Dolz J, Zhang Q, Wang F, Xia J, Wu Z, Chen J, Thung K-H, Bui DT, Shin J, Zeng G, Zheng G, Fonov VS, Doyle A, Xu Y, Moeskops P, … Shen D (2019). Benchmark on Automatic Six-Month-Old Infant Brain Segmentation Algorithms: The iSeg-2017 Challenge. IEEE Transactions on Medical Imaging, 38(9), 2219–2230. 10.1109/tmi.2019.2901712 [DOI] [PMC free article] [PubMed] [Google Scholar]
- Wang Y, Hu D, Wu Z, Wang L, Huang W, & Li G (2022). Developmental Abnormalities of Structural Covariance Networks of Cortical Thickness and Surface Area in Autistic Infants within the First 2 Years. Cerebral Cortex. 10.1093/cercor/bhab448 [DOI] [PMC free article] [PubMed] [Google Scholar]
- Wu Z, Wang L, Lin W, Gilmore JH, Li G, & Shen D (2019). Construction of 4D infant cortical surface atlases with sharp folding patterns via spherical patch-based group-wise sparse representation. Human Brain Mapping, 40(13), 3860–3880. 10.1002/hbm.24636 [DOI] [PMC free article] [PubMed] [Google Scholar]
- Yeo BTT, Sabuncu MR, Vercauteren T, Ayache N, Fischl B, & Golland P (2010). Spherical demons: Fast diffeomorphic landmark-free surface registration. IEEE Transactions on Medical Imaging, 29(3), 650–668. 10.1109/TMI.2009.2030797 [DOI] [PMC free article] [PubMed] [Google Scholar]
- Zaitsev M, Maclaren J, & Herbst M (2015). Motion artifacts in MRI: A complex problem with many partial solutions. In Journal of Magnetic Resonance Imaging (Vol. 42, Issue 4, pp. 887–901). John Wiley & Sons, Ltd. 10.1002/jmri.24850 [DOI] [PMC free article] [PubMed] [Google Scholar]
- Zhao F, Wu Z, Wang F, Lin W, Xia S, Shen D, Wang L, & Li G (2021). S3Reg: Superfast Spherical Surface Registration Based on Deep Learning. IEEE Transactions on Medical Imaging. 10.1109/TMI.2021.3069645 [DOI] [PMC free article] [PubMed] [Google Scholar]
- Zhao F, Wu Z, Wang L, Lin W, Gilmore JH, Xia S, Shen Di., & Li G (2021). Spherical Deformable U-Net: Application to Cortical Surface Parcellation and Development Prediction. IEEE Transactions on Medical Imaging, 40(4), 1217–1228. 10.1109/TMI.2021.3050072 [DOI] [PMC free article] [PubMed] [Google Scholar]
- Zöllei L, Iglesias JE, Ou Y, Grant PE, & Fischl B (2020). Infant FreeSurfer: An automated segmentation and surface extraction pipeline for T1-weighted neuroimaging data of infants 0–2 years. NeuroImage, 218, 116946. 10.1016/j.neuroimage.2020.116946 [DOI] [PMC free article] [PubMed] [Google Scholar]
Associated Data
This section collects any data citations, data availability statements, or supplementary materials included in this article.


