Objective:
Ovarian hyperstimulation syndrome (OHSS) is a frequent iatrogenic complication that arises during assisted reproduction and accounts for approximately 30% of all in vitro fertilization cycles. Using high-throughput sequencing, we investigated the peripheral blood transcriptome of patients with OHSS.
Methods:
Peripheral blood samples were obtained from 15 patients in each of the OHSS high-risk and low-risk groups on the ovum pick-up day. Subsequently, high-throughput sequencing was used to obtain the peripheral blood transcriptomes of five patients each from the high- and low-risk groups. Bioinformatic tools were used for mRNA expression profile mapping and screening of differentially expressed genes (DEGs). Bioinformatics techniques were also implemented in the Kyoto Encyclopedia of Genes Genomes (KEGG) signal pathway, Gene Ontology (GO) function, and protein–protein interaction (PPI) network analyses of DEGs.
Results:
A total of 20,031 genes were identified and 148 were found to be differentially expressed (P <0.05, |log2FC| > 0.58), with 52 upregulated and 96 downregulated genes. GO and KEGG analyses indicated that these genes were involved in extracellular corpuscles (GO: 0070062), plasma membrane (GO: 0005886), extracellular regions (GO: 0005576), immune system response (GO: 0006955), PI3K-Akt signaling pathways (hsa04151), cell adhesion molecules (CAMs, hsa04514), focal adhesion (hsa04510), and complement and coagulation cascades (hsa04610). The PPI network and realtime fluorescence quantitative polymerase chain reaction (qPCR) verification predicted that complement C3, von Willebrand factor, and vascular cell adhesion protein 1 proteins are highly implicated in OHSS and may serve as potential biomarkers for future OHSS studies.
Conclusion:
Transcriptome analysis revealed several DEGs related to OHSS risk factors in the peripheral blood, indicating that these DEGs may be novel players in OHSS development.
Keywords: Ovarian hyperstimulation syndrome, Transcriptome, High-throughput sequencing
Introduction
Approximately 8% of the world’s population is infertile and requires assisted reproductive technology (ART)[1,2]. The most common iatrogenic complication, ovarian hyperstimulation syndrome (OHSS), develops as a result of the controlled ovarian hyperstimulation that occurs during ART[3,4]. The severity of the disease varies greatly depending on its clinical presentation. According to disease severity, OHSS patients range from mild, moderate, to severe, with 30% of cases having mild and moderate OHSS and 3% cases having severe OHSS[5–7]. Elevated vascular permeability, ovarian enlargement, ascites, and high levels of 17 β-estradiol (E2) are all major clinical characteristics of OHSS[8,9]. Other symptoms include blood concentration, hydrothorax, liver and kidney damage, thrombosis, and adult respiratory distress syndrome, which can be fatal in severe cases. After ovarian stimulation, multiple follicles generate vascular endothelial growth factor (VEGF), which plays an essential role in inducing vascular permeability in patients and is considered a primary cause of OHSS[10–13].
Several important advancements in molecular biology techniques, such as high-throughput sequencing, which may rapidly collect a huge amount of data in a single sequencing, have occurred during the last decade. We can now better understand the process of gene expression using this technology[14,15]. High-throughput sequencing techniques, in particular, may be used to obtain specific information such as transcriptome data, non-coding RNA sequencing data, alternate splicing, and the discovery of novel transcripts[15,16]. Similarly, high-throughput sequencing has played a significant role in OHSS research. For example, Lin et al. used high-throughput sequencing to describe a series of long-chain non-coding RNAs in follicular fluid samples from patients with OHSS[17]. There have been no reports on transcriptional variations in the most prevalent phenotypes, such as the blood of patients with OHSS.
In this study, patients with OHSS were classified into two groups, high-risk and low-risk, based on their E2 levels on the day of human chorionic gonadotropin (hCG), serum anti-Müllerian hormone (AMH), and the number of retrieved oocytes. On the day of oocyte retrieval, peripheral blood samples were collected from 15 patients from each group. Transcriptome sequencing was performed on five high-risk patients with moderate OHSS and five low-risk patients who did not develop OHSS, and bioinformatics tools were used to determine abnormal mRNA expression, detect hub mRNAs, analyze Gene Ontology (GO) terms and Kyoto Encyclopedia of Genes Genomes (KEGG) pathways, and determine the clinical significance of the occurrence of OHSS. Bioinformatic approaches have also been utilized to identify new biomarkers that would aid in future OHSS research.
Materials and methods
General information
Samples and their primary clinical data were obtained at the Reproductive Medicine Center of Gansu Provincial Maternity and Child-Care Hospital between January 2018 and May 2019. All infertility patients were treated with in vitro fertilization and met the following criteria: 20–35 years of age, GnRH agonist long regimen or GnRH antagonist regimen, no concurrent inflammatory disease, laparoscopic and hysteroscopic confirmation of tubal infertility or male infertility, and non-polycystic ovary syndrome (PCOS). Women with malignant tumors, benign ovarian cysts, allergic diseases, pelvic inflammatory disease, or known chronic, systemic, metabolic, or endocrine disease conditions were excluded from the current study (except PCOS). Patients in the high-risk OHSS category had additional criteria of having serum AMH >5 ng/mL, serum E2 on the day of hCG >3500 pg/mL, and > 20 retrieved oocytes whereas the control group included patients with low-risk OHSS who met the criteria of having serum E2 on the day of hCG <3500 pg/mL and <20 retrieved oocytes. The above-mentioned criteria refer to Haiyan Lin’s research[17]. On ovum pick-up day, 30 peripheral blood samples (15 high-risk and 15 low-risk) were obtained using the above-mentioned criteria. Transcriptome sequencing was performed on five high-risk patients with moderate OHSS and five low-risk patients who did not develop OHSS. The Ethics Committee of Gansu Provincial Maternity and Child-Care Hospital authorized the project, and all patients signed an informed consent form. Within 1 hour of oocyte extraction, 2 mL of blood was collected from each patient using a PAX gene Blood RNA Tube (BD Biosciences). Subsequently, the blood tubes were carefully inverted 10 times before being kept at −20°C for 24 hours and then transferred to −80°C. The blood was thawed at room temperature (18–25°C) for 2 hours before use in subsequent experiments.
Total RNA extraction, library construction, sequencing, data processing, and analysis
Transcriptome sequencing was performed on two groups: the OHSS low-risk group (control 1, control 2, control 3, control 4, and control 5) and the OHSS high-risk group (case 1, case 2, case 3, case 4, and case 5). Primary data were collected using molecular biology kits and bioinformatic techniques. Total RNA was extracted from the patient’s peripheral blood using the PAX gene Blood RNA Kit 2112 (BD), purified using the RNeasy mini kit (Qiagen), concentration was measured using a Qubit 2.0 Fluorometer (Agilent Technologies), and library construction and sequencing were performed on an Illumina HiSeq 2500 platform. FastQC (http://www.bioinformatics.babraham.ac.uk/projects/fastqc/) was used to filter raw data and obtain clean readings. A quality check was conducted to ensure the validity of the sequencing process by measuring the sequencing depth, Q30, GC content, effective sequence quantity, and percentage of effective sequence quantity. The unigene sequence was retrieved using Trinity’s de novo assembly from clean reads (http://trinityrnaseq.sourceforge.net/). Unigenes were aligned to the human RefSeq database using SOAP V2.0, to obtain matching mRNA sequences. To assess mRNA expression and screen differentially expressed genes (DEGs), software DESeq2 (screening conditions: P <0.05, | log2FC| > 0.58) was used.
DAVID (https://david.ncifcrf.gov/) was used to analyze GO function and KEGG pathway enrichment for DEGs[18]. The GO function analysis was separated into three categories: molecular function (MF), biological process (BP), and cellular component (CC). The STRING (https://string-db.org/) online analytic tool was used to examine protein–protein interaction (PPI) networks. To assess potential PPI relationships, previously discovered DEGs were mapped to the STRING database. A composite score was used to derive PPI pairings. The PPI network was then displayed using Cytoscape software (www.cytoscape.org/)[19].
qRT-PCR validation
For primer design, the Primer 5.0 software was utilized, the sequences were obtained from NCBI and the primers were manufactured by the Beijing Genomics Institute. To produce transcriptome sequencing validation templates, the remaining total RNA was reverse-transcribed using a PrimeScript RT reagent kit (TaKaRa, Japan). TRIzol was used to extract total RNA from the peripheral blood of the remaining patients. The qRT-PCR Kit used SYBR Green PCR Master Mix (Thermo Fisher Scientific, USA) to carry out the PCR reaction. The total reaction volume was maintained at 10 μL:5 μL SYBR Green Master Mix, 0.5 μL primers each, 1 μL template, and 3 μL ddH2O, and the PCR amplification profile were optimized at 34 cycles, with initial denaturation was set at 95°C for 1 minute, followed by denaturation at 95°C for 30 seconds, annealing at 58°C for 30 seconds, and extension at 72°C for 1 minute. The human β-actin gene was used as an internal reference.
Statistical analysis
qRT-PCR data were computed using the 2−ΔΔCT method and adjusted using β-actin before analysis using SPSS software (version 22.0).
Results
Quality control of sequencing data
For quality control applied to the sequencing data in this study, the effective sequencing quantity, percentage of effective sequencing quantity, and Q30 (i.e., the percentage of bases whose recognition accuracy was above 99.9%) were calculated. As indicated in Table S1; http://links.lww.com/RDM/A23, Q30 was >93% and the proportion of effective sequencing quantity was >90%, indicating that we obtained high-quality sequencing data that may be used for further research.
Sequencing and DEGs
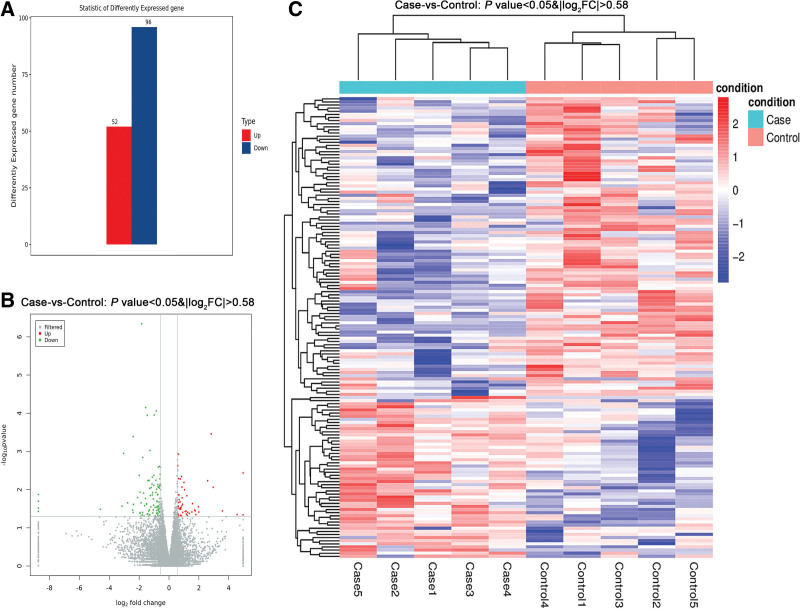
After aligning the sequence results with the human RefSeq database, 20,031 genes were identified. To study DEGs, the DESeq2 software was used. Differences were set at P <0.05, | log2FC | > 0.58. The results indicated 148 DEGs, including 52 upregulated and 96 downregulated genes (Fig. 1, Table S2; http://links.lww.com/RDM/A24). The most significant alterations were seen in the NYAP2 and THSD7A genes, with log2(FC) values of 4.5 and −4.6, respectively.
Fig. 1.
Differential gene expression analysis. (A) Statistics of differentially expressed genes (case vs. control). (B) Volcano map of differentially expressed genes. (C) Heatmap of differentially expressed genes.
Validation of DEG expression pattern
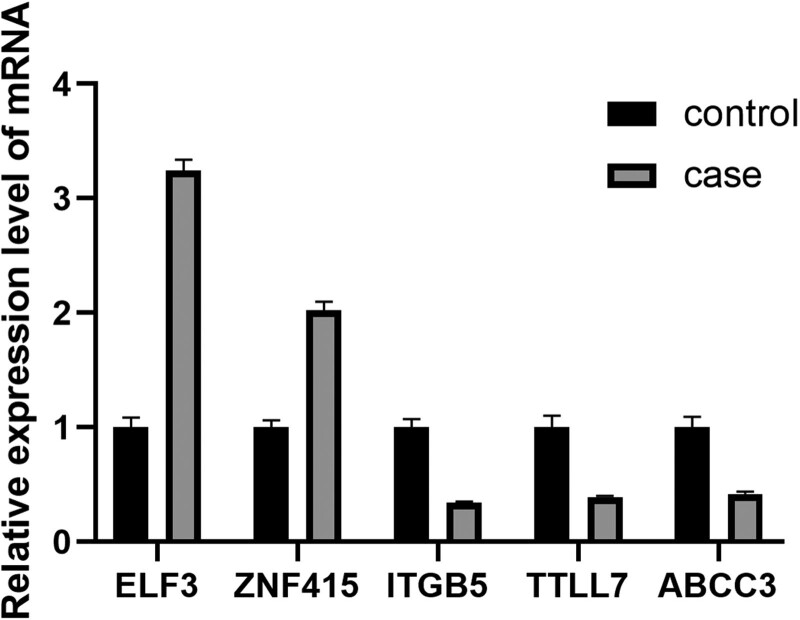
Five genes, ABCC3, ELF3, ZNF415, ITGB5, and TTLL7 were randomly selected from the DEGs. Following the reverse transcription of the remaining RNAs, qRT-PCR validation was performed (Fig. 2). The results revealed that the expression patterns matched the sequencing results, confirming their reliability.
Fig. 2.
qRT-PCR validation of differentially expressed genes. The expression value of β-actin served as an inner control. Case represents OHSS high-risk group, and control represents OHSS low-risk group. Data are shown with triplicate as mean ± SEM. OHSS: ovarian hyperstimulation syndrome.
GO function and KEGG signal pathway analyses of DEGs
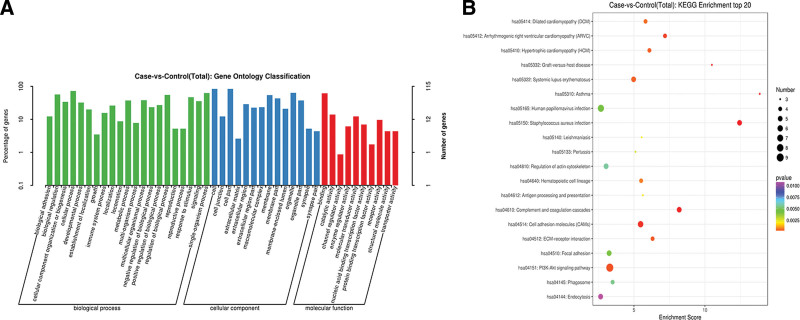
The DAVID online analytic program was used to study DEGs. The GO function items were chosen based on the number of genes, as shown in Fig. 3A. Extracellular corpuscles (GO: 0070062), plasma membrane (GO: 0005886), extracellular regions (GO: 0005576), and immune system response (GO: 0006955) were the major components in the list, with the majority of genes involved in CC and BP, and only receptor activity (GO: 0004872) was involved in MF. The most important enriched KEGG pathways were the PI3K-Akt signaling pathway (hsa04151), cell adhesion molecules (CAMs, hsa04514), focal adhesion (hsa04510), and complement and coagulation cascades (hsa04610) (Fig. 3B).
Fig. 3.
Functional annotation and enrichment analysis of DEGs. (A) Gene ontology functional enrichment map of DEGs. (B) Kyoto Encyclopedia of Genes and Genomes enrichment analysis of DEGs. DEGs: differentially expressed genes.
Construction of PPI networks and the discovery of hub genes
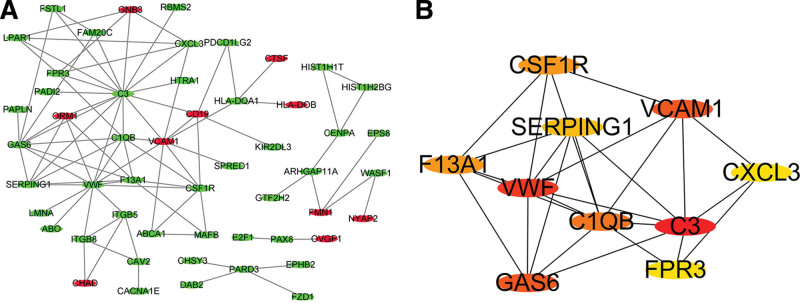
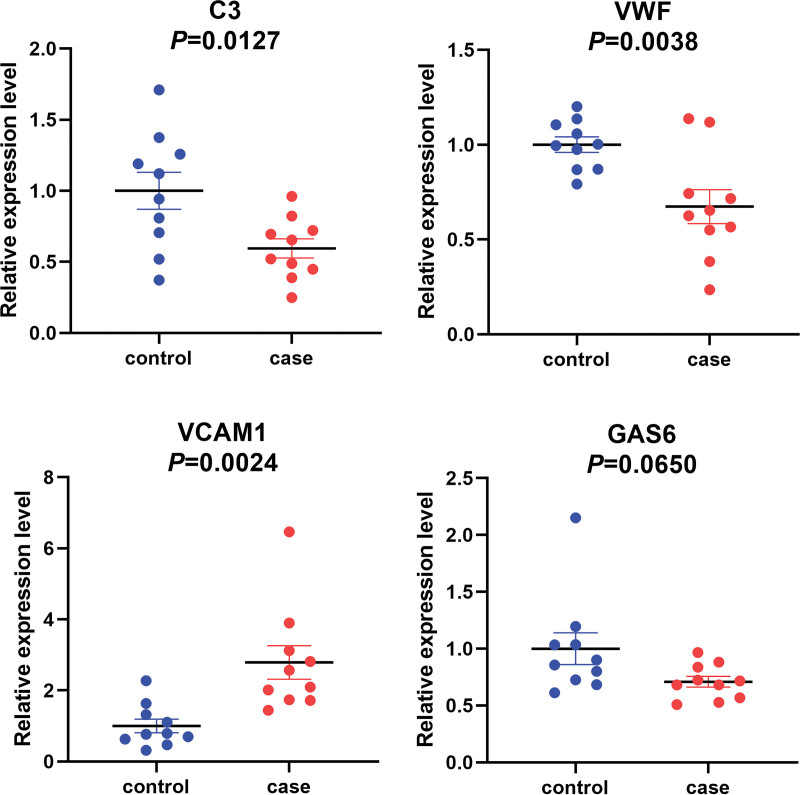
The online STRING analysis tool was used to identify differential gene-protein interactions, yielding 35 interaction lines (Fig. 4A). The top four proteins in this network were complement C3 (C3), von Willebrand factor (VWF), vascular cell adhesion protein 1 (VCAM1), and growth arrest-specific protein 6 (GAS6), with connection values of 16.0, 12.0, 9.0, and 9.0, respectively (Fig. 4B). Transcriptome sequencing revealed that the genes C3, VWF, and GAS6 were downregulated, whereas VCAM1 was upregulated, in case groups.
Fig. 4.
Protein–protein interaction network constructed and hub gene identification. (A) Protein–protein interaction network constructed with differentially expressed genes. Red and green nodes represent upregulated and downregulated genes, respectively. (B) Top 10 hub genes with higher degree of connectivity.
Validation of four hub genes between OHSS high-risk and low-risk patients
To validate the differential expression profiles, qRT-PCR was performed to confirm the expression changes of the four hub genes between high-risk (n = 10) and low-risk (n = 10) patients. The results showed that C3, VWF, and VCAM1 were significantly differentially expressed. qRT-PCR results confirmed that VCAM1 was upregulated, whereas C3 and VWF were significantly downregulated in the case group compared to the control group; no statistical significance was found in GAS6 expression between the two groups (Fig. 5).
Fig. 5.
qRT-PCR validation of the expression of hub genes. The expression levels of hub genes were validated by qPCR in 10 patients. Case represents OHSS high-risk group, and control represents OHSS low-risk group. Data are shown with triplicate as mean ± SEM. OHSS: ovarian hyperstimulation syndrome.
Discussion
OHSS has become the most common and fatal complication of assisted reproductive superovulation procedures. In patients with OHSS, aberrant VGEF production from numerous follicles can induce excessive vascular permeability, which can lead to blood concentrations, thrombosis, and, in severe instances, death[20]. Blood parameters such as vascular permeability, serum estradiol, progesterone levels, and VGEF levels can be used to predict the incidence of OHSS to some extent during ovulation induction[7,21,22]. Because of improvements in high-throughput sequencing technology, a greater number of sequencing studies on samples obtained from patients with OHSS have been performed to study the mechanism of OHSS in detail[23,24]. Lin et al., for example, used follicular fluid from oocyte extraction for transcriptome sequencing to explain the underlying processes of OHSS occurrence and examine transcription variations in long-chain non-coding RNAs from high-risk patients with OHSS[17]. However, no studies have been performed with high-throughput sequencing technology to analyze the most pathologically important peripheral blood samples from OHSS patients.
In this study, peripheral blood transcriptome sequencing was performed and 149 DEGs were identified. The DEGs were shown to be involved in several signaling pathways, including the PI3K-Akt signaling pathway, cell adhesion molecule, complement, and coagulation cascades, according to GO function and KEGG signaling pathway analyses, which are suggested to contribute to the pathogenesis of OHSS. We constructed a protein interaction network and validated that C3, VWF, and VCAM1 in the peripheral blood of patients with OHSS may serve as hub genes. C3 is the most significant component of the serum complement, which plays a role in mediating immune response and inflammatory reaction[25]. VWF enhances platelet adherence at the site of hemostasis by building a molecular bridge between the subendothelial collagen matrix and the platelet surface receptor complex GPIb-IX-V[26]. On leukocytes, VCAM1 interacts with integrin α-4/B-1(ITGA4/ITGB1) and plays a crucial role in adhesion and signal transduction[27]. Evidence shows that immune and inflammation responses are activated in patients with OHSS[28]. C3 and VWF were found to be differentially expressed in follicular fluid of patients with OHSS[29,30]. VWF expression is also increased in the serum of patients with OHSS[31]. On the other hand, VWF allows leukocyte and platelet rolling on endothelial cells, and VCAM1 participates in the inflammatory reaction[32]. These hub genes were linked to the incidence and pathological abnormalities associated with OHSS.
Peripheral blood samples were the most easily accessible biological specimens for clinical investigations on OHSS, and the blood collection technique was less hazardous to the patients[33]. Ustinova et al. used metformin to sequence the peripheral blood transcriptome in a population, resulting in excellent sequencing data and functional enrichment[34]. The number of DEGs in our analysis was comparable to that reported by Ustinova et al. qRT-PCR validations indicated that the expression pattern of DEGs was similar to that of the transcriptome sequencing data, ensuring the reliability of the peripheral blood transcriptome obtained.
However, this study has two obvious limitations. First, the sample size was small, with only five pairs. This may lead to misidentification of DEGs. Second, there were fewer DEGs in peripheral blood samples than in other samples. Therefore, a more in-depth validation of the DEGs is needed. In the present study, we verified the expression patterns of C3, vWF, VCAM1, and GAS6 in 10 pairs of patients. To overcome this restriction, appropriate cells from peripheral blood samples must be separated for transcriptional analysis to decrease the influence of other factors in peripheral blood. Furthermore, these findings must be supported by in vitro research in cells and animal models to further understand the role of these genes in the OHSS process.
In conclusion, our study found alterations in the transcriptome of the peripheral blood of patients with OHSS. These transcriptional alterations are linked to the etiology of OHSS. Several hub genes that play a significant role in the OHSS process were discovered using bioinformatics, and these genes were linked to a variety of important biological activities. According to our findings, these hub genes have the potential to be used as diagnostic and prognostic indicators for OHSS. In future studies, we intend to increase the sample size and conduct in vitro trials to corroborate our findings.
Supplemental materials
Supplementary information is linked to the online version of the paper on the Reproductive and Developmental Medicine website.
Acknowledgments
None
Author contributions
B.Y. and B.W. wrote the manuscript and made research with the support of Y.W., Z.Q.W. Y.L.N., Y.W., and Z.Q.W. collected the data and supervised the writing of the manuscript. B.Y., B.W., and Y.L.N. revised the manuscript and provided edits. All authors contributed to the final manuscript and approved the submitted version.
Funding(s)
This work was supported by the Gansu Provincial Science and Technology Department Grant (18YF1WA045, 20YF8FA093, and 21JR11RA174) and the Gansu Health Industry Research Program (GSWSKY2018-16).
Conflict of interest
All authors declare no conflict of interest.
Footnotes
Bo Yan, Bin Wu, and Zhi-Qiang Wang contributed equally as the co-first authors.
Edited by: Yong-Qing Zhu
How to cite this article: Yan B, Wu B, Wang ZQ, Wei Y, Ni YL. Peripheral blood transcriptome analysis of patients with ovarian hyperstimulation syndrome through high-throughput sequencing. Reprod Dev Med 2023;7(2):115–121. doi: 10.1097/RD9.0000000000000058
References
- [1].Mascarenhas MN, Cheung H, Mathers CD, et al. Measuring infertility in populations: constructing a standard definition for use with demographic and reproductive health surveys. Popul Health Metr. 2012;10(1):17. doi:10.1186/1478-7954-10-17. [DOI] [PMC free article] [PubMed] [Google Scholar]
- [2].Gipson JD, Bornstein MJ, Hindin MJ. Infertility: a continually neglected component of sexual and reproductive health and rights. Bull World Health Organ. 2020;98(7):505–506. doi:10.2471/BLT.20.252049. [DOI] [PMC free article] [PubMed] [Google Scholar]
- [3].Beerendonk CC, van Dop PA, Braat DD, et al. Ovarian hyperstimulation syndrome: facts and fallacies. Obstet Gynecol Surv. 1998;53(7):439–449. doi:10.1097/00006254-199807000-00024. [DOI] [PubMed] [Google Scholar]
- [4].Sousa M, Cunha M, Teixeira J, et al. Ovarian hyperstimulation syndrome: a clinical report on 4894 consecutive ART treatment cycles. Reprod Biol Endocrinol. 2015;13:66. doi:10.1186/s12958-015-0067-3. [DOI] [PMC free article] [PubMed] [Google Scholar]
- [5].Practice Committee of the American Society for Reproductive Medicine. Prevention and treatment of moderate and severe ovarian hyperstimulation syndrome: a guideline. Fertil Steril. 2016;106(7):1634–1647. doi:10.1016/j.fertnstert.2016.08.048. [DOI] [PubMed] [Google Scholar]
- [6].Navot D, Bergh PA, Laufer N. Reprint of: ovarian hyperstimulation syndrome in novel reproductive technologies: prevention and treatment. Fertil Steril. 2019;112(4 Suppl 1):e209–e221. doi:10.1016/j.fertnstert.2019.08.094. [DOI] [PubMed] [Google Scholar]
- [7].Nastri CO, Teixeira DM, Moroni RM, et al. Ovarian hyperstimulation syndrome: pathophysiology, staging, prediction and prevention. Ultrasound Obstet Gynecol. 2015;45(4):377–393. doi:10.1002/uog.14684. [DOI] [PubMed] [Google Scholar]
- [8].Mourad S, Brown J, Farquhar C. Interventions for the prevention of OHSS in ART cycles: an overview of Cochrane reviews. Cochrane Database Syst Rev. 2017;1(1):CD012103. doi:10.1002/14651858.CD012103.pub2. [DOI] [PMC free article] [PubMed] [Google Scholar]
- [9].Humaidan P, Nelson SM, Devroey P, et al. Ovarian hyperstimulation syndrome: review and new classification criteria for reporting in clinical trials. Hum Reprod. 2016;31(9):1997–2004. doi:10.1093/humrep/dew149. [DOI] [PubMed] [Google Scholar]
- [10].Wang B, Wang J, Liu Y, et al. sRAGE downregulates the VEGF expression in OHSS ovarian granulosa cells. Gynecol Endocrinol. 2021;37(9):836–840. doi:10.1080/09513590.2021.1942453. [DOI] [PubMed] [Google Scholar]
- [11].Hortu I, Karadadas E, Ozceltik G, et al. Oxytocin and cabergoline alleviate ovarian hyperstimulation syndrome (OHSS) by suppressing vascular endothelial growth factor (VEGF) in an experimental model. Arch Gynecol Obstet. 2021;303(4):1099–1108. doi:10.1007/s00404-020-05855-1. [DOI] [PubMed] [Google Scholar]
- [12].Naredi N, Talwar P, Sandeep K. VEGF antagonist for the prevention of ovarian hyperstimulation syndrome: current status. Med J Armed Forces India. 2014;70(1):58–63. doi:10.1016/j.mjafi.2012.03.005. [DOI] [PMC free article] [PubMed] [Google Scholar]
- [13].Scotti L, Abramovich D, Pascuali N, et al. Local VEGF inhibition prevents ovarian alterations associated with ovarian hyperstimulation syndrome. J Steroid Biochem Mol Biol. 2014;144(Pt B):392–401. doi:10.1016/j.jsbmb.2014.08.013. [DOI] [PubMed] [Google Scholar]
- [14].Hansen MC, Haferlach T, Nyvold CG. A decade with whole exome sequencing in haematology. Br J Haematol. 2020;188(3):367–382. doi:10.1111/bjh.16249. [DOI] [PubMed] [Google Scholar]
- [15].Ergin S, Kherad N, Alagoz M. RNA sequencing and its applications in cancer and rare diseases. Mol Biol Rep. 2022;49(3):2325–2333. doi:10.1007/s11033-021-06963-0. [DOI] [PMC free article] [PubMed] [Google Scholar]
- [16].Li B, Fillmore N, Bai Y, et al. Evaluation of de novo transcriptome assemblies from RNA-Seq data. Genome Biol. 2014;15(12):553. doi:10.1186/s13059-014-0553-5. [DOI] [PMC free article] [PubMed] [Google Scholar]
- [17].Lin H, Li Y, Xing W, et al. Genome-wide screening differential long non-coding RNAs expression profiles discloses its roles involved in OHSS development. J Assist Reprod Genet. 2018;35(8):1473–1482. doi:10.1007/s10815-018-1199-0. [DOI] [PMC free article] [PubMed] [Google Scholar]
- [18].Huang da W, Sherman BT, Lempicki RA. Systematic and integrative analysis of large gene lists using DAVID bioinformatics resources. Nat Protoc. 2009;4(1):44–57. doi:10.1038/nprot.2008.211. [DOI] [PubMed] [Google Scholar]
- [19].Shannon P, Markiel A, Ozier O, et al. Cytoscape: a software environment for integrated models of biomolecular interaction networks. Genome Res. 2003;13(11):2498–2504. doi:10.1101/gr.1239303. [DOI] [PMC free article] [PubMed] [Google Scholar]
- [20].Selter J, Wen T, Palmerola KL, et al. Life-threatening complications among women with severe ovarian hyperstimulation syndrome. Am J Obstet Gynecol. 2019;220(6):575.e1–575.e11. doi:10.1016/j.ajog.2019.02.009. [DOI] [PubMed] [Google Scholar]
- [21].Fiedler K, Ezcurra D. Predicting and preventing ovarian hyperstimulation syndrome (OHSS): the need for individualized not standardized treatment. Reprod Biol Endocrinol. 2012;10:32. doi:10.1186/1477-7827-10-32. [DOI] [PMC free article] [PubMed] [Google Scholar]
- [22].Namavar Jahromi BM, Parsanezhad MM, Shomali ZM, et al. Ovarian hyperstimulation syndrome: a narrative review of its pathophysiology, risk factors, prevention, classification, and management. Iran J Med Sci. 2018;43(3):248–260. [PMC free article] [PubMed] [Google Scholar]
- [23].Borgwardt L, Olsen KW, Rossing M, et al. Rare genetic variants suggest dysregulation of signaling pathways in low- and high-risk patients developing severe ovarian hyperstimulation syndrome. J Assist Reprod Genet. 2020;37:2883–2892. doi:10.1007/s10815-020-01941-0. [DOI] [PMC free article] [PubMed] [Google Scholar]
- [24].Stouffs K, Daelemans S, Santos-Ribeiro S, et al. Rare genetic variants potentially involved in ovarian hyperstimulation syndrome. J Assist Reprod Genet. 2019;36:491–497. doi:10.1007/s10815-018-1372-5. [DOI] [PMC free article] [PubMed] [Google Scholar]
- [25].Rawish E, Sauter M, Sauter R, et al. Complement, inflammation and thrombosis. Br J Pharmacol. 2021;178:2892–2904. doi:10.1111/bph.15476. [DOI] [PubMed] [Google Scholar]
- [26].Lin J, Sorrells MG, Lam WA, et al. Physical forces regulating hemostasis and thrombosis: vessels, cells, and molecules in illustrated review. Res Pract Thromb Haemost. 2021;5(5):e12548. doi:10.1002/rth2.12548. [DOI] [PMC free article] [PubMed] [Google Scholar]
- [27].Gholizadeh M, Saeedy SAG, Roodi PB, et al. The association between zinc and endothelial adhesion molecules ICAMs and VCAM-1 and nuclear receptors PPAR-a and PPAR-gamma: a systematic review on cell culture, animal and human studies. Microvasc Res. 2021;138:104217. doi:10.1016/j.mvr.2021.104217. [DOI] [PubMed] [Google Scholar]
- [28].Jarkovska K, Kupcova Skalnikova H, Halada P, et al. Development of ovarian hyperstimulation syndrome: interrogation of key proteins and biological processes in human follicular fluid of women undergoing in vitro fertilization. Mol Hum Reprod. 2011;17:679–692. doi:10.1093/molehr/gar047. [DOI] [PubMed] [Google Scholar]
- [29].Lim HJ, Seok AE, Han J, et al. N-glycoproteomic analysis of human follicular fluid during natural and stimulated cycles in patients undergoing in vitro fertilization. Clin Exp Reprod Med. 2017;44(2):63–72. doi:10.5653/cerm.2017.44.2.63. [DOI] [PMC free article] [PubMed] [Google Scholar]
- [30].Rogolino A, Coccia ME, Fedi S, et al. Hypercoagulability, high tissue factor and low tissue factor pathway inhibitor levels in severe ovarian hyperstimulation syndrome: possible association with clinical outcome. Blood Coagul Fibrinolysis. 2003;14(3):277–282. doi:10.1097/01.mbc.0000061296.28953.d0. [DOI] [PubMed] [Google Scholar]
- [31].Ogawa S, Minakami H, Araki S, et al. A rise of the serum level of von Willebrand factor occurs before clinical manifestation of the severe form of ovarian hyperstimulation syndrome. J Assist Reprod Genet. 2001;18(2):114–119. doi:10.1023/a:1026590910462. [DOI] [PMC free article] [PubMed] [Google Scholar]
- [32].Baruch D. Interactions plaquettes--paroi vasculaire [Platelet--vessel wall interactions]. Therapie. 2006;61(5):371–378. doi:10.2515/therapie:2006068. [DOI] [PubMed] [Google Scholar]
- [33].Zhang W, Yan C, Liu X, et al. Global characterization of megakaryocytes in bone marrow, peripheral blood, and cord blood by single-cell RNA sequencing. Cancer Gene Ther. 2022;29(11):1636–1647. doi:10.1038/s41417-022-00476-z. [DOI] [PubMed] [Google Scholar]
- [34].Ustinova M, Silamikelis I, Kalnina I, et al. Metformin strongly affects transcriptome of peripheral blood cells in healthy individuals. PLoS One. 2019;14:e0224835. doi:10.1371/journal.pone.0224835. [DOI] [PMC free article] [PubMed] [Google Scholar]


