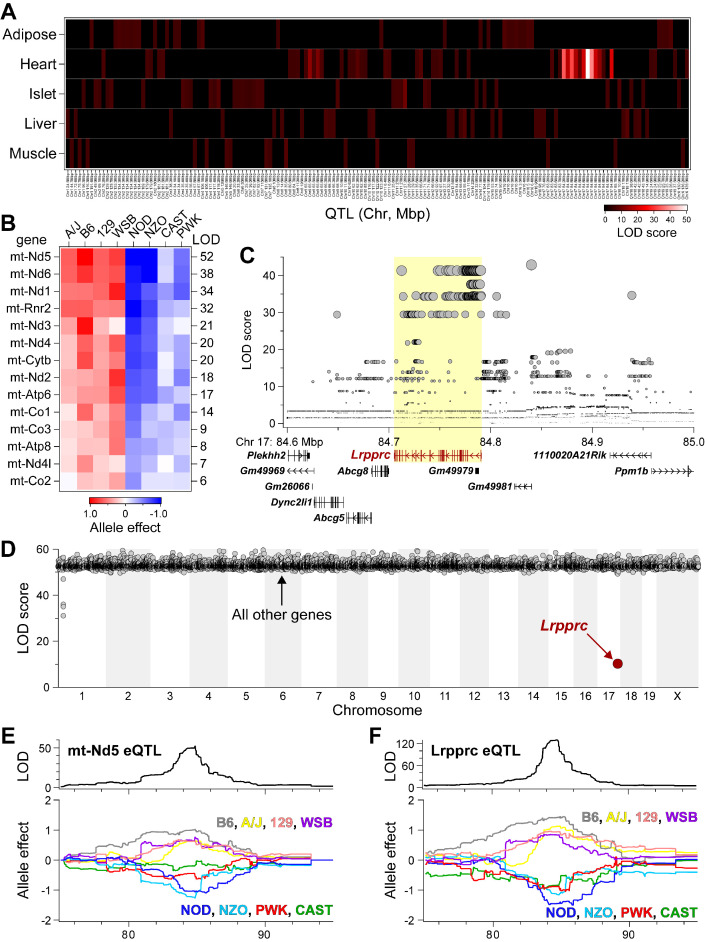
Figure 4. Lrpprc regulates an mt-encoded eQTL hotspot specifically in heart of DO mice.
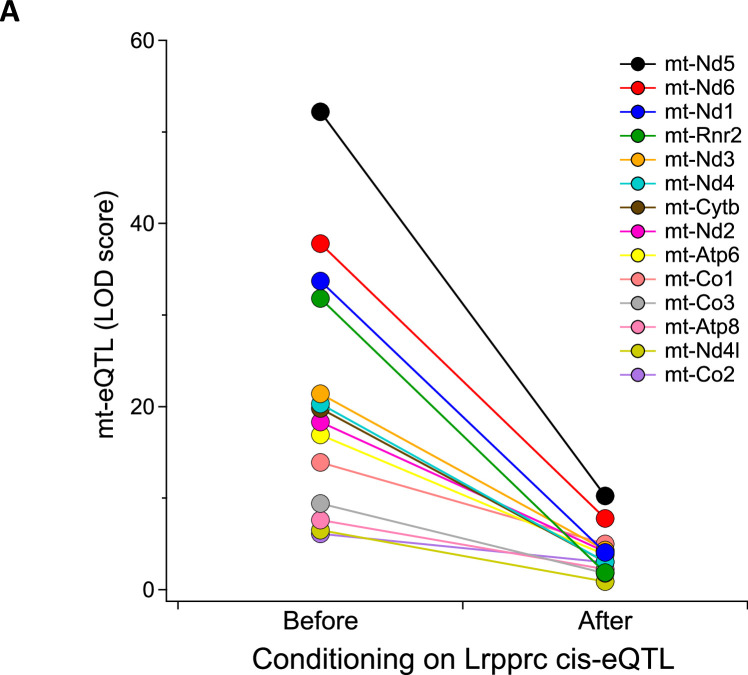
(A) Heatmap illustrates all eQTL (LOD >6) for mt-encoded transcripts that were identified in Adipose (Wang et al., 2012), Heart (Ruzzenente et al., 2012), Islet (Gu et al., 2016), Liver (Rath et al., 2021), and Muscle (Wang et al., 2016) from Diversity Outbred mice maintained on a Western-style diet. Mt-eQTL are arranged along x-axis according to genomic position from chr1 to chrX; z-axis depicts LOD score, highlighting a hotspot on chr17 at ~85 Mbp. (B) Allele effect patterns for mt-eQTL mapping to chr17 hotspot in heart. Red illustrates alleles associated with increased expression; blue, decreased expression. LOD scores are shown along right margin. (C) SNP association profile for mt-Nd5 eQTL in heart. Lrpprc contains SNPs with strongest association, yellow highlighted region. (D) Mediation of mt-Nd5 eQTL against all transcripts in heart. The LOD score for mt-Nd5 is significantly reduced when conditioned on a Lrpprc cis-eQTL, consistent with genetic regulation of Lrpprc being required for the regulation of mt-Nd5. The mt-Nd5 eQTL (E) and Lrpprc cis-eQTL (F) in heart demonstrate matched and concordant allele effect patterns, suggesting Lrpprc is a positive driver of mt-Nd5.


