Abstract
We report the latest release (version 1.6) of the CATH protein domains database (http://www.biochem.ucl.ac.uk/bsm/cath ). This is a hierarchical classification of 18 577 domains into evolutionary families and structural groupings. We have identified 1028 homologous superfamilies in which the proteins have both structural, and sequence or functional similarity. These can be further clustered into 672 fold groups and 35 distinct architectures. Recent developments of the database include the generation of 3D templates for recognising structural relatives in each fold group, which has led to significant improvements in the speed and accuracy of updating the database and also means that less manual validation is required. We also report the establishment of the CATH-PFDB (Protein Family Database), which associates 1D sequences with the 3D homologous superfamilies. Sequences showing identifiable homology to entries in CATH have been extracted from GenBank using PSI-BLAST. A CATH-PSIBLAST server has been established, which allows you to scan a new sequence against the database. The CATH Dictionary of Homologous Superfamilies (DHS), which contains validated multiple structural alignments annotated with consensus functional information for evolutionary protein superfamilies, has been updated to include annotations associated with sequence relatives identified in GenBank. The DHS is a powerful tool for considering the variation of functional properties within a given CATH superfamily and in deciding what functional properties may be reliably inherited by a newly identified relative.
INTRODUCTION
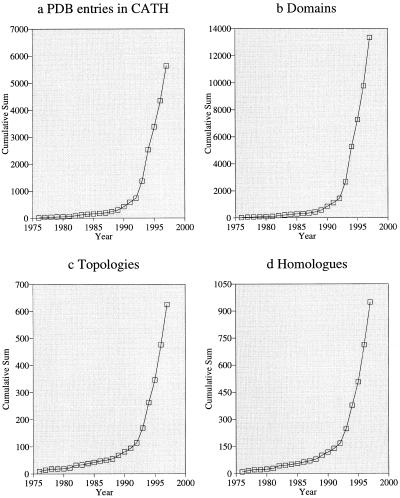
The number of known 3D protein structures has increased rapidly over the last 10 years, with approximately 200 protein entries currently being deposited in the Protein Databank (PDB) (1) per month at the Research Collaboratory for Structural Bioinformatics (http://www.rcsb.org/pdb/ ) (Fig. 1). To understand and map this universe of protein structures it is necessary to collate, annotate and classify these structures in a rational scheme. The CATH classification (2) of protein structures was established in 1993 as a hierarchical clustering of protein domain structures into evolutionary families and structural groupings depending on sequence and structure similarity. The classification scheme provides phenetic descriptions of structure as well as describing their phylogenetic relationships. The database can be accessed from http://www.biochem.ucl.ac.uk/bsm/cath
Figure 1.
Database statistics for CATH—cumulative total by year, (a) PDB entries, (b) domains, (c) topologies and (d) homologous superfamilies.
CLASSIFICATION
In the CATH database, classification operates at the level of structural domain as these domains are likely to be the fundamental evolutionary building blocks or units. Several methods are used to identify these domains. Proteins that have significant sequence similarity to a protein already in the database inherit the domain boundaries of the existing entry. For those proteins with no relative in the database, three different algorithms are used to identify the structural domain boundaries automatically (3). If a consensus is reached and all the programs agree, the domain boundaries are assigned accordingly. If the algorithms give different results, the domain boundaries are determined by hand, using both the automatic assignments and the literature as a guide. There are four major levels of classification of these domains, corresponding to protein Class, Architecture, Topology or fold and Homologous family.
Homologous superfamilies
At the lowest levels in the CATH hierarchy, proteins are grouped into evolutionary families (homologous families), for either having significant sequence similarity (35%) or high structural similarity and some sequence identity (20%). Structural similarity is assessed using an automatic method (SSAP) (4) which uses the same dynamic programming methods as sequence alignment. However, instead of comparing residue identities, their structural environments are compared. SSAP returns scores of 100 for identical proteins and generally returns scores above 80 for homologous proteins. More distantly related folds generally give scores above 70 (topology or fold level), though in the absence of any sequence or functional similarity this may represent examples of convergent evolution, reinforcing the hypothesis that there exist a limited number of folds in nature (5). Distantly related homologues are identified by structural similarity (SSAP >70) with evidence of functional similarity at a co-located active site.
Topology or fold groups
Protein domains that show a significant structural similarity (SSAP >70) but have no sequence or functional similarity are clustered into the same fold/topology group. These have a similar number and arrangement of secondary structures and similar connectivity between these secondary structural elements.
Architecture
In CATH, architecture is assigned manually although an automatic procedure is being developed. Architecture is the description of the gross arrangement of secondary structures in 3D space, independent of their connectivity. The architectural groupings can sometimes be very broad as they describe general features of protein fold shape: for example, the number of layers in an α/β sandwich or whether the structure is a barrel (e.g. TIM barrel). In version 1.6 of CATH there were 35 architectures; four mainly-α, 18 mainly-β and 13 αβ.
Class
Finally, class is assigned automatically by considering composition or residues in α-helix and β-strands and the secondary structure packing (6). Class simply reflects the proportion of α-helix or β-strand secondary structures. Three major classes are recognised, mainly-α, mainly-β class or classes containing both α and β secondary structures. Previous analysis revealed considerable overlap between the α+β and α/β originally described by Levitt and Chothia (7), so in CATH these categories are considered together. Finally there are sections for irregular structures and those that do not fit into any of the other categories easily, and for multidomain proteins.
STRUCTURAL TEMPLATES FOR IDENTIFYING FOLD GROUPS AND REMOTE HOMOLOGUES
As the number of protein structures deposited into the PDB has increased considerably, the time lapse between structure deposition and inclusion in the CATH database has also increased, mainly as a result of the amount of data that need to be validated. To reduce the amount of manual validation required whilst still maintaining the integrity of the data, several new automatic classification methods have been developed.
Structural templates for fold groups and homologous superfamilies
The original techniques for classifying proteins in CATH relied on scanning a new structure against all non-identical representatives from each homologous superfamily. The latest classification protocol identifies structural relatives through matching the 3D template of a given evolutionary family or fold group. Templates are generated by CORA (Conserved Residue Attributes) (8), a suite of programs for automatically aligning and analysing protein structural families. CORA uses the pairwise structural comparison data from SSAP to determine the initial set of proteins to be aligned and then identifies conserved characteristics and expresses them as a 3D structural profile for each family. By accumulating information on structural conservation for different regions of the fold, conserved regions can be more heavily weighted and their alignment improved. As the profiles encapsulate the critical core of the fold as well as functional sites, which in the case of homologous proteins have been conserved through evolution, they are more sensitive at identifying distant homologues. Using CORA, new structures can be scanned against single templates from each family. Since these contain only conserved positions, scans are up to 100-fold faster for some families. Diagnostic CORA plots can then be used to assess whether a structure should be assigned to that family.
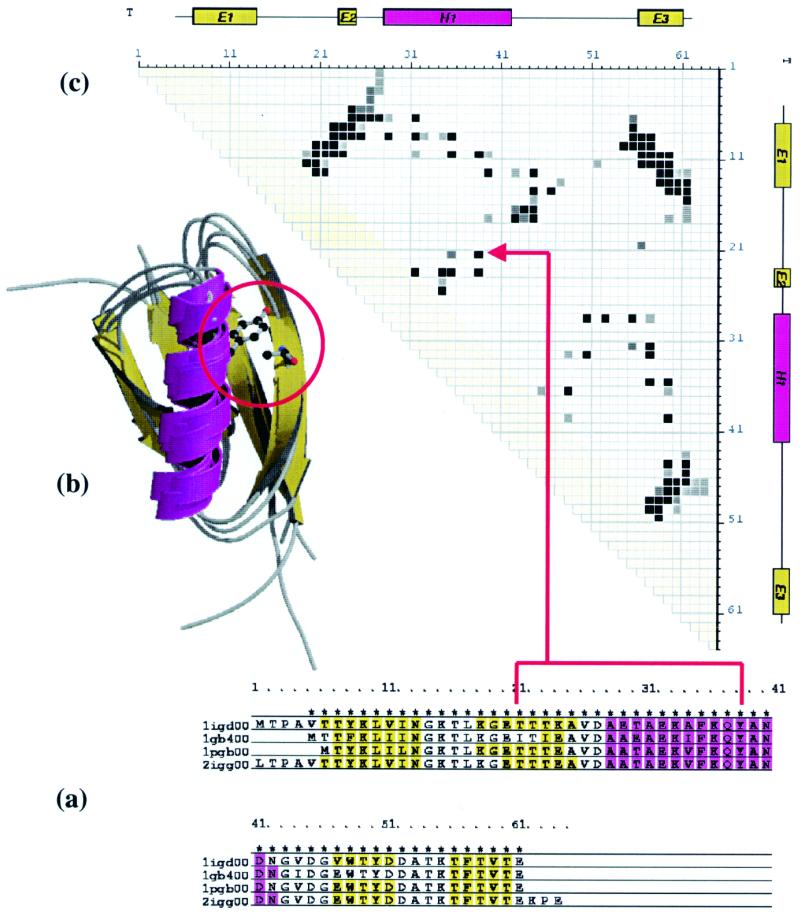
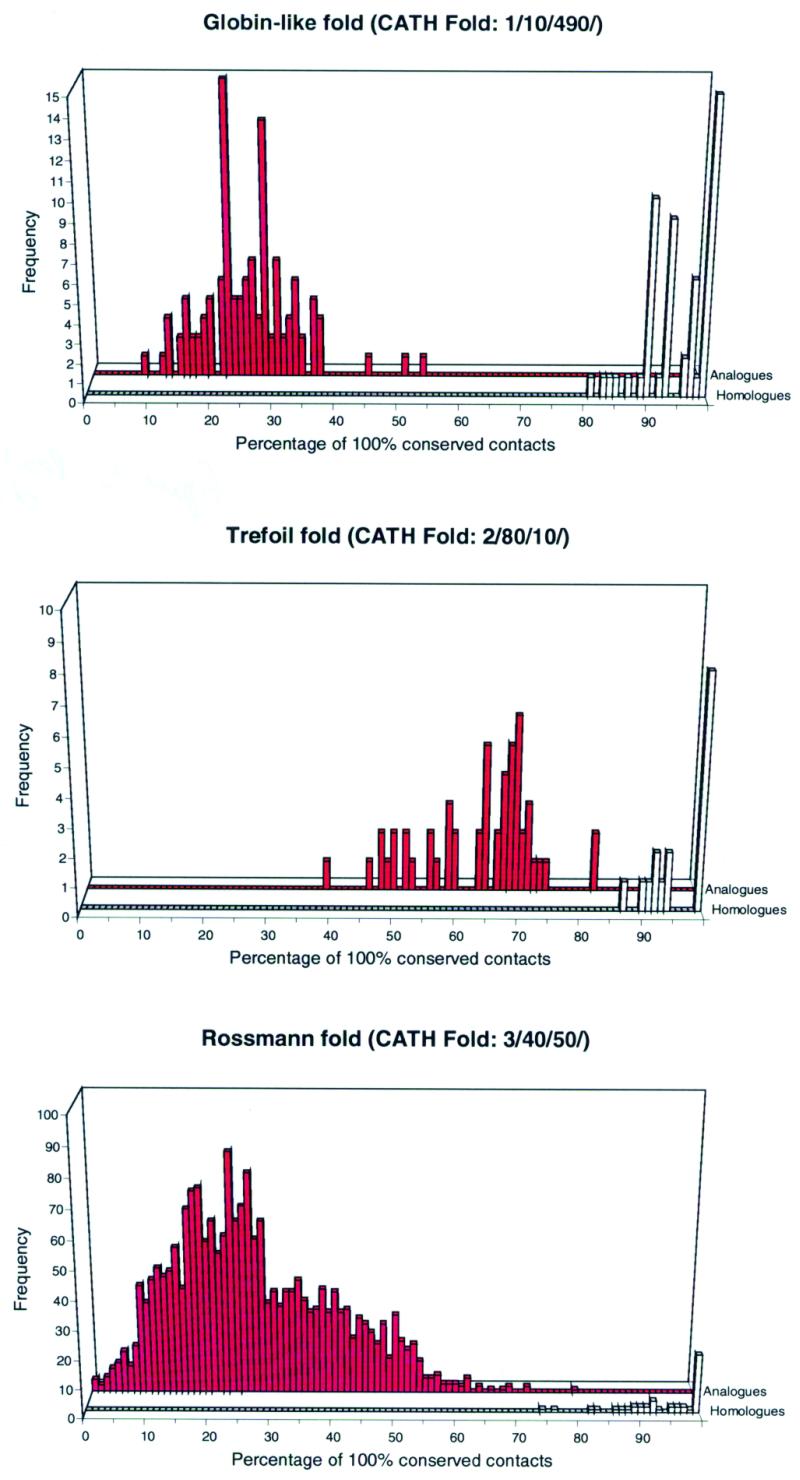
A further development of this approach is the use of consensus contact maps to distinguish between homologues and analogues. Consensus contact maps were produced for all the representative CORA alignments using CONPLOT (Fig. 2). This examines each combination of positions in the multiple alignment of a superfamily and assesses which of the structures has a contact between the corresponding residues (Cβ–Cβ distance is <8 Å). To avoid a large number of relatively uninformative short-range contacts, inter-residue contacts are only considered if two residues are separated in sequence by at least eight residues. Russell and Barton (9) have already suggested that contacts are not as well conserved between analogous proteins within the same fold group, whilst conservation amongst homologues is more pronounced. Figure 3 supports their findings and shows the clear discrimination achieved for three superfamilies within some of the more highly populated superfold groups in the CATH database, the α globin fold, the β trefoil fold and the α-β Rossmann fold groups. Similar results were obtained for other superfold groups. The procedure of scanning a library of consensus contact maps within a fold group, in order to assign structures to homologous families provides a fast filter for the identification of homologues in the CATH database.
Figure 2.

Three representations of consensus data for the homologous family 3.10.20.10 in the CATH database. An example of a totally conserved contact between residues in position 21 and 38 in the alignment is highlighted in each representation. (a) Multiple structural alignment for the family with areas of secondary structure highlighted in purple for α-helices, yellow for β-strands. (b) Superposition of the four structures in the homologous family generated using Molscript (24) and RASTER-3D (25). (c) Consensus contact map describing the inter-residue distances between all positions in the alignment with contact intensity as a function of conservation. Consensus secondary structure assignments are plotted along both axes of the contact map.
Figure 3.

Contact comparison scores of all S95-representative structures against homologous templates for three of the superfolds in the CATH database. The contact map for each representative structure was compared against the consensus contact map for its own evolutionary family (homologous comparison scores shown in white) and consensus contact maps for the other homologous families in the same fold group (analogous comparisons scores shown in red). The separation between the analogous and homologous scores indicates that this method may be used to verify homologous family classification. This procedure can also be used to highlight possible errors in classification and to check that the consensus templates are truly representative of the homologous family.
CATH-PROTEIN FAMILY DATABASE (PFDB)
It is well accepted that proteins sharing at least 30% of their amino acid sequence will adopt the same fold and will often exhibit similar functions. A great deal of work has been directed at increasing the sensitivity of sequence comparison to identify more remote homologues found in the twilight zone of sequence comparison (20–30% sequence identity). More distant evolutionary relationships (<20% sequence identity) are difficult to elucidate without a combination of structural and functional evidence to prove homology. However, the presence of a functional sequence motif (PROSITE) (10) or set of motifs (PRINTS) (11) can sometimes be used to detect more distant relationships. More recently, sequence searching methods that use profile-based approaches or intermediate sequences e.g. PSI-BLAST (12), hidden Markov models (13) and ISS (14) have also been shown to detect more distant homologues than pairwise sequence techniques (15). Park et al. (15) have recently established reliable parameters for using PSI-BLAST to identify homologues.
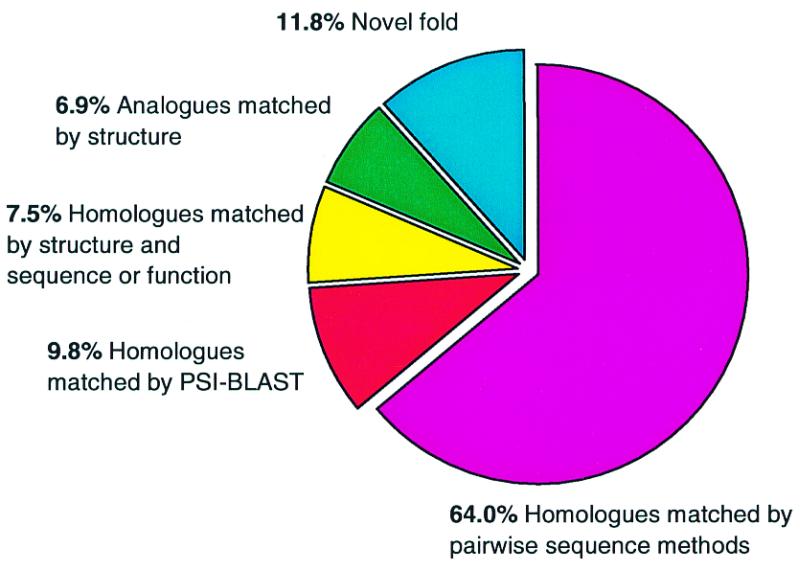
A recent development to improve the speed of update in the CATH database is the use of PSI-BLAST (12) to automatically identify structures homologous to those already within the CATH database. New structures that do not have significant sequence similarity to entries within CATH (<35%) are scanned against the CATH sequence database comprising non-redundant GenBank sequences (16) and CATH-95 representatives within CATH. The sequence dataset is filtered using PFILT (David Jones, 1998) to mask transmembrane segments, coiled-coil and low-complexity regions. The maximum number of iterations allowed is 20, the E-value for inclusion in the next pass is 0.0005 and the maximum E-value displayed is 10. Any PSI-BLAST hits are then automatically compared using SSAP and if the structures are similar enough (SSAP >70) the structures are automatically added to the database. Figure 4 shows the percentage of structures assigned in this way.
Figure 4.

Pie-chart showing the classification of the latest 2646 domains. The proportion matched by pairwise sequence methods (sequence identity >35%) and by PSI-BLAST are indicated. The proportion of both homologues and analogues domains identified by structure comparison are also shown.
In addition, to complement the CATH database, we have recently established the CATH-PFDB. This associates 1D sequences with the homologous superfamilies classified within CATH. PSI-BLAST searches are performed on the CATH sequence database using all CATH-95 sequences and established cut-offs. All sequence segments with E-values <0.0005 and of similar length to the probe sequence (overlap >80%, residue difference <50) were identified as putative homologous domains.
In cases where a sequence is always hit by several CATH-95 representatives belonging to the same homologous superfamily, the minimum and maximum positions of the overlap are used to output, in FASTA format, the sequence of the proposed domain. The consensus region is also used for validating domain boundaries. In other cases where a sequence is hit by CATH-95 representatives having different CATH numbers, validation of the evolutionary relationships is required using the DHS (CATH Dictionary of Homologous Superfamilies; see below) before the families are merged. Many CATH domains are constructed from discontinuous sections of sequence where the protein backbone may cross over several times between domains. In these cases, PSI-BLAST searches are performed using the complete chain and the domain boundaries subsequently extracted from the complete sequence matches.
The inclusion of GenBank sequence relatives in CATH-PFDB has expanded the number of entries in the database from ~18 000 to ~100 000, including both single domain and multidomain entries. To cope with this increase, we have introduced an additional sequence level in the CATH-PFDB hierarchy, and now group proteins having 35, 60, 95 and 100% sequence identity. Any sequences assigned by PSI-BLAST with significant E-value and sequence identity >30% to any of the CATH-95 representatives, are compared against all the relatives within that particular homologous superfamily. This is done using a pairwise sequence alignment method, HOMOLFASTA, which encodes the Needleman and Wunsch algorithm (17). Clustering is then performed to assign the new sequence to the appropriate sequence level, within the homologous superfamily (i.e. 35, 60, 95 and 100% sequence identity cluster, as appropriate).
A PSI-BLAST server has been developed allowing you to scan the CATH database with a new sequence. The CATH PSI-BLAST server can be accessed at
http://www.biochem.ucl.ac.uk/bsm/PSI-CATH . The server accepts sequences in FASTA format and the user has some limited options to alter the parameters governing the maximum number of passes to use, the E-value threshold for inclusion in the multipass model, and the maximum E-value that is displayed. The CATH sequence database is searched but only those ‘hits’ that are classified in CATH are displayed. At the first level of the output display, hits are grouped according to one or more CATH numbers. A brief description of the structural classification corresponding to each CATH number is given and an example static structure is displayed for a low E-value member of that group. The next level of the output display shows the PSI-BLAST statistics for each individual hit within a group, ordered by increasing E-value. Links are provided to display the query and hit sequences and an interactive 3D display of the structure of the hit. Overlapping regions are highlighted on both the sequences and the structure.
DICTIONARY OF HOMOLOGOUS SUPERFAMILIES
The DHS (18) is an important new resource which can be used to validate any putative homologues identified by the CATH PSI-BLAST or SSAP servers (see below). The DHS contains validated multiple structural alignments, annotated with consensus functional information, for each evolutionary protein superfamily containing more than one non-identical structure. It can be accessed from the web site http://www.biochem.ucl.ac.uk/bsm/dhs . In order to quantify structural relationships within each superfamily, SSAP structural comparisons were performed for each pair of CATH-95 domains within the family. Multiple structural alignments were then generated using the CORA program for each of the 362 homologous superfamilies with more than one CATH-95 structure. Families have been annotated with secondary structures, functional sequence patterns including functional keywords extracted from SWISS-PROT and the ENZYME database and protein–ligand interaction data. The web-interface also provides a tool for examining sequence–structure relationships for proteins within each fold group. The 3D structural superpositions can be viewed interactively in a RASMOL viewer.
The DHS also contains functional annotations for any GenBank sequences assigned to a given CATH superfamily. Since the inclusion of sequence relatives in this way expands the database >5-fold, considerable additional functional data is now available within these CATH superfamilies. More importantly, the DHS web site allows the user to examine the functional repertoire within a given family. Recent analysis of enzyme families within CATH (19) has revealed that in some 17% of these families, the function has changed completely during evolution as evidenced by changes in the EC classification numbers. Inspection of the DHS, therefore, reveals those families for which functional inheritance may be more problematic and should only be performed extremely cautiously. For other families, the DHS will allow the user to identify those subfamilies containing similar sequence motifs or structurally conserved regions, associated with a particular functional property.
CONTENT OF THE CURRENT RELEASE
Version 1.6 of the CATH database (June 1999) contains 18 577 domains from over 13 000 protein structures, classified into evolutionary families and structural groupings. We have identified 1028 homologous superfamilies in which the proteins have both structural and sequence/functional similarity. These can be furthered clustered into 672 fold groups and 35 distinct architectures. Of the 2646 new domains added to the database between March 1998 and November 1998, 64% matched by pairwise sequence methods. A further 9.8% of entries were identified using PSI-BLAST. Using structure and sequence/function a further 7.5% were identified as homologues. 6.9% were identified with the same fold and 11.8% had a novel fold. Over 100 000 sequence domains were identified in the CATH-PFDB and extracted from GenBank.
ORGANISATION OF THE CATH DATABASE
The CATH database can be browsed from http://www.biochem.ucl.ac.uk/bsm/cath . The web interface for CATH has been organised to facilitate searching for particular structures or browsing the whole database.
Browsing through the CATH hierarchy
CATH is organised as a tree structure. Entering at the top of the hierarchy, the user can navigate through the levels of Class, Architecture, Fold, Homologous superfamily, Family and Sequence family to the leaves of the trees which are structural domains of individual PDB entries. There are also direct links to the OWL (20), PRINTS (11) and SWISS-PROT (21) databases. For each superfamily, there are links to the DHS. The individual domains are then linked to PDBSum (22) which contains summary information and derived data on entries in the PDB. The summary information gives an at-a-glance overview of the contents of each PDB entry in terms of numbers of protein chains, ligands, metal ions, etc. The derived data include PROMOTIF analyses, summary PROCHECK statistics and a schematic diagram of protein secondary structure and any associated ligands.
Keyword/PDB searching
The CATH database can be searched using keywords or by a PDB identifier itself.
Sequence searching
The CATH-PSIBLAST server has been developed to allow access to the CATH database by sequence searching. Sequences may be submitted in FASTA format (see above).
OTHER FACILITIES
CATH SSAP Server
The CATHserver allows you to scan a structure against the CATH database to identify related structures (http://www.biochem.ucl.ac.uk/bsm/server ). For each coordinate set deposited, Detective (23) is used to split the structure into their constituent domains. Domain assignments may then be hand edited. For each domain identified, the sequence is extracted and compared to all the entries in CATH, if no sequence match is found the structure is compared directly to a representative set of proteins in CATH using SSAP. The score for each pairwise comparison is displayed with significant scores highlighted. The best hit is also highlighted. The structure co-ordinates may be deposited over the web, and the results displayed over the web. An e-mail is returned to the depositor when the searching procedures have finished.
Non-homologous lists
The CATH domain assignments can be downloaded from the web page. Also available are the latest non-redundant lists of domains and complete chains at 100, 95, 60 and 35% sequence similarity. Lists of representatives for each homologous superfamily and for each fold (topology) can also be obtained.
CONCLUSIONS
The challenge for the post-genomic era will be to understand the functions and biological roles of the thousand of sequences being determined by the international genome initiatives. The structure of a protein can often provide vital clues to the nature of interactions between the protein and any chemical moieties or other proteins that bind to it. Knowledge of the geometry of the active site and the orientation of residues within it can illuminate catalytic mechanisms. By integrating genomic sequences within the CATH database, we aim to facilitate the assignment of functional properties to newly determined sequences. Information on functional properties for each superfamily, accessible within the DHS, will help in interpreting the likely functional properties for a new sequence or structure and in proposing ways in which mutations in the residues may have affected the function.
Acknowledgments
ACKNOWLEDGEMENTS
We acknowledge the support of the BBSRC and MRC. F.M.G.P. is supported by the BBSRC. A.E.T. and J.E.B. are in receipt of special BBSRC studentships (A.E.T. in collaboration with Oxford Molecular). C.A.O., A.P.H. and D.L. are supported by the MRC. We acknowledge support from the BBSRC computing facilities. We thank Drs Roman Laskowski, Andrew Martin and David Jones for the use of their computer programs.
REFERENCES
- 1.Bernstein F.C., Koetzle,T.F., Williams,G.J., Meyer,E.E.,Jr, Brice,M.D., Rodgers,J.R., Kennard,O., Shimanouchi,T. and Tasumi,M. (1977) J. Mol. Biol., 112, 535. [DOI] [PubMed] [Google Scholar]
- 2.Orengo C.A., Michie,A.D., Jones,S., Jones,D.T., Swindells,M.B. and Thornton,J.M. (1997) Structure, 5, 1093–1108. [DOI] [PubMed] [Google Scholar]
- 3.Jones S., Stewart,M., Michie,A., Swindells,M.B., Orengo,C.A. and Thornton,J.M.. (1998) Protein Sci., 7, 233–242. [DOI] [PMC free article] [PubMed] [Google Scholar]
- 4.Taylor W.R. and Orengo,C.A. (1989) J. Mol. Biol., 208, 1–22. [DOI] [PubMed] [Google Scholar]
- 5.Chothia C. (1992) Nature, 357, 543–544. [DOI] [PubMed] [Google Scholar]
- 6.Michie A.D., Orengo,C.A. and Thornton,J.M. (1996) J. Mol. Biol., 262, 168–185. [DOI] [PubMed] [Google Scholar]
- 7.Levitt M. and Chothia C. (1976) Nature, 261, 631–634. [DOI] [PubMed] [Google Scholar]
- 8.Orengo C.A. (1999) Protein Sci., 8, 699–715. [DOI] [PMC free article] [PubMed] [Google Scholar]
- 9.Russell R.B. and Barton,G.J. (1994) J. Mol. Biol., 244, 332–350. [DOI] [PubMed] [Google Scholar]
- 10.Hofmann K., Bucher,P., Falquet L. and Bairoch A. (1999) Nucleic Acids Res., 27, 215–219. [DOI] [PMC free article] [PubMed] [Google Scholar]
- 11.Attwood T.K., Flower,D.R., Lewis,A.P., Mabey,J.E., Morgan,S.R., Scordis,P., Selley,J.N. and Wright,W. (1999) Nucleic Acids Res., 27, 220–225. Updated article in this issue: Nucleic Acids Res. (2000) 28, 225–227.9847185 [Google Scholar]
- 12.Altschul S.F., Madden,T.L., Schaffer,A.A., Neuwald,A.F., Zhang,J., Zhang,Z., Miller,W. and Lipman,D.J. (1997) Nucleic Acids Res., 25, 3389–3402. [DOI] [PMC free article] [PubMed] [Google Scholar]
- 13.Eddy S.R. (1996) Curr. Opin. Struct. Biol., 6, 361–365. [DOI] [PubMed] [Google Scholar]
- 14.Park J., Teichmann,S.A., Hubbard,T. and Chothia,C. (1997) J. Mol. Biol., 273, 349–354. [DOI] [PubMed] [Google Scholar]
- 15.Park J., Karplus,K., Barrett,C., Hughey,R., Haussler,D., Hubbard,T. and Chothia,C. (1998) J. Mol. Biol., 284, 1201–1210. [DOI] [PubMed] [Google Scholar]
- 16.Benson D.A., Boguski,M.S., Lipman,D.J., Ostell,J., Ouellette,B.F.F., Rapp B.A. and Wheeler,D.L. (1999) Nucleic Acids Res., 27, 12–17. Updated article in this issue: Nucleic Acids Res. (2000) 28, 15–18. [DOI] [PMC free article] [PubMed] [Google Scholar]
- 17.Needleman S.B. and Wunsch,C.D. (1970) J. Mol. Biol., 48, 443–453. [DOI] [PubMed] [Google Scholar]
- 18. Bray,J., Todd,A.E., Pearl,F.M.G., Thornton,J.M. and Orengo,C.A. (2000) Protein Eng., in press. [DOI] [PubMed]
- 19.Todd A.E, Orengo,C.A. and Thornton J.M. (1999) Curr. Opin. Chem. Biol., 3, 548–556. [DOI] [PubMed] [Google Scholar]
- 20.Bleasby A.J., Akrigg,D. and Attwood,T.K. (1994) Nucleic Acids Res., 22, 3574–3577. [PMC free article] [PubMed] [Google Scholar]
- 21.Bairoch A. and Apweiler,R. (1999) Nucleic Acids Res., 27, 49–54. Updated article in this issue: Nucleic Acids Res. (2000) 28, 45–48.9847139 [Google Scholar]
- 22.Laskowski R.A., Hutchinson,E.G., Michie,A.D., Wallace,A.C., Jones,M.L. and Thornton,J.M. (1997) Biochem. Sci., 22, 488–490. [DOI] [PubMed] [Google Scholar]
- 23.Swindells M.B. (1995) Protein Sci., 4, 103–112. [DOI] [PMC free article] [PubMed] [Google Scholar]
- 24.Kraulis P.J. (1991) J. Appl. Cryst., 24, 946–950. [Google Scholar]
- 25.Merritt E.A. and Bacon,D.J. (1997) Methods Enzymol., 277, 505–524. [DOI] [PubMed] [Google Scholar]


