

Summary
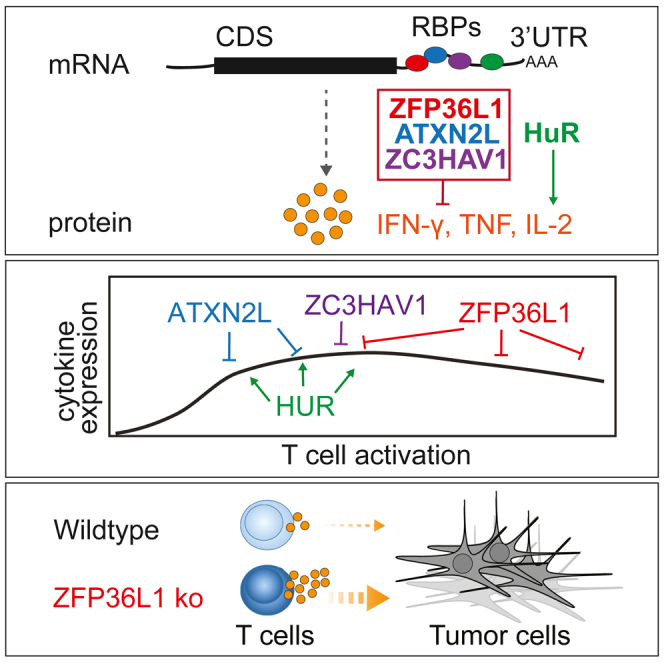
Potent T cell responses against infections and malignancies require a rapid yet tightly regulated production of toxic effector molecules. Their production level is defined by post-transcriptional events at 3′ untranslated regions (3′ UTRs). RNA binding proteins (RBPs) are key regulators in this process. With an RNA aptamer-based capture assay, we identify >130 RBPs interacting with IFNG, TNF, and IL2 3′ UTRs in human T cells. RBP-RNA interactions show plasticity upon T cell activation. Furthermore, we uncover the intricate and time-dependent regulation of cytokine production by RBPs: whereas HuR supports early cytokine production, ZFP36L1, ATXN2L, and ZC3HAV1 dampen and shorten the production duration, each at different time points. Strikingly, even though ZFP36L1 deletion does not rescue the dysfunctional phenotype, tumor-infiltrating T cells produce more cytokines and cytotoxic molecules, resulting in superior anti-tumoral T cell responses. Our findings thus show that identifying RBP-RNA interactions reveals key modulators of T cell responses in health and disease.
Keywords: post-transcriptional regulation, RNA binding proteins, human T cells, cytokines, ZFP36L1, HuR, ATXN2L, ZC3HAV1, tumor-infiltrating T cells
Graphical abstract
Highlights
-
•
RNA binding proteins (RBPs) dynamically interact with cytokine mRNAs in T cells
-
•
RBPs fine-tune the kinetics of cytokine production
-
•
RBPs use different mode of action to regulate cytokine production
-
•
RBP deficiency can boost anti-tumor responses
Popović et al. show that the dynamic interactions of RNA binding proteins (RBPs) with cytokine mRNAs define the functionality of human T cells. RBP depletion in T cells reveals RBP-specific kinetics and mode of action in regulating cytokine production. These findings may help improve T cell responses for therapeutic purposes.
Introduction
T cells are critical players in our defense against infections and malignancies. Their production of effector molecules such as granzymes and proinflammatory cytokines is key. Interferon-γ (IFN-γ) and tumor necrosis factor (TNF) are major contributors to anti-microbial and anti-tumoral T cell responses,1,2 with the most potent T cells co-producing the survival-inducing cytokine interleukin-2 (IL-2).3,4,5,6,7 Whereas the activity of cytokines on target cells is well characterized, the molecular switches that define their production are not well understood. Recently, post-transcriptional regulation (PTR) was found to dictate the cytokine production levels.8,9,10 We showed that the strength of T cell receptor signaling together with co-stimulation defines the synthesis and degradation rate of cytokine mRNA in T cells as well as their translation efficiency.11,12,13
The 3′ untranslated region (3′ UTR) of the mRNA is a major contributor to PTR. For instance, germline deletion of cis elements such as AU-rich sequences (AREs) from the Tnf and Ifng 3′ UTR results in hyperinflammation and immunopathology.14,15 Conversely, tumor-infiltrating T cells (TILs) fail to produce IFN-γ protein despite their continuous high expression of Ifng mRNA.16 Germline deletion of AREs from the Ifng 3′ UTR restored IFN-γ protein production in murine TILs and boosted their anti-tumoral potency.16 Notably, this augmented protein production was conserved in human T cells.17
RNA binding proteins (RBPs) are critical mediators of PTR that define the fate of mRNA.18 For instance, ZC3H12A (Regnase-1) and Rc3h1 (Roquin-1) prevent naive CD4+ T cells from exiting quiescence by destabilizing mRNAs encoding regulators of CD4+ T cell differentiation and function.19 In contrast, Arid5a promotes T cell differentiation by stabilizing Stat3 and Ox40 mRNA.20,21 We found that ZFP36L2 blocks translation of pre-formed cytokine mRNAs in resting memory T cells, thereby preventing aberrant protein production from these ready-to-deploy mRNAs.22 Importantly, reactivating memory T cells releases the Tnf and Ifng mRNA from ZFP36L2, thereby licensing the immediate cytokine production of memory T cells.22 Thus, RBPs substantially impact the acquisition and execution of T cell effector function. Which RBPs interact with cytokine 3′ UTRs upon T cell activation and define their protein production levels is, however, not well understood. A comprehensive study on RBP interactions with target mRNAs in T cells is lacking.
More than 2,000 RBPs have been annotated in mammalian cells.23,24,25,26 RNA-RBP interaction maps have been generated for 150 RBPs with crosslinked immunoprecipitation (CLIP) methods.27 However, both mRNA expression and RBP expression are cell-type specific,28 thereby prohibiting direct translation of RBP interaction maps from epithelial cell lines to human T cells. Furthermore, CLIP depends on the availability of suitable antibodies or tagging of endogenous RBPs.29 Therefore, to identify the RBPs that interact with cytokine mRNAs in an unbiased manner, an RNA-centric approach is required. With an RNA aptamer pull-down approach from primary human T cell lysates using full-length cytokine 3′ UTRs, we present the first comprehensive analysis of RBP-mediated regulation of T cell effector function, and we reveal the potential of RBP modulation in defining T cell responses to target cells.
Results
Cytokine 3′ UTRs define the protein production in murine and human T cells
To determine how cytokine 3′ UTRs contribute to protein production, we retrovirally transduced peripheral-blood-derived human T cells with GFP reporter constructs containing the full-length 3′ UTR of the human GZMB, IFNG, TNF, or IL2 mRNA. The empty GFP construct served as control (GFPcontrol). Whereas GZMB 3′ UTR only slightly reduced the GFP expression levels in non-activated CD8+ T cells compared with GFPcontrol, the presence of cytokine 3′ UTRs conferred a substantial loss of the GFP signal (Figures 1A and 1B). T cell activation with phorbol myristate acetate (PMA)/ionomycin for 6 h and 16 h marginally increased the protein expression for GFPcontrol and GFP-GZMB-3′ UTR (Figures 1A and 1C). In contrast, the GFP expression levels for cytokine 3′ UTR-containing constructs increased by 2- to 8-fold (Figures 1A and 1C). No loss of regulation was observed for endogenous cytokine production (Figure S1A). However, the increased GFP levels for cytokine 3′ UTRs in activated T cells did not reach the levels of GFPcontrol (Figure S1B), indicating further regulation of cytokine production also in activated T cells. Similar results were obtained with human CD4+ T cells, and with murine OT-I T cell receptor (TCR) transgenic CD8+ T cells expressing the murine Gzmb, Gzma and Prf1 3′ UTR, compared with the Ifng, Tnf, or Il2 3′ UTRs (Figures S1C–S1F). The regulation of protein expression by cytokine 3′ UTRs is thus profound and conserved.
Figure 1.

Conserved regulation of protein production by cytokine 3′ UTRs
(A) Representative histograms of human CD8+ T cells transduced with GFP reporter constructs containing indicated full-length 3′ UTRs or GFP empty control. T cells were resting (green histograms) or activated with PMA/ionomycin (PMA/I) for 6 h and 16 h (dashed and solid green lines, respectively).
(B) GFP gMFI in resting human CD8+ T cells. Data depict mean ± SD of three donors, representative of at least two independently performed experiments. One-way ANOVA with Dunnett’s multiple comparison with the control (∗∗∗∗p < 0.0001).
(C) Fold increase of GFP gMFI upon PMA/I activation compared with resting CD8+ T cells. Data depict mean ± SD of three donors, representative of two independently performed experiments. One-way ANOVA with Dunnett’s multiple comparison with the control (∗p < 0.05, ∗∗p < 0.01, ∗∗∗p < 0.001, ∗∗∗∗p < 0.0001).
(D) RBP binding motifs in cytokine 3′ UTRs. Top graph: number of motifs per 3′ UTR sequence. Bottom heatmap: motif density per 3′ UTR sequence. Color coding refers to indicated motif sequences. Putative RBP interactors indicated in parentheses, with RBPs detected in whole-cell T cell proteomics (Table S5) indicated in bold.
We next questioned which RBPs can interact with cytokine 3′ UTRs. We assessed putative RBP binding sites in silico with the ATtRACT database,30 which contains 2,297 consensus motifs for >140 RBPs. All three cytokine 3′ UTRs contain A-rich, AU-rich, CU-rich, U-rich, and G-rich motifs, and several poly(A) sites (PAS), which is also true for the GZMB 3′ UTR (Figures 1D and S1F). These motifs are potential RBP binding hubs for ZFP36 family members, ELAVL1 (HuR), KHSRP, PPIE, CSTF2, NUDT21, and other RBPs such as members of the protein families PCBP, PTBP, HNRNP, SRP, SRSF, PABP, RBM, and YTHDC (Figures 1D and S1F). In conclusion, cytokine 3′ UTRs contain a wide range of putative RBP binding sites, which warrants the identification of actual RBP interactors.
Identification of RBPs interacting with full-length cytokine 3′ UTRs
To experimentally identify the RBPs that interact with cytokine 3′ UTRs in human T cells, we generated in vitro transcribed streptavidin-binding 4xS1m RNA aptamers31 with full-length 3′ UTRs of IFNG, TNF, and IL2 (Figure 2A). The empty 4xS1m RNA aptamer served as control. Owing to its improved affinity to streptavidin, this 4xS1m aptamer system allows for efficient purification of ribonucleoproteins (RNPs).31 Because RBP expression is cell-type specific,28 we performed the RBP pull-down with lysates from human primary CD3+ T cells. T cells were isolated from three pools of 40 donors as RBP source and activated with α-CD3/α-CD28 for 2 days, prior to culture for 5 days in low IL-2 to generate non-activated effector T cells. At this time point CD69 expression was low and cytokine production undetectable (Figure S2A). Upon capture of RNA-RBP complexes with streptavidin beads, RNA-interacting proteins were identified by mass spectrometry (MS).
Figure 2.

Identification of RNA binding proteins that interact with IFNG, TNF, and IL2 3′ UTRs
(A) Scheme of RBP pull-down assay. Lysates of in vitro activated and expanded T cells from 40 pooled donors were incubated with in vitro transcribed empty control or full-length cytokine 3′ UTR-containing 4xS1m RNA aptamers. Protein binding to 4xS1m RNA aptamers was identified by label-free MS analysis.
(B) Heatmap of RBPs reproducibly enriched with 4xS1m RNA aptamers containing cytokine 3′ UTRs compared with control (n = 138, log2 fold change [LFC] > 4). Color scale represents Z-scored log2 median-centered averaged intensities. Numbers indicate clusters.
(C) Cluster analysis of RBP interaction specificities from (B). Red line depicts the average expression.
(D) Comparison of protein raw log2 median-centered intensities from the cytokine 3′ UTR pull-down versus control. Averaged expression levels of duplicates (IFNG) or triplicates (TNF and IL2). Purple dots: RBP identified in one pull-down experiment with LFC > 4 compared with control. Green dots: RBP reproducibly identified in at least two independently performed pull-down experiments. Gray dots: all proteins identified. n.d., not detected.
We detected in total 1,808 proteins, of which 598 proteins were detected in at least two of the three replicates in the cytokine 3′ UTR aptamer pull-downs with a log2 fold change (LFC) of >4 compared with the empty aptamer control (Figures S2B–S2D and Table S1). Of these, 307 proteins (51.3%) were experimentally confirmed or computationally predicted RBPs (n = 222 and n = 85, respectively; see STAR Methods). In the downstream analysis, we focused on RBPs that were enriched in at least two independently performed experiments. This included 138 RBPs, of which 93 RBPs were enriched for the IFNG 3′ UTR, 69 RBPs for TNF 3′ UTR, and 82 RBPs for the IL2 3′ UTR (Figures 2B and 2D; Table S1). Gene ontology (GO) analysis on all 138 detected RBPs showed enrichment for the terms “RNA processing” and “(m)RNA metabolic processes” (Figure S2E). “Translation” was enriched in IFNG- and TNF-associated RBPs, and “RNA splicing” in IFNG and IL2-associated RBPs (Figure S2E and Table S2).
Some RBPs were specifically enriched for one cytokine 3′ UTR, such as Fragile X mental retardation syndrome-related protein 2 (FXR2) and RBM27 for IFNG 3′ UTR, stress granule components ATXN2 and ATXN2L and poly(A)-tail-binding proteins PABPC1 for IL2 3′ UTR, and Pumilio homolog 1 (PUM1) for TNF 3′ UTR (Figures 2B–2D and Table S1). Other RBPs engaged with more than one cytokine 3′ UTR, including NOLC1, THOC1, and CHERP (IFNG and TNF), the splicing factor SYNCRIP (IFNG and IL2), and HNRNPAB (TNF and IL2; Figures 2B–2D and Table S1). RBPs interacting with all three cytokine 3′ UTRs include components of cleavage and polyadenylation specificity factor complex CPSF4, FIP1L1, the zinc-finger protein ZC3HAV1, and U binding protein HuR (ELAVL1) (Figures 2B–2D and Table S1). ZFP36L2, which we previously identified to bind to pre-formed Ifng and Tnf mRNA in resting memory T cells,22 was also detected but, with LFCs of 2.5 (IFNG), 1.9 (TNF), and 3.3 (IL2), it did not meet our stringent cutoff of LFC > 4 (Table S1). Notably, Roquin 1 (Rc3h1) and Roquin 2 (Rc3h2), previously shown to interact with Tnf mRNA,19 were not identified, which corroborates with their undetectable expression levels by MS analysis in the whole-cell T cell proteome (Table S5). In conclusion, using primary human T cell lysates as bait, we identified 138 RBPs that display specific or preferential interaction profiles with full-length cytokine 3′ UTRs.
The RBP binding landscape alters upon T cell activation
We and others previously showed that post-transcriptional events control cytokine production in T cells. External triggers can alter the expression levels of RBPs and/or result in post-translational modifications, which in turn can alter their RNA binding capacity.22,32,33 To determine how T cell activation modulates the RBP binding landscape, we performed the aptamer pull-down with lysates from 2 h PMA/ionomycin-activated CD3+ T cells, a setup that allows for rapid and homogeneous T cell activation (Figure 3A). We detected in total 1,596 proteins (Figure S2F and Table S3), of which 443 proteins were enriched with LFC > 4 in cytokine 3′ UTR samples compared with empty aptamer control. Two hundred forty-four proteins (55.1%) were annotated as RBPs, and 77 RBPs were detected in two independently performed experiments (Figure 3A and Table S3). Fifty-eight of these 77 RBPs displayed enriched binding to IFNG 3′ UTR, 63 RBPs to TNF 3′ UTR, and 22 RBPs to IL2 3′ UTR (Figure 3A). The number of reproducibly enriched RBPs with an LFC of > 4 for IL2 3′ UTR was low, precluding this dataset from GO analysis. RBPs interacting with the IFNG and TNF 3′ UTR in activated T cells included “RNA processing” and “(m)RNA metabolic processes” (Figure S2G and Table S4).
Figure 3.

The RBP landscape of IFNG, TNF, and IL2 3′ UTR alters upon T cell activation
(A) Heatmap of RBPs reproducibly enriched in pull-downs from PMA/I-activated T cells (2 h) with cytokine 3′ UTR-containing aptamers compared with control (n = 77; LFC > 4). Color scale represents Z-scored log2 median-centered averaged intensities.
(B) Protein raw log2 median-centered intensities from cytokine 3′ UTR pull-downs of non-activated T cells compared with activated T cells.
(C) Log2 fold change (LFC) of cytokine 3′ UTR pull-downs from non-activated to activated T cells correlated with the LFC of protein log2 intensities of the whole-cell proteome of non-activated versus activated T cells. In (B) and (C), expression levels of triplicates were averaged. Green and purple dots show proteins with enrichment LFC > 4 compared with control and LFC < −4 or LFC > 4 between non-activated and activated T cells. Purple dots: RBP identified in one pull-down experiment with LFC > 4 compared with control. Green dots: RBP reproducibly identified in at least two independently performed pull-down experiments. Gray dots: all proteins identified. n.d., not detected.
(D) Protein expression levels of indicated RBPs upon activation of human CD4+ memory T cells. Data from Wolf et al.34
We next studied whether RBPs alter their RNA binding profile upon T cell activation. Because the aptamer pull-down and MS analysis from non-activated and activated T cells was performed simultaneously with CD3+ T cell lysates from the same donors (Figures 2B and 3A), we were able to directly compare these two datasets. Interestingly, the interaction of AU-rich binding protein ZFP36L1 with all three cytokine 3′ UTRs considerably increased after T cell activation (Figure 3B). T cell activation also augmented the interaction of m6A-methylation reader YTH-domain-containing family protein 1 (YTHDF1) to the IFNG 3′ UTR, and of ribosomal RNA processing protein 1 homolog B (RRP1B) to the TNF 3′ UTR. RBPs enriched for IL2 3′ UTR included RRM-containing protein (RBM42), PC4, SFRS1-interacting protein (PSIP1), and WARS (Figure 3B). In contrast, ZC3H12D (Regnase-4) reduced its interaction to undetectable levels with all cytokine 3′ UTRs upon T cell activation, as did uridylyl transferase ZCCHC11 and PABPN1 to the IFNG 3′ UTR, ATP-dependent RNA helicase DDX39A and ZNHIT6 to the TNF 3′ UTR, and DDX46 and USO1 to the IL2 3′ UTR (Figure 3B).
Intriguingly, altered interactions with cytokine 3′ UTRs correlated only in some cases with altered RBP expression levels upon T cell activation. MS analysis of whole-cell lysates of activated and non-activated T cells (Table S5) revealed that the increased binding of ZFP36L1 to cytokine 3′ UTRs coincided with increased protein expression in activated T cells. Likewise, the reduced interaction of ZC3H12D with cytokine 3′ UTRs coincided with decreased protein expression (Figures 3C and S2H). Most other RBPs, however, such as WARS and YTHDF1 or DDX39A and DDX46, altered their binding to cytokine 3′ UTRs without changing their overall protein abundance (Figures 3C and S2H). We validated the protein expression levels for these RBPs in published datasets from reactivated memory T cells,34 and observed increased expression levels only for ZFP36L1 to up to 24 h of T cell activation (Figure 3D). In conclusion, T cell activation results in dynamic changes of the RBP binding landscape to cytokine 3′ UTRs, which can only in part be explained by altered RBP protein expression.
RBPs differentially modulate cytokine production in T cells
We next investigated whether and how the identified RBPs modulated the cytokine production in human effector T cells. To this end, we deleted five strong interactors by CRISPR-Cas9 gene editing in α-CD3/α-CD28 activated human CD3+ T cells (Table S6). FXR2, HuR, ZC3HAV1, and ATXN2L interacted with cytokine 3′ UTRs in both non-activated and activated T cells, and ZFP36L1 increased its binding upon T cell activation. Of note, cell count and viability did not substantially differ from control cells that were nucleofected with non-targeting CRISPR RNA (crRNA) (Figure S3A). To mimic TCR-dependent activation, RBP-deleted T cells were activated for 4 h with α-CD3/α-CD28. Deleting FXR2 had no effect on cytokine expression when compared with donor-matched control CD8+ T cells (Figures 4A and S3B). In sharp contrast, reduced HuR expression diminished the cytokine production (Figures 4A and S3B). Conversely, deleting ATXN2L, ZC3HAV1, or ZFP36L1 resulted in higher percentages of IFN-γ, TNF, and IL-2 producing CD8+ T cells (Figures 4A, 4B, and S3B). Native RNA immunoprecipitation (RIP) with antibodies directed against ATXN2L, ZC3HAV1, HuR, and ZFP36L1 confirmed direct interaction of these RBPs with endogenous cytokine mRNA (Figure 4C), indicating that these RBPs modulate cytokine production at least in part through direct interaction with cytokine mRNA. The RIP assays also confirmed preferential binding of RBPs to specific cytokine mRNAs, as shown in Figures 2B and 3A.
Figure 4.

RBP-specific modulation of cytokine production kinetics in human T cells
(A and B) (Top) Immunoblot of human T cells 7 days after CRISPR-Cas9 gene editing for indicated RBP or with non-targeting crRNA (ctrl). ZC3HAV1 long (L) and short (S) variant. (Bottom) IFN-γ and TNF protein expression of CD8+ T cells after 4-h α-CD3/α-CD28 activation. Brefeldin A was added for the last 2 h. Data are representative of at least two independent experiments, each with three donors.
(C) Native RNA immunoprecipitation (RIP) with ATXN2L, ZC3HAV1, HuR, and ZFP36L1 antibodies or respective immunoglobulin G (IgG) isotype control from PMA/I-activated (2 h) human T cell lysates (or 1 h for HuR). (Top) Enrichment of indicated RBP upon RIP, as determined by immunoblot. (Bottom) qRT-PCR of endogenous mRNAs from RIP of indicated RBPs or IgG control. Data compiled from three (ATXN2L, HuR) or two (ZC3HAV1, ZFP36L1) donors from independently performed experiments, with mean ± SD.
(D) IFN-γ and TNF production kinetics of CD3/α-CD28-stimulated ZFP36L1 KO or control CD8+ T cells. Brefeldin A was added for the last 2 h (for the 1 h time point from the start). Representative dot plots of intracellular cytokine staining of at least six donors from two independent experiments.
(E) Cytokine production kinetics of RBP KO CD8+ T cells compared with the peak of production of the paired non-targeting crRNA-treated control T cells (set at 100%). Data are presented as mean (bold line) and 3–6 individual donors (thin lines).
(F) gMFI of cytokine-producing RBP KO CD8+ T cells (of E) compared with paired control treated cells (set at 1). Data are presented as mean (bold line) and individual donors (thin lines).
RBPs display different kinetics in modulating cytokine production
We and others previously showed that IFN-γ, TNF, and IL-2 follow individual production kinetics in CD8+ T cells.12,35,36 To investigate how RBP depletion influences the cytokine production kinetics, we reactivated CD3+ T cells with α-CD3/α-CD28 for 1 h to up to 8 h, and measured cytokine production by adding brefeldin A for a maximum of 2 h.12 This snapshot analysis allowed us to define the activity kinetics of RBPs and their mode of action, as exemplified by ZFP36L1-deficient T cells: ZFP36L1 knockout (KO) CD8+ T cells show similar cytokine production profiles in the first 2 h but increase their production profile, in particular at later time points (Figure 4D).
Notably, when we followed the cytokine production kinetics of RBP KO T cells, we observed a time-dependent and RBP-specific contribution to the cytokine production kinetics. HuR-deficient CD8+ T cells showed reduced cytokine production upon 1–4 h of activation (Figures 4E, S3D, and S3E), a feature that was observed in CD8+ T cells but not in CD4+ T cells (Figures 4E and S4). Conversely, ATXN2L depletion augmented the cytokine production in CD8+ and CD4+ T cells early on, and did so most effectively for IL-2, where the peak of response was also earlier than that of control cells (Figures 4E, S3D, S3E, and S4). Differences in IFN-γ production were most prominent in per-cell basis of production, as defined by the geometric mean fluorescence intensity (gMFI) (Figure 4F). At later time points, the production kinetics followed the same slope as control T cells (Figures 4E, S3D, S3E, and S4). ZC3HAV1 deletion primarily increased the cytokine production in CD4+ and CD8+ T cells at the peak of the response, exceeding that of control T cells and from 4 h of activation onwards, but with no alterations in the kinetics of cytokine production (Figures 4E, S3D, and S3E).
ZFP36L1 deletion showed response rates in CD8+ T cells identical to those of ZC3HAV1 in the first 4 h of activation. However, ZFP36L1 deletion was the only RBP where the slope of reduced cytokine production at later time points diverged from the other RBP KO cells. In fact, high cytokine production was maintained until up to 8 h post T cell activation (Figures 4D, 4E, S3D, and S3E). Interestingly, ZFP36L1 KO CD8+ T cells showed the largest differences for IFN-γ and IL-2 production in percentages of cytokine-producing T cells, whereas TNF production primarily differed in the magnitude of production, as determined by the gMFI (Figures 4D–4F). The effects of ZFP36L1 depletion were also observed in CD4+ T cells, but to a lesser extent (Figure S4). In conclusion, the four tested RBPs regulate cytokine production in human T cells in an RBP-specific manner, displaying different effects in regulating the onset, magnitude, and duration of cytokine production (Figure S3F).
ZFP36L1 destabilizes cytokine mRNA in T cells
To investigate how RBPs modulate cytokine production, we measured their effect on mRNA stability. For ZFP36L1, ATXN2L, and ZC3HAV1 KO CD3+ T cells, CD3+ T cells were activated for 3 h with α-CD3/α-CD28, and de novo transcription was blocked with actinomycin D (ActD). Because of its earlier activity, we already treated HuR KO cells at 1 h post activation. Intriguingly, whereas deletion of ATXN2L, ZC3HAV1, or HuR had no effect on RNA stability or overall mRNA levels (Figures 5A and S5A), ZFP36L1 deletion substantially increased the mRNA half-life: for IFNG and IL2 from 50–60 min in control treated T cells to >120 min, and for TNF from 20–30 min to 40–50 min in ZFP36L1 KO T cells (Figure 5A). The increased mRNA stability also resulted in higher overall cytokine mRNA expression levels in activated ZFP36L1 KO T cells compared with control T cells (Figure 5B). A co-immunoprecipitation assay with α-ZFP36L1 antibodies from activated human CD3+ T cell lysates followed by MS analysis revealed that ZFP36L1 interacts with many components of the mRNA degradation machinery in T cells, including CNOT3, CNOT4, CNOT6L, CNOT7, CNOT10, and CNOT11 from the CCR4-NOT complex, and EXOSC1, EXOSC2, EXOSC5, EXOSC6, EXOSC7, EXOSC8, and EXOSC9 from the RNA 3′→5′ exosome complex (Figures 5C and S5B). Thus, ZFP36L1 dampens cytokine production in T cells by destabilizing its target mRNA.
Figure 5.

ZFP36L1 destabilizes IFN-γ, TNF, and IL-2 mRNA in human T cells
(A) Cytokine mRNA levels of ATXN2L, HuR, ZC3HAV1, and ZFP36L1 KO T cells and paired control treated T cells that were reactivated with α-CD3/α-CD28 for 3 h (HuR for 1 h) and then treated with actinomycin D (ActD) for indicated time points. Data are presented as mean ± SD of three donors and are representative of two independently performed experiments. Unpaired t test (∗p < 0.05, ∗∗p < 0.01).
(B) Cytokine mRNA levels of ZFP36L1 KO and control T cells reactivated for indicated time points with α-CD3/α-CD28. Data are presented as mean ± SD of three donors and are representative of two independently performed experiments. Ratio paired t test (∗p < 0.05, ∗∗p < 0.01).
(C) Co-immunoprecipitation with α-ZFP36L1 antibodies or IgG control from cytosolic lysates of 2 h PMA/I-activated human T cells, followed by MS analysis. Data represent protein raw log2 median-centered intensities from ZFP36L1 immunoprecipitation versus control. Expression levels of biological replicates were averaged (n = 3 donors). Green dots: putative interactors of ZFP36L1 identified with LFC > 6 compared with control. Gray dots: all proteins identified. n.d., not detected.
RBPs define the cytokine production of T cells in response to target cells
We next investigated how RBP depletion affected T cell responses to tumor target cells. RBPs that block cytokine production were depleted from T cells that were previously transduced with a MART1-specific TCR recognizing the HLA-A∗0201-restricted MART126–35 epitope37 (Figure S6A). The RBP-deficient or control treated MART1 TCR-expressing T cells were then exposed for different time points to a MART1hi HLA-A∗0201+ melanoma cell line (MART1+), or to a MART1lo HLA-A∗0201− melanoma control cell line (MART1−) (Figure S6B). At 2 h and 4 h after co-culture, ATXN2L KO CD8+ T cells showed higher IL-2 and TNF production, and ZC3HAV1 KO T cells displayed a slight but significant increase in TNF and IFN-γ producing CD8+ T cells at 4 h (Figure S6C), yet ZFP36L1 KO CD8+ T cells were superior cytokine producers (Figures 6A–6C). As previously reported,35,36 all T cells showed reduced cytokine production at 24 h of co-culture, in particular of IL-2 and TNF. At this time point, ZFP36L1 KO CD8+ T cells most robustly maintained the cytokine production (Figures 6B and 6C). Furthermore, ZFP36L1 KO CD8+ T cells maintained their capacity to co-produce several cytokines (Figure 6B), which is indicative for the most potent anti-viral and anti-tumoral CD8+ and CD4+ T cells in humans.3,4 This higher cytokine production—albeit to a lesser extent—was also observed for ATXN2L KO CD8+ T cells, which primarily maintained their capacity to produce IFN-γ (Figure 6B). Of note, RBP deletion did not substantially modulate the expression of surface molecules, such as CD3, CD69, CD137, or programmed cell death protein 1 (PD-1) (Figure S6D). In conclusion, depleting individual RBPs can boost and prolong cytokine production of T cells in response to target cells.
Figure 6.

RBPs regulate cytokine expression in tumor-specific human T cells
(A) MART1 TCR-engineered T cells were CRISPR-Cas9 gene edited for indicated RBP or control treated with non-targeting crRNA. Representative dot plots of cytokine production of MART1-specific CD8+ T cells after 6 h of co-culture with MART1+ tumor cells. Brefeldin A was added for the last 2 h. Data are representative of at least two independent experiments with 3–4 donors each.
(B) Cytokine profile analysis of MART1-specific CD8+ T cells. n = 3 donors, with mean ± SD. Data are representative of at least two independent experiments.
(C) Cytokine production in response to MART1+ tumor cells of n = 7 donors, compiled from two independently performed experiments. Ratio paired t test (∗p < 0.05, ∗∗p < 0.01, ∗∗∗p < 0.001).
Superior anti-tumoral responses by ZFP36L1-deficient T cells in vivo
Gradual loss of effector function, and in particular of IFN-γ and TNF, is a major hurdle of effective T cell responses to tumors.38,39 Furthermore, we previously showed that post-transcriptional mechanisms block IFN-γ production in murine TILs, although which RBPs mediate this regulation remains unknown.16 Thus, to study whether RBP deletion rescues cytokine production of TILs in vivo, we turned to mouse models. We focused our attention on ZFP36L1 and ATXN2L, which showed the most potent effects in human T cells (Figure 6). We generated murine Zfp36l1- and Atxn2l-deficient OT-I T cells by CRISPR-Cas9 gene editing. Whereas deletion of Atxn2l in OT-I T cells failed to recapitulate its role in regulating cytokine production in murine T cells (Figures S7A and S7B), Zfp36l1 KO OT-I T cells showed superior IFN-γ production to control cells upon 6h of activation with OVA257–264 peptide (Figures S7A and S7B). Thus, the regulation of cytokine production by ZFP36L1 is conserved.
To determine the role of ZFP36L1 in vivo, we injected 1 × 10⁶ OT-I Zfp36l1 KO or control OT-1 T cells into tumor-bearing mice that had received OVA-expressing B16 melanoma cells (B16-OVA; Figure 7A) 7 days earlier. Fourteen days post T cell transfer, we first analyzed the cytokine production of T cells in the spleen. The percentage of IFN-γ and IL-2 production in Zfp36l1 KO OT-I T cells was slightly, but not significantly, increased compared with control OT-I T cells (Figure S7C). We then turned our attention to tumor-infiltrating T cells. The absolute number of Zfp36l1 KO and control OT-I TILs did not substantially differ (Figure 7B), indicating that the Zfp36l1 deficiency had no overt effects on survival and/or proliferation. Also, PD-1 expression was consistently high in control and Zfp36l1 KO OT-I T cells (Figure S7D). Nonetheless, Zfp36l1 KO OT-I TILs showed slightly higher percentages of Tcf1−Tox+ terminally differentiated dysfunctional T cells and reduced percentages and significantly lower expression levels of Tcf1+ progenitor dysfunctional T cells (Figure 7C). Concomitant with this shift in transcription factor expression, Zfp36l1 KO OT-I TILs displayed lower Slamf6 expression and increased Tim-3 expression (Figure 7D), demonstrating that Zfp36l1 deletion could not rescue the dysfunctional state of T cells.
Figure 7.

ZFP36L1 dampens cytokine production in tumor-specific T cells in vivo
(A) B16-OVA tumor-bearing Ly5.1+ C57BL/6J mice received 1 × 10⁶ control or Zfp36l1 KO OT-I Ly5.2+ T cells 7 days post tumor engraftment. Tumors were excised 14 days after T cell transfer, and tumor-infiltrating T cells (TILs) were analyzed ex vivo.
(B) Absolute cell numbers of control and Zfp36l1 KO TILs per gram of tumor.
(C and D) (Left) Representative dot plots and (right) compiled data of percentages and gMFI of Tcf1 and Tox, and of Slamf6 and Tim-3 protein expression by control or Zfp36l1 KO OT-I TILs.
(E) (Left) Representative IFN-γ expression by control or Zfp36l1 KO TILs with or without reactivation with 100 nM OVA257–264 peptide for 4 h, and for the last 2 h with brefeldin A and monensin. (Right) Percentage and gMFI of IFN-γ producing TILs.
(F) (Left) Representative CD107a and granzyme B expression by control and Zfp36l1 KO TILs in the presence of brefeldin A and monensin for 2 h. (Right) Control and Zfp36l1 KO T cells were reactivated with 100 nM OVA257–264 peptide for 4 h, or left untreated, with brefeldin A and monensin for the last 2 h. In (A) to (F), n = 7 mice per group, with mean ± SD. Data are representative of two independent experiments. Unpaired t test (∗p < 0.05, ∗∗p < 0.01, ∗∗∗p < 0.001, ∗∗∗∗p < 0.0001).
(G) Tumor size of B16-OVA tumor-bearing Ly5.1+Ly5.2+ mice treated with 0.65 × 10⁶ Zfp36l1 KO or control OT-I Ly5.2+ T cells at day 7 after tumor injection. Dashed line set at 14 days after T cell transfer. n = 8 mice/group.
(H) Tumor size at day 21 (14 days after the T cell transfer). n = 8 mice/group. Unpaired t test (∗p < 0.05).
Despite their phenotypical appearance as of dysfunctional cells, Zfp36l1 KO TILs were superior cytokine producers. Control OT-I TILs failed to produce detectable levels of TNF and IL-2, and very limited production of IFN-γ was measured when tumor digests were incubated ex vivo for 2 h with brefeldin A and monensin without the addition of exogenous peptide (Figures 7E and S7E).16 Restimulation for 4 h with OVA257–264 peptide only marginally increased the cytokine expression in control OT-I TILs, in particular when compared with reactivated splenic OT-I T cells (Figures 7E, S7C, and S7E). In contrast, Zfp36l1 KO OT-I TILs not only produced significantly more IFN-γ when cultured with or without exogenous antigen (Figure 7E); they also showed increased production of TNF and IL-2 (Figure S7E). This was true for the percentage of cytokine-producing TILs and for the cytokine production per cell (Figures 7E and S7E). Also other effector molecules such as the degranulation marker CD107a and the cytotoxic molecule granzyme B were increased in Zfp36l1 KO TILs compared with control OT-I TILs (Figure 7F). This feature appeared to be unique to the tumor environment, because no difference in CD107a and granzyme B expression was observed in spleen-derived OT-I T cells (Figure S7F).
Because Zfp36l1 KO TILs displayed increased cytokine production and granzyme B expression, we hypothesized that Zfp36l1 deficiency could also influence the tumor outgrowth. We therefore measured the tumor growth over time in B16-OVA tumor-bearing mice that had received 0.65 × 10⁶ Zfp36l1 KO or control OT-I T cells. Remarkably, even these low numbers of transferred Zfp36l1 KO OT-I T cells could significantly delay the tumor outgrowth of this aggressive tumor (Figure 7G). In fact, at 14 days post T cell transfer, i.e., the time point when we measured superior cytokine production and degranulation in Zfp36l1 KO TILs ex vivo (Figures 7G and 7H), three of the eight control mice and none of the Zfp36l1 KO mice reached the human endpoint of 1,000 mm3 of tumor size (Figure 7H). In conclusion, Zfp36l1 gene editing in T cells results in superior cytokine producers in the tumor environment, which enhances the therapeutic potency of T cell therapy.
Discussion
Our study uncovers the breadth of RBP interactions with cytokine 3′ UTRs in human T cells. These RNA-RBP interactions are subject to alterations upon T cell activation. For ZFP36L1 and ZC3H12D, these alterations in RNA binding coincide with altered RBP protein expression. However, most RBPs maintain their expression profile upon T cell activation. It is therefore reasonable to consider that post-translational modifications contribute to these altered binding activities. For instance, stress-induced phosphorylation of HuR reduced its interaction with target mRNA in HeLa cells.40,41 Future studies that allow combined interrogation of the interactome and the phosphoproteome may shed light on such alterations.42 Alternatively, RBPs can also compete for binding, as shown for Arid5a and ZC3H12A on the STAT3 3′ UTR, and for HuR and ZFP36 (tristetraprolin [TTP]) on TNF and GM-CSF mRNA.20,43,44 Lastly, other RNA regulatory molecules such as microRNAs can compete with RBPs.45 Understanding these mechanisms that define RBP activity will further help decipher the role of RBPs in modulating T cell responses.
Overall, we identified between 60 and 90 RBPs interacting with each cytokine 3′ UTR, a number that corresponds well with reports from other RNA-centric RBP identification approaches with different RNA targets.46 It requires further investigation to discover whether these numbers stem from ample RBP binding to each RNA molecule or from heterogeneous RBP-RNA interactions within one T cell, which may result from different subcellular RNA (and RBP) localizations. It could also stem from heterogeneous expression of RBPs within the T cell population used for bait, due to the non-synchronous state found even in cultured T cells. Importantly, while the identification of some RBPs interacting with unmodified 3′ UTRs such as PABPs, ERI1, or YTHDF1 may sound counterintuitive, it very well represents the biological activity of these proteins. Not only are putative binding motifs for these RBPs found in cytokine 3′ UTRs (Figure 1D), but YTHDF1 also interacts with non-methylated RNA, albeit with a lower affinity.47 Integrating the information of putative binding motifs with the identified RBPs can thus further filter for the most probable RBP binders. Nonetheless, future studies are required to experimentally validate the RNA-RBP interactions. Furthermore, because we used whole-cell T cell lysates for the pull-down, it is yet to be defined at which subcellular localization the mRNA-RBP interactions occurred or whether nuclear RBPs translocated to the cytosol upon T cell activation. In sum, our study highlights the potential to screen for RNA-RBP interactions from full-length 3′ UTRs, forming the basis from which to further decipher the functional consequences of these interactions. Of note, because of the stringent cutoff of LFC > 4, the provided RBP list may not be complete. Nevertheless, it also holds fewer contaminants. RBP candidates with lower confidence are available in Tables S1 and S3 and can be further investigated. Irrespective of the confidence threshold employed, all identified RBPs require further validation through, e.g., RIPs to measure interactions with endogenous RNAs and through defining their mode of action through genetic modifications.
Validation studies of RBPs identified in the pull-down assay revealed that four out of five tested RBPs modulate cytokine production in human T cells. Intriguingly, we observed RBP-specific effects on cytokine production, including their mode of action and their activity kinetics. HuR promotes cytokine production in human T cells at the onset (1–2 h) of T cell activation. This early boost in cytokine production may in particular be relevant for antigen-experienced T cells, which contain pre-formed mRNA and for which immediate cytokine production is licensed by releasing the ready-to deploy mRNA from ZFP36L2.12,22 We found here that this early cytokine production is further facilitated by HuR. How HuR regulates cytokine production is yet to be defined. Because we found no effects on mRNA stability, we postulate that HuR influences translation directly, or indirectly by rendering mRNA accessible to the translation machinery through altering its subcellular localization or competing with other RBPs.
ZFP36L1, ATXN2L, and ZC3HAV1 block cytokine production most effectively at 4–8 h post activation, with ZFP36L1 (and ATXN2L) also blocking at 24 h of T cell activation. ATXN2L and ZC3HAV1 do not affect RNA stability and thus dampen cytokine production through other post-transcriptional events. These could include nuclear export of RNA or altered subcellular localization, or entail interference with the translation machinery. In epithelial cell lines, ATXN2L regulates stress granules and processing bodies.48 ZC3HAV1 destabilizes IFNB and IFNL3 mRNAs in hepatocytes and human cytomegalovirus RNA in fibroblasts, and inhibits programmed ribosomal frameshifting of the SARS-CoV-2 virus.49,50,51 The mechanisms employed by ATXN2L and ZC3HAV1 in T cells to suppress cytokine production, however, await further elucidation. ZFP36L1 destabilizes all three key cytokines produced by effector CD8+ T cells and does so at least in part through target mRNA degradation. ZFP36L1 was shown to interact with CNOT7, a component of the CCR4-NOT mRNA degradation complex in 293T cells,52 and CNOT7 degraded ZFP36 targets in HeLa cells.53,54 We here extended these findings of ZFP36L1 interactions to many other members of the CCR4-NOT complex and to several exonucleases. In sum, all three negative regulators of cytokine production, i.e., ZFP36L1, ATXN2L, and ZC3HAV1, highlight their critical contribution in preventing excessive production of cytokines in activated T cells. Having multiple RBP regulators with different modes of action and different activity kinetics also further highlights the necessity of fine-tuning the production of cytokines for appropriate T cell function.
Combined deletion of ZFP36 family members was previously shown in mouse models to modulate T cell responses to infection.55 Here, we report that the single deletion of ZFP36L1 in human T cells augments cytokine production and delays the shutdown of cytokine production when T cells are exposed to tumor cells. Therefore, ZFP36L1 might act as a checkpoint mechanism to avoid excessive cytokine production and guarantee immune homeostasis. Importantly, T cells lose their capacity to produce cytokines within the tumor environment, a process previously shown by us to rely on post-transcriptional events.16,17 In this study, we found that deleting ZFP36L1 boosts the effector function of TILs in vivo, which resulted in superior anti-tumor responses. ZFP36L1 deletion improves the production not only of IFN-γ but also that of TNF and IL-2 and that of cytotoxic mediators granzyme B and CD107a, indicating that ZFP36L1 instructs several T cell effector programs. Intriguingly, as also previously reported in other models,56 the dysfunctional state was uncoupled from functionality. Possibly the TIL phenotype is influenced by cytokine-mediated alterations of the tumor microenvironment. Alternatively, ZFP36L1 could also directly instruct the expression levels of transcription factors, yet the effector program predominates. Irrespective of the mechanism, we conclude that ZFP36L1 represents an attractive target to boost anti-tumoral T cell effector responses.
In sum, we provide here the first catalog of dynamic RBP interactions with cytokine 3′ UTRs in human T cells. Our results reveal that this map can serve as a valuable resource for studying the role of RBPs in regulating T cell responses to identify RBPs as potential targets for therapeutic purposes. Considering the association of RBPs with human genetic disorders,57 our work should pave the way to support further studies regarding the role of RBPs in other immune-related disease settings.
Limitations of the study
To reduce false-positive calls of RBP interaction with cytokine 3′ UTRs, we used a stringent cutoff of LFC > 4. This cutoff does not mean that a value of LFC < 4 is not a valid target (as exemplified by ZFP36L2) or that LFC > 4 is a proven RBP interaction. All calls require further validation. Furthermore, the non-crosslinking approach we applied for the RNA aptamer pull-down and the RIP assays may select for high-affinity RNA-RBP interactions. Weak interactions with RNA may therefore remain undetected. Irrespective of this restriction, we identify >100 RBPs interacting with cytokine 3′ UTRs. This high number of identified RBPs could stem from heterogeneity of RBP-RNA interactions between different T cells or from heterogeneous binding to specific mRNAs within the same T cell. It may thus reflect a broad spectrum of mRNA-RBP interactions that are possible in T cells.
STAR★Methods
Key resources table
| REAGENT or RESOURCE | SOURCE | IDENTIFIER |
|---|---|---|
| Antibodies | ||
| Rat anti-mouse IgG2a (clone MW1483) | Sanquin | n/a |
| Mouse anti-CD28 (clone CD28.2) | Biolegend | Cat# 302902; RRID:AB_314304 |
| Mouse anti-CD3 (clone HIT3a) | Biolegend | Cat# 300302; RRID:AB_314038 |
| Rabbit polyclonal anti-ZFP36L1 | Sigma-Aldrich | Cat# ABN192 |
| Rabbit polyclonal anti-ZFP36L1 | Abcam | Cat# ab42473; RRID:AB_883662 |
| Rabbit polyclonal anti-ZC3HAV1 | GeneTex | Cat# GTX120134; RRID:AB_10721153 |
| Rabbit polyclonal anti-ZC3HAV1 | Invitrogen | Cat# PA5-31650; RRID:AB_2549123 |
| Rabbit polyclonal anti-ATXN2L | Abcam | Cat# ab99304; RRID:AB_10674406 |
| Rabbit polyclonal IgG | Sigma-Aldrich | Cat# 12-370; RRID:AB_145841 |
| Mouse anti-HuR (clone 3A2) | Santa Cruz Biotechnology | Cat# sc-5261; RRID:AB_627770 |
| Mouse IgG1 kappa Isotype Control (P3.6.2.8.1) | eBioscience | Cat# 14-4714-82; RRID:AB_470111 |
| Mouse anti-rabbit IgG light chain (HRP) | Abcam | Cat# ab99697; RRID:AB_10673897 |
| Goat polyclonal anti-mouse IgG(H + L), human ads-HRP | Southern Biotech | Cat# 1031-05; RRID:AB_2794307 |
| Mouse anti-RhoGDI | Abnova | Cat# 89-113-917 |
| Goat polyclonal anti-rabbit IgG(H + L), mouse/human ads-HRP | Southern Biotech | Cat# 4050-05; RRID:AB_2795955 |
| BUV737 mouse anti-human CD4 (clone SK3) | BD Biosciences | Cat# 564305; RRID:AB_2713927 |
| Alexa Fluor® 700 mouse anti-human CD4 (clone RPA-T4) | BD Biosciences | Cat# 557922; RRID:AB_396943 |
| BUV805 mouse anti-human CD8 (clone SK1) | BD Biosciences | Cat# 612889; RRID:AB_2833078 |
| eFluor 450 mouse anti-human IFN gamma (clone 4S.B3) | eBioscience | Cat# 48-7319-42; RRID:AB_2043866 |
| PE-Cy7 mouse anti-human TNF (clone MAb11) | BD Biosciences | Cat# 557647; RRID:AB_396764 |
| Brilliant Violet 785™ anti-human TNF (clone MAb11) | Biolegend | Cat# 502948; RRID:AB_2565858 |
| Alexa Fluor® 488 rat anti-human IL-2 (clone MQ1-17H12) | Biolegend | Cat# 500314; RRID:AB_493368 |
| Alexa Fluor® 647 mouse anti-human CD137 (4-1BB) (clone 4B4-1) | Biolegend | Cat# 309824; RRID:AB_2566258 |
| BUV395 mouse Anti-human CD69 (clone FN50) | BD Biosciences | Cat# 564364; RRID:AB_2738770 |
| FITC mouse anti-human CD279 (PD-1) Antibody | Biolegend | Cat# 329904; RRID:AB_940479 |
| PE-Cyanine7 armenian hamster anti-TCR beta (clone H57-597) | eBioscience | Cat# 25-5961-82; RRID:AB_2573507 |
| PE-Cyanine7 mouse anti-mouse CD45.1 (clone A20) | eBioscience | Cat# 25-0453-82; RRID:AB_469629 |
| PerCP-Cyanine5.5 mouse anti-mouse CD45.2 (clone 104) | eBioscience | Cat# 45-0454-82; RRID:AB_953590 |
| BUV395 rat anti-mouse CD8a (clone 53–6.7) | BD Biosciences | Cat# 565968; RRID:AB_2739421 |
| Alexa Fluor 488 rat anti-mouse CD107a (LAMP-1) (clone 1D4B) | eBioscience | Cat# 53-1071-82; RRID:AB_657536 |
| APC rat anti-mouse IFN gamma (clone XMG1.2) | eBioscience | Cat# 17-7311-82; RRID:AB_469504 |
| PE mouse anti-mouse TNF alpha (clone MP6-XT22) | eBioscience | Cat# 12-7321-82; RRID:AB_466199 |
| eFluor 450 rat anti-mouse IL-2 (clone JES6-5H4) | eBioscience | Cat# 48-7021-82; RRID:AB_1944462 |
| Alexa Fluor® 700 mouse anti-human/mouse Granzyme B (clone GB11) | BD Biosciences | Cat# 560213; RRID:AB_1645453 |
| TCF1/TCF7 (C63D9) Rabbit mAb (PE Conjugate) (clone C63D9) | Cell Signaling Technology | Cat# 14456; RRID:AB_2798483 |
| TOX Antibody, anti-human/mouse, APC, REAfinity™ (clone REA473) | Miltenyi Biotec | Cat# 130-118-335; RRID:AB_2751485 |
| Pacific Blue™ anti-mouse Ly108 Antibody (clone 330-AJ) | Biolegend | Cat# 134608; RRID:AB_2188093 |
| PE-Cyanine7 rat anti-mouse CD366 (TIM3) (clone RMT3-23) | eBioscience | Cat# 25-5870-80; RRID:AB_2573482 |
| BV786 hamster anti-mouse CD279 (PD-1) (clone J43) | BD Biosciences | Cat# 744548; RRID:AB_2742319 |
| Bacterial and virus strains | ||
| Subcloning Efficiency DH5α Competent Cells | Invitrogen | Cat#18265017 |
| Biological samples | ||
| Human PBMC | Sanquin | n/a |
| Chemicals, peptides, and recombinant proteins | ||
| TRIzol Reagent | Invitrogen | Cat# 15596018 |
| BD GolgiPlug Protein Transport Inhibitor (containing Brefeldin A) | BD Biosciences | Cat# BD 555029, RRID: AB_2869014 |
| Trypsin Gold, Mass Spectrometry Grade | Promega | Cat# V5280 |
| TrueCut™ Cas9 Protein v2 | Invitrogen | Cat# A36499 |
| Recombinant Murine IL-7 | Peprotech | Cat# 217-17 |
| Recombinant human IL-15 | Peprotech | Cat# 200-15 |
| Recombinant human IL-2 (Proleukin, Aldesleukin) | Clinigen | n/a |
| GeneJammer | Agilent | Cat# 204130 |
| RetroNectin | Takara Bio | Cat# T100B |
| OVA Peptide (257–264) | GenScript | Cat# RP10611 |
| MART-1/MELAN-A (26–35), human | Leiden University Peptide Facility | n/a |
| Phorbol 12-myristate 13-acetate (PMA) | Sigma-Aldrich | Cat# P8139 |
| Ionomycin calcium salt | Sigma-Aldrich | Cat# 13909 |
| Actinomycin D | Sigma-Aldrich | Cat# A9415 |
| Power SYBR™ Green PCR Master Mix | Applied Biosystems | Cat# 4367660 |
| RNase A, DNase and protease-free (10 mg/mL) | Thermo Scientific | Cat# EN0531 |
| RNaseOUT™ Recombinant Ribonuclease Inhibitor | Invitrogen | Cat# 10777019 |
| Ribonucleoside Vanadyl Complex | New England Biolabs | Cat# S1402S |
| Halt™ Protease and Phosphatase Inhibitor Single-Use Cocktail, EDTA-Free (100X) | Thermo Scientific | Cat# 78443 |
| cOmplete™, Mini, EDTA-free Protease Inhibitor Cocktail | Roche | Cat# 11836170001 |
| Digitonin, High Purity | Calbiochem | Cat# 300410 |
| Lympholyte-M | Cederlane | Cat# CL5035 |
| Dynabeads™ Protein A for Immunoprecipitation | Invitrogen | Cat# 10008D |
| Dynabeads™ Protein G for Immunoprecipitation | Invitrogen | Cat# 10003D |
| Streptavidin Sepharose® High Performance | GE Healthcare | Cat# GE17-5113-01 |
| LIVE/DEAD™ Fixable Near-IR Dead Cell Stain Kit, for 633 or 635 nm excitation | Invitrogen | Cat# L34976 |
| Critical commercial assays | ||
| P2 Primary Cell 4D-Nucleofector™ X Kit S | Lonza | Cat# V4XP-2032 |
| SuperScript™ III First-Strand Synthesis System | Invitrogen | Cat# 18080051 |
| Fixation/Permeabilization Solution Kit with BD GolgiPlug™ | BD Biosciences | Cat# 555028 |
| AmpliScribe™ T7-Flash™ Transcription Kit | Epicentre | Cat# ASF3507 |
| mini Quick Spin Oligo Columns | Roche | Cat# 11814397001 |
| RNA 6000 Nano | Agilent | Cat# 5067-1511 |
| CD8a+ T cell Isolation Kit, mouse | Miltenyi Biotec | Cat# 130-104-075 |
| Deposited data | ||
| Raw data files Mass Spectrometry analysis (ProteomeXchange) | This paper | PRIDE: PXD028171 |
| Experimental models: Cell lines | ||
| Human: Plat-E cells | Morita et al., 200058 | n/a |
| Human: FLYRD18 cells | ECACC | Cat# 95091902 |
| Mouse MEC.B7.SigOVA cells | Van Stipdonk et al., 200359 | n/a |
| Mouse B16-OVA cells | de Witte et al., 200660 | n/a |
| Human Mel526 cells | Marincola et al., 199461 | n/a |
| Human Mel888 cells | Marincola et al., 199461 | n/a |
| Experimental models: Organisms/strains | ||
| Mouse: B6.SJL-Ptprca Pepcb/BoyJ (Ly5.1) | The Jackson Laboratory | RRID:IMSR_JAX:002014 |
| Mouse: C57BL/6JRj (Ly5.2) | Janvier Labs | https://www.janvier-labs.com/en/fiche_produit/c57bl-6jrj_mouse/ |
| Mouse: C57BL/6J/Ly5.1/Ly5.2 | This paper | n/a |
| Mouse: C57BL/6-Tg(TcraTcrb)1100Mjb/J (OT-I) | The Jackson Laboratory | RRID:IMSR_JAX:003831 |
| Oligonucleotides | ||
| Human ZFP36L1 (CRISPR-Cas9 crRNA_1) 5'-AAACGGT GCCTGTAAGTACG-3' |
This paper | n/a |
| Human ZFP36L1 (CRISPR-Cas9 crRNA_2) 5'-GTCTCGC GAGCTCAGAGCGG-3' |
This paper | n/a |
| Human FXR2 (CRISPR-Cas9 crRNA_1) 5'- GGAGCCGGG ACTGCCCGTCG-3' |
This paper | n/a |
| Human FXR2 (CRISPR-Cas9 crRNA_2) 5'- GGTAGCCGG ACATCCCCAAA-3' |
This paper | n/a |
| Human FXR2 (CRISPR-Cas9 crRNA_3) 5'- TCCCTTCATC ATCCGCACCC-3' |
This paper | n/a |
| Human ZC3HAV1 (CRISPR-Cas9 crRNA_1) 5'-AAAATCCT GTGCGCCCACGG-3' |
This paper | n/a |
| Human ZC3HAV1 (CRISPR-Cas9 crRNA_2) 5'-GTCTCTGG CAGTACTTGCGA-3' |
This paper | n/a |
| Human ZC3HAV1 (CRISPR-Cas9 crRNA_3) 5'-CAGAGATG CAGGTTATCGCA-3' |
This paper | n/a |
| Human HuR (CRISPR-Cas9 crRNA_1) 5'-TGTGAACTACGT GACCGCGA-3' |
This paper | n/a |
| Murine ZFP36L1 (CRISPR-Cas9 crRNA_1) 5'- AAACGGTGC CTGTAAGTACG-3' |
This paper | n/a |
| Murine ZFP36L1 (CRISPR-Cas9 crRNA_2) 5'- GAGTGACCG AGTGCCTGCGA-3' |
This paper | n/a |
| CRISPR-Cas9 tracrRNA | IDT | Cat# 1072533 |
| Alt-R® CRISPR-Cas9 tracrRNA, ATTO™ 550 | IDT | Cat# 1075928 |
| Murine GZMB 3′UTR F GGGGTCGACCTACAGAAGCAACATGGATCC |
This paper | n/a |
| Murine GZMB 3′UTR R CCCTTTGCGGCCGCTTTTATTTGATTTTACATCATTTTTGTCC |
This paper | n/a |
| Murine IFNG 3′UTR F CCATCGATGGATCCGTCGACTGCTGA TTCGGGGTGGGG |
This paper | n/a |
| Murine IFNG 3′UTR R CATCGATGCGGCCGCGGTTGCAAAG GTATACTTTATTC |
This paper | n/a |
| Murine TNF 3′UTR F CCATCGATGGATCCGGGAATGGGTGT TCATCCATTC |
This paper | n/a |
| Murine TNF 3′UTR R CCCTTTGCGGCCGCTTTATTTCTCTCA ATGACCCGTAGG |
This paper | n/a |
| Murine IL2 3′UTR F CCATCGATGGATCCCTATGTACCTCCT GCTTACAACAC |
This paper | n/a |
| Murine IL2 3′UTR R CCCTTTGCGGCCGCTTTTTTTTTTTTTTTAGAGGAGAGCTTT ATTTC |
This paper | n/a |
| Human GZMB 3′UTR F CCCGGATCCCTACAGGAAGCAAAC TAAGCCCC |
This paper | n/a |
| Human GZMB 3′UTR R GGGGCGGCCGCTTTTTTTTTTTTTTTTTTTTTTTTTTTTTTTTC CACTCAG |
This paper | n/a |
| Human IFNG 3′UTR F CGGGATCCGGTTGTCCTGCCTGCA ATATTTG |
This paper | n/a |
| Human IFNG 3′UTR R CCCTTTGCGGCCGCTTTTTTTTTTTT TTTTTTTTTTTTTTTTTTGTTGTGAACTTACACTTTATTC |
This paper | n/a |
| Human TNF 3′UTR F CCATCGATGGAGGACGAACATCCAACCTTCC |
This paper | n/a |
| Human TNF 3′UTR R GGGGGATCCTTTTTTTTTTTTTCTTTTCTAAGCAAACTTTATT TCTCGCC |
This paper | n/a |
| Human IL2 3′UTR F CCATCGATTAATTAAGTGCTTCCCACTTAAAAC |
This paper | n/a |
| Human IL2 3′UTR R GGGGGATCCTTTTTTTTTTTTTTTTTTTTTTTTTTATATTTATC AAATTTATTAAATAG |
This paper | n/a |
| Recombinant DNA | ||
| pRETRO-SUPER GFP | Brummelkamp et al., 200262 | n/a |
| pSP73-4xS1m | Leppek et al., 201431 | n/a |
| Software and algorithms | ||
| FlowJo v10 | BD Biosciences | https://www.flowjo.com/ |
| GraphPad Prism v8 | GraphPad Software | https://www.graphpad.com/ |
| MaxQuant version v1.6.2.10 | Cox et al., 200863 | https://www.maxquant.org/ |
| R environment for statistical computing v4.0.3 | The R foundation | https://www.r-project.org/ |
| RStudiov1.3.1093 | RStudio | https://www.rstudio.com/ |
| Xcalibur Software v4.3.73.11 | ThermoFisher Scientific | https://www.thermofisher.com/order/catalog/product/OPTON-30967 |
| StepOne Software v2.3 | Applied Biosystems | https://www.thermofisher.com/nl/en/home/technical-resources/software-downloads/StepOne-and-StepOnePlus-Real-Time-PCR-System.html |
| Other | ||
| TissueLyser II | Qiagen | Cat# 85300, RRID:SCR_018623 |
| 4D-Nucleofector® X Unit | Lonza | Cat# AAF-1003X |
Resource availability
Lead contact
Further information and requests for resources and reagents should be directed to and will be fulfilled by the lead contact, Monika C. Wolkers (m.wolkers@sanquin.nl).
Materials availability
This study did not generate new unique reagents.
Experimental model and subject details
Mice
C57BL/6J/Ly5.1, C57BL/6J/Ly5.1/Ly5.2 and C57BL/6J.OTI T cell receptor (TCR) transgenic mice (OT-I) mice were bred in-house at the Netherlands Cancer Institute (NKI). Experiments were performed with 6–12 week-old female mice in accordance with institutional and national guidelines and approved by the Experimental Animal Committee at the NKI.
T cell activation and culture
Human T cells from anonymized healthy donors were used in accordance with the Declaration of Helsinki (Seventh Revision, 2013) after written informed consent (Sanquin). Peripheral blood mononuclear cells (PBMCs) were isolated through Lymphoprep density gradient separation (Stemcell Technologies). Cells were used after cryopreservation. Human T cells were activated for 48 h as previously described.64 Briefly, 24-well plates were precoated overnight at 4°C with 4 μg/mL rat α-mouse IgG2a (MW1483, Sanquin) in phosphate-buffered saline (PBS). Plates were washed and coated for >3 h with 1 μg/mL α-CD3 (HIT3a, Biolegend) at 37°C. The 1 × 10⁶ CD3+ enriched PBMCs/well were seeded with 1 μg/mL soluble α-CD28 (CD28.2, Biolegend) in 1 mL IMDM supplemented with 10% fetal bovine serum (FBS), 100 U/mL penicillin, 100 μg/mL streptomycin, and 2 mM L-glutamine. After 48 h of incubation at 37°C, 5% CO2, cells were harvested and further cultured in standing T25/75 tissue culture flasks (Thermo Scientific) at a density of 0.8 × 10⁶/mL in IMDM supplemented with 5% heat-inactivated human serum (Sanquin), 5% FBS and 100 IU/mL recombinant human (rh) IL-2 (Proleukin, Clinigen). Medium was refreshed every 3 days. Upon nucleofection, T cells were cultured in T cell mixed media (Miltenyi) supplemented with 5% heat-inactivated human serum, 5% FBS, 100 U/mL Penicillin, 100 μg/mL streptomycin, 2 mM L-glutamine, 100 IU/mL rhIL-2 and 10 ng/mL rhIL-15 (Peprotech).
OT-I T cells were purified from spleens, activated, and cultured as previously described.11 Briefly, murine CD8+ T cells were purified from OT-I splenocytes by negative MACS selection according to the manufacturer’s protocol (CD8a+ T cell Isolation Kit, Miltenyi). A total of 1 × 10⁶ MACS-purified CD8+ OT-I T cells were activated for 20 h with 0.1 × 10⁶ preseeded MEC.B7.SigOVA cells59 in 24-well plates. Cells were cultured in IMDM supplemented with 10% FBS, 100 U/mL Penicillin, 100 μg/mL streptomycin, 2 mM L-glutamine and 15 μM 2-mercaptoethanol. Activated T cells were harvested, washed, and put to rest for 3–7 days in the presence of 10 ng/mL recombinant murine IL-7 (PeproTech).
Method details
Cloning and preparation of in vitro transcribed S1m aptamers
Full-length 3′ UTRs were amplified from human, or from C57BL/6J mouse-derived genomic DNA and cloned into BamHI and NotI sites of pRETRO-SUPER GFP62 downstream of GFP (Table S6). 4xS1m RNA aptamers containing the full-length 3′ UTR of human IFNG, TNF and IL2 were cloned into the pSP73-4xS1m vector31 and in vitro transcribed with AmpliScribe T7 flash transcription kit (Epicentre) as previously described.22 RNA quality and quantity was determined by RNAnano Chip assay (Agilent).
Retroviral transduction
Transduction of T cells was performed with Retronectin (Takara) as previously described.22,64 Briefly, non-tissue cultured treated 24-well plates were coated overnight with 50 μg/mL Retronectin (Takara), washed once with 1 mL/well PBS prior to adding 300–500 μL/well viral supernatant. Plates were centrifuged for 30 min at 4 °C at 4500 rpm (2820 g). 1 × 10⁶ T cells were added/well, spun for 5 min at 1000 rpm (180 g), and incubated overnight at 37°C. The following day, cells were harvested and cultured in T25/75 flasks at a concentration of 0.8 × 10⁶ cells/mL for 6–8 days in presence of rhIL-2 and rhIL-15.
4xS1m RNA aptamer-protein pull-down
Human CD3+ T cells were activated for 48 h with α-CD3/α-CD28 and rested for 5 days in the presence of 100 IU/mL rhIL-2 as described above. T cells were left untreated or activated for 2 h with PMA/Ionomycin, pelleted and washed twice with ice-cold PBS. Cell pellet was snap frozen in liquid nitrogen, homogenized using 5-mm steel beads and a tissue lyser (Qiagen TissueLyser II) 6x at 25 Hz for 15 s. The homogenate was then solubilized and precleared with Avidin agarose beads (Thermo Scientific) for 30 min at 4°C and with Streptavidin Sepharose High Performance beads (GE Healthcare) for 2 h at 4°C. Cell lysates were incubated with RNA-aptamer-coupled beads for 3.5 h at 4°C under rotation in the presence of 60 U RNasin (Ambion). For each pull-down, 30 μg of in vitro transcribed RNA, coupled to Streptavidin Sepharose beads, and 5–10 mg cell lysate protein was used. RNA-bound proteins were eluted by adding 1 μg RNaseA (Thermo Scientific) in 100 μL 100 mM Tris-HCl, pH 7.5 (Gibco-Invitrogen). Proteins were reduced, alkylated, and digested into peptides using trypsin (Promega). Peptides were desalted and concentrated using Empore-C18 StageTips and eluted with 0.5% (v/v) acetic acid, 80% (v/v) acetonitrile. Sample volume was reduced by SpeedVac and supplemented with 2% acetonitrile and 0.1% TFA.
Co-immunoprecipitation
Cytoplasmic lysates of 100 × 106 PMA/Ionomycin-activated human CD3+ T cells were prepared using lysis buffer (140 mM NaCl, 5 mM MgCl2, 20 mM Tris/HCl pH7.6, 1% Digitonin) freshly supplemented with 1% of protease inhibitor cocktail (Sigma). Protein A Dynabeads (Invitrogen) were prepared according to the manufacturer’s protocol. The lysate was immunoprecipitated for 4 h at 4°C with 10 μg polyclonal rabbit α-ZFP36L1 (ABN192, Sigma-Aldrich) or with isotype control (12–370, Sigma-Aldrich). Beads were washed twice with wash buffer (150 mM NaCl, 10 mM Tris/HCl pH7.6, 2 mM EDTA, protease/phosphatase inhibitor cocktail) and twice with 10 mM Tris/HCl pH7.6. Immunoprecipitated proteins were reduced and on-bead alkylated. Proteins were detached with 250 ng trypsin for 2 h at 20°C. Beads were removed and proteins were further digested into peptides with 350 ng trypsin for 16 h. Peptides were prepared for MS analysis, as described above.
Mass spectrometry data acquisition
Tryptic peptides were separated by nanoscale C18 reverse chromatography coupled online to an Orbitrap Fusion Tribrid mass spectrometer via a NanoElectroSpray Ion Source (both Thermo Scientific). Peptides were loaded on a 20 cm 75–360 μm inner-outer diameter fused silica emitter (New Objective) packed in-house with ReproSil-Pur C18-AQ 1.9 μm resin (Dr Maisch GmbH). The column was installed on a Dionex Ultimate3000 RSLC NanoSystem (Thermo Scientific) using a MicroTee union formatted for 360 μm outer diameter columns (IDEX) and a liquid junction. The spray voltage was set to 2.15 kV. Buffer A was composed of 0.5% acetic acid and buffer B of 0.5% acetic acid, 80% acetonitrile. Peptides were loaded for 17 min at 300 nL/min at 5% buffer B, equilibrated for 5 min at 5% buffer B (17–22 min) and eluted by increasing buffer B from 5 to 15% (22–87 min) and 15 to 38% (87–147 min), followed by a 10 min wash to 90% and a 5 min regeneration to 5%. Survey scans of peptide precursors from 400 to 1,500 m/z were performed at 120 K resolution (at 200 m/z) with a 4 × 10⁵ ion count target. Tandem mass spectrometry was performed by isolation with the quadrupole with isolation window 1.6, HCD fragmentation with normalized collision energy of 30 and rapid scan mass spectrometry analysis in the ion trap. The MS2 ion count target was set to 104 and the maximum injection time was 35 ms. Only those precursors with charge states 2–7 were sampled for MS2. The dynamic exclusion duration was set to 30 s with a 10-p.p.m. tolerance around the selected precursor and its isotopes. Monoisotopic precursor selection was turned on. The instrument was run in top speed mode with 3 cycles. All data were acquired with Xcalibur software.
Because pull-down methods enrich for specific interactors, the protein concentration and thus data distribution between pull-down samples and controls differs substantially (Figures S2B and S2C). Therefore, we used protein raw intensities to identify putative binders. The raw intensity values were transformed in log2 scale and averaged, and log2 fold change (LFC) was calculated. To identify enriched proteins, we used a cut-off of LFC > 4, compared to empty aptamer control. Due to the non-normal data distribution in one of the triplicates of IFNG 3′ UTR from nonactivated T cells (Figure S2C), we excluded this sample from the analysis. We only included proteins that were identified in at least 2 out of 3 replicates in this analysis. To select for RBPs, we compiled the 1,153 RBPs identified by RNA-interactome capture on HeLa and Jurkat cells24,25 with 1,542 computationally predicted RBPs based on the presence of a defined list of RNA-binding domains (RBDs),23 resulting in a list of 2,026 unique RBPs (Table S7). Filtered data are shown as log2 median-centered intensities (Figure S2D).
Mass spectrometry analysis
Raw mass spectrometry files were processed with the MaxQuant computational platform, version 1.6.2.10.63 Proteins and peptides were identified using the Andromeda search engine by querying the human Uniprot database (downloaded February 2017 and February 2019, 89,796 entries). Standard settings with the additional options match between runs, and unique peptides for quantification were selected. The generated ‘proteingroups.txt’ data were imported in R and processed with the Differential Enrichment analysis of Proteomics data (DEP) R package.65 Identified peptides were filtered for potential contaminants, only identified by site and reverse hits.
GO analysis
Gene ontology analysis was performed with the Panther database (version 16.0).66 A statistical overrepresentation test (Fisher’s exact with FDR multiple test correction) was performed with a reference list composed of all Homo Sapiens genes. Overrepresented GO terms (FDR<0.001) were filtered for RNA-related functions and manually curated. Selected terms are shown in figures, Table S2 and Table S4 provide the full list of overrepresented GO terms. The R package ggplot2 was used for graphical representations.
Genetic modification of T cells with Cas9 RNPs
crRNAs were designed in Benchling (https://benchling.com; Table S6). Cas9 RNP production and T cell nucleofection was performed as previously described.17 Briefly, Alt-R crRNA and ATTO550-labeled or unlabeled tracr-RNA were reconstituted to 100 μM in Nuclease Free Duplex buffer (all Integrated DNA Technologies). As a negative control, nontargeting negative control crRNA #1 was used (Integrated DNA Technologies). Oligos were mixed at equimolar ratios (i.e. 4.5 μL total crRNA + 4.5 μL tracrRNA) in nuclease-free PCR tubes and denatured by heating at 95°C for 5 min in a thermocycler. Nucleic acids were cooled down to room temperature prior to mixing them with 30 μg TrueCut Cas9 V2 (Invitrogen) to produce Cas9 ribonuclear proteins (RNPs). Mixture was incubated at room temperature for at least 10 min prior to nucleofection. For nucleofection, human CD3+ T cells were activated for 72 h with α-CD3/α-CD28, and mouse OT-I T cells for 20 h with MEC.B7.SigOVA cells59 and rested for 24 h in medium with IL-7. Cells were electroporated in 16-well strips in a 4D Nucleofector X unit (Lonza) with program EH100 for human T cells, and with program CM137 for mouse T cells. Nucleofection efficiency was determined on day 2 after electroporation by measuring ATTO550 expression using FACSymphony (BD Biosciences). Knockout efficiency was determined on day 7–10 after electroporation by Western blot.
Quantitative PCR analysis
Total RNA was extracted using Trizol (Invitrogen). cDNA was synthesized with SuperScript III (Invitrogen), RT-PCR was performed using SYBR Green on a StepOne Plus (Applied Biosystems). Ct values were normalized to 18S levels.36 For mRNA half-life measurements, T cells were activated in triplicate for indicated time point with α-CD3/α-CD28, and then treated with 5 μg/mL actinomycin D (ActD) (Sigma-Aldrich).
RNA immunoprecipitation and immunoblotting
Cytoplasmic lysates of 300 × 106 PMA/Ionomycin activated human CD3+ T cells were prepared using lysis buffer (10 mM HEPES, pH 7.0, 100 mM KCl, 5 mM MgCl2, 0.5% NP40) freshly supplemented with 1 mM DTT, 100 U/ml RNase OUT (both Invitrogen), 0.4 mM Ribonucleoside Vanadyl Complex (NEB) and 1% EDTA-free protease/phosphatase inhibitor cocktail (Thermo Scientific). Protein A or protein G Dynabeads (Invitrogen) were prepared according to manufacturer’s protocol. The lysate was immunoprecipitated for 4 h at 4°C with 10 μg polyclonal rabbit α-ZFP36L1 (ABN192, Sigma-Aldrich), α-ZC3HAV1 (GTX120134, GeneTex), α-ATXN2L (ab99304, Abcam) or a polyclonal rabbit IgG isotype control (12–370, Sigma-Aldrich) and a mouse monoclonal α-HuR (3A2, Santa Cruz Biotechnology) or a mouse IgG1 kappa isotype control (P3.6.2.8.1, eBioscience). RNA was extracted directly from beads by using Trizol, and mRNA expression was measured by RT-PCR as described above. Specificity of the RNA-IP assay was tested by immunoblotting using α-ZFP36L1 (ab42473, Abcam), α-ZC3HAV1 (PA5-31650, Invitrogen), α-ATXN2L (ab99304, Abcam) or α-HuR (3A2, Santa Cruz Biotechnology), followed by mouse monoclonal anti-rabbit IgG light chain-HRP (ab99697, Abcam) or goat anti-mouse-HRP (1031-05, Southern Biotech).
Cell lysates (1 × 10⁶ cells/sample) were prepared by standard procedures using RIPA lysis buffer. Proteins were separated on a 4–12% SDS/PAGE and transferred onto a nitrocellulose membrane by iBlot (Thermo). Rabbit polyclonal α-ZFP36L1 (ab42473, Abcam), α-ZC3HAV1 (PA5-31650, Invitrogen), α-ATXN2L (ab99304, Abcam), mouse monoclonal α-HuR (3A2, Santa Cruz Biotechnology) and anti-RhoGDI (MAB9959, Abnova), were used, followed by either goat α-rabbit (4050-05) and goat α-mouse-HRP secondary antibodies (1031-05, both Southern Biotech).
Functional assays
For in vitro assays, human CD3+ T cells were stimulated with 10 ng/ml PMA and 1μM Ionomycin (Sigma-Aldrich) or with 1 μg/mL pre-coated α-CD3 and 1 μg/mL soluble α-CD28. MART1 TCR-transduced CD3+ T cells were co-cultured with HLA-A∗0201+ MART1hi Mel526 (MART1+) or HLA-A∗0201- MART1lo Mel888 (MART1−) melanoma cells,64,61 in a 1:1 effector to target (E:T) ratio. 1 μg/mL brefeldin A (BD Biosciences) was added as indicated. Non-activated T cells were used as control.
B16 melanoma tumor model
C57BL/6J/Ly5.1 or C57BL/6J/Ly5.1/Ly5.2 mice were injected subcutaneously with 1 × 10⁶ B16-OVA cells.60 On day 7 when tumors reached ∼4-8mm2, 0.65–1x10⁶ control or Zfp36l1 KO CD8+ OT-I Ly5.2 T cells were injected intravenously. Prior to T cell transfer, dead cells were removed with Lympholyte M gradient (Cedarlane). Tumor infiltrates were analyzed 14 days after T cell transfer. Excised tumors were cut into small pieces and digested at 37°C for 30 min with 100 μg/mL DNase I (Roche) and 200 U/ml Collagenase (Worthington). Cells were counted and incubated for 2 h with brefeldin A, or for 4 h with 100 nM OVA257–264 peptide and brefeldin A for the last 2 h of activation. For studying tumor outgrowth, mice were sacrificed when tumor reached ∼100 mm2.
Flow cytometry and intracellular cytokine staining
T cells were washed with FACS buffer (PBS, containing 1% FBS and 2 mM EDTA) and labeled for 20 min at 4°C with α-CD4 (SK3 and RPA-T4), α-CD8 (SK1), α-CD69 (FN50; all BD Biosciences), α-mouse TCR beta (H57-597), α-IFN-γ (4S.B3, both eBioscience), α-CD3 (OKT3), α-CD279 (EH12.2H7), α-CD137 (4B4-1), α-IL-2 (MQ1-17H12, all Biolegend), and α-TNF (MAb11, Biolegend and BD Biosciences). Mouse T cells were labeled with α-CD8 (53–6.7), α-PD-1 (J43), α-GzmB (GB11) (all BD Biosciences), α-CD45.1 (A20), α-CD45.2 (104), α-IFN-γ (XMG1.2), α-TNF (MP6-XT22), α-IL-2 (JES6-5H4), α-CD107a (1D4B), α-TIM3 (RMT3-23) (all eBioscience), α-TCF1 (C63D9, Cell Signaling Technology), α-TOX (REA473, Miltenyi) and α-SLAMF6 (330-AJ, Biolegend). Dead cells were excluded with Near-IR (Life Technologies). For intracellular cytokine staining, cells were cultured with 1 μg/mL brefeldin A for indicated timepoints, fixed, and permeabilized with Cytofix/Cytoperm kit (BD Biosciences) prior to acquisition using FACSymphony. Data were analyzed with FlowJo (BD Biosciences, version 10).
Quantification and statistical analysis
Results are shown as mean ± SD. Statistical analysis was performed with GraphPad Prism 8 with two-tailed ratio paired or unpaired Student’s t test when comparing two groups, or with one-way ANOVA test with Dunnett correction when comparing more than two groups. p values < 0.05 were considered statistically significant.
Acknowledgments
We thank the animal caretakers of the NKI and the Sanquin FACS facility; G. Stoecklin (University of Heidelberg) for the 4xS1m aptamer construct; T. Schumacher (Netherlands Cancer Institute) for providing MART-1 TCR viral supernatants and Mel526 and Mel888 tumor cell lines; M. Hoogenboezem, N. Zandhuis, S. Castenmiller, N. Šoštarić, and I. Foskolou for technical help; and D. Amsen, M. Nolte, and B. van Steensel for critical reading of the manuscript. This research was supported by the Dutch Cancer Society (KWF Kankerbestrijding, 10132), European Research Council consolidator award PRINTERS 817533, and Oncode Institute, all to M.C.W.; the Landsteiner Foundation for Blood Transfusion Research grant 2103 to B.P. and M.C.W.; and the Amsterdam Institute for Infection and Immunity extension grant for postdocs (25262) to B.P.
Author contributions
B.P., F.S., and M.C.W. designed experiments. B.P., A.G., S.E., A.P.J., N.P., J.J.F.-v.H., F.P.J.v.A., and F.S. performed experiments. B.P., B.P.N., A.P.J., M.v.d.B., F.P.J.v.A., and M.C.W. analyzed the data. B.P. and M.C.W. wrote the manuscript. All authors have read and approved the submitted version. M.C.W. supervised the project.
Declaration of interests
The authors declare no competing interests.
Inclusion and diversity
We support inclusive, diverse, and equitable conduct of research.
Published: April 18, 2023
Footnotes
Supplemental information can be found online at https://doi.org/10.1016/j.celrep.2023.112419.
Supplemental information
Data and code availability
-
•
MS data of the RNA pull-down and the coIP have been deposited to the ProteomeXchange Consortium via the PRIDE partner repository with the dataset identifier PXD028171.
-
•
This paper does not report original custom code. All codes used in this paper are available from the lead contact upon request.
-
•
Any additional information required to reanalyze the data reported in this paper is available from the lead contact upon request.
References
- 1.Zhang B., Karrison T., Rowley D.A., Schreiber H. IFN-gamma- and TNF-dependent bystander eradication of antigen-loss variants in established mouse cancers. J. Clin. Invest. 2008;118:1398–1404. doi: 10.1172/JCI33522. [DOI] [PMC free article] [PubMed] [Google Scholar]
- 2.Patel S.J., Sanjana N.E., Kishton R.J., Eidizadeh A., Vodnala S.K., Cam M., Gartner J.J., Jia L., Steinberg S.M., Yamamoto T.N., et al. Identification of essential genes for cancer immunotherapy. Nature. 2017;548:537–542. doi: 10.1038/nature23477. [DOI] [PMC free article] [PubMed] [Google Scholar]
- 3.Almeida J.R., Price D.A., Papagno L., Arkoub Z.A., Sauce D., Bornstein E., Asher T.E., Samri A., Schnuriger A., Theodorou I., et al. Superior control of HIV-1 replication by CD8+ T cells is reflected by their avidity, polyfunctionality, and clonal turnover. J. Exp. Med. 2007;204:2473–2485. doi: 10.1084/jem.20070784. [DOI] [PMC free article] [PubMed] [Google Scholar]
- 4.Ciuffreda D., Comte D., Cavassini M., Giostra E., Bühler L., Perruchoud M., Heim M.H., Battegay M., Genné D., Mulhaupt B., et al. Polyfunctional HCV-specific T-cell responses are associated with effective control of HCV replication. Eur. J. Immunol. 2008;38:2665–2677. doi: 10.1002/eji.200838336. [DOI] [PubMed] [Google Scholar]
- 5.Quezada S.A., Simpson T.R., Peggs K.S., Merghoub T., Vider J., Fan X., Blasberg R., Yagita H., Muranski P., Antony P.A., et al. Tumor-reactive CD4+ T cells develop cytotoxic activity and eradicate large established melanoma after transfer into lymphopenic hosts. J. Exp. Med. 2010;207:637–650. doi: 10.1084/jem.20091918. [DOI] [PMC free article] [PubMed] [Google Scholar]
- 6.Wimmers F., Aarntzen E.H.J.G., Duiveman-deBoer T., Figdor C.G., Jacobs J.F.M., Tel J., de Vries I.J.M. Long-lasting multifunctional CD8+ T cell responses in end-stage melanoma patients can be induced by dendritic cell vaccination. OncoImmunology. 2016;5 doi: 10.1080/2162402X.2015.1067745. [DOI] [PMC free article] [PubMed] [Google Scholar]
- 7.Oh D.Y., Kwek S.S., Raju S.S., Li T., McCarthy E., Chow E., Aran D., Ilano A., Pai C.-C.S., Rancan C., et al. Intratumoral CD4+ T cells mediate anti-tumor cytotoxicity in human bladder cancer. Cell. 2020;181:1612–1625.e13. doi: 10.1016/j.cell.2020.05.017. [DOI] [PMC free article] [PubMed] [Google Scholar]
- 8.Yoshinaga M., Takeuchi O. Post-transcriptional control of immune responses and its potential application. Clin. Transl. Immunology. 2019;8 doi: 10.1002/cti2.1063. [DOI] [PMC free article] [PubMed] [Google Scholar]
- 9.Salerno F., Turner M., Wolkers M.C. Dynamic post-transcriptional events governing CD8+ T cell homeostasis and effector function. Trends Immunol. 2020;41:240–254. doi: 10.1016/j.it.2020.01.001. [DOI] [PubMed] [Google Scholar]
- 10.Jurgens A.P., Popović B., Wolkers M.C. T cells at work: how post-transcriptional mechanisms control T cell homeostasis and activation. Eur. J. Immunol. 2021;51:2178–2187. doi: 10.1002/eji.202049055. [DOI] [PMC free article] [PubMed] [Google Scholar]
- 11.Salerno F., Guislain A., Cansever D., Wolkers M.C. TLR-mediated innate production of IFN-γ by CD8+ T cells is independent of glycolysis. J. Immunol. 2016;196:3695–3705. doi: 10.4049/jimmunol.1501997. [DOI] [PubMed] [Google Scholar]
- 12.Salerno F., Paolini N.A., Stark R., von Lindern M., Wolkers M.C. Distinct PKC-mediated posttranscriptional events set cytokine production kinetics in CD8(+) T cells. Proc. Natl. Acad. Sci. USA. 2017;114:9677–9682. doi: 10.1073/pnas.1704227114. [DOI] [PMC free article] [PubMed] [Google Scholar]
- 13.Salerno F., Freen-van Heeren J.J., Guislain A., Nicolet B.P., Wolkers M.C. Costimulation through TLR2 drives polyfunctional CD8 + T cell responses. J. Immunol. 2019;202:714–723. doi: 10.4049/jimmunol.1801026. [DOI] [PubMed] [Google Scholar]
- 14.Kontoyiannis D., Pasparakis M., Pizarro T.T., Cominelli F., Kollias G. Impaired on/off regulation of TNF biosynthesis in mice lacking TNF AU-rich elements: implications for joint and gut-associated immunopathologies. Immunity. 1999;10:387–398. doi: 10.1016/s1074-7613(00)80038-2. [DOI] [PubMed] [Google Scholar]
- 15.Hodge D.L., Berthet C., Coppola V., Kastenmüller W., Buschman M.D., Schaughency P.M., Shirota H., Scarzello A.J., Subleski J.J., Anver M.R., et al. IFN-gamma AU-rich element removal promotes chronic IFN-gamma expression and autoimmunity in mice. J. Autoimmun. 2014;53:33–45. doi: 10.1016/j.jaut.2014.02.003. [DOI] [PMC free article] [PubMed] [Google Scholar]
- 16.Salerno F., Guislain A., Freen-Van Heeren J.J., Nicolet B.P., Young H.A., Wolkers M.C. Critical role of post-transcriptional regulation for IFN-γ in tumor-infiltrating T cells. OncoImmunology. 2019;8 doi: 10.1080/2162402X.2018.1532762. [DOI] [PMC free article] [PubMed] [Google Scholar]
- 17.Freen-van Heeren J.J., Popović B., Guislain A., Wolkers M.C. Human T cells employ conserved AU-rich elements to fine-tune IFN-γ production. Eur. J. Immunol. 2020;50:949–958. doi: 10.1002/eji.201948458. [DOI] [PMC free article] [PubMed] [Google Scholar]
- 18.Akira S., Maeda K. Control of RNA stability in immunity. Annu. Rev. Immunol. 2021;39:481–509. doi: 10.1146/annurev-immunol-101819-075147. [DOI] [PubMed] [Google Scholar]
- 19.Hoefig K.P., Heissmeyer V. Posttranscriptional regulation of T helper cell fate decisions. J. Cell Biol. 2018;217:2615–2631. doi: 10.1083/jcb.201708075. [DOI] [PMC free article] [PubMed] [Google Scholar]
- 20.Masuda K., Ripley B., Nyati K.K., Dubey P.K., Zaman M.M.-U., Hanieh H., Higa M., Yamashita K., Standley D.M., Mashima T., et al. Arid5a regulates naive CD4+ T cell fate through selective stabilization of Stat3 mRNA. J. Exp. Med. 2016;213:605–619. doi: 10.1084/jem.20151289. [DOI] [PMC free article] [PubMed] [Google Scholar]
- 21.Hanieh H., Masuda K., Metwally H., Chalise J.P., Mohamed M., Nyati K.K., Standley D.M., Li S., Higa M., Zaman M.M., Kishimoto T. Arid5a stabilizes OX40 mRNA in murine CD4+ T cells by recognizing a stem-loop structure in its 3’UTR. Eur. J. Immunol. 2018;48:593–604. doi: 10.1002/eji.201747109. [DOI] [PubMed] [Google Scholar]
- 22.Salerno F., Engels S., van den Biggelaar M., van Alphen F.P.J., Guislain A., Zhao W., Hodge D.L., Bell S.E., Medema J.P., von Lindern M., et al. Translational repression of pre-formed cytokine-encoding mRNA prevents chronic activation of memory T cells. Nat. Immunol. 2018;19:828–837. doi: 10.1038/s41590-018-0155-6. [DOI] [PMC free article] [PubMed] [Google Scholar]
- 23.Gerstberger S., Hafner M., Tuschl T. A census of human RNA-binding proteins. Nat. Rev. Genet. 2014;15:829–845. doi: 10.1038/nrg3813. [DOI] [PMC free article] [PubMed] [Google Scholar]
- 24.Castello A., Fischer B., Frese C.K., Horos R., Alleaume A.-M., Foehr S., Curk T., Krijgsveld J., Hentze M.W. Comprehensive identification of RNA-binding domains in human cells. Mol. Cell. 2016;63:696–710. doi: 10.1016/j.molcel.2016.06.029. [DOI] [PMC free article] [PubMed] [Google Scholar]
- 25.Perez-Perri J.I., Rogell B., Schwarzl T., Stein F., Zhou Y., Rettel M., Brosig A., Hentze M.W. Discovery of RNA-binding proteins and characterization of their dynamic responses by enhanced RNA interactome capture. Nat. Commun. 2018;9:4408. doi: 10.1038/s41467-018-06557-8. [DOI] [PMC free article] [PubMed] [Google Scholar]
- 26.Hoefig K.P., Reim A., Gallus C., Wong E.H., Behrens G., Conrad C., Xu M., Kifinger L., Ito-Kureha T., Defourny K.A.Y., et al. Defining the RBPome of primary T helper cells to elucidate higher-order Roquin-mediated mRNA regulation. Nat. Commun. 2021;12:5208. doi: 10.1038/s41467-021-25345-5. [DOI] [PMC free article] [PubMed] [Google Scholar]
- 27.Van Nostrand E.L., Freese P., Pratt G.A., Wang X., Wei X., Xiao R., Blue S.M., Chen J.-Y., Cody N.A.L., Dominguez D., et al. A large-scale binding and functional map of human RNA-binding proteins. Nature. 2020;583:711–719. doi: 10.1038/s41586-020-2077-3. [DOI] [PMC free article] [PubMed] [Google Scholar]
- 28.Zandhuis N.D., Nicolet B.P., Wolkers M.C. RNA-binding protein expression alters upon differentiation of human B cells and T cells. Front. Immunol. 2021;12 doi: 10.3389/fimmu.2021.717324. [DOI] [PMC free article] [PubMed] [Google Scholar]
- 29.Van Nostrand E.L., Gelboin-Burkhart C., Wang R., Pratt G.A., Blue S.M., Yeo G.W. CRISPR/Cas9-mediated integration enables TAG-eCLIP of endogenously tagged RNA binding proteins. Methods. 2017;118-119:50–59. doi: 10.1016/j.ymeth.2016.12.007. [DOI] [PMC free article] [PubMed] [Google Scholar]
- 30.Giudice G., Sánchez-Cabo F., Torroja C., Lara-Pezzi E. ATtRACT—a database of RNA-binding proteins and associated motifs. Database. 2016;2016 doi: 10.1093/database/baw035. [DOI] [PMC free article] [PubMed] [Google Scholar]
- 31.Leppek K., Stoecklin G. An optimized streptavidin-binding RNA aptamer for purification of ribonucleoprotein complexes identifies novel ARE-binding proteins. Nucleic Acids Res. 2014;42:e13. doi: 10.1093/nar/gkt956. [DOI] [PMC free article] [PubMed] [Google Scholar]
- 32.Coelho M.A., de Carné Trécesson S., Rana S., Zecchin D., Moore C., Molina-Arcas M., East P., Spencer-Dene B., Nye E., Barnouin K., et al. Oncogenic RAS signaling promotes tumor immunoresistance by stabilizing PD-L1 mRNA. Immunity. 2017;47:1083–1099.e6. doi: 10.1016/j.immuni.2017.11.016. [DOI] [PMC free article] [PubMed] [Google Scholar]
- 33.Grammatikakis I., Abdelmohsen K., Gorospe M. Posttranslational control of HuR function. Wiley Interdiscip. Rev. RNA. 2017;8 doi: 10.1002/wrna.1372. 10.1002/wrna.1372. [DOI] [PMC free article] [PubMed] [Google Scholar]
- 34.Wolf T., Jin W., Zoppi G., Vogel I.A., Akhmedov M., Bleck C.K.E., Beltraminelli T., Rieckmann J.C., Ramirez N.J., Benevento M., et al. Dynamics in protein translation sustaining T cell preparedness. Nat. Immunol. 2020;21:927–937. doi: 10.1038/s41590-020-0714-5. [DOI] [PMC free article] [PubMed] [Google Scholar]
- 35.Han Q., Bagheri N., Bradshaw E.M., Hafler D.A., Lauffenburger D.A., Love J.C. Polyfunctional responses by human T cells result from sequential release of cytokines. Proc. Natl. Acad. Sci.USA. 2012;109:1607–1612. doi: 10.1073/pnas.1117194109. [DOI] [PMC free article] [PubMed] [Google Scholar]
- 36.Nicolet B.P., Guislain A., Wolkers M.C. Combined single-cell measurement of cytokine mRNA and protein identifies T cells with persistent effector function. J. Immunol. 2017;198:962–970. doi: 10.4049/jimmunol.1601531. [DOI] [PubMed] [Google Scholar]
- 37.Gomez-Eerland R., Nuijen B., Heemskerk B., van Rooij N., van den Berg J.H., Beijnen J.H., Uckert W., Kvistborg P., Schumacher T.N., Haanen J.B.A.G., Jorritsma A. Manufacture of gene-modified human T-cells with a memory stem/central memory phenotype. Hum. Gene Ther. Methods. 2014;25:277–287. doi: 10.1089/hgtb.2014.004. [DOI] [PMC free article] [PubMed] [Google Scholar]
- 38.van der Leun A.M., Thommen D.S., Schumacher T.N. CD8 + T cell states in human cancer: insights from single-cell analysis. Nat. Rev. Cancer. 2020;20:218–232. doi: 10.1038/s41568-019-0235-4. [DOI] [PMC free article] [PubMed] [Google Scholar]
- 39.Philip M., Schietinger A. CD8+ T cell differentiation and dysfunction in cancer. Nat. Rev. Immunol. 2022;22:209–223. doi: 10.1038/s41577-021-00574-3. [DOI] [PMC free article] [PubMed] [Google Scholar]
- 40.Kim H.H., Abdelmohsen K., Lal A., Pullmann R., Yang X., Galban S., Srikantan S., Martindale J.L., Blethrow J., Shokat K.M., Gorospe M. Nuclear HuR accumulation through phosphorylation by Cdk1. Genes Dev. 2008;22:1804–1815. doi: 10.1101/gad.1645808. [DOI] [PMC free article] [PubMed] [Google Scholar]
- 41.Yoon J.-H., Abdelmohsen K., Srikantan S., Guo R., Yang X., Martindale J.L., Gorospe M. Tyrosine phosphorylation of HuR by JAK3 triggers dissociation and degradation of HuR target mRNAs. Nucleic Acids Res. 2014;42:1196–1208. doi: 10.1093/nar/gkt903. [DOI] [PMC free article] [PubMed] [Google Scholar]
- 42.Vieira-Vieira C.H., Dauksaite V., Sporbert A., Gotthardt M., Selbach M. Proteome-wide quantitative RNA-interactome capture identifies phosphorylation sites with regulatory potential in RBM20. Mol. Cell. 2022;82:2069–2083.e8. doi: 10.1016/j.molcel.2022.03.024. [DOI] [PubMed] [Google Scholar]
- 43.Raghavan A., Robison R.L., McNabb J., Miller C.R., Williams D.A., Bohjanen P.R. HuA and tristetraprolin are induced following T cell activation and display distinct but overlapping RNA binding specificities. J. Biol. Chem. 2001;276:47958–47965. doi: 10.1074/jbc.M109511200. [DOI] [PubMed] [Google Scholar]
- 44.Tiedje C., Ronkina N., Tehrani M., Dhamija S., Laass K., Holtmann H., Kotlyarov A., Gaestel M. The p38/MK2-driven exchange between tristetraprolin and HuR regulates AU-rich element-dependent translation. PLoS Genet. 2012;8 doi: 10.1371/journal.pgen.1002977. [DOI] [PMC free article] [PubMed] [Google Scholar]
- 45.Srikantan S., Tominaga K., Gorospe M. Functional interplay between RNA-binding protein HuR and microRNAs. Curr. Protein Pept. Sci. 2012;13:372–379. doi: 10.2174/138920312801619394. [DOI] [PMC free article] [PubMed] [Google Scholar]
- 46.Noh J.H., Kim K.M., Abdelmohsen K., Yoon J.-H., Panda A.C., Munk R., Kim J., Curtis J., Moad C.A., Wohler C.M., et al. HuR and GRSF1 modulate the nuclear export and mitochondrial localization of the lncRNA RMRP. Genes Dev. 2016;30:1224–1239. doi: 10.1101/gad.276022.115. [DOI] [PMC free article] [PubMed] [Google Scholar]
- 47.Theler D., Dominguez C., Blatter M., Boudet J., Allain F.H.-T. Solution structure of the YTH domain in complex with N6-methyladenosine RNA: a reader of methylated RNA. Nucleic Acids Res. 2014;42:13911–13919. doi: 10.1093/nar/gku1116. [DOI] [PMC free article] [PubMed] [Google Scholar]
- 48.Kaehler C., Isensee J., Nonhoff U., Terrey M., Hucho T., Lehrach H., Krobitsch S. Ataxin-2-like is a regulator of stress granules and processing bodies. PLoS One. 2012;7 doi: 10.1371/journal.pone.0050134. [DOI] [PMC free article] [PubMed] [Google Scholar]
- 49.Schwerk J., Soveg F.W., Ryan A.P., Thomas K.R., Hatfield L.D., Ozarkar S., Forero A., Kell A.M., Roby J.A., So L., et al. RNA-binding protein isoforms ZAP-S and ZAP-L have distinct antiviral and immune resolution functions. Nat. Immunol. 2019;20:1610–1620. doi: 10.1038/s41590-019-0527-6. [DOI] [PMC free article] [PubMed] [Google Scholar]
- 50.Gonzalez-Perez A.C., Stempel M., Wyler E., Urban C., Piras A., Hennig T., Ganskih S., Wei Y., Heim A., Landthaler M., et al. The zinc finger antiviral protein ZAP restricts human cytomegalovirus and selectively binds and destabilizes viral UL4/UL5 transcripts. mBio. 2021;12:e02683-20. doi: 10.1128/mBio.02683-20. [DOI] [PMC free article] [PubMed] [Google Scholar]
- 51.Zimmer M.M., Kibe A., Rand U., Pekarek L., Ye L., Buck S., Smyth R.P., Cicin-Sain L., Caliskan N. The short isoform of the host antiviral protein ZAP acts as an inhibitor of SARS-CoV-2 programmed ribosomal frameshifting. Nat. Commun. 2021;12:7193. doi: 10.1038/s41467-021-27431-0. [DOI] [PMC free article] [PubMed] [Google Scholar]
- 52.Adachi S., Homoto M., Tanaka R., Hioki Y., Murakami H., Suga H., Matsumoto M., Nakayama K.I., Hatta T., Iemura S.i., Natsume T. ZFP36L1 and ZFP36L2 control LDLR mRNA stability via the ERK-RSK pathway. Nucleic Acids Res. 2014;42:10037–10049. doi: 10.1093/nar/gku652. [DOI] [PMC free article] [PubMed] [Google Scholar]
- 53.Marchese F.P., Aubareda A., Tudor C., Saklatvala J., Clark A.R., Dean J.L.E. MAPKAP kinase 2 blocks tristetraprolin-directed mRNA decay by inhibiting CAF1 deadenylase recruitment. J. Biol. Chem. 2010;285:27590–27600. doi: 10.1074/jbc.M110.136473. [DOI] [PMC free article] [PubMed] [Google Scholar]
- 54.Sandler H., Kreth J., Timmers H.T.M., Stoecklin G. Not1 mediates recruitment of the deadenylase Caf1 to mRNAs targeted for degradation by tristetraprolin. Nucleic Acids Res. 2011;39:4373–4386. doi: 10.1093/nar/gkr011. [DOI] [PMC free article] [PubMed] [Google Scholar]
- 55.Petkau G., Mitchell T.J., Chakraborty K., Bell S.E., D'Angeli V., Matheson L., Turner D.J., Saveliev A., Gizlenci O., Salerno F., et al. The timing of differentiation and potency of CD8 effector function is set by RNA binding proteins. Nat. Commun. 2022;13:2274. doi: 10.1038/s41467-022-29979-x. [DOI] [PMC free article] [PubMed] [Google Scholar]
- 56.LaFleur M.W., Nguyen T.H., Coxe M.A., Miller B.C., Yates K.B., Gillis J.E., Sen D.R., Gaudiano E.F., Al Abosy R., Freeman G.J., et al. PTPN2 regulates the generation of exhausted CD8+ T cell subpopulations and restrains tumor immunity. Nat. Immunol. 2019;20:1335–1347. doi: 10.1038/s41590-019-0480-4. [DOI] [PMC free article] [PubMed] [Google Scholar]
- 57.Gebauer F., Schwarzl T., Valcárcel J., Hentze M.W. RNA-binding proteins in human genetic disease. Nat. Rev. Genet. 2021;22:185–198. doi: 10.1038/s41576-020-00302-y. [DOI] [PubMed] [Google Scholar]
- 58.Morita S., Kojima T., Kitamura T. Plat-E: an efficient and stable system for transient packaging of retroviruses. Gene Ther. 2000;7:1063–1066. doi: 10.1038/sj.gt.3301206. [DOI] [PubMed] [Google Scholar]
- 59.van Stipdonk M.J.B., Hardenberg G., Bijker M.S., Lemmens E.E., Droin N.M., Green D.R., Schoenberger S.P. Dynamic programming of CD8+ T lymphocyte responses. Nat. Immunol. 2003;4:361–365. doi: 10.1038/ni912. [DOI] [PubMed] [Google Scholar]
- 60.de Witte M.A., Coccoris M., Wolkers M.C., van den Boom M.D., Mesman E.M., Song J.-Y., van der Valk M., Haanen J.B.A.G., Schumacher T.N.M. Targeting self-antigens through allogeneic TCR gene transfer. Blood. 2006;108:870–877. doi: 10.1182/blood-2005-08-009357. [DOI] [PubMed] [Google Scholar]
- 61.Marincola F.M., Shamamian P., Simonis T.B., Abati A., Hackett J., O'Dea T., Fetsch P., Yannelli J., Restifo N.P., Mulé J.J., et al. Locus-specific analysis of human leukocyte antigen class I expression in melanoma cell lines. J. Immunother. 1994;16:13–23. doi: 10.1097/00002371-199407000-00002. [DOI] [PMC free article] [PubMed] [Google Scholar]
- 62.Brummelkamp T.R., Bernards R., Agami R. Stable suppression of tumorigenicity by virus-mediated RNA interference. Cancer Cell. 2002;2:243–247. doi: 10.1016/s1535-6108(02)00122-8. [DOI] [PubMed] [Google Scholar]
- 63.Cox J., Mann M. MaxQuant enables high peptide identification rates, individualized p.p.b.-range mass accuracies and proteome-wide protein quantification. Nat. Biotechnol. 2008;26:1367–1372. doi: 10.1038/nbt.1511. [DOI] [PubMed] [Google Scholar]
- 64.Nicolet B.P., Guislain A., van Alphen F.P.J., Gomez-Eerland R., Schumacher T.N.M., van den Biggelaar M., Wolkers M.C. CD29 identifies IFN-γ-producing human CD8+ T cells with an increased cytotoxic potential. Proc. Natl. Acad. Sci. USA. 2020;117:6686–6696. doi: 10.1073/pnas.1913940117. [DOI] [PMC free article] [PubMed] [Google Scholar]
- 65.Zhang X., Smits A.H., van Tilburg G.B., Ovaa H., Huber W., Vermeulen M. Proteome-wide identification of ubiquitin interactions using UbIA-MS. Nat. Protoc. 2018;13:530–550. doi: 10.1038/nprot.2017.147. [DOI] [PubMed] [Google Scholar]
- 66.Mi H., Muruganujan A., Ebert D., Huang X., Thomas P.D. PANTHER version 14: more genomes, a new PANTHER GO-slim and improvements in enrichment analysis tools. Nucleic Acids Res. 2019;47:D419–D426. doi: 10.1093/nar/gky1038. [DOI] [PMC free article] [PubMed] [Google Scholar]
Associated Data
This section collects any data citations, data availability statements, or supplementary materials included in this article.
Supplementary Materials
Data Availability Statement
-
•
MS data of the RNA pull-down and the coIP have been deposited to the ProteomeXchange Consortium via the PRIDE partner repository with the dataset identifier PXD028171.
-
•
This paper does not report original custom code. All codes used in this paper are available from the lead contact upon request.
-
•
Any additional information required to reanalyze the data reported in this paper is available from the lead contact upon request.