

Abstract
This quality improvement study examines the association between the discontinuation of universal admission testing for SARS-CoV-2 infections and hospital-onset SARS-CoV-2 infections in England and Scotland.
Some hospitals test all patients for SARS-CoV-2 infection on admission to prevent transmission from patients with unrecognized infection to staff and other patients, since two-thirds of SARS-CoV-2 transmissions are from people with asymptomatic or presymptomatic infections, transmission risk between patients sharing rooms is high, and universal medical masks can reduce but not eliminate transmission.1 However, the utility of universal admission testing has been questioned due to resource constraints, care delays, and sparse data demonstrating it reduces nosocomial infections.2 England and Scotland stopped requiring hospitals to test all admitted patients starting August 31, 2022, and September 28, 2022, respectively. We examined whether this discontinuation was associated with increases in hospital-onset SARS-CoV-2 infections.
Methods
This time series analysis used public data sets from Public Health Scotland (Hospital Onset COVID-19 Cases in Scotland) and National Health Service England (COVID-19 Hospital Activity) to obtain weekly counts of hospital-onset cases of SARS-CoV-2 infections, defined as newly positive SARS-CoV-2 tests more than 7 days after admission between July 1, 2021, and December 16, 2022. Polymerase chain reaction testing was recommended for admission testing during most of the study period. Hospital-onset SARS-CoV-2 infection rates closely correlate with community prevalence,3 so we calculated weekly rates of new hospital-onset cases per 1000 community infections to assess the relative increases in hospital-onset cases. We used the UK Office for National Statistics (ONS) COVID-19 Infection Survey to estimate community prevalence. The ONS conducts near-weekly testing of randomly selected households, avoiding the potential biases associated with health care–related or patient-initiated testing.4 We evaluated level changes in this weekly rate after admission testing ended using interrupted time series with a first-order autoregressive structure accounting for temporal correlation; we used R, version 4.2.1, package nlme (R Foundation for Statistical Computing).
The study was divided into 3 periods: Delta dominance with admission testing (July 1, 2021, to December 13, 2021), Omicron dominance with admission testing (December 14, 2021, when the Omicron variant exceeded 50% of sequenced SARS-CoV-2 infections in both countries, to August 30, 2022 [England], and September 27, 2022 [Scotland]), and Omicron dominance without admission testing ([Scotland] September 28, 2022, to December 16, 2022; [England] August 31, 2022, to December 16, 2022). Sensitivity analysis was performed using community-acquired SARS-CoV-2–related hospitalizations as the denominator. A 2-tailed P < .05 indicated statistical significance. Neither institutional review board approval nor informed consent was required because the study used public, deidentified data. The study followed the Strengthening the Reporting of Observational Studies in Epidemiology (STROBE) reporting guideline.
Results
During the study period, there were 46 517 COVID-19–related admissions (34 183 community-onset, 12 334 hospital-onset cases) in Scotland, and 518 379 COVID-19–related admissions (398 264 community-onset, 120 115 hospital-onset cases) in England. The mean (SD) weekly rate of new hospital-onset SARS-CoV-2 infections per 1000 estimated community infections in Scotland increased from 0.78 (0.37) during the Delta dominance period, to 0.99 (0.21) during Omicron dominance, to 1.64 (0.37) after universal admission testing ended (Figure, A). The immediate level change was statistically significant after admission testing ended (41% relative increase; 95% CI, 6%-76%) but not after the Delta-to-Omicron transition (Table). Likewise, during analogous periods in England, the same mean (SD) rate increased from 0.64 (0.14) to 1.00 (0.17) to 1.39 (0.34) (Figure, B). The immediate level change was significant after admission testing ended (26% relative increase; 95% CI, 8%-45%) but not after the Delta-to-Omicron transition. Findings were similar with incident community-acquired SARS-CoV-2 hospitalizations as the denominator (Figure, C and D; Table).
Figure. Weekly New Hospital-Onset COVID-19 Cases in Scotland and England per 1000 Estimated Community COVID-19 Infections and per New Admissions for Community-Onset COVID-19 Infection.
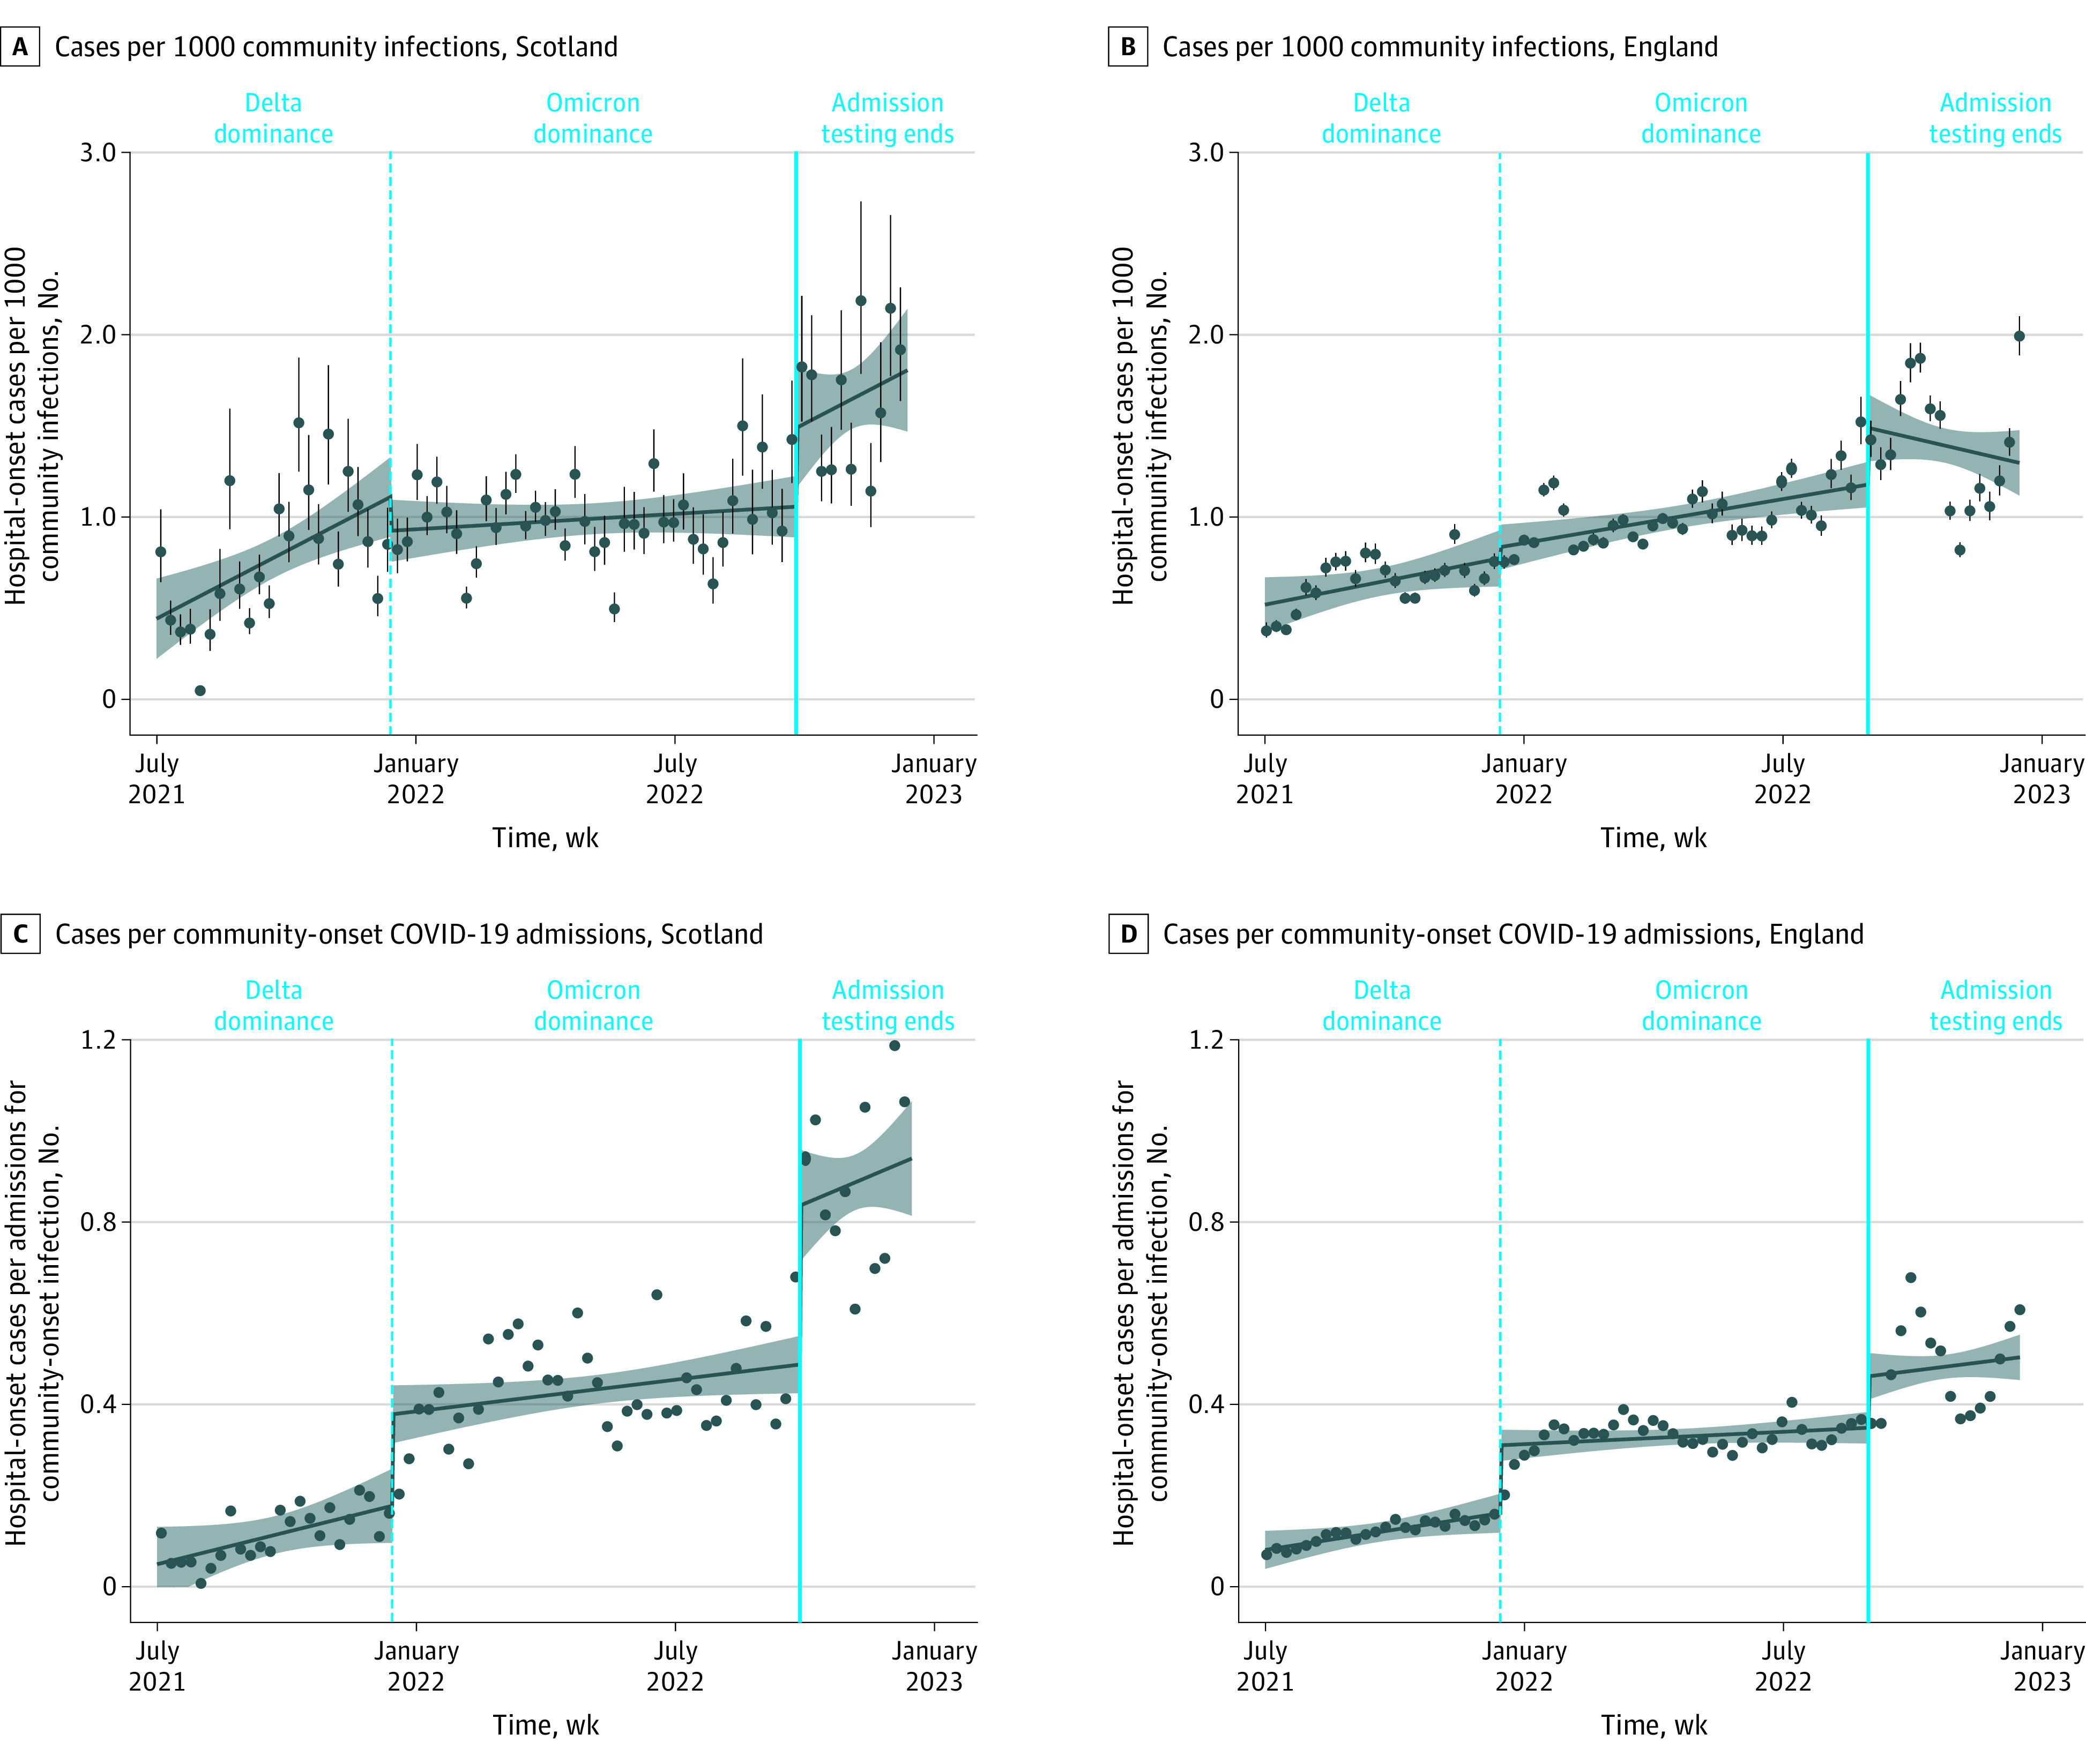
Hospital-onset infections were defined by the first positive test taken more than 7 days after admission, and community-onset infections by the first positive test at 7 days or less after admission. All regression lines are interrupted time series models. Dots represent weekly rates, and vertical lines in panels A and B represent 95% CIs for weekly rates derived from CIs for the UK Office of National Statistics estimates of community infection rates. The shaded area represents 95% CIs for the interrupted time series model.
Table. Interrupted Time Series Analysis of Associations Between Discontinuation of Universal Admission Testing for SARS-CoV-2 Infections and Hospital-Onset SARS-CoV-2 Infections Normalized to Measures of Community Prevalencea.
| Analysis | Coefficient (95% CI) | % Change relative to counterfactual (95% CI) | P value |
|---|---|---|---|
| New hospital-onset cases per estimated 1000 community infections | |||
| Scotland | |||
| Trend during Omicron dominance (reference) | 0.00046 (−0.00056 to 0.0015) | NA | .38 |
| Immediate change after Delta-to-Omicron transition | −0.19 (−0.46 to 0.091) | −17 (−42 to 8) | .19 |
| Change in trend after Delta-to-Omicron transition | −0.0036 (−0.0061 to −0.0011) | NA | .007 |
| Immediate change after end of admission testing | 0.43 (0.060 to 0.80) | 41 (6 to 76) | .026 |
| Change in trend after end of admission testing | 0.0036 (−0.0039 to 0.011) | NA | .35 |
| Intercept | 1.0 (0.76 to 1.30) | NA | <.001 |
| England | |||
| Trend during Omicron dominance (reference) | 0.0013 (0.00049 to 0.0021) | NA | .002 |
| Immediate change after Delta-to-Omicron transition | 0.061 (−0.14 to 0.26) | 8 (−18 to 33) | .55 |
| Change in trend after Delta-to-Omicron transition | −0.00021 (−0.0020 to 0.0016) | NA | .82 |
| Immediate change after end of admission testing | 0.31 (0.089 to 0.53) | 26 (8 to 45) | .008 |
| Change in trend after end of admission testing | −0.0031 (−0.0061 to −0.000098) | NA | .047 |
| Intercept | 0.55 (0.35 to 0.76) | NA | <.001 |
| New hospital-onset cases per community-onset COVID-19 admissions | |||
| Scotland | |||
| Trend during Omicron dominance (reference) | 0.00038 (−0.00000083 to 0.00076) | NA | .054 |
| Immediate change after Delta-to-Omicron transition | 0.20 (0.098 to 0.30) | 110 (55 to 170) | <.001 |
| Change in trend after Delta-to-Omicron transition | −0.00039 (−0.0013 to 0.00054) | NA | .41 |
| Immediate change after end of admission testing | 0.35 (0.21 to 0.49) | 72 (43 to 100) | <.001 |
| Change in trend after end of admission testing | 0.00093 (−0.0018 to 0.0037) | NA | .51 |
| Intercept | 0.11 (0.012 to 0.22) | NA | .033 |
| England | |||
| Trend during Omicron dominance (reference) | 0.00015 (−0.000081 to 0.00038) | NA | .21 |
| Immediate change after Delta-to-Omicron transition | 0.15 (0.094 to 0.20) | 92 (58 to 130) | <.001 |
| Change in trend after Delta-to-Omicron transition | −0.00034 (−0.00083 to 0.00016) | NA | .19 |
| Immediate change after end of admission testing | 0.11 (0.051 to 0.17) | 32 (15 to 50) | <.001 |
| Change in trend after end of admission testing | 0.00024 (−0.00060 to 0.0011) | NA | .58 |
| Intercept | 0.14 (0.079 to 0.19) | NA | <.001 |
Abbreviation: NA, not applicable.
All results are from interrupted time series models with time represented as a discrete count of days from the start date and accounting for temporal correlation with a first-order autoregressive structure.
Discussion
Stopping universal admission testing in the national health systems of 2 countries (England and Scotland) was associated with significant increases in hospital-onset SARS-CoV-2 infections relative to community-onset infections. Potential mechanisms include more unrecognized present-on-admission infections causing transmissions to other patients and health care workers, who in turn infected other patients.
Limitations of our analysis include its before-and-after design without concurrent controls and possibly spurious associations if policy compliance was minimal or delayed; however, the associations in 2 countries that stopped admission testing at different times were similar. Some community-onset cases may have been misclassified as hospital-onset cases, but this is unlikely considering the Omicron variant’s 3-day incubation period and sequencing data5 that suggest that a 7-day cutoff underestimates rather than overestimates nosocomial infections.
Nosocomial SARS-CoV-2 Omicron infections remain common, with crude mortality estimates ranging from 3% to 13%.3,6 Hospitals should exercise caution before stopping universal admission testing for SARS-CoV-2 infections.
Data Sharing Statement
References
- 1.Klompas M, Baker MA, Rhee C, et al. A SARS-CoV-2 cluster in an acute care hospital. Ann Intern Med. 2021;174(6):794-802. doi: 10.7326/M20-7567 [DOI] [PMC free article] [PubMed] [Google Scholar]
- 2.Talbot TR, Hayden MK, Yokoe DS, et al. ; SHEA Board of Trustees . Asymptomatic screening for severe acute respiratory coronavirus virus 2 (SARS-CoV-2) as an infection prevention measure in healthcare facilities: challenges and considerations. Infect Control Hosp Epidemiol. 2023;44(1):2-7. doi: 10.1017/ice.2022.295 [DOI] [PubMed] [Google Scholar]
- 3.Suwono B, Brandl M, Hecht J, Eckmanns T, Haller S. Epidemiology of healthcare-associated SARS-CoV-2 outbreaks in Germany between March 2020 and May 2022. J Hosp Infect. 2023;134:108-120. Published online February 2, 2023. doi: 10.1016/j.jhin.2023.01.011 [DOI] [PMC free article] [PubMed] [Google Scholar]
- 4.Pouwels KB, House T, Pritchard E, et al. ; COVID-19 Infection Survey Team . Community prevalence of SARS-CoV-2 in England from April to November, 2020: results from the ONS Coronavirus Infection Survey. Lancet Public Health. 2021;6(1):e30-e38. doi: 10.1016/S2468-2667(20)30282-6 [DOI] [PMC free article] [PubMed] [Google Scholar]
- 5.Lumley SF, Constantinides B, Sanderson N, et al. ; OUH Microbiology laboratory; OUH Infection Prevention and Control team . Epidemiological data and genome sequencing reveals that nosocomial transmission of SARS-CoV-2 is underestimated and mostly mediated by a small number of highly infectious individuals. J Infect. 2021;83(4):473-482. doi: 10.1016/j.jinf.2021.07.034 [DOI] [PMC free article] [PubMed] [Google Scholar]
- 6.Public Health Wales Healthcare Associated Infection Antimicrobial Resistance & Prescribing Programme (HARP). Public Health Wales briefing: all-cause mortality in nosocomial COVID-19 cases in Wales. Public Health Wales; 2022. Accessed January 11, 2023. https://phw.nhs.wales/services-and-teams/harp/nosocomial-covid-briefing-reports/all-cause-mortality-in-nosocomial-covid-19-cases-in-wales-version-12
Associated Data
This section collects any data citations, data availability statements, or supplementary materials included in this article.
Supplementary Materials
Data Sharing Statement