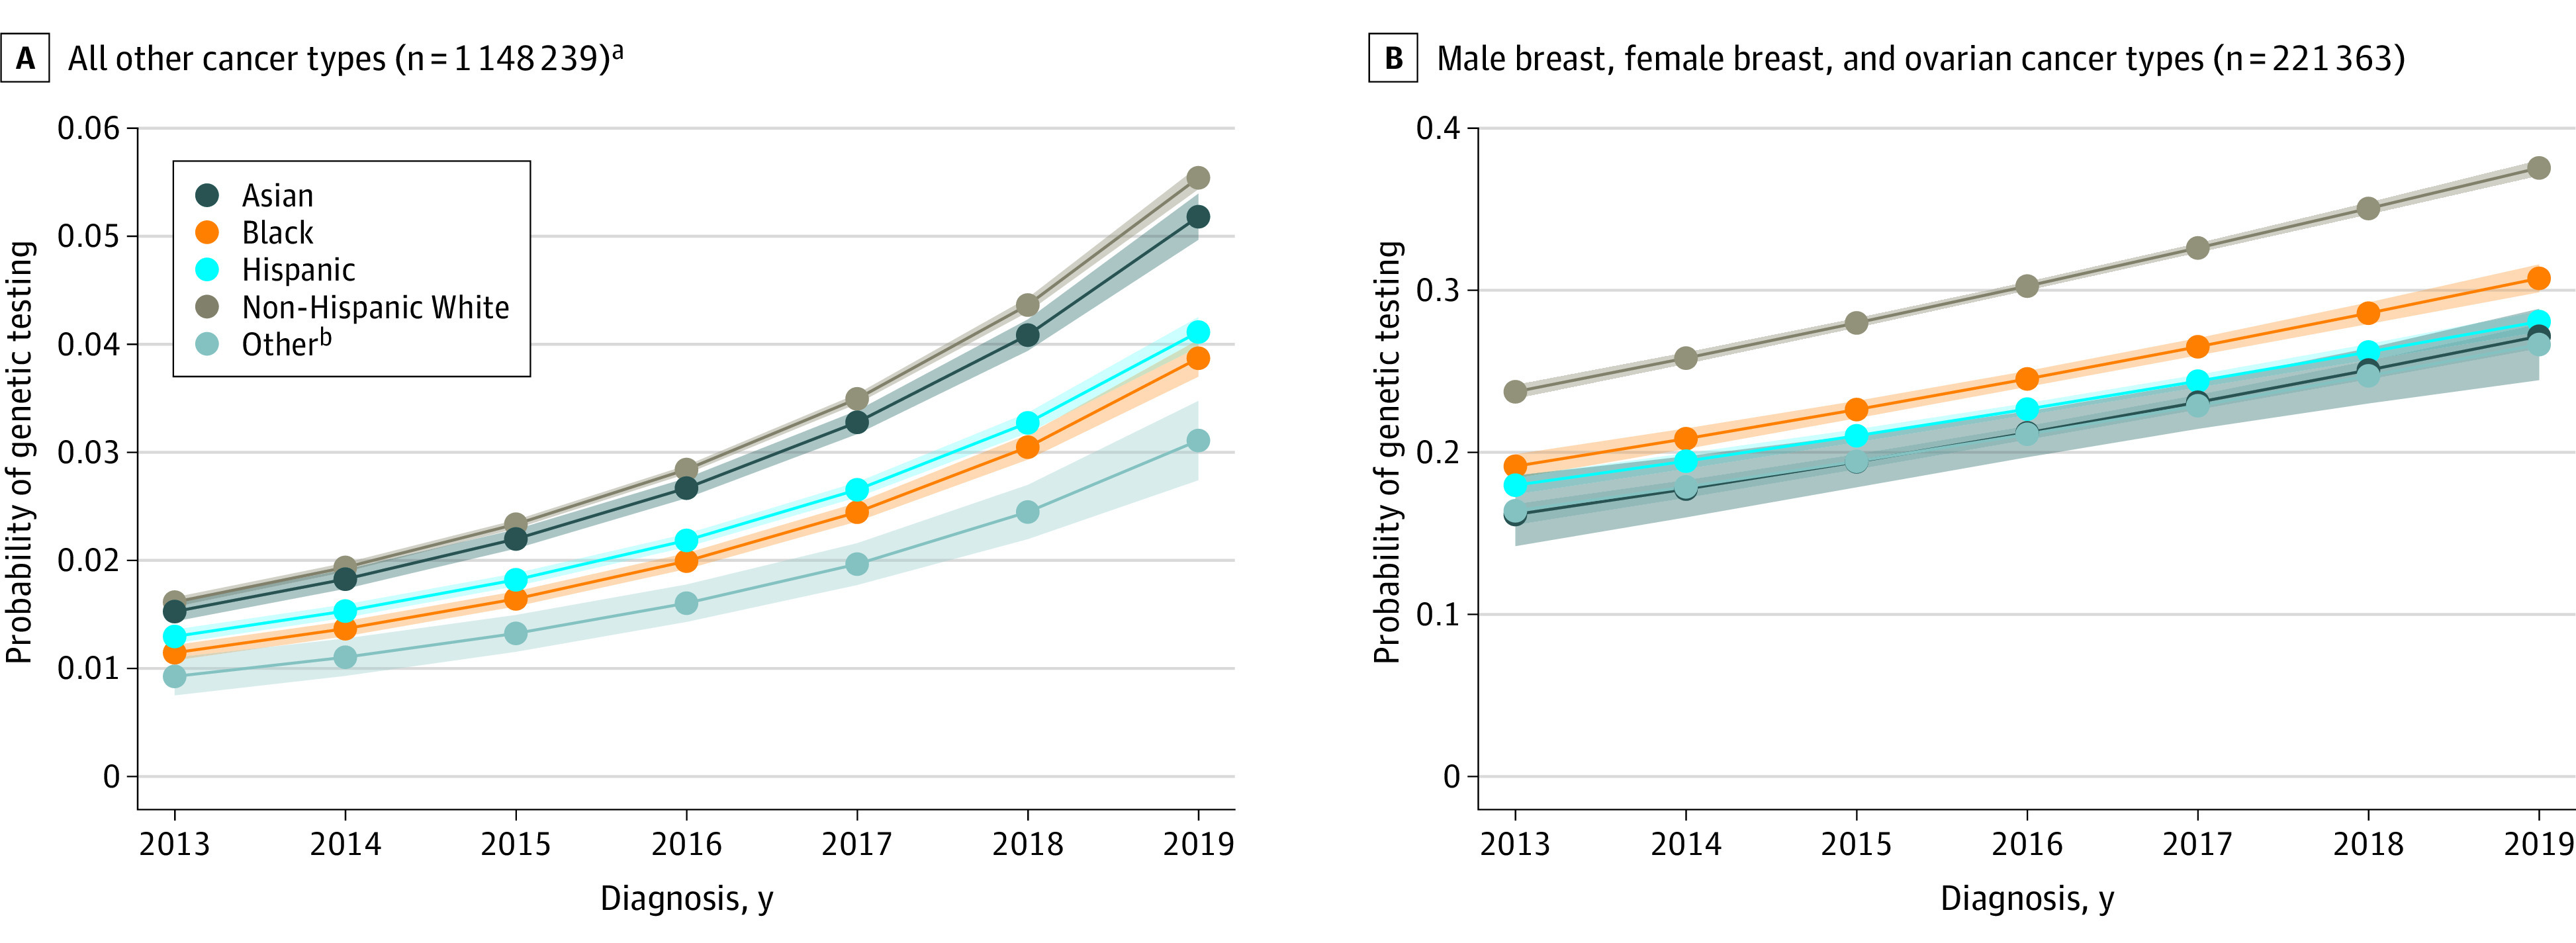
Figure 2. Modeled Probability of Genetic Testing Over Time Across Racial and Ethnic Groups.

The probabilities were predicted from a logistic regression model that included age, cancer type, diagnosis year (2013-2019), an indicator for the 3 cancer types (male breast, female breast, and ovarian) with the highest testing rates that had testing guidelines throughout the study period, and 3 interactions: (1) cancer type and age, (2) racial and ethnic group and year, and (3) the 3 cancer types (male breast, female breast, and ovarian) with the highest testing rates and racial and ethnic group. The estimates were averaged across constant age and cancer type distributions within each of (1) other cancer types (excluded male breast, female breast, and ovarian) and (2) only male breast, female breast, and ovarian cancer types. The racial and ethnic categories were mutually exclusive. The shading around the curves represents 95% CIs.
aIncludes all cancer types not included in panel B.
bIncludes patients with Surveillance, Epidemiology, and End Results race1 variable coded as Native American, unknown, and Other.
