

Abstract
Background:
Epithelial remodeling is a histopathologic feature of chronic inflammatory airway diseases including chronic rhinosinusitis (CRS). Cell-type shifts and their relationship to CRS endotypes and severity are incompletely described.
Objective:
We sought to understand the relationship of epithelial cell remodeling to inflammatory endotypes and disease outcomes in CRS.
Methods:
Using cell-type transcriptional signatures derived from epithelial single-cell sequencing, we analyzed bulk RNA-sequencing data from sinus epithelial brushings obtained from patients with CRS with and without nasal polyps in comparison to healthy controls.
Results:
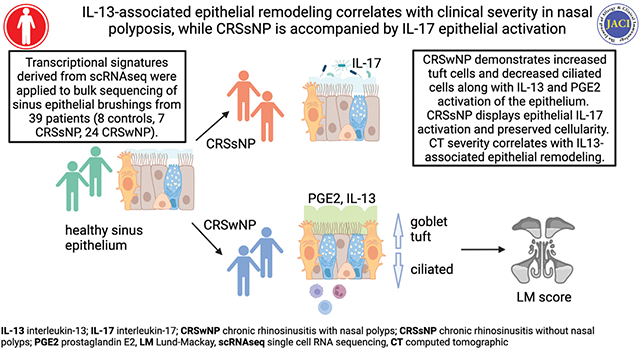
The airway epithelium in nasal polyposis displayed increased tuft cell transcripts and decreased ciliated cell transcripts along with an IL-13 activation signature. In contrast, CRS without polyps showed an IL-17 activation signature. IL-13 activation scores were associated with increased tuft cell, goblet cell, and mast cell scores and decreased ciliated cell scores. Furthermore, the IL-13 score was strongly associated with a previously reported activated (“polyp”) tuft cell score and a prostaglandin E2 activation signature. The Lund-Mackay score, a computed tomographic metric of sinus opacification, correlated positively with activated tuft cell, mast cell, prostaglandin E2, and IL-13 signatures and negatively with ciliated cell transcriptional signatures.
Conclusions:
These results demonstrate that cell-type alterations and prostaglandin E2 stimulation are key components of IL-13–induced epithelial remodeling in nasal polyposis, whereas IL-17 signaling is more prominent in CRS without polyps, and that clinical severity correlates with the degree of IL-13–driven epithelial remodeling.
Keywords: Chronic rhinosinusitis, nasal polyposis, type 2 inflammation, endotype, IL-13, prostaglandin E2, epithelial remodeling
Graphical Abstract
Chronic rhinosinusitis (CRS) is a chronic inflammatory condition affecting the nasal mucosa and paranasal sinuses in 10% of the adult population.1 Although patients suffer a common array of symptoms (including congestion, nasal discharge, facial pressure, and anosmia), CRS is increasingly recognized to be a heterogeneous disease. Two major forms of CRS are recognized: CRS with nasal polyps (CRSwNP; referred to herein as “polyp” for simplicity) or CRS without polyps (CRSsNP). Within these major subtypes, further pathologic or endotypic divisions are incompletely defined. Epithelial remodeling, epithelial barrier dysfunction, shifts in the microbial ecology, and immune activation are key processes that are thought to contribute to the pathophysiology, but the specific sequence of these events or relationship to one another is not known.
Critical to developing or selecting therapies for patients with chronic inflammatory airway diseases such as CRS is characterizing the epithelial changes (“remodeling”) that drive clinical pathology, and understanding how this remodeling is directed by inflammatory mediators. IL-13 is widely accepted to be a key driver of goblet cell differentiation in type 2 inflammation, but other epithelial changes and inflammatory mediators are less well understood. In addition, existing data on cell-type composition changes that might be driven by inflammation are inconsistent. For instance, basal cells have been reported in some publications to be increased in polyps,2 but this finding has not been consistent.3 Moreover, the airway epithelial landscape includes rare and less-understood populations of epithelial cells such as ionocytes, neuroendocrine cells, and tuft cells, which likely modify mucociliary and immune behaviors but have not been well characterized in the setting of airway inflammation.
Traditionally, studies of epithelial remodeling in chronic airway diseases such as CRS have relied on typical morphology or immunofluorescence staining to identify and enumerate cell types of interest. More recently, single-cell RNA sequencing (scSeq) has identified previously undiscovered populations and enabled more precise definitions of known cell types based on concurrent expression of multiple unique or enriched transcriptional markers. Although scSeq has improved airway cell-type definitions, application of the technique to clinical specimens remains challenging due to high costs, differential ability of distinct cell types to survive tissue digestion protocols (leading to underrepresentation), and tendency to miss rare cell types when sequencing small-to-moderate numbers of cells.
In a previous publication, we used scSeq to compare epithelial brushings from 5 nasal polyps and 4 healthy sinuses. There, we discovered that polyp brushings had increased numbers of tuft cells newly expressing eicosanoid synthetic enzymes, and an associated prostaglandin E2 (PGE2)-induced transcriptional signature across the polyp epithelium. By applying these novel transcriptional signatures to a larger bank of bulk RNA from sinus epithelial brushings from 24 patients with CRSwNP, 7 patients with CRSsNP, and 8 healthy control subjects, we determined that these scSeq-derived transcriptional signatures could be effectively applied to bulk RNA samples to confirm and extend our findings in a distinct patient cohort.3 Here, we examine additional cell-type and stimulation-state transcriptional signatures in those specimens to more broadly examine epithelial remodeling in CRS. We find that transcriptional signatures of IL-13 correlate with reductions in ciliated cells, increases in tuft cells, goblet cells, and mast cells, epithelial PGE2 activation, and radiographic severity scores in patients with CRSwNP (“polyp”). In contrast, we find that CRSsNP is associated with IL-17 stimulation without alterations in cell-type composition.
METHODS
Sinus study participants
Subjects between the ages of 18 and 75 years were recruited from the Otolaryngology Clinic of the University of California, San Francisco (UCSF) Hospital in San Francisco, Calif, between 2013 and 2019 to participate in a UCSF Sinus Tissue Bank. The UCSF Committee on Human Research approved the study, and all subjects provided written informed consent. Cytologic brushings were collected from ethmoid or maxillary sinus at the time of elective endoscopic sinus surgery from patients with physician-diagnosed CRS with or without nasal polyps on the basis of established guidelines. Subjects with CRS selected for bulk RNA sequencing were those who had nasal polyps and asthma (physician diagnosed and taking regular therapy for asthma) or those who did not have nasal polyps or asthma (no physician diagnosis of asthma and not taking any regular asthma medications). None of the CRS or control patients were on anticytokine or anti–cytokine-receptor antibodies. Subjects with cystic fibrosis were excluded from the study. Control subjects without CRS were those who were undergoing endoscopic surgery for alternative indications (ie, skull base surgery for pituitary tumor resection). Any patients with occult sinus surgery on computed tomography head imaging or visualized endoscopically at the time of surgery were excluded. Subject characteristics are presented in Table I.
TABLE I.
Clinical characteristics of patients with sinus epithelial brushings for bulk RNA sequencing
| Characteristic | Control (n = 8) | CRSsNP (n = 7) | CRSwNP (ie, polyp) (n = 24) |
P value, control vs CRS |
P value, CRSsNP vs polyp |
|---|---|---|---|---|---|
|
| |||||
| Age (y) [IQR] | 24.50 [21.75– 27.75] | 59.00 [41.00– 70.50] | 53.50 [40.25– 56.25] | .002* | .25 |
| Sex: female, n (%) | 1 (12.5) | 3 (42.9) | 10 (41.7) | .26 | 1 |
| Race, n (%) | .035* | .84 | |||
| White non-Hispanic | 3 (37.5) | 6 (85.7) | 18 (75.0) | ||
| White Hispanic | 1 (12.5) | 0(0) | 1 (4.2) | ||
| Asian | 1 (12.5) | 1 (14.3) | 2 (8.3) | ||
| Black | 0(0) | 0(0) | 2 (8.3) | ||
| Mixed/Other | 3 (37.5) | 0 (0) | 1 (4.2) | ||
| Physician-diagnosed asthma, n (%) | 0(0) | 0(0) | 24 (100) | ||
| Current or former smoker, n (%) | 1 (12.5) | 4 (57.1) | 7 (29.2) | .33 | .49 |
| Receiving ICS, n (%) | 0(0) | 0(0) | 21 (87.5) | <.0001* | <.0001† |
| Receiving oral steroids, n (%) | 0 (0) | 6 (85.7) | 20 (83.3) | <.0001* | 1 |
| Receiving antibiotics, n (%) | 0(0) | 7 (100) | 7 (29.2) | .15 | .001† |
| Lund-Mackay score, median [IQR] | NA | 10.00 [9.00– 11.00] | 17.50 [15.75– 19.50] | .001† | |
| Maximum blood eosinophils (cells/μL), median [IQR]‡ | 110 [100–210] | 365 [150–685] | 660 [400–1080] | .001* | .07 |
P values from Wilcoxon rank-sum tests for numeric data or Fisher exact test for categorical data.
ICS, Inhaled corticosteroid; IQR, interquartile range; NA, not applicable/available.
Statistically significant difference between control and CRS (combined).
Statistically significant difference between CRSsNP and CRSwNP.
One control, 2 with CRSsNP, and 3 with CRSwNP were missing blood eosinophil measurements.
Human biospecimen processing
As described in Kotas et al,3 cytologic brushings were placed in RNAlater (Qiagen, Germantown, Md) until RNA extraction. These were defrosted on ice, diluted with sterile PBS, and centrifuged, and brushes were removed and placed into lyse E tube. Pellets were resuspended in RLT buffer (with 10 μL of β-mercaptoethanol per 10 mL) and added to the lyse E tube. Samples were agitated in a bead beater for 30 seconds. Samples were centrifuged at 2000 rpm for 1 minute and transferred to an Allprep (Qiagen) spin column. RNA and DNA were prepared according to the manufacturer’s instructions. Residual DNA was removed from the purified RNA by incubation with RNase-Free DNase (Promega, Madison, Wis) for 30 minutes at 37°C. DNase was removed from the preparation via a second RNA clean up using the Qiagen RNeasy Kit. RNA concentration was determined using Nanodrop (Thermo Scientific, Waltham, Mass), and RNA quality was assessed using Agilent Pico RNA kit. Samples from the ethmoid sinus were prioritized for subsequent bulk sequencing; however, in cases in which RNA quantity was insufficient, samples from the maxillary sinus were included.
Bulk RNA sequencing for human biospecimens
For whole-transcriptome sequencing, we first used the Ion AmpliSeq Transcriptome Human Gene Expression Kit (Cat #A26325, Life Technologies, Carlsbad, Calif) to enable gene-level expression analysis from small amounts of RNA. We generated barcoded sequencing libraries per the manufacturer’s protocol from 10 ng of RNA isolated from the sinus brushings. Libraries were sequenced using the Ion PI template OT2 200 kit v3 for templating and the Ion PI sequencing 200 kit v3 kit for sequencing. Barcoding allowed all samples to be loaded onto 3 PI sequencing chips and sequenced with an Ion Proton Sequencer using standard protocols. Read mapping was performed with the Torrent Mapping Alignment Program algorithm on the Proton server, and read count tables for each gene amplicon were generated using the Proton Ampliseq plugin. Read counts for gene amplicons across all 3 runs were merged to generate the final raw expression data.
Bulk gene signature scores and comparisons
Cell-type signatures were developed on the basis of marker lists from published scSeq studies.2–5 Specifically, most epithelial cell-type signatures were based on cell-type markers identified from scSeq of samples from polyp (n = 5) and control (n = 4) sinus brushings,3 which included basal cells, secretory cells, goblet secretory cells, ciliated cells, ionocytes, and tuft cells. To identify a set of cell-type markers that was consistent across all subjects, we performed the following differential expression analyses. First, to identify potential cell-type markers, we carried out pairwise differential expression analysis, comparing log-normalized expression in each cell-type to all others using a Wilcoxon rank-sum test. Potential markers were identified as genes exhibiting significant upregulation when compared with all other cell types, defined by having a Bonferroni-adjusted P value less than .05, a log fold change more than 0.25, and more than 10% of cells with detectable expression. This analysis was then performed separately for each subject using the FindConservedMarkers function in the Seurat v. 3 R package6 to determine whether the potential markers were consistent across subjects. Final cell-type markers were required to have significant upregulation in all 9 subjects. The top 50 of these markers (ranked by maximum P value across subjects) for each cell type were included in the gene signature. The resulting “tuft cell score” presented here therefore represents genes expressed in both control and polyp-derived tuft cells, and differs from the “polyp tuft cell” score generated in Kotas et al,3 which includes genes uniquely expressed by tuft cells in polyps. Some cell types had fewer than 50 genes that met these quality standards, and therefore had shorter marker lists. A neuroendocrine cell signature was based on markers from Goldfarbmuren et al4 comparing gene expression in neuroendocrine cells to that in other rare epithelial cell types, including ionocytes and tuft cells. Scores for mast cells and neutrophils were derived from published marker lists from Ordovas-Montanes et al2 and Travaglini et al,5 respectively.
PGE2, IL-13, and polyp tuft cell signatures were generated from the IL-13 and PGE2 pan-epithelial response genes identified in Kotas et al.3 To identify differentially expressed genes between polyp and control epithelium from scSeq, we performed pseudo-bulk differential expression analysis separately for each epithelial cell type. Differentially expressed genes were classified as “pan-epithelial” if they were upregulated in polyp versus control in at least 9 of 11 epithelial cell types. These genes were hierarchically clustered on the basis of Euclidean distance using the complete linkage method to identify modules of related genes. Pan-epithelial differentially expressed genes were then assigned as IL-13–induced or PGE2-induced on the basis of comparison to quantitative PCR on RNA extracted from human sinus epithelial cells cultured at air-liquid interface for 21 days in Pneumacult-ALI and stimulated with PGE2 (1 μg/mL) or IL-13 (10 ng/mL) for 24 hours. The IL-17 signature was based on Christenson et al.7
To generate scores reflective of these signatures, RNA-sequencing count data were first normalized using DESeq2’s variance-stabilizing transformation.8 Normalized gene expression was then centered and scaled, and a score for each sample was generated by taking the average of scaled, normalized expression for all genes in the signature. If cell-type markers or signature genes were minimally or not expressed in the bulk RNA-sequenced samples, those genes were excluded from scoring. For full lists of genes included in each score, see Table E1 in this article’s Online Repository at www.jacionline.org.
Modeling of gene signature scores
Gene signature scores were compared between patients with polyp, CRSsNP, and healthy controls using linear regression. Unadjusted models and models adjusting for patient age, sex, smoking status (ever vs never), and race (white vs other races) were fit. P values from unadjusted models are shown in figures, whereas results from adjusted models are provided in this article’s Online Repository at www.jacionline.org (Table E2). The Benjamini-Hochberg method9 was used to correct P values for multiple comparisons in both unadjusted and adjusted models.
Associations between the IL-13 and PGE2 response signature scores and other gene expression scores were evaluated using linear regression models. Unadjusted models and models adjusting for patient group, age, sex, smoking status, and race were fit. Similar linear models were used to determine the association between Lund-Mackay (LM) scores and gene signature scores. P values from unadjusted models are shown in figures, whereas results from adjusted models are provided in this article’s Online Repository at www.jacionline.org (Table E2). Again, the Benjamini-Hochberg method was used to correct P values for multiple comparisons in both the unadjusted and adjusted models.
Differential expression and gene set enrichment analysis
Differential expression between groups was performed using DESeq2. Models controlled for age, sex, smoking status, and race. P values were corrected using the Benjamini-Hochberg method to control the false-discovery rate. Gene set enrichment analysis was performed separately for upregulated and downregulated differentially expressed genes (FDR-adjusted P value < .05) using the EnrichR R package10–12 with the KEGG 201913,14 database.
Study approval
Sampling from human subjects was approved by the UCSF Committee on Human Research, and all subjects provided written informed consent.
RESULTS
To broadly examine cell-type changes in CRS, we generated lists of the top 50 transcriptional markers of epithelial cell types found in healthy or polyp sinus epithelium from scSeq data,3 and averaged the scaled and normalized expression of these markers to create cell-type “scores.” These included well-described and common cell types such as basal cells, goblet secretory cells, and ciliated cells, as well as rare subsets including tuft cells, neuroendocrine cells, and ionocytes. We then applied these cell-type “scores” to sequenced bulk RNA-sequencing data obtained from our larger cohort (Fig 1, A). We observed no difference in basal cell or goblet secretory cell scores between groups (Fig 1, B and C), but found that ciliated cell–associated transcripts were significantly decreased in patients with polyp compared with patients with CRSsNP, and trended to decrease in those with polyp compared with controls (Fig 1, D). Next, examining rare cell types, we detected an increase in tuft cell transcripts in polyp (Fig 1, E), consistent with previous reports and our previous single-cell sequencing data.3,15 In contrast, neuroendocrine cells and ionocytes, which may share a lineage relationship with tuft cells,4 trended toward decrease in patients with polyp compared with patients with CRSsNP (Fig 1, F and G).
FIG 1.
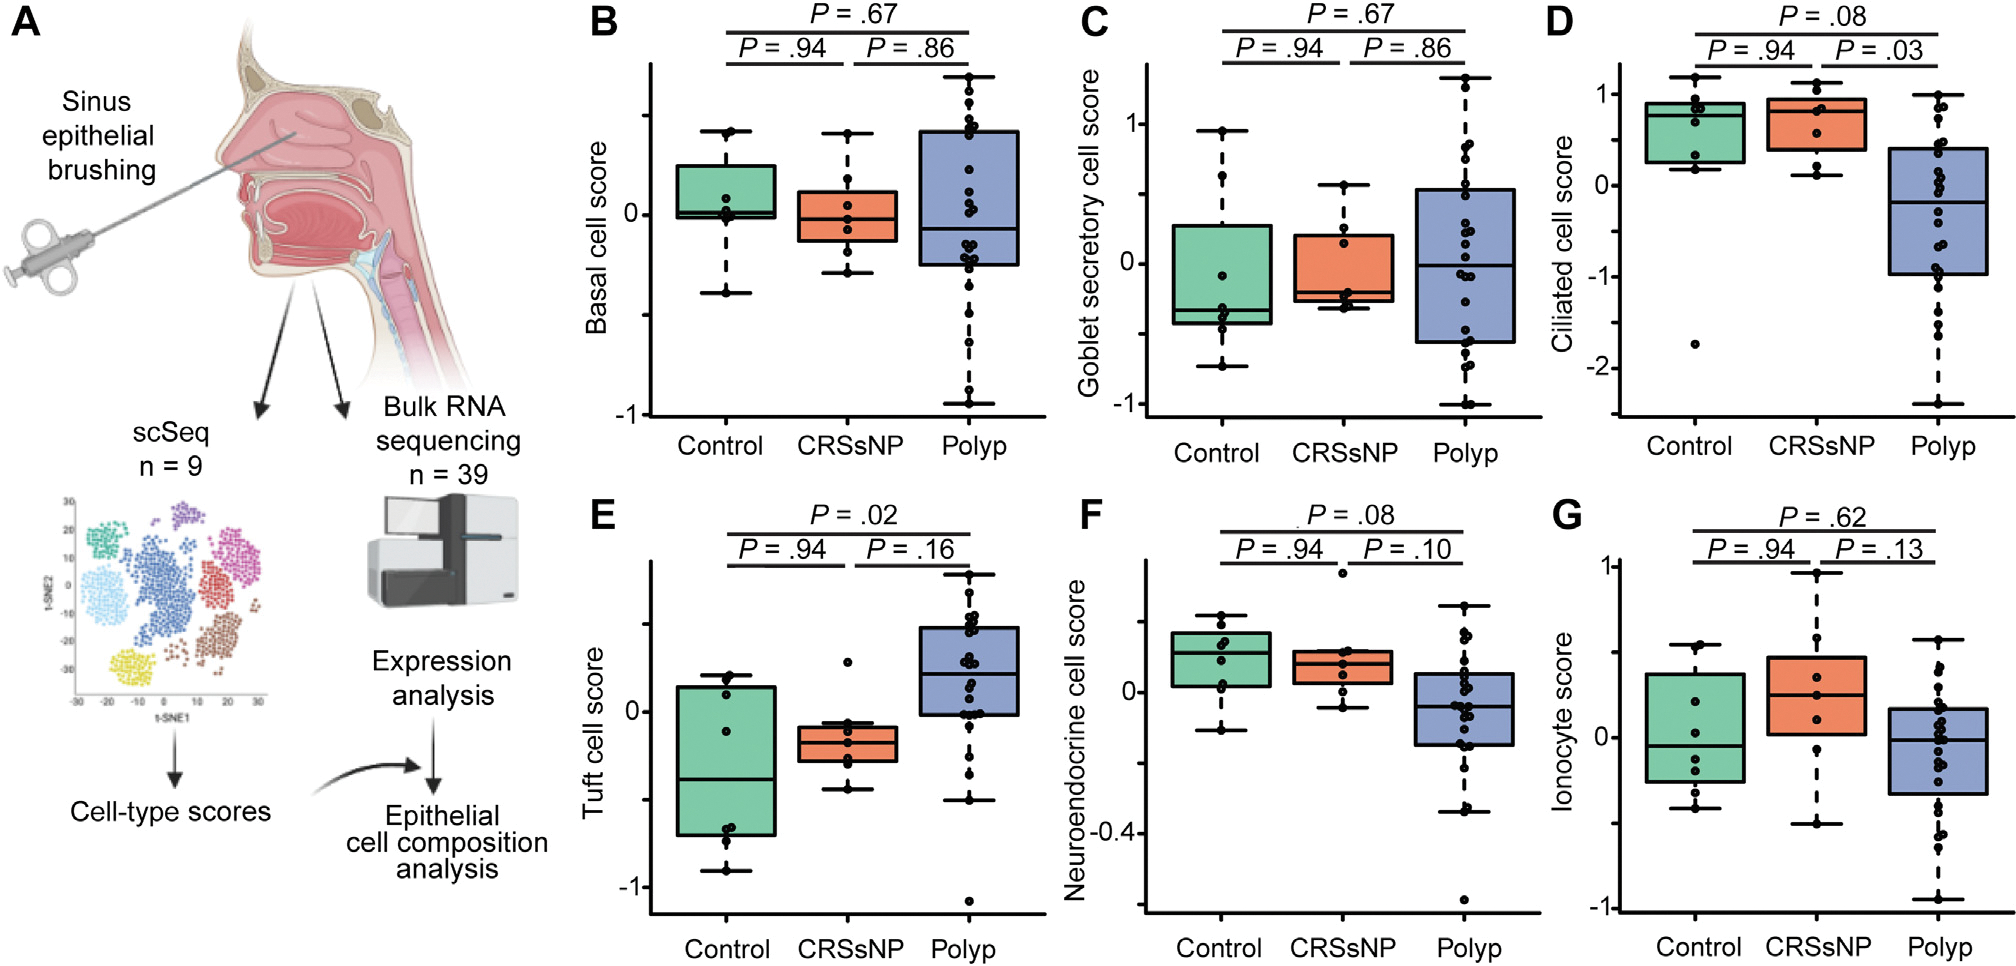
Bulk RNA sequencing suggests loss of ciliated cells and increase in tuft cells in CRSwNP. A, Cell-type signatures generated from scSeq were applied to 39 bulk RNA-sequenced endoscopic sinus brushings. B, Basal cell, (C) goblet secretory cell, (D) ciliated cell, (E) tuft cell, (F) neuroendocrine cell, and (G) ionocyte cell scores in sequenced sinus brushings.
Nasal polyposis is associated with type 2 inflammation.1 We previously found that a 3-gene score described as a bronchial epithelial biomarker of the type 2–high variant of asthma16 was increased in polyp compared with control or CRSsNP tissue.3 We reasoned that an expanded list of IL-13–responsive genes specifically identified in sinonasal tissue may better discriminate between patients with different endotypes of CRS. We analyzed the expression of a set of IL-13–responsive genes that we previously found to be commonly upregulated in most epithelial cell types in polyps compared with control tissue, and found these to be significantly increased in bulk-sequenced polyp epithelium, but not CRSsNP, compared with control tissue (Fig 2, A and B). Consistent with this finding and the prominent involvement of mast cells in type 2 airway inflammation, we also found a significant increase in mast cell–associated transcripts in polyp but not CRSsNP epithelium compared with controls (Fig 2, C).
FIG 2.
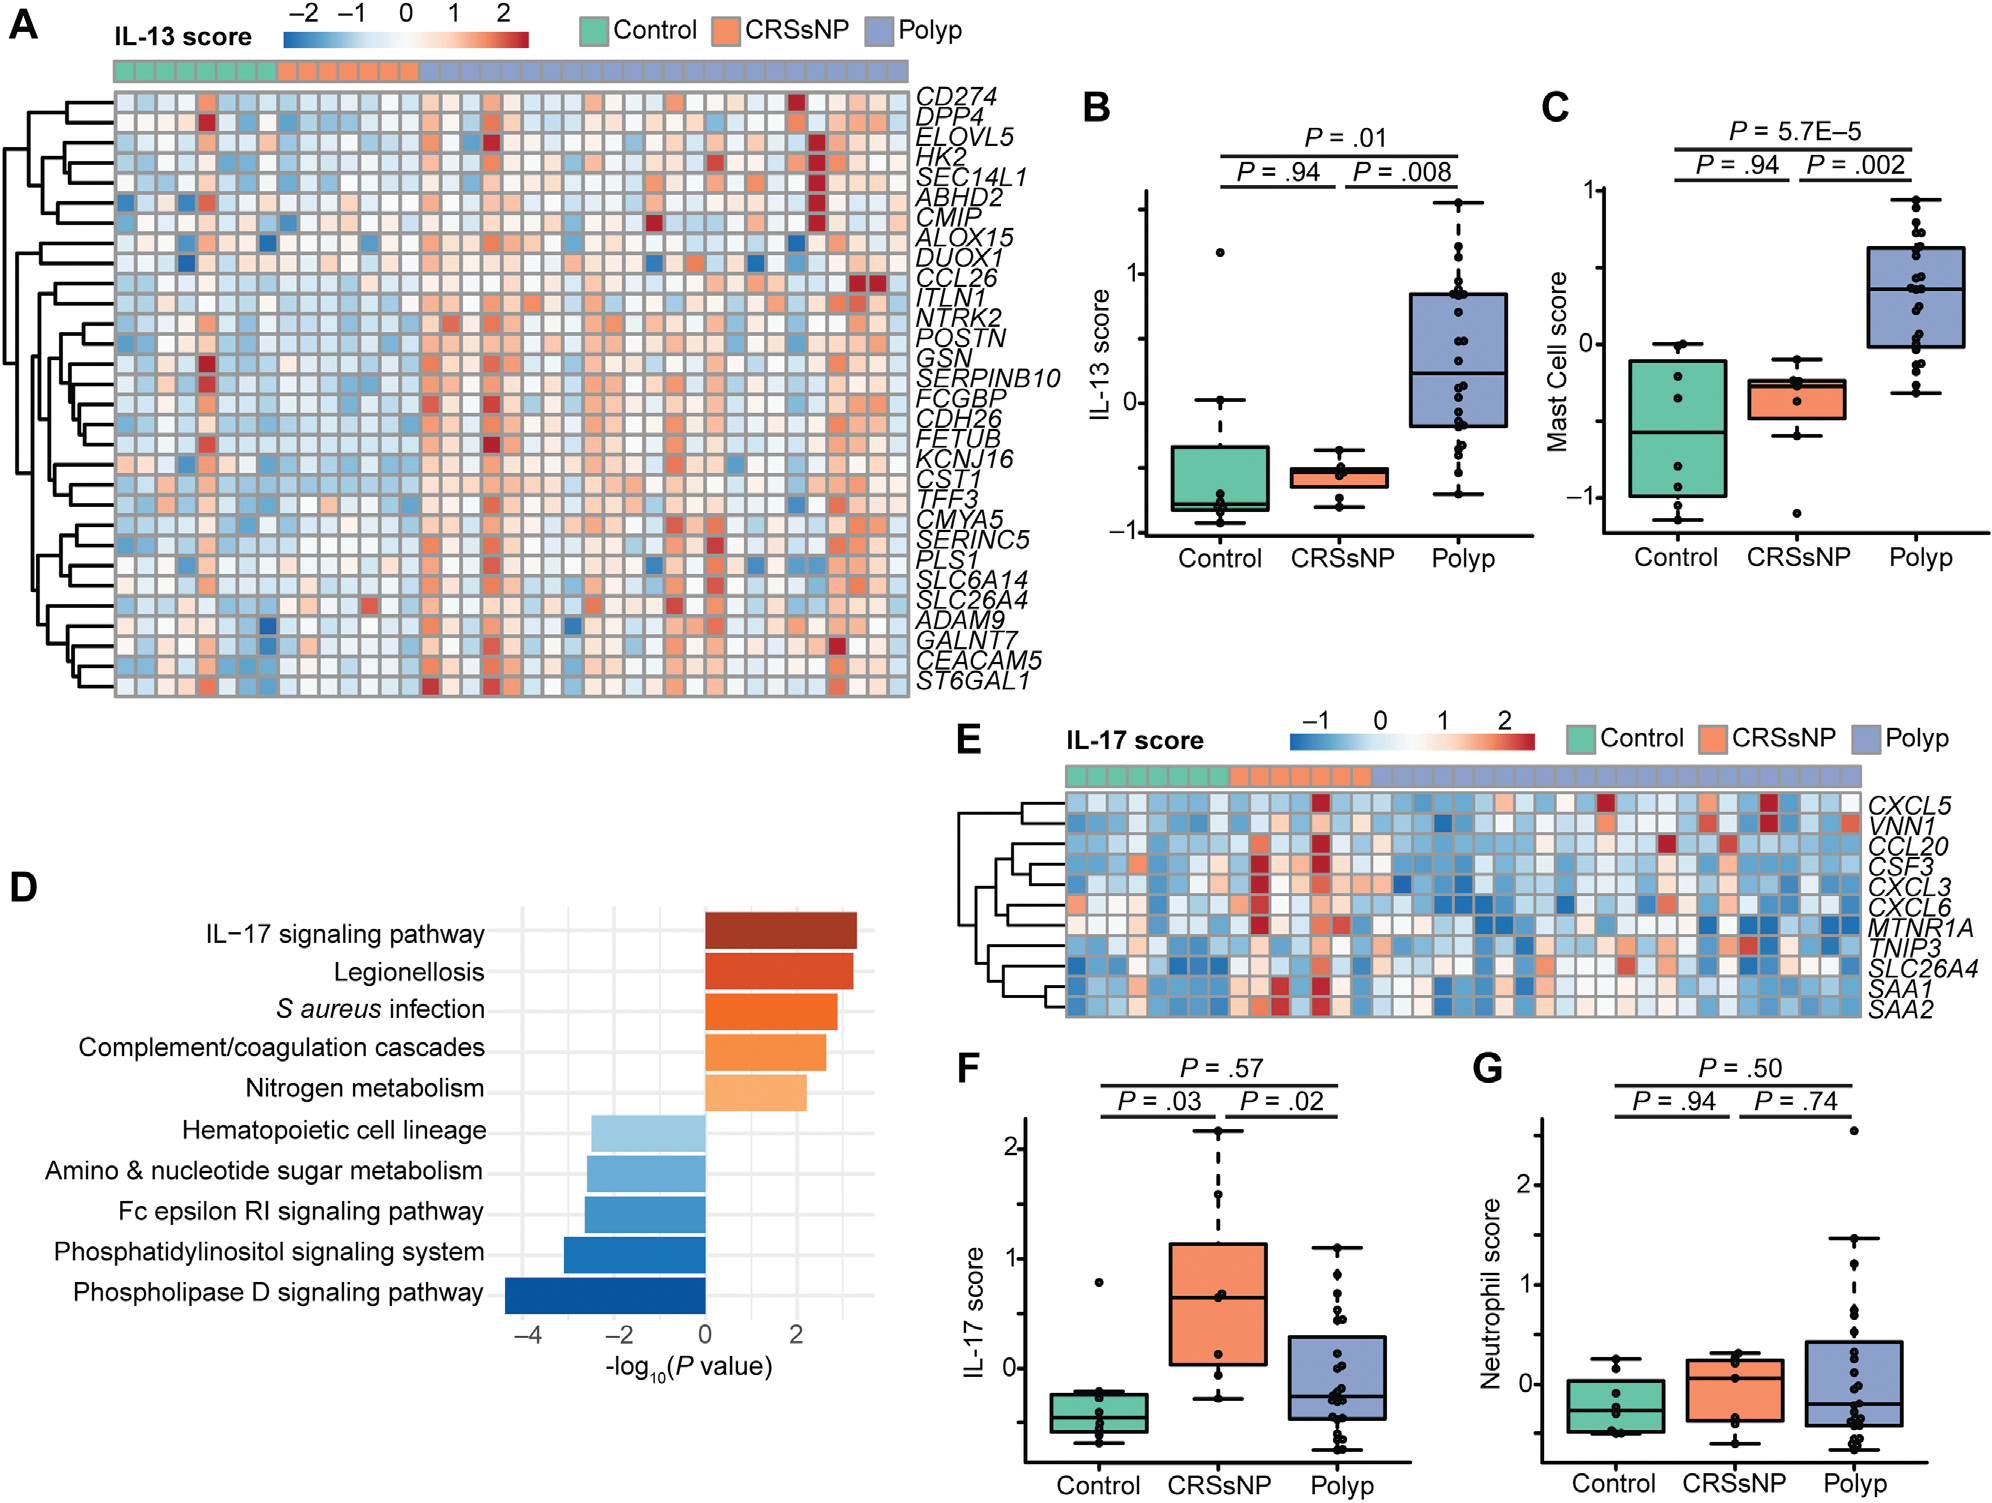
IL-13–driven inflammation dominates in nasal polyps, whereas IL-17–driven inflammation is found in CRSsNP. A, IL-13–responsive genes are increased in polyp epithelium compared with CRSsNP or controls. B, Composite “score” of genes in Fig 2, A. C, Increased expression of transcripts associated with mast cells in nasal polyps. D, Enrichment in IL-17 signaling in CRSsNP compared with polyp. E, IL-17 response signature is elevated in CRSsNP. F, Composite score of IL-17 epithelial response signature from Fig 2, E. G, Neutrophil signatures are unaltered in CRS.
CRSsNP is known to be an inflammatory state, but our samples lacked signs of type 2 inflammation (3-gene score16 or sinus IL-13 score). Therefore, we hypothesized that a different inflammatory signature might be dominant in some patients with CRSsNP. Comparing transcripts upregulated in CRSsNP over polyps, we observed enrichment of genes associated with IL-17 signaling (Fig 2, D). Because the IL-17 pathway can affect a broad array of cell types, with variable functional or transcriptional impacts, we then made use of an 11-gene IL-17–response transcriptional signature previously validated specifically in airway epithelium.7 We found that this IL-17 signaturewas significantly increased in epithelial brushings from patients with CRSsNP when compared with either patients with polyp or controls (Fig 2, E and F). Although IL-17 signaling is sometimes associated with neutrophil recruitment, we observed no increase in neutrophil-associated transcriptional scores between patient endotypes (Fig 2, G).
IL-13 is thought to be a key driver of airway epithelial remodeling and cell-type compositional changes.3,17 To determine how cell-type compositional changes relate to inflammatory cues in CRS, we examined the relationship between our IL-13 sinus epithelial score and the epithelial cell-type scores described in Figure 1. As we expected, IL-13–associated transcripts strongly correlated with tuft cell signatures (Fig 3, A). In contrast, the IL-13 score was inversely correlated with ciliated cell markers (Fig 3, B). The IL-13 score also correlated strongly with markers of both goblet secretory cells and mast cells (Fig 3, C and D), consistent with previous mechanistic studies.18,19
FIG 3.
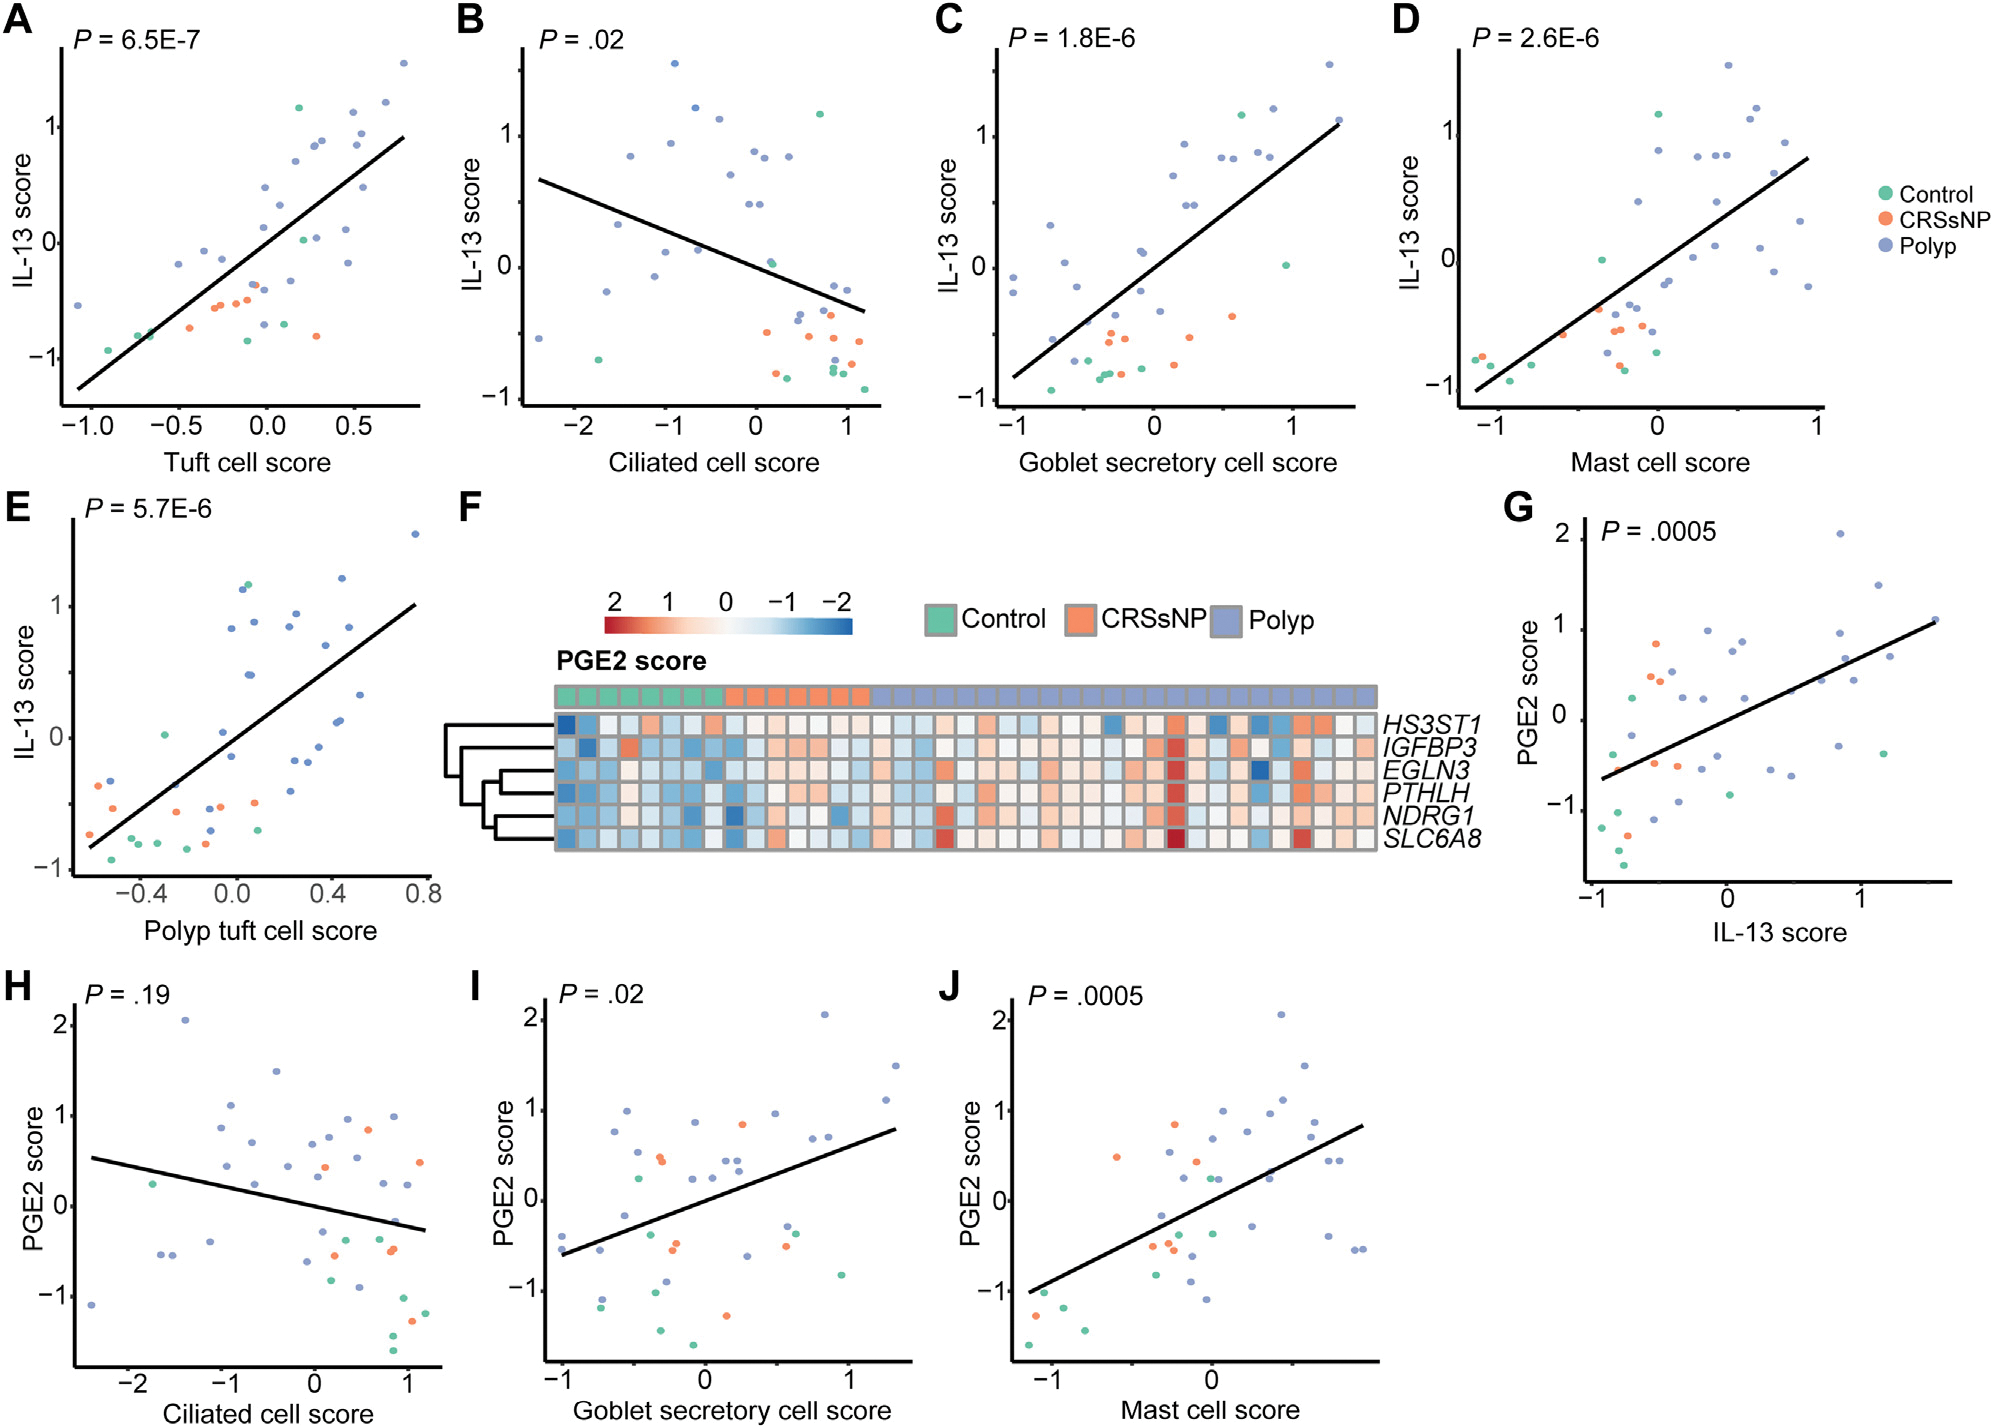
IL-13 and PGE2 signatures are associated with epithelial remodeling in CRS. Correlation of IL-13 score with transcripts associated with (A) tuft cells, (B) ciliated cells, (C) goblet secretory cells, and (D) mast cells. E, Correlation of polyp tuft cell score with IL-13 score. F, Increase in PGE2-response genes in CRS. G, Correlation between IL-13 score and PGE2 score. Correlation between PGE2 and (H) ciliated, (I) goblet secretory, and (J) mast cell scores in sinus.
We previously observed that tuft cells in nasal polyps adopt a novel gene expression signature (“polyp tuft cell” score), which likely enables increased production of PGE2, alongside a pan-epithelial transcriptional signature of PGE2 stimulation across polyp epithelium.3 Consistent with the previously proposed hypothesis that polyp tuft cells develop as a result of IL-13 stimulation, the IL-13 score correlated strongly with that of the polyp tuft cell score (Fig 3, E). Moreover, the PGE2 stimulation score was increased in CRS—particularly in polyps—and correlated strongly with the IL-13 score (Fig 3, F and G). Because IL-13 likely drives production of PGE2 from activated tuft cells, we considered the possibility that cellular composition changes in CRS could be directed in part through PGE2. The PGE2 score correlated poorly with the ciliated cell score (Fig 3, H), but was positively correlated with goblet secretory cell and mast cell transcripts (Fig 3, I and J).
Clinical manifestations of CRS such as nasal congestion, mucus discharge, and recurrent infections may be caused by epithelial remodeling (for instance, favoring mucus production at the expense of ciliated cells) and/or by the infiltration of immune cells that modify tissue functions through release of paracrine mediators such as cytokines. To determine how the observed cell-type changes and inflammatory scores relate to clinical disease severity, we calculated LM scores, which measure the degree of sinus opacification based on computed tomography imaging.20 We found that LM scores were strongly positively associated with the polyp tuft cell score (Fig 4, A) and strongly negatively correlated with the ciliated cell score (Fig 4, B), suggesting potential contributions of disordered cell-type composition to disease manifestations. Examining indicators of inflammation, we observed that the PGE2 score, IL-13 score, and mast cell scores were also correlated with LM scores (Fig 4, C–E), though the IL-17 score was not (Fig 4, F).
FIG 4.
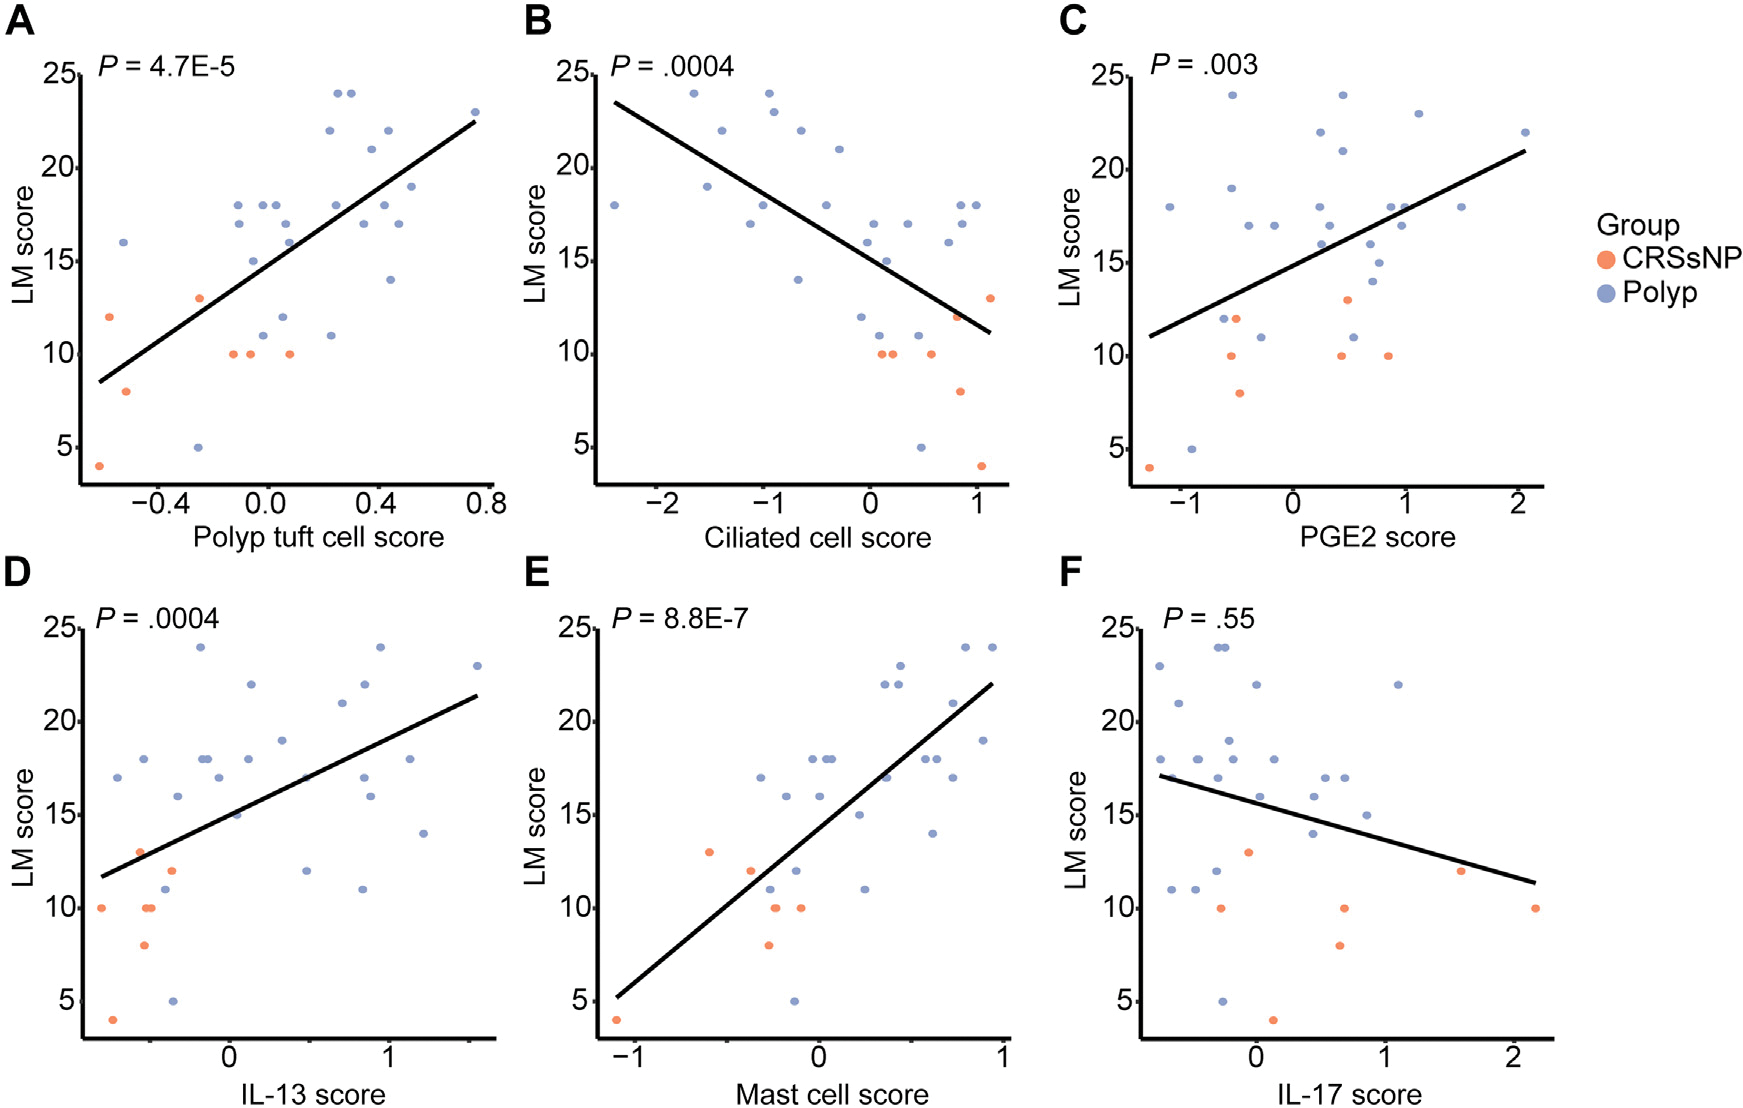
Cell-type composition changes and inflammatory scores correlate with sinus opacification in CRS. Correlations between LM score and (A) polyp tuft cell score, (B) ciliated cell score, (C) PGE2 score, (D) IL-13 score, (E) mast cell score, and (F) IL-17 score in CRS epithelial brushings.
Conclusions
Here, we report that epithelial brushings from patients with CRSwNP showed reduced ciliated cell–associated transcripts and increased tuft cell–related transcripts, suggesting cell-type composition shifts. These cell-type changes correlated with signatures of IL-13 and PGE2-driven inflammation, as well as with radiographic metrics of disease severity. In contrast, CRSsNP was associated with IL-17–driven inflammation, but this was not associated with specific cell-type changes or radiographic scores. These findings suggest that clinical outcomes in CRS may be related to alterations in airway epithelial function, particularly those associated with IL-13 activity.
Our finding of decreased ciliated cell transcripts in association with IL-13 activity and worse sinus pathology is consistent with published clinical literature linking inherited or acquired ciliopathies to nasal polys and other sinus diseases21–23 and the inhibitory effect of IL-13 on ciliary cell development and function in vitro.24 However, the effects of IL-13 on alterations in mucociliary function extend beyond the ciliated cells. The robust increase in goblet cells and a shift from MU-C5B to MU-C5AC expression following IL-13 activation of the epithelium is well established.18 Consistent with this, we find a strong positive correlation between the goblet secretory score and the IL-13 activation score in the sinus epithelium. Surprisingly, the goblet secretory score was not increased in the epithelium of patients with CRSwNP compared with controls. This may be due to the small sample size or differences in anatomic location. Among control subjects, brushings were predominantly collected from the maxillary sinus, whereas for patients with CRS, these were all sampled from the ethmoid. Previous reports describe an increase in goblet cells within the maxillary sinus compared with ethmoid.25 Because subepithelial tissues including glands, connective tissue, and deep layers of basal cells may be undersampled by surface epithelial brushings as performed in our study, future studies using surgical biopsies will be required to address potential correlations between IL-13 activity and these other cell types.
We previously showed that tuft cells increase in the epithelium of nasal polyps and that IL-13–activated tuft cells contribute significantly to airway PGE2 production.3 Others have demonstrated that tuft cell production of cysteinyl leukotrienes can augment airway type 2 inflammation.26 Our findings here suggest that tuft cell eicosanoid production may contribute to CRS pathology, because radiographic sinus opacification correlated strongly with transcriptional signatures of IL-13, tuft cell activation, and PGE2 production. Although cysteinyl leukotrienes are known to augment type 2 inflammation through direct action on TH2 and type 2 innate lymphocyte cells,27–29 PGE2 has broad physiologic effects including well-described anti-inflammatory effects on TH2 and type 2 innate lymphocyte cells.30,31 Its tissue effects include the ability to elicit potent interstitial edema32,33 and activate epithelial fluid secretion via the cystic fibrosis transmembrane receptor,3 which together may act to impair normal sinus drainage. PGE2 may also stimulate goblet cell development and mucin secretion, further enhancing the effects of IL-13 on goblet cell differentiation.34–36
Although we found that nasal polyps had evidence of IL-13 stimulation, this was not evident in CRSsNP. This contrasts with a previous report suggesting that a subset of patients with CRSsNP has type 2 tissue inflammation.37 In a cohort of 240 subjects with CRSsNP, Delemarre et al37 measured tissue concentrations of IL-4 and IL-5 along with tissue and blood eosinophils. About half the subjects they profiled had tissue IL-5 concentrations greater than or equal to 12.98 pg/g, along with increased peripheral eosinophils, and were designated as “type 2 CRSsNP.” Unfortunately, the lack of a control group precludes assessment of whether the measured cytokines were actually elevated when compared with healthy tissue: a critical question as we note that some of our control patients without sinus disease had evidence of type 2 inflammation. Nevertheless, differences between their study and ours could be explained by sample size and clinical characteristics. In our small sample of patients with CRSsNP, none had comorbid asthma and 4 of 7 were current or former smokers,3 whereas in the previous study, 30% of the patients with “type-2 CRSsNP” had a comorbid diagnosis of asthma.37
We did find that patients with CRSsNP have evidence of IL-17 activation of the epithelium, a signature that was also present in several of the patients with nasal polyp. This finding is supported by the work of Delemarre et al, which found increased IL-17 cytokine levels in “non–type 2 CRSsNP” tissue, and suggested that IL-17–mediated inflammation is likely to be an important contributor to non–type 2–mediated CRS. IL-17 can be produced in response to bacterial or fungal challenge, and it is essential for controlling bacterial infection at mucosal surfaces.38 Although there is evidence of microbial influences on the development and progression of CRS,39 a large multinational study of the sinonasal microbiome demonstrated no significant differences in microbial composition between CRSsNP and health but found a reduction in Corynebacterium and an increase in Streptococcus in CRSwNP.40 Future studies are needed to determine whether dysregulation of the IL-17 pathway in CRSsNP is mediated by bacterial products or whether it might be amenable to therapeutic blockade with IL-17–directed therapeutics. Although we did not observe correlations between the IL-17 scores and epithelial cell-type shifts or LM scores, our study is limited by small sample size, and such correlations are worthy of future study in larger patient cohorts.
In sum, this study provides evidence that IL-13–induced airway epithelial remodeling in nasal polyposis includes a loss of ciliated cells and expansion of tuft and goblet cells. These compositional changes occur in an epithelium marked by increased prostaglandin activity, which likely further contributes to altered tissue function. IL-13–driven epithelial remodeling and PGE2-induced tissue effects may coordinately contribute to sinus opacification observed radiographically. With the increased use of type 2 cytokine–directed biologics in clinical practice, future studies are needed to determine how such therapies alter the epithelial landscape. Integration of epithelial remodeling signatures with other commonly used clinical measurements such as eosinophilia, immunoglobulins, and allergy testing may aid in further refining endotypic definitions and selecting patients for targeted treatment.
Supplementary Material
Key messages.
Cell-type signatures from scSeq, applied to bulk-sequenced RNA from sinus brushings, suggest increased tuft cells and mast cells and decreased ciliated cells in nasal polyp epithelium.
IL-17 signaling rather than IL-13 signaling is observed in epithelium from patients with CRSsNP.
IL-13–driven epithelial remodeling and PGE2 signatures correlated with clinical measures of sinus opacification in CRS.
Acknowledgments
We gratefully acknowledge the support and participation of our patients. The graphical abstract and schematic in Fig 1, A, were created with BioRender.com.
This work was supported by the National Institutes of Health (grant no. 5R01AI136962 to E.D.G.; grant nos. R01HL128439, R01HL135156, and P01HL132821 to M.A.S.; grant nos. F32HL140868 and T32HL007185 to M.E.K.; and grant no. F32HL158174 to C.A.S.), the Department of Defense (M.A.S.), the A.P. Giannini Foundation (M.E.K.), the Webb-Waring Early Career Investigator Award from the Boettcher Foundation (C.M.M.), the Nina Ireland Program for Lung Health at UCSF (E.D.G. and M.E.K.), the UCSF John A. Watson Faculty Scholar Fund (J.G.G.), and the SABRE Center at UCSF (E.D.G.).
Abbreviations used
- CRS
Chronic rhinosinusitis
- CRSsNP
CRS without nasal polyps
- CRSwNP
CRS with nasal polyps
- LM
Lund-Mackay
- PGE2
Prostaglandin E2
- scSeq
Single-cell RNA sequencing
- UCSF
University of California, San Francisco
Footnotes
Disclosure of potential conflict of interest: J. G. Gurrola II is a Genentech Advisory Board Consultant with agreement ending December 2021. A. N. Goldberg is a minor stock holder in Siesta Medical. S. D. Pletcher and A. N. Goldberg are coinventors of patent 14/394, 006 Sinus diagnostics and treatments. The rest of the authors declare that they have no relevant conflicts of interests.
REFERENCES
- 1.Schleimer RP. Immunopathogenesis of chronic rhinosinusitis and nasal polyposis. Annu Rev Pathol 2017;12:331–57. [DOI] [PMC free article] [PubMed] [Google Scholar]
- 2.Ordovas-Montanes J, Dwyer DF, Nyquist SK, Buchheit KM, Vukovic M, Deb C, et al. Allergic inflammatory memory in human respiratory epithelial progenitor cells. Nature 2018;560:649–54. [DOI] [PMC free article] [PubMed] [Google Scholar]
- 3.Kotas ME, Moore CM, Gurrola JG II, Pletcher SD, Goldberg AN, Alvarez R, et al. IL-13-programmed airway tuft cells produce PGE2, which promotes CFTR-dependent mucociliary function. JCI Insight 2022;7:e159832. [DOI] [PMC free article] [PubMed] [Google Scholar]
- 4.Goldfarbmuren KC, Jackson ND, Sajuthi SP, Dyjack N, Li KS, Rios CL, et al. Dissecting the cellular specificity of smoking effects and reconstructing lineages in the human airway epithelium. Nat Commun 2020;11:2485. [DOI] [PMC free article] [PubMed] [Google Scholar]
- 5.Travaglini KJ, Nabhan AN, Penland L, Sinha R, Gillich A, Sit RV, et al. A molecular cell atlas of the human lung from single cell RNA sequencing. Nature 2020;587:619–25. [DOI] [PMC free article] [PubMed] [Google Scholar]
- 6.Argelaguet R, Arnol D, Bredikhin D, Deloro Y, Velten B, Marioni JC, et al. MOFA+: a statistical framework for comprehensive integration of multi-modal single-cell data. Genome Biol 2020;21:111. [DOI] [PMC free article] [PubMed] [Google Scholar]
- 7.Christenson SA, van den Berge M, Faiz A, Inkamp K, Bhakta N, Bonser LR, et al. An airway epithelial IL-17A response signature identifies a steroid-unresponsive COPD patient subgroup. J Clin Invest 2019;129:169–81. [DOI] [PMC free article] [PubMed] [Google Scholar]
- 8.Love MI, Huber W, Anders S. Moderated estimation of fold change and dispersion for RNA-seq data with DESeq2. Genome Biol 2014;15:550. [DOI] [PMC free article] [PubMed] [Google Scholar]
- 9.Benjamini Y, Hochberg Y. Controlling the false discovery rate—a practical and powerful approach to multiple testing. J Royal Stat Soc Series B-Stat Methodol 1995;57:289–300. [Google Scholar]
- 10.Chen EY, Tan CM, Kou Y, Duan Q, Wang Z, Meirelles GV, et al. Enrichr: interactive and collaborative HTML5 gene list enrichment analysis tool. BMC Bioinform 2013;14:128. [DOI] [PMC free article] [PubMed] [Google Scholar]
- 11.Kuleshov MV, Jones MR, Rouillard AD, Fernandez NF, Duan Q, Wang Z, et al. Enrichr: a comprehensive gene set enrichment analysis web server 2016 update. Nucleic Acids Res 2016;44:W90–7. [DOI] [PMC free article] [PubMed] [Google Scholar]
- 12.Xie Z, Bailey A, Kuleshov MV, Clarke DJB, Evangelista JE, Jenkins SL, et al. Gene set knowledge discovery with Enrichr. Curr Protoc 2021;1:e90. [DOI] [PMC free article] [PubMed] [Google Scholar]
- 13.Kanehisa M, Goto S. KEGG: kyoto encyclopedia of genes and genomes. Nucleic Acids Res 2000;28:27–30. [DOI] [PMC free article] [PubMed] [Google Scholar]
- 14.Kanehisa M Toward understanding the origin and evolution of cellular organisms. Protein Sci 2019;28:1947–51. [DOI] [PMC free article] [PubMed] [Google Scholar]
- 15.Patel NN, Kohanski MA, Maina IW, Triantafillou V, Workman AD, Tong CCL, et al. Solitary chemosensory cells producing interleukin-25 and group-2 innate lymphoid cells are enriched in chronic rhinosinusitis with nasal polyps. Int Forum Allergy Rhinol 2018;8:900–6. [DOI] [PMC free article] [PubMed] [Google Scholar]
- 16.Woodruff PG, Boushey HA, Dolganov GM, Barker CS, Yang YH, Donnelly S, et al. Genome-wide profiling identifies epithelial cell genes associated with asthma and with treatment response to corticosteroids. Proc Natl Acad Sci U S A 2007;104:15858–63. [DOI] [PMC free article] [PubMed] [Google Scholar]
- 17.Jackson ND, Everman JL, Chioccioli M, Feriani L, Goldfarbmuren KC, Sajuthi SP, et al. Single-cell and population transcriptomics reveal pan-epithelial remodeling in type 2-high asthma. Cell Rep 2020;32:107872. [DOI] [PMC free article] [PubMed] [Google Scholar]
- 18.Seibold MA. Interleukin-13 stimulation reveals the cellular and functional plasticity of the airway epithelium. Ann Am Thorac Soc 2018;15:S98–102. [DOI] [PMC free article] [PubMed] [Google Scholar]
- 19.Bradding P, Walls AF, Holgate ST. The role of the mast cell in the pathophysiology of asthma. J Allergy Clin Immunol 2006;117:1277–84. [DOI] [PubMed] [Google Scholar]
- 20.Lund VJ, Kennedy DW. Staging in rhinosinusitis. Otolaryngol Head Neck Surg 1997;117:S35–40. [DOI] [PubMed] [Google Scholar]
- 21.Ferkol TW, Leigh MW. Ciliopathies: the central role of cilia in a spectrum of pediatric disorders. J Pediatr 2012;160:366–71. [DOI] [PMC free article] [PubMed] [Google Scholar]
- 22.Li YY, Li CW, Chao SS, Yu FG, Yu XM, Liu J, et al. Impairment of cilia architecture and ciliogenesis in hyperplastic nasal epithelium from nasal polyps. J Allergy Clin Immunol 2014;134:1282–92. [DOI] [PubMed] [Google Scholar]
- 23.Gudis D, Zhao KQ, Cohen NA. Acquired cilia dysfunction in chronic rhinosinusitis. Am J Rhinol Allergy 2012;26:1–6. [DOI] [PMC free article] [PubMed] [Google Scholar]
- 24.Laoukili J, Perret E, Willems T, Minty A, Parthoens E, Houcine O, et al. IL-13 alters mucociliary differentiation and ciliary beating of human respiratory epithelial cells. J Clin Invest 2001;108:1817–24. [DOI] [PMC free article] [PubMed] [Google Scholar]
- 25.Tos M, Mogensen C. Mucus production in the nasal sinuses. Acta Otolaryngol Suppl 1979;360:131–4. [DOI] [PubMed] [Google Scholar]
- 26.Ualiyeva S, Lemire E, Aviles EC, Wong C, Boyd AA, Lai J, et al. Tuft cell-produced cysteinyl leukotrienes and IL-25 synergistically initiate lung type 2 inflammation. Sci Immunol 2021;6:eabj0474. [DOI] [PMC free article] [PubMed] [Google Scholar]
- 27.von Moltke J, O’Leary CE, Barrett NA, Kanaoka Y, Austen KF, Locksley RM. Leukotrienes provide an NFAT-dependent signal that synergizes with IL-33 to activate ILC2s. J Exp Med 2017;214:27–37. [DOI] [PMC free article] [PubMed] [Google Scholar]
- 28.Parmentier CN, Fuerst E, McDonald J, Bowen H, Lee TH, Pease JE, et al. Human T(H)2 cells respond to cysteinyl leukotrienes through selective expression of cysteinyl leukotriene receptor 1. J Allergy Clin Immunol 2012;129:1136–42. [DOI] [PubMed] [Google Scholar]
- 29.Doherty TA, Khorram N, Lund S, Mehta AK, Croft M, Broide DH. Lung type 2 innate lymphoid cells express cysteinyl leukotriene receptor 1, which regulates TH2 cytokine production. J Allergy Clin Immunol 2013;132:205–13. [DOI] [PMC free article] [PubMed] [Google Scholar]
- 30.Zaslona Z, Okunishi K, Bourdonnay E, Domingo-Gonzalez R, Moore BB, Lukacs NW, et al. Prostaglandin E(2) suppresses allergic sensitization and lung inflammation by targeting the E prostanoid 2 receptor on T cells. J Allergy Clin Immunol 2014;133:379–87. [DOI] [PMC free article] [PubMed] [Google Scholar]
- 31.Maric J, Ravindran A, Mazzurana L, Bjorklund AK, Van Acker A, Rao A, et al. Prostaglandin E2 suppresses human group 2 innate lymphoid cell function. J Allergy Clin Immunol 2018;141:1761–73.e6. [DOI] [PMC free article] [PubMed] [Google Scholar]
- 32.Goggel R, Hoffman S, Nusing R, Narumiya S, Uhlig S. Platelet-activating factor-induced pulmonary edema is partly mediated by prostaglandin E(2), E-prostanoid 3-receptors, and potassium channels. Am J Respir Crit Care Med 2002;166:657–62. [DOI] [PubMed] [Google Scholar]
- 33.Claudino RF, Kassuya CA, Ferreira J, Calixto JB. Pharmacological and molecular characterization of the mechanisms involved in prostaglandin E2-induced mouse paw edema. J Pharmacol Exp Ther 2006;318:611–8. [DOI] [PubMed] [Google Scholar]
- 34.Akaba T, Komiya K, Suzaki I, Kozaki Y, Tamaoki J, Rubin BK. Activating pros-taglandin E2 receptor subtype EP4 increases secreted mucin from airway goblet cells. Pulm Pharmacol Ther 2018;48:117–23. [DOI] [PubMed] [Google Scholar]
- 35.Nallamshetty S Selective deficiency of PGE2 inhibits goblet cell metaplasia in a murine model of asthma. J Allergy Clin Immunol 2008;121:S199. [Google Scholar]
- 36.Hattori R, Shimizu S, Majima Y, Shimizu T. Prostaglandin E2 receptor EP2, EP3, and EP4 agonists inhibit antigen-induced mucus hypersecretion in the nasal epithelium of sensitized rats. Ann Otol Rhinol Laryngol 2009;118:536–41. [DOI] [PubMed] [Google Scholar]
- 37.Delemarre T, Holtappels G, De Ruyck N, Zhang N, Nauwynck H, Bachert C, et al. Type 2 inflammation in chronic rhinosinusitis without nasal polyps: another relevant endotype. J Allergy Clin Immunol 2020;146:337–43.e6. [DOI] [PubMed] [Google Scholar]
- 38.Cooper AM. IL-17 and anti-bacterial immunity: protection versus tissue damage. Eur J Immunol 2009;39:649–52. [DOI] [PMC free article] [PubMed] [Google Scholar]
- 39.Psaltis AJ, Wormald PJ. Therapy of sinonasal microbiome in CRS: a critical approach. Curr Allergy Asthma Rep 2017;17:59. [DOI] [PubMed] [Google Scholar]
- 40.Paramasivan S, Bassiouni A, Shiffer A, Dillon MR, Cope EK, Cooksley C, et al. The international sinonasal microbiome study: a multicentre, multinational characterization of sinonasal bacterial ecology. Allergy 2020;75:2037–49. [DOI] [PubMed] [Google Scholar]
Associated Data
This section collects any data citations, data availability statements, or supplementary materials included in this article.