

Abstract
Mounting evidence suggests that air pollution influences lipid metabolism and dyslipidemia. However, the metabolic mechanisms linking air pollutant exposure and altered lipid metabolism is not established. In year 2014 – 2018, we conducted a cross-sectional study on 136 young adults in southern California, and assessed lipid profiles (triglycerides, total cholesterol, high-density lipoprotein (HDL)-cholesterol, low-density lipoprotein (LDL)-cholesterol, very-low-density lipoprotein (VLDL)-cholesterol), and untargeted serum metabolomics using liquid chromatography-high-resolution mass spectrometry, and one-month and one-year averaged exposures to NO2, O3, PM2.5 and PM10 air pollutants at residential addresses. A metabolome-wide association analysis was conducted to identify metabolomic features associated with each air pollutant. Mummichog pathway enrichment analysis was used to assess altered metabolic pathways. Principal component analysis (PCA) was further conducted to summarize 35 metabolites with confirmed chemical identity. Lastly, linear regression models were used to analyze the associations of metabolomic PC scores with each air pollutant exposure and lipid profile outcome. In total, 9309 metabolomic features were extracted, with 3275 features significantly associated with exposure to one-month or one-year averaged NO2, O3, PM2.5 and PM10 (p < 0.05). Metabolic pathways associated with air pollutants included fatty acid, steroid hormone biosynthesis, tryptophan, and tyrosine metabolism. PCA of 35 metabolites identified three main PCs which together explained 44.4% of the variance, representing free fatty acids and oxidative byproducts, amino acids and organic acids. Linear regression indicated that the free fatty acids and oxidative byproducts-related PC score was associated with air pollutant exposure and outcomes of total cholesterol and LDL-cholesterol (p < 0.05). This study suggests that exposure to NO2, O3, PM2.5 and PM10 contributes to increased level of circulating free fatty acids, likely through increased adipose lipolysis, stress hormone and response to oxidative stress pathways. These alterations were associated with dysregulation of lipid profiles and potentially could contribute to dyslipidemia and other cardiometabolic disorders.
Keywords: Air Pollution, Metabolomics, Cardiometabolic Health, Pathway Analysis, Lipolysis
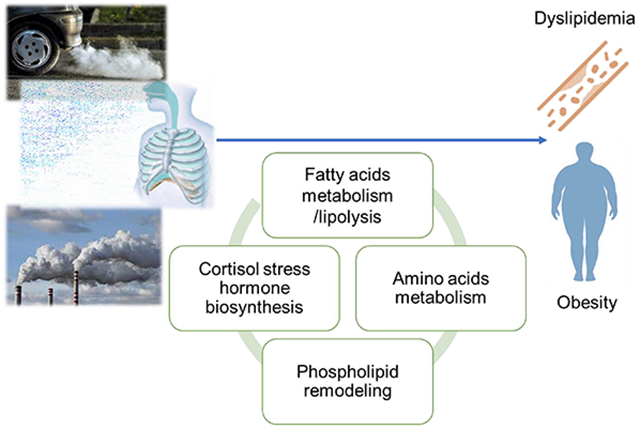
Graphical Abstract
1. Introduction
Ambient air pollutants including particulate matters (PM), ozone (O3) and nitrogen dioxide (NO2) are major environmental risk factor for human health. It is estimated that ambient particulate matter with aerodynamic diameter less than 2.5 μm (PM2.5) was responsible for near 3 million premature deaths globally in 2020 due to increased mortality in cardiovascular diseases, cancer, respiratory infection and chronic obstructive pulmonary disease (Murray et al., 2020). Apart from these diseases, air pollution also posed health risks for other metabolic disorders such as insulin resistance, type 2 diabetes (Chen et al., 2016; Strak et al., 2017), and obesity (Alderete et al., 2017; An et al., 2018; Z. Chen et al., 2019; Kim et al., 2019). Our previous work has shown that exposure to air pollutants, particularly NO2 and PM2.5, is associated with detrimental outcomes of obesity and lipid profiles (Kim et al., 2019). Specifically, we found that exposure to NO2 and PM2.5 is associated with higher levels of serum cholesterol, low-density lipoprotein (LDL)-cholesterol and lower levels of high-density lipoprotein (HDL)-cholesterol. Several other studies have investigated the air pollution exposure and blood lipid levels (Shanley et al., 2016; Wallwork et al., 2017; Yan et al., 2022; Yang et al., 2018; Yitshak Sade et al., 2016). Even though not all studies were consistent, several of these previous studies found that exposure to air pollution including PM, NO2 and SO2 was associated with adverse lipid outcomes, such as higher total cholesterol (TC), LDL-C, triglyceride (TG) and lower HDL-C. However, the pathophysiological mechanism linking air pollution exposure and dyslipidemia is not fully understood.
Untargeted high-resolution metabolomics (HRM), an advanced analytical method which can identify circulating metabolites and up to 20,000 chemical features in serum, saliva, or urine samples (Liu et al., 2016; K. H. Liu et al., 2020), has been used in recent years to link air pollution exposure and altered metabolic pathways (Breitner et al., 2016; C. Chen et al., 2019; Z. Chen et al., 2019; Jeong et al., 2018; Ladva et al., 2017; Liang et al., 2019, 2018; Liao et al., 2022; Miller et al., 2016; Mu et al., 2019; Walker et al., 2019; Yan et al., 2019). Studies have suggested that exposure to ambient air pollution and traffic-related air pollutants is associated with dysregulated metabolism of fatty acids, amino acids and leukotrienes (Z. Chen et al., 2019; Li et al., 2021; Liang et al., 2018; Miller et al., 2016; Mu et al., 2019; Walker et al., 2019). Since altered fatty acid and amino acid metabolism participate in the onset and progression of hyperlipidemia and obesity (Brook et al., 2017), we hypothesize that exposure to air pollutant in both short-term and longer-term periods could disturb metabolomic pathways of amino acids and fatty acids, potentially leading to dyslipidemia. To test this hypothesis, we leveraged an existing cohort of 136 young adults from the Meta-AIR study who had obesity or overweight history and underwent blood lipid profiling, to examine the associations of air pollutant exposure with serum untargeted metabolomics, and whether altered metabolomic pathways modulated by air pollutant exposure were associated with lipid profiles (Kim et al., 2019). To our knowledge, no study has been conducted on young adults with cardiometabolic susceptibility, to investigate air pollution exposure associations with lipid profiles and metabolomic pathway changes.
2. Methods
2.1. Study Design
Participants of this study are a subset of young adults with age 17 – 22 (mean age: 19.4 years) who were originally enrolled in Meta-AIR study between 2014 and 2018. Details of the Meta-AIR study have been reported elsewhere (Kim et al., 2019). Briefly, Meta-AIR cohort was a subset of larger southern California Children’s Health Study (CHS). The CHS recruited children from twelve communities across Southern California and followed these participants from kindergarten or first grade through high school graduation. In the Meta-AIR study, we recruited CHS participants with a history of being overweight or obese (defined as age- and sex-specific BMI percentiles over 85th compared to the CDC growth chart (Kuczmarski and Ogden, 2002) at age 16. We oversampled participants in communities with air pollution exposure at lowest and highest quartiles in the original CHS cohort. Participants with diabetes or other major illness since birth were excluded from the study. The purpose of using this recruitment procedure is to allow wide range of air pollution exposures and to leverage a group of young adults with higher cardiometabolic risk factors from larger CHS cohort. Participants completed a single clinical visit during which, extensive phenotyping of obesity and cardiometabolic outcomes were assessed. Self-reported questionnaires were used to collect sociodemographic information, general health history and lifestyle behavior. Fasting blood samples were collected during the study visit. Written informed consent were obtained from study participants, and the Institutional Review Board at the University of Southern California (USC) approved this study (IRB number: HS-13-00283). Figure S1 illustrated the participants recruitment and study flow.
2.2. Air Pollution Exposures
Air pollution exposure assessment of Meta-AIR study is based on air pollution exposure assessment on larger CHS cohort (Z. Chen et al., 2019; Eckel et al., 2016; Gauderman et al., 2015), and has been previously reported (Kim et al., 2019). In short, we estimated shorter-term (1-month) and longer-term (1-year) regional air pollutant exposure based on the geocoded residential history prior to the study visit. Air pollutant exposure was time-weighted by months across different addresses for each participant. Regional air pollutants included PM2.5, particulate matter with aerodynamic diameter less than 10 μm (PM10), ozone (O3) and nitrogen dioxide (NO2). Ambient levels of these air pollutants were obtained from ambient monitoring stations from US Environmental Protection Agency (EPA) across southern California with space 20 – 30 km apart at hourly interval (https://www.airnow.gov/). We calculated the monthly mean of PM2.5, PM10 and NO2 as well as daily 8-hour maximum O3 from hourly monitoring data from daily air pollution monitoring data using a 75% completeness criterion. We used an inverse distance-squared weighting (IDW) algorithm to interpolate air pollutants exposure from up to four monitoring stations within a 50 km radius of the participants’ residence. Our previous study of air pollution exposure on CHS cohort (Eckel et al., 2016) shown that IDW was robust to leave one out validation for monthly monitoring EPA station and performs as well as more complex models with shorter spatial-temporal coverage. Details on IDW method are provided in Supplementary Information (SI). After IDW extrapolation, 1-year air pollution exposure prior to the study visit were calculated for each participant with 75% completeness of monthly air pollution criterion. No imputation was conducted for missing air pollution exposure.
2.3. Anthropometry and Cardiometabolic Outcomes
Details on the clinical measures of anthropometric and cardiometabolic measurements have been reported previously (Kim et al., 2019). Anthropometry measures including height and weight measurements were taken at the University of Southern California Diabetes and Obesity Research Institute and Clinical Trials Unit at the study visit. Body mass index (BMI) in kg/m2 was determined using measured height and weight, and the total body fat percent was determined by dual-energy X-ray absorptiometry. Fasting blood and serum were collected at this visit. Fasting serum samples were used for measurement of lipid profiles, including triglycerides, total cholesterol, high-density lipoprotein (HDL), low-density lipoprotein (LDL) and very-low-density lipoprotein (VLDL) cholesterol, using Fujifilm Wako Diagnostic enzymatic assays. More details of the blood collection and cardiometabolic outcomes are presented in the Supplemental Materials.
2.4. High-resolution Untargeted Metabolomics
Following an established protocol (Ladva et al., 2017; K. H. Liu et al., 2020), samples were diluted and treated with acetonitrile containing 14 isotopic internal standards with a range of chemical properties before analysis. Samples then were analyzed using both reverse phase (RP) and hydrophilic interaction (HILIC) liquid chromatography mass spectrometry (LC-MS) system (Dionex Ultimate 3000, Q-Exactive HF-X Orbitrap MS, Thermo Scientific) (K. H. Liu et al., 2020; Soltow et al., 2013). Six pooled human plasma samples were added to each of the five analytical batches for quality control and reference standardization. More details about the sample preparation and process protocol were provided in the Supplementary Materials.
Each sample was analyzed in triplicate by both HILIC with positive electrospray ionization (ESI) modes and C-18 hydrophobic RP chromatography with ESI negative modes. Mass spectrometry (MS) data was acquired using apLCMS and the R package xMSanalyzer (Uppal et al., 2016), and metabolomic features were uniquely identified based on detected mass-to-charge ratio (m/z), retention time and peak intensity (Q. Liu et al., 2020). We adjusted for inter- and intra-batch variation using a random forest signal correction algorithm based on quality control samples (Luan et al., 2018). Features were excluded from analysis if they were detected in less than 75% of samples or if the coefficient of variability of the quality control samples after batch correction was greater than 30%. After LC-MS data processing, the final number of untargeted metabolomics included in analysis was 4373 for HILIC positive mode and 4938 for C-18 negative mode.
2.5. Metabolome-wide Association Study (MWAS) Analysis
Using an untargeted metabolome-wide association study (MWAS) workflow (Uppal et al., 2016), we analyzed the association between individual metabolomic feature intensity (relative abundance) and each air pollutant exposure using linear regression models. In the linear model, the dependent variable is log-transformed intensity of each metabolomic feature (represented by unique m/z and retention time), and the independent variable is one of the shorter-term or longer-term averaged air pollutant exposure (PM2.5, PM10, O3, NO2). Additionally, we controlled for confounders including age, sex, total body fat percent, cigarette smoking (whether smoked in the last week before the study visit), ethnicity (Hispanic, non-Hispanic white, other), parental education levels (less than high school, completed high school, completed college or higher), and participants residential community to control for unobserved social-economic status variables. The linear regression model is given by (Equation - 1).
| (Equation-1) |
Where indicated the log-transformed intensity of the metabolomic feature j; is the overall intercept of the model, and is the exposure to pollutant k (one of the shorter-term or longer-term air pollutants), and is to the vector of the confounders (age, sex, body fat percent, cigarette smoking, ethnicity/race, parental education and community), and is to the model residual. We used Manhattan plots (Turner, 2011) to visually display the effect size () versus the negative natural-log of p-values for the associations between each air pollutant exposure and each individual metabolomic feature. We applied Benjamini-Hochberg false discovery rate procedure (FDR) at a 10% false positive threshold to correct multiple comparisons across the MWAS analysis of 4373 HILIC positive and 4938 C-18 negative metabolic features separately (Li et al., 2021; Liang et al., 2018).
2.6. Pathway Analysis and Metabolite Chemical Annotation
We applied Mummichog pathway analysis based on significant features identified in the MWAS analysis using MetaboAnalystR package, version 3.0.3 (Li et al., 2013). The inputs of the Mummichog analysis included m/z, retention time in seconds, and significance level of the association between metabolomic feature and exposure to individual air pollutant (p-value), from the MWAS described in above section. Mummichog separated metabolomic features into two groups based on p-value in the regression based on a cut-off value as 0.05, and made putative annotations of each feature below cut-off (referred as significant list) by mapping them to the public databases including Kyoto Encyclopedia of Genes and Genomes (KEGG) (Kanehisa et al., 2021), BiGG Models (King et al., 2016) and Edinburgh Models (Ma et al., 2007) based on the m/z and retention time. We used Fisher’s Exact Test based on the Gaussian hypergeometric probability distribution to select over-represented subnetworks of metabolic pathways that can connect the metabolomic features. Significant metabolic pathways were identified as FDR of Fishers’ Exact tests’ results < 0.1. To minimize the potential for false discovery, we only included pathways with more than two annotated significant metabolomic features. In the next step, we confirmed all Mummichog annotated metabolites that are significantly associated with at least air pollutant by comparing m/z, and retention time with 467 authentic standards from chemical standards developed using the methods described previously (K. H. Liu et al., 2020). We use ± 5 parts-per-million (ppm) as tolerance of m/z, and ± 40% as the tolerance for retention time, when comparing metabolites with authentic chemical libraries, according to the Metabolomics Standards Initiative (MSI) level 1 for chemical identification (Sumner et al., 2007).
2.7. Association of Metabolites and Lipid Profiles
In this analysis, we focused on lipid outcomes that were previously found to be associated with air pollutants in the Meta-AIR study previously (Kim et al., 2019). We aimed to examine whether the annotated metabolites associated with air pollutants might contribute to the perturbations of lipid profiles including triglycerides, total cholesterol, HDL-cholesterol, LDL-cholesterol, and VLDL-cholesterol levels. Firstly, triglyceride and VLDL-cholesterol were natural log-transformed to meet the regression assumption as previously reported (Kim et al., 2019). Based on intensity data for the identity confirmed metabolites, principal components analysis (PCA) was used for dimension reduction of these metabolites, and summarized groups of metabolites into several prioritized principal components (PC) that each explained >5% variance (Z. Chen et al., 2019). Metabolites with a factor loading of an absolute value >= 0.2 were interpreted as the main contributor to a given PC. Then, PC score was computed (Bartel et al., 2013), and the associations between prioritized metabolomic PC scores and each lipid outcomes were assessed using multivariate linear regressions adjusting for the same covariates as equation - 1 (age, sex, body fat percent, cigarette smoking, ethnicity/race, parental education, and residential community). Next, we assessed associations between prioritized PC scores and individual air pollutant exposure including shorter-term (1-month) and longer-term (1-year) NO2, O3, PM2.5 and PM10. We controlled for same covariates as above analysis. Finally, we investigated whether obesity status (normal weight and overweight or obese) could modify the associations of air pollutant exposure and metabolomic PC scores by including interaction terms in the linear regression models.
3. Results
The study included 136 participants with complete data for body height and weight measures, lipid profiles, at least one of air pollutants exposure, and untargeted metabolomics data. Table 1 shows the demographic characteristics of study participants. The mean (standard deviation, SD) age of participants at the study visit was 19.4 (1.3) years, with more male (n = 76 (55.9%)) compared to female (n = 60 (44.1%)) participants. The mean (SD) BMI was 29.6 (4.7) kg/m2, and 85% (n = 116) of participants were overweight or obese. Sixty percent participants (n = 82) were Hispanic, 39 (29%) participants were non-Hispanic White, and 15 (11%) participants were of other race/ethnicity category. Table 2 listed the exposure to NO2, O3, PM2.5 and PM10 air pollutants for 1-month and 1-year prior to the study visit. Shorter-term (1-month) exposure to NO2, O3, PM2.5 and PM10 had means (SD) of 15.6 (5.1) ppb, 50.6 (14.6) ppb, 12.6 (4.4) μg/m3, and 31.3 (11.5) μg/m3, respectively. Longer-term (1-year) exposures to NO2, O3, PM2.5 and PM10 had a mean (SD) of 15.8 (3.7) ppb, 49.1 (6.3) ppb, 12.3 (2.5) μg/m3, and 31.2 (8.2) μg/m3, respectively. Figure S2 in the supplementary material shown correlations of shorter-term and longer-term exposures to regional air pollutants. Generally, O3, PM2.5 and PM10 were moderately correlated, with Pearson’s correlation coefficients of 0.32 – 0.65, and exposure to NO2 was not strongly correlated with exposure levels of other air pollutants (Pearson’s correlation < 0.3). O3 have higher temporal variability than NO2, PM2.5 and PM10 and we observed lower correlation between 1-month and 1-year O3 (Pearson’s correlation = 0.41) than other pollutants (Pearson’s correlation > 0.6).
Table 1.
Demographic information for 136 young adults from the MetaAir study.
| N = 136 | |
|---|---|
| Age in years, mean (SD) | 19.4 (1.3) |
| Sex, N(%) | |
| Male | 76 (55.9%) |
| Female | 60 (44.1%) |
| BMI in kg/m2, mean (SD) | 29.6 (4.7) |
| Total body fat percent, mean (SD) | 32.2 (9.2) |
| Race/Ethnicity, N (%) | |
| Hispanic | 82 (60.3%) |
| Non-Hispanic white | 39 (28.7%) |
| Other1 | 15 (11.0) |
| Parental Education, N (%) | |
| Less than high school | 28 (20.6%) |
| Completed high school | 17 (12.5%) |
| Some college or higher | 91 (66.9%) |
| Cigarette smoke in the last week, N (%) | |
| Yes | 8 (5.9%) |
| No | 128 (94.1%) |
Other race category included mixed races, Africa American, Native American, and Asian.
Table 2.
Levels of exposure to regional air pollutants NO2, O3, PM2.5 and PM10 for 1-month and 1-year before study visit.
| Summary | ||
|---|---|---|
| Air Pollution | Na | Mean (SD) |
| 1 month NO2 (ppb) | 117 | 15.6 (5.1) |
| 1 month O3 (ppb) | 119 | 50.6 (14.6) |
| 1 month PM2.5 (μg/m3) | 119 | 12.6 (4.4) |
| 1 month PM10 (μg/m3) | 119 | 31.3 (11.5) |
| 1 year NO2 (ppb) | 134 | 15.8 (3.7) |
| 1 year O3 (ppb) | 136 | 49.1 (6.3) |
| 1 year PM2.5 (μg/m3) | 136 | 12.3 (2.5) |
| 1 year PM10 (μg/m3) | 136 | 31.2 (8.2) |
The number (N) of participants with valid air pollution exposure, the number (N) is less than 136 due to missingness of air pollution exposure assessment.
Table 3 indicates the number of metabolomic features that were significantly associated with each air pollutant for the negative and positive LC-MS mode (raw p <0.05). Figure 1 shows the p-values of each feature for the associations with each air pollutant using Manhattan plots. Among all metabolite features, we found 2047 features were significantly associated with at least one air pollutant exposure in the negative mode, and 1228 features were significantly associated with at least one air pollutant in the positive mode. However, small number of metabolomic features were significant after FDR adjustment with FDR < 0.1 (Table 3).
Table 3.
Number of significant features associated with air pollutant by negative and positive ion mode.
| Number of features with p-value < 0.05 | Number of features with FDRa < 0.1 | |||
|---|---|---|---|---|
| Air Pollution | Negative mode | Positive mode | Negative mode | Positive mode |
| 1 month NO2 | 435 | 191 | 0 | 0 |
| 1 month O3 | 599 | 183 | 3 | 0 |
| 1 month PM2.5 | 573 | 172 | 3 | 0 |
| 1 month PM10 | 433 | 167 | 0 | 0 |
| 1 year NO2 | 589 | 163 | 0 | 0 |
| 1 year O3 | 313 | 96 | 0 | 0 |
| 1 year PM2.5 | 398 | 214 | 0 | 0 |
| 1 year PM10 | 291 | 151 | 9 | 1 |
False discovery rate (FDR) of raw p-value based on Benjamini-Hochberg adjustment
Figure 1. Manhattan plot of p-value of air pollution and metabolite features in MWAS.

Red dots indicated negative associations, blue dots indicated positive associations, grey dots indicated non-significant (raw p >= 0.05) associations.
Based on Mummichog pathway enrichment analysis, we identified 18 pathways that were significantly associated with at least one air pollution exposure (Figure 2) (pathway p-value < 0.05). These significant pathways included lipid metabolism pathways, such as C21-steroid hormone biosynthesis, fatty acid activation, linoleate metabolism, glycerophospholipid metabolism, fatty acid biosynthesis, leukotriene metabolism and prostaglandin formation from arachidonate; amino acid metabolism pathways, such as urea cycle, tryptophan metabolism, tyrosine metabolism, aspartate and asparagine metabolism, arginine and proline metabolism, glycine, serine, alanine and threonine metabolism as well as beta-alanine metabolism; and other pathways related to oxidative stress (cytochrome P450) and nucleic acid damage (pyridine metabolism). Alternations in C21-steroid hormone biosynthesis, fatty acid activation and urea cycle amino group metabolism pathways were associated with most of the air pollutants for both 1-month and 1-year averages. After FDR adjustment, we found seven pathways associated with 1-year O3 exposure with FDR < 0.1, including linoleate metabolism (FDR = 0.05), aspartate and asparagine metabolism (FDR = 0.05), glycerophospholipid metabolism (FDR = 0.06), prostaglandin formation from arachidonate (FDR = 0.06), urea cycle (FDR = 0.06), and glycine, serine, alanine and threonine metabolism (FDR = 0.06) and the cytochrome P450 pathways (FDR = 0.06).
Figure 2. Metabolic pathways associated with exposure to air pollutant.

Among all features in positive and negative modes, we confirmed chemical identity on 35 metabolomic features that were statistically significantly (p value < 0.05) associated with air pollutants, based on accurate m/z and retention time matching with chemical standards (K. H. Liu et al., 2020). These matched metabolites mostly were fatty acids and hydroxyl compounds (n = 16), followed by amino acids and derivatives (n = 6), organic acids and derivatives (n = 7) and metabolites from other categories such as nitrogen bases, vitamins, and cofactors (n = 6) (Table S1). Figure 3 illustrates the associations between air pollutants and 35 metabolites adjusting for covariates. Air pollutants exposure at 1-month and 1-year periods had predominantly positive associations with intensity of these confirmed metabolites. 1-month averaged O3, PM10, PM2.5 and 1-year averaged NO2 were associated with increased level of fatty acids (short-chain fatty acids, long-chain fatty acids and hydroxyl compounds), amino acids (lysine, phenylalanine), amino acid derivatives (epinephrine, urocanate), and organic acids and nucleic acids and their metabolites (cytosine, urate).
Figure 3. The associations between metabolomic metabolites with confirmed identities (n = 35) with shorter-term (1-month) and longer-term (1-year) air pollutants.

The association results shown as t-value from MWAS analysis, p-value < 0.05 were used as significant cut-off (*: 0.01<p<0.05, **: 0.005 < p < 0.01, ***: p < 0.005)
The PCA identified 10 principal components (PC) with eigenvalue above 1.0, and 3 PCs explained 5% or more of total variance individually and together explained a total of 44.4 of variance of 35 confirmed serum metabolites (Figure S3). PC1 explained 26.8% of the total variance and had high loading factors (>0.2) on a group of free fatty acid metabolites (e.g., palmitate, myristate, oleic acid and linoleic acid) and hydroxyl compounds (OH-FA10:0 and 25-hydroxycholesterol) (Table S2). PC2 explained 10.9% of the total variance, and had high loading factors on a group of amino acids and derivatives (e.g. phenylalanine, histidine and guanidinoacetate). PC3 explained 6.7% of the total variance, and had high negative loading factors (>0.3) on a group of organic acids and other metabolites (e.g. galactarate, 2-methylamaleate, and pyridoxamine). For the associations between each PC and lipid outcomes, only PC1 had significant negative associations with lipid profile outcomes, while other PC scores did not show significant associations (Table 4). We found that higher PC1 score (i.e. higher free fatty acids and hydroxyl compounds) was associated with lower total cholesterol (regression coefficient: −2.938, p-value: 0.021) and LDL-cholesterol (regression coefficient: −2.810, p-value: 0.009) outcomes after adjusting for covariates.
Table 4.
Associations between metabolomic principal component (PC) scores and lipid profile outcomes among 136 participants in Meta-Air study.
| Lipid profiles | PC1 | PC2 | PC3 | |||
|---|---|---|---|---|---|---|
| β | p-value | β | p-value | β | p-value | |
| Triglycerides a | 0.005 | 0.801 | 0.003 | 0.902 | −0.026 | 0.461 |
| Total cholesterol | −2.938 | 0.021* | 2.958 | 0.119 | 3.159 | 0.208 |
| HDL-cholesterol | −0.116 | 0.736 | 0.438 | 0.387 | 1.163 | 0.08 |
| LDL-cholesterol | −2.81 | 0.009* | 2.558 | 0.112 | 2.587 | 0.225 |
| VLDL-cholesterol a | 0.005 | 0.802 | 0.003 | 0.902 | −0.026 | 0.461 |
Associations reflects the change in lipid profiles measures (effect estimate β) per 1 unit change of principal component (PC) score. All associations are adjusted by covariates including age, sex, body fat percent, cigarette smoking, ethnicity/race, parental education, and community.
p < 0.05
log-transformed variables
The associations of air pollution exposure and PC scores are listed in Table S3. We found that PC1 was positively associated with 1-month exposure to O3, PM2.5 and PM10 air pollutants. Higher 1-month exposure to these air pollutants were associated with higher PC1 score (i.e. higher levels of free fatty acids and hydroxyl compounds), after adjusting for covariates (Table S3). Results from PC analysis further supported the individual association results between these fatty acids and hydroxyl compound metabolites and 1-month O3, PM2.5 and PM10 air pollution exposure (Figure 3). No significant effect modification was observed by BMI in the associations between PC1 and outcomes of lipid profiles or associations between PC1 and air pollutant exposure (all interaction p>0.05) (Table S4).
4. Discussion
In this study, we conducted a cross-sectional analysis of metabolic pathways associated with both air pollutant exposure and altered lipid profiles among 136 young adults in southern California. We found 1-month and 1-year averaged exposures to air pollutants (PM2.5, PM10, NO2 and O3) were associated with several biological pathways, mainly involving fatty acid metabolism, phospholipid metabolism, and amino acid metabolism. The findings of this study indicated that increased air pollutants are associated with increased levels of fatty acids metabolites and dysregulated lipid profile outcomes of LDL-C and total cholesterol levels, which deepened the understanding of previous findings from the Meta-Air study showing that increased air pollutants exposure is associated with increased risk of obesity (Z. Chen et al., 2019; Jerrett et al., 2010; Kim et al., 2019; McConnell Rob et al., 2015). The findings of this study indicate that air pollutant exposures may adversely affect lipid homeostasis and influence cardiometabolic health via alternations in key metabolic pathways.
Increased levels of free fatty acids in the blood have been frequently documented in obesity and can contribute to the development of insulin resistance (Guasch-Ferré et al., 2016; Mahendran et al., 2013; Palmer et al., 2015). Herein we found that in adults with overweight and obese history, exposure to air pollutants (i.e., shorter-term O3, PM10 and PM2.5 exposure as well as longer-term NO2 exposure) was associated with increased serum levels of multiple saturated, monounsaturated, and polyunsaturated fatty acids including valerate (FA 5:0), octanoate (FA 8:0), linoleic (FA 18:2), docosatetraenoic (FA 18:2), docosapentaenoic (FA 22:5), stearic (FA 18:0), oleic (FA 18:1), linolenic (FA 18:3), palmitate (FA 16:0), palmitoleic acid (FA 16:1), myristate (FA 14:0), and docosahexaenoic acids (FA 22:6). We also observed that oxidized fatty acids (OH-FA 10:0) and cholesterol (25-hydroxycholesterol) were associated with 1-month exposure to O3 and PM10 air pollutants. Furthermore, the pathway analysis also found significant enrichment of linoleate metabolism, prostaglandin formation from arachidonate, leukotriene metabolism, and cytochrome P450 pathways in associations with air pollution exposure, suggesting that air pollution exposure not only is associated with increased free fatty acid availability, but also may impact the oxidative metabolism, which could contribute to increased oxidative stress through generating lipid peroxide and triggering radical oxidation cascade. Our findings showing significant enrichment of the pathways related to the oxidation of polyunsaturated fatty acids (i.e., leukotriene metabolism, prograglandin formation, and cytochrome P450 pathways) also added to the growing body of evidence in human supporting the likely effects of air pollution on eicosanoid signaling (He et al., 2020; Lin et al., 2019; Mu et al., 2019; Wang et al., 2021). Eicosanoid signaling has been shown to play vital roles in the initiation, amplification, and resolution of tissue and systemic inflammation (Dennis and Norris, 2015).
The metabolomic signatures identified in this study could provide further mechanistic insights into the effects of air pollution on the free fatty acid availability, alternations in adipose lipolysis, further leading to disorder of lipid profiles and homeostasis. PC1 from the PCA analysis, primarily confirmed free fatty acid metabolites, showed significant negative associations with lipid profile outcomes including LDL-cholesterol and total cholesterol, and also showed significant positive associations with 1-month O3, PM2.5 and PM10 air pollutant exposure (Table S3). PC1 was further to be indicative of lipolysis by showing positive associations with absolute serum concentrations of non-esterified fatty acids and glycerol (Table S5) from a subset of participants (Z. Chen et al., 2019). Since ambient exposure to air pollutants including NO2, PM2.5, PM10 and O3 have been shown to be associated with lipid levels among this population (Kim et al., 2019), we propose the hypothesis that altered fatty acid levels, lipolysis, and systematic inflammation induced by these changes could be a possible mechanism linking air pollution with dysregulated lipid profile outcomes. There are a few explanations why altered fatty acid levels and lipolysis could contribute to the air pollution exposure on dyslipidemia outcomes. First, the enhanced adipose lipolysis may be mediated by stress hormones, since we also observed that air pollution exposure was associated with increased levels of C21-steroid hormone biosynthesis and serum levels of epinephrine in the pathway analysis, which have been previously shown to induce hormone-sensitive lipase-mediated lipolysis of adipose triglycerides into free fatty acids and glycerol through beta-adrenergic and glucocorticoid receptors (Carmen and Víctor, 2006; Papackova and Cahova, 2015; Wang et al., 2012). Second, fatty acids can also be released from cell membrane through the phospholipid hydrolysis catalyzed by phospholipase A2 (PLA2), which is upregulated upon the activation of toll-like receptor 2/4 (TLR2/4) by environmental stimuli (Qi and Shelhamer, 2005; Suram et al., 2006). Finally, air pollution may also cause excessive reactive oxygen species (ROS) formation (Gurgueira et al., 2002), which damage the cell membrane and increase the breakdown phospholipid into free fatty acids (Valko et al., 2016). In support of this hypothesis, we also identified several pathways involved in cellular membrane breakdown (e.g., glycerophospholipid metabolism) are significantly enriched with air pollution exposure. Similar associations have been observed in other metabolomics studies of air pollution (Li et al., 2021; Lu et al., 2021; Miller et al., 2016; Mu et al., 2019; Walker et al., 2019). Human observational studies found that fatty acid metabolism and lipids metabolism increased with the increase of air pollution exposure such as PM2.5, elemental carbon (EC) and ultra-fine particles (Li et al., 2021; Walker et al., 2019). Other studies using controlled air pollution exposure or natural experimental design also found fatty acids and lysolipids metabolisms also positively associated with air pollution among a 24 volunteer underwent 2-hour controlled exposure (Miller et al., 2016) or 26 population during the natural experiment of air pollution reduction during the Beijing Olympics in 2008 (Mu et al., 2019).
In addition to lipids and fatty acids metabolites, we also found enrichment in amino acid metabolism and found significant associations between air pollutant exposure and serum levels of amino acids. Specifically, we found several anti-inflammatory pathways which were enriched with air pollutant exposure, including tryptophan metabolism, glycine, serine, alanine and threonine metabolism, aspartate and asparagine metabolism, arginine and proline metabolism. Amino acids including lysine, phenylalanine and cystine have also been shown to increase with the increase of air pollution exposure in our study. These associations between air pollutant and amino acids with effects of anti-inflammation (Iyer et al., 2012; Tanaka et al., 2015; Zhou et al., 2019) indicated elevated oxidative stress and anti-inflammatory response to air pollution exposure. Similar results were also shown in observational studies of air pollution exposure and human metabolomics, that air pollutant exposure including EC, PM and traffic-related pollutant were associated with increased amino acids levels and amino acid metabolisms (Li et al., 2021; Liang et al., 2019).
Our study has some strengths. First, this in-depth cross-sectional study was based on 136 young adults with a history of overweight or obesity history from a well-characterized cohort, with detailed air pollutant exposure assessments, lipid profiles and lifestyle behavioral covariates. Our study participants were intentionally selected from larger CHS cohort, across high and low air pollution exposure and with childhood overweight or obesity history. This selection enables us to have relative larger exposure contrast on population with childhood obesity which is also a risk factor of cardiometabolic diseases in adulthood (Nadeau et al., 2011; Simmonds et al., 2016). Second, we leveraged untargeted serum metabolomics data collected at the same time of study visit, and we conducted novel investigation of metabolic pathways linking air pollutant and lipid profiles as well as PCA of individual confirmed metabolomic features. Both the pathway analysis and PCA supported that air pollutant exposure could result in dysregulated lipid metabolism through altered lipolysis, oxidative stress, and stress hormone levels. Using regression analysis of lipid profiles, we found that these alternations in adipose lipolysis could induce changes in lipid profiles and further cause dyslipidemia and cardiometabolic disorders. To our knowledge, this is the first study incorporating lipid profiles and serum untargeted metabolomics to study potential air pollution effects on cardiometabolic pathways such as adipose lipolysis.
Our study also has some limitations. First, our study is a cross-sectional study, limiting the ability to determine causality of air pollutant exposure with metabolomic changes. The proposed biological changes of lipolysis, oxidative stress, and stress hormones linking air pollution and dyslipidemia cannot be fully validated by our cross-sectional study design. Furthermore, our ambient air pollution exposures are limited to 1-month and 1-year estimates without more temporal-resolved estimates such as daily air pollution exposure. The 1-month and 1-year air pollution exposure estimates are moderately or highly correlated, we are not able to distinguish between different air pollution effects and only used single-pollutant model in the analysis. Finally, the sample size of this study is relatively small. The small sample size limited us to find strong associations between cholesterol and air pollution exposure as shown in previous report (Kim et al., 2019) and thus we did not perform mediation analysis of metabolomic features on air pollution exposure on lipid profiles. Future larger studies are warranted to verify the results of this study.
5. Conclusion
In conclusion, our study suggests that exposure to ambient air pollutant contributes to increased circulating free fatty acids levels, and these increased levels of free fatty acids could be induced by increasing stress hormones and response to oxidative stress and inflammation pathways. These alterations in metabolism and metabolic pathways in response to air pollution exposure could further lead to dysregulation of lipid profiles and potentially contribute to dyslipidemia, obesity and other cardiometabolic disorders.
Supplementary Material
Highlights.
We assessed metabolomics and air pollution in 136 adults with overweight history
Altered fatty acid and amino acid metabolism was associated with air pollution
Altered metabolism in fatty acids was associated with LDL and cholesterol
Air pollution exposure may activate stress hormone synthesis and inflammation
Acknowledgement:
This work was funded by the following agencies: Southern California Environmental Health Sciences Center from NIH NIEHS (grants 5P30ES07048 and P30ES007048), Southern California Children's Environmental Health Center from NIH NIEHS and EPA (grant P01ES022845 and RD-83544101–0), NIH NIEHS (grants R00ES027853 and R00ES027870), and the Hastings Foundation of the Keck School of Medicine of the USC.
Footnotes
Publisher's Disclaimer: This is a PDF file of an unedited manuscript that has been accepted for publication. As a service to our customers we are providing this early version of the manuscript. The manuscript will undergo copyediting, typesetting, and review of the resulting proof before it is published in its final form. Please note that during the production process errors may be discovered which could affect the content, and all legal disclaimers that apply to the journal pertain.
Declaration of interests
The authors declare that they have no known competing financial interests or personal relationships that could have appeared to influence the work reported in this paper.
Reference
- Alderete TL, Habre R, Toledo-Corral CM, Berhane K, Chen Z, Lurmann FW, Weigensberg MJ, Goran MI, Gilliland FD, 2017. Longitudinal Associations Between Ambient Air Pollution With Insulin Sensitivity, β-Cell Function, and Adiposity in Los Angeles Latino Children. Diabetes 66, 1789–1796. 10.2337/db16-1416 [DOI] [PMC free article] [PubMed] [Google Scholar]
- An R, Ji M, Yan H, Guan C, 2018. Impact of ambient air pollution on obesity: a systematic review. Int J Obes 42, 1112–1126. 10.1038/s41366-018-0089-y [DOI] [PubMed] [Google Scholar]
- Bartel J, Krumsiek J, Theis FJ, 2013. Statistical methods for the analysis of high-throughput metabolomics data. Comput Struct Biotechnol J 4, e201301009. 10.5936/csbj.201301009 [DOI] [PMC free article] [PubMed] [Google Scholar]
- Breitner S, Schneider A, Devlin RB, Ward-Caviness CK, Diaz-Sanchez D, Neas LM, Cascio WE, Peters A, Hauser ER, Shah SH, Kraus WE, 2016. Associations among plasma metabolite levels and short-term exposure to PM2.5 and ozone in a cardiac catheterization cohort. Environment International 97, 76–84. 10.1016/j.envint.2016.10.012 [DOI] [PubMed] [Google Scholar]
- Brook RD, Newby DE, Rajagopalan S, 2017. Air Pollution and Cardiometabolic Disease: An Update and Call for Clinical Trials. Am J Hypertens 31, 1–10. 10.1093/ajh/hpx109 [DOI] [PMC free article] [PubMed] [Google Scholar]
- Carmen G-Y, Víctor S-M, 2006. Signalling mechanisms regulating lipolysis. Cellular Signalling 18, 401–408. 10.1016/j.cellsig.2005.08.009 [DOI] [PubMed] [Google Scholar]
- Chen C, Li H, Niu Y, Liu C, Lin Z, Cai J, Li W, Ge W, Chen R, Kan H, 2019. Impact of short-term exposure to fine particulate matter air pollution on urinary metabolome: A randomized, double-blind, crossover trial. Environment International 130, 104878. 10.1016/j.envint.2019.05.072 [DOI] [PubMed] [Google Scholar]
- Chen Z, Newgard CB, Kim JS, IIkayeva O, Alderete TL, Thomas DC, Berhane K, Breton C, Chatzi L, Bastain TM, McConnell R, Avol E, Lurmann F, Muehlbauer MJ, Hauser ER, Gilliland FD, 2019. Near-roadway air pollution exposure and altered fatty acid oxidation among adolescents and young adults – The interplay with obesity. Environment International 130, 104935. 10.1016/j.envint.2019.104935 [DOI] [PMC free article] [PubMed] [Google Scholar]
- Chen Z, Salam MT, Toledo-Corral C, Watanabe RM, Xiang AH, Buchanan TA, Habre R, Bastain TM, Lurmann F, Wilson JP, Trigo E, Gilliland FD, 2016. Ambient Air Pollutants Have Adverse Effects on Insulin and Glucose Homeostasis in Mexican Americans. Diabetes Care 39, 547–554. 10.2337/dc15-1795 [DOI] [PMC free article] [PubMed] [Google Scholar]
- Dennis EA, Norris PC, 2015. Eicosanoid storm in infection and inflammation. Nat Rev Immunol 15, 511–523. 10.1038/nri3859 [DOI] [PMC free article] [PubMed] [Google Scholar]
- Eckel SP, Cockburn M, Shu Y-H, Deng H, Lurmann FW, Liu L, Gilliland FD, 2016. Air pollution affects lung cancer survival. Thorax 71, 891–898. 10.1136/thoraxjnl-2015-207927 [DOI] [PMC free article] [PubMed] [Google Scholar]
- Gauderman WJ, Urman R, Avol E, Berhane K, McConnell R, Rappaport E, Chang R, Lurmann F, Gilliland F, 2015. Association of Improved Air Quality with Lung Development in Children. New England Journal of Medicine; 372, 905–913. 10.1056/NEJMoa1414123 [DOI] [PMC free article] [PubMed] [Google Scholar]
- Guasch-Ferré M, Hruby A, Toledo E, Clish CB, Martínez-González MA, Salas-Salvadó J, Hu FB, 2016. Metabolomics in Prediabetes and Diabetes: A Systematic Review and Meta-analysis. Diabetes Care 39, 833–846. 10.2337/dc15-2251 [DOI] [PMC free article] [PubMed] [Google Scholar]
- Gurgueira SA, Lawrence J, Coull B, Murthy GGK, Gonz ález-F.B., 2002. Rapid increases in the steady-state concentration of reactive oxygen species in the lungs and heart after particulate air pollution inhalation. Environmental Health Perspectives 110, 749–755. 10.1289/ehp.02110749 [DOI] [PMC free article] [PubMed] [Google Scholar]
- He L, Lin Y, Wang Xiangtian, Liu X (Lucy), Wang Y, Qin J, Wang Xiaoli, Day D, Xiang J, Mo J, Zhang Y, Zhang J. (Jim), 2020. Associations of ozone exposure with urinary metabolites of arachidonic acid. Environment International 145, 106154. 10.1016/j.envint.2020.106154 [DOI] [PubMed] [Google Scholar]
- Iyer A, Fairlie DP, Brown L, 2012. Lysine acetylation in obesity, diabetes and metabolic disease. Immunology & Cell Biology 90, 39–46. 10.1038/icb.2011.99 [DOI] [PubMed] [Google Scholar]
- Jeong A, Fiorito G, Keski-Rahkonen P, Imboden M, Kiss A, Robinot N, Gmuender H, Vlaanderen J, Vermeulen R, Kyrtopoulos S, Herceg Z, Ghantous A, Lovison G, Galassi C, Ranzi A, Krogh V, Grioni S, Agnoli C, Sacerdote C, Mostafavi N, Naccarati A, Scalbert A, Vineis P, Probst-Hensch N, 2018. Perturbation of metabolic pathways mediates the association of air pollutants with asthma and cardiovascular diseases. Environment International 119, 334–345. 10.1016/j.envint.2018.06.025 [DOI] [PubMed] [Google Scholar]
- Jerrett M, McConnell R, Chang CCR, Wolch J, Reynolds K, Lurmann F, Gilliland F, Berhane K, 2010. Automobile traffic around the home and attained body mass index: A longitudinal cohort study of children aged 10–18 years. Preventive Medicine 50, S50–S58. 10.1016/j.ypmed.2009.09.026 [DOI] [PMC free article] [PubMed] [Google Scholar]
- Kanehisa M, Furumichi M, Sato Y, Ishiguro-Watanabe M, Tanabe M, 2021. KEGG: integrating viruses and cellular organisms. Nucleic Acids Research 49, D545–D551. 10.1093/nar/gkaa970 [DOI] [PMC free article] [PubMed] [Google Scholar]
- Kim JS, Chen Z, Alderete TL, Toledo-Corral C, Lurmann F, Berhane K, Gilliland FD, 2019. Associations of air pollution, obesity and cardiometabolic health in young adults: The Meta-AIR study. Environment International 133, 105180. 10.1016/j.envint.2019.105180 [DOI] [PMC free article] [PubMed] [Google Scholar]
- King ZA, Lu J, Dräger A, Miller P, Federowicz S, Lerman JA, Ebrahim A, Palsson BO, Lewis NE, 2016. BiGG Models: A platform for integrating, standardizing and sharing genome-scale models. Nucleic Acids Research 44, D515–D522. 10.1093/nar/gkv1049 [DOI] [PMC free article] [PubMed] [Google Scholar]
- Kuczmarski R, Ogden C, 2002. 2000 CDC Growth Charts for the United States: Methods and Development, Vital Health Stat. National Center for Health Statistics. [PubMed] [Google Scholar]
- Ladva CN, Golan R, Greenwald R, Yu T, Sarnat SE, Flanders WD, Uppal K, Walker DI, Tran V, Liang D, Jones DP, Sarnat JA, 2017. Metabolomic profiles of plasma, exhaled breath condensate, and saliva are correlated with potential for air toxics detection. J. Breath Res. 12, 016008. 10.1088/1752-7163/aa863c [DOI] [PMC free article] [PubMed] [Google Scholar]
- Li S, Park Y, Duraisingham S, Strobel FH, Khan N, Soltow QA, Jones DP, Pulendran B, 2013. Predicting Network Activity from High Throughput Metabolomics. PLOS Computational Biology 9, e1003123. 10.1371/journal.pcbi.1003123 [DOI] [PMC free article] [PubMed] [Google Scholar]
- Li Z, Liang D, Ye D, Chang HH, Ziegler TR, Jones DP, Ebelt ST, 2021. Application of high-resolution metabolomics to identify biological pathways perturbed by traffic-related air pollution. Environmental Research 193, 110506. 10.1016/j.envres.2020.110506 [DOI] [PMC free article] [PubMed] [Google Scholar]
- Liang D, Ladva CN, Golan R, Yu T, Walker DI, Sarnat SE, Greenwald R, Uppal K, Tran V, Jones DP, Russell AG, Sarnat JA, 2019. Perturbations of the arginine metabolome following exposures to traffic-related air pollution in a panel of commuters with and without asthma. Environment International 127, 503–513. 10.1016/j.envint.2019.04.003 [DOI] [PMC free article] [PubMed] [Google Scholar]
- Liang D, Moutinho JL, Golan R, Yu T, Ladva CN, Niedzwiecki M, Walker DI, Sarnat SE, Chang HH, Greenwald R, Jones DP, Russell AG, Sarnat JA, 2018. Use of high-resolution metabolomics for the identification of metabolic signals associated with traffic-related air pollution. Environment International 120, 145–154. 10.1016/j.envint.2018.07.044 [DOI] [PMC free article] [PubMed] [Google Scholar]
- Liao J, Gheissari R, Thomas DC, Gilliland FD, Lurmann F, Islam KT, Chen Z, 2022. Transcriptomic and metabolomic associations with exposures to air pollutants among young adults with childhood asthma history. Environmental Pollution 299, 118903. 10.1016/j.envpol.2022.118903 [DOI] [PMC free article] [PubMed] [Google Scholar]
- Lin Y, Ramanathan G, Zhu Y, Yin F, Rea ND, Lu X, Tseng C-H, Faull KF, Yoon AJ, Jerrett M, Zhu T, Qiu X, Araujo JA, 2019. Pro-Oxidative and Proinflammatory Effects After Traveling From Los Angeles to Beijing. Circulation 140, 1995–2004. 10.1161/CIRCULATIONAHA.119.042054 [DOI] [PubMed] [Google Scholar]
- Liu KH, Nellis M, Uppal K, Ma C, Tran V, Liang Y, Walker DI, Jones DP, 2020. Reference Standardization for Quantification and Harmonization of Large-Scale Metabolomics. Anal Chem 92, 8836–8844. 10.1021/acs.analchem.0c00338 [DOI] [PMC free article] [PubMed] [Google Scholar]
- Liu KH, Walker DI, Uppal K, Tran V, Rohrbeck P, Mallon TM, Jones DP, 2016. High-resolution metabolomics assessment of military personnel: Evaluating analytical strategies for chemical detection. J Occup Environ Med 58, S53–S61. 10.1097/JOM.0000000000000773 [DOI] [PMC free article] [PubMed] [Google Scholar]
- Liu Q, Walker D, Uppal K, Liu Z, Ma C, Tran V, Li S, Jones DP, Yu T, 2020. Addressing the batch effect issue for LC/MS metabolomics data in data preprocessing. Sci Rep 10, 13856. 10.1038/s41598-020-70850-0 [DOI] [PMC free article] [PubMed] [Google Scholar]
- Lu X, Lin Y, Qiu X, Liu J, Zhu T, Araujo JA, Zhang J, Zhu Y, 2021. Metabolomic Changes after Subacute Exposure to Polycyclic Aromatic Hydrocarbons: A Natural Experiment among Healthy Travelers from Los Angeles to Beijing. Environ. Sci. Technol 55, 5097–5105. 10.1021/acs.est.0c07627 [DOI] [PubMed] [Google Scholar]
- Luan H, Ji F, Chen Y, Cai Z, 2018. statTarget: A streamlined tool for signal drift correction and interpretations of quantitative mass spectrometry-based omics data. Analytica Chimica Acta 1036, 66–72. 10.1016/j.aca.2018.08.002 [DOI] [PubMed] [Google Scholar]
- Ma H, Sorokin A, Mazein A, Selkov A, Selkov E, Demin O, Goryanin I, 2007. The Edinburgh human metabolic network reconstruction and its functional analysis. Mol Syst Biol 3, 135. 10.1038/msb4100177 [DOI] [PMC free article] [PubMed] [Google Scholar]
- Mahendran Y, Cederberg H, Vangipurapu J, Kangas AJ, Soininen P, Kuusisto J, Uusitupa M, Ala-Korpela M, Laakso M, 2013. Glycerol and Fatty Acids in Serum Predict the Development of Hyperglycemia and Type 2 Diabetes in Finnish Men. Diabetes Care 36, 3732–3738. 10.2337/dc13-0800 [DOI] [PMC free article] [PubMed] [Google Scholar]
- Rob McConnell, Ernest Shen, Gilliland Frank D, Jerrett Michael, Wolch Jennifer, Chang Chih-Chieh, Lurmann Frederick, Berhane Kiros, 2015. A Longitudinal Cohort Study of Body Mass Index and Childhood Exposure to Secondhand Tobacco Smoke and Air Pollution: The Southern California Children’s Health Study. Environmental Health Perspectives 123, 360–366. 10.1289/ehp.1307031 [DOI] [PMC free article] [PubMed] [Google Scholar]
- Miller DB, Ghio AJ, Karoly ED, Bell LN, Snow SJ, Madden MC, Soukup J, Cascio WE, Gilmour MI, Kodavanti UP, 2016. Ozone Exposure Increases Circulating Stress Hormones and Lipid Metabolites in Humans. Am J Respir Crit Care Med 193, 1382–1391. 10.1164/rccm.201508-1599OC [DOI] [PMC free article] [PubMed] [Google Scholar]
- Mu L, Niu Z, Blair RH, Yu H, Browne RW, Bonner MR, Fanter T, Deng F, Swanson M, 2019. Metabolomics Profiling before, during, and after the Beijing Olympics: A Panel Study of Within-Individual Differences during Periods of High and Low Air Pollution. Environmental Health Perspectives 127, 057010. 10.1289/EHP3705 [DOI] [PMC free article] [PubMed] [Google Scholar]
- Murray CJL, Aravkin AY, Zheng P, Abbafati C, Abbas KM, Abbasi-Kangevari M, Abd-Allah F,…, Lim SS, 2020. Global burden of 87 risk factors in 204 countries and territories, 1990–2019: a systematic analysis for the Global Burden of Disease Study 2019. The Lancet 396, 1223–1249. 10.1016/S0140-6736(20)30752-2 [DOI] [PMC free article] [PubMed] [Google Scholar]
- Nadeau KJ, Maahs DM, Daniels SR, Eckel RH, 2011. Childhood obesity and cardiovascular disease: links and prevention strategies. Nat Rev Cardiol 8, 513–525. 10.1038/nrcardio.2011.86 [DOI] [PMC free article] [PubMed] [Google Scholar]
- Palmer ND, Stevens RD, Antinozzi PA, Anderson A, Bergman RN, Wagenknecht LE, Newgard CB, Bowden DW, 2015. Metabolomic Profile Associated With Insulin Resistance and Conversion to Diabetes in the Insulin Resistance Atherosclerosis Study. The Journal of Clinical Endocrinology & Metabolism 100, E463–E468. 10.1210/jc.2014-2357 [DOI] [PMC free article] [PubMed] [Google Scholar]
- Papackova Z, Cahova M, 2015. Fatty Acid Signaling: The New Function of Intracellular Lipases. International Journal of Molecular Sciences 16, 3831–3855. 10.3390/ijms16023831 [DOI] [PMC free article] [PubMed] [Google Scholar]
- Qi H-Y, Shelhamer JH, 2005. Toll-like Receptor 4 Signaling Regulates Cytosolic Phospholipase A2 Activation and Lipid Generation in Lipopolysaccharide-stimulated Macrophages *. Journal of Biological Chemistry 280, 38969–38975. 10.1074/jbc.M509352200 [DOI] [PubMed] [Google Scholar]
- Shanley RP, Hayes RB, Cromar KR, Ito K, Gordon T, Ahn J, 2016. Particulate Air Pollution and Clinical Cardiovascular Disease Risk Factors. Epidemiology 27, 291–298. 10.1097/EDE.0000000000000426 [DOI] [PMC free article] [PubMed] [Google Scholar]
- Simmonds M, Llewellyn A, Owen CG, Woolacott N, 2016. Predicting adult obesity from childhood obesity: a systematic review and meta-analysis. Obesity Reviews 17, 95–107. 10.1111/obr.12334 [DOI] [PubMed] [Google Scholar]
- Soltow QA, Strobel FH, Mansfield KG, Wachtman L, Park Y, Jones DP, 2013. High-performance metabolic profiling with dual chromatography-Fourier-transform mass spectrometry (DC-FTMS) for study of the exposome. Metabolomics 9, 132–143. 10.1007/s11306-011-0332-1 [DOI] [PMC free article] [PubMed] [Google Scholar]
- Strak M, Janssen N, Beelen R, Schmitz O, Vaartjes I, Karssenberg D, van den Brink C, Bots ML, Dijst M, Brunekreef B, Hoek G, 2017. Long-term exposure to particulate matter, NO2 and the oxidative potential of particulates and diabetes prevalence in a large national health survey. Environ Int 108, 228–236. 10.1016/j.envint.2017.08.017 [DOI] [PubMed] [Google Scholar]
- Sumner LW, Amberg A, Barrett D, Beale MH, Beger R, Daykin CA, Fan TW-M, Fiehn O, Goodacre R, Griffin JL, Hankemeier T, Hardy N, Harnly J, Higashi R, Kopka J, Lane AN, Lindon JC, Marriott P, Nicholls AW, Reily MD, Thaden JJ, Viant MR, 2007. Proposed minimum reporting standards for chemical analysis Chemical Analysis Working Group (CAWG) Metabolomics Standards Initiative (MSI). Metabolomics 3, 211–221. 10.1007/s11306-007-0082-2 [DOI] [PMC free article] [PubMed] [Google Scholar]
- Suram S, Brown GD, Ghosh M, Gordon S, Loper R, Taylor PR, Akira S, Uematsu S, Williams DL, Leslie CC, 2006. Regulation of cytosolic phospholipase A2 activation and cyclooxygenase 2 expression in macrophages by the beta-glucan receptor. J Biol Chem 281, 5506–5514. 10.1074/jbc.M509824200 [DOI] [PubMed] [Google Scholar]
- Tanaka KAK, Kurihara S, Shibakusa T, Chiba Y, Mikami T, 2015. Cystine improves survival rates in a LPS-induced sepsis mouse model. Clinical Nutrition 34, 1159–1165. 10.1016/j.clnu.2014.11.014 [DOI] [PubMed] [Google Scholar]
- Turner S, 2011. Annotated Manhattan plots and QQ plots for GWAS using R, Revisited. Nature Precedings 1–1. [Google Scholar]
- Uppal K, Walker DI, Liu K, Li S, Go Y-M, Jones DP, 2016. Computational Metabolomics: A Framework for the Million Metabolome. Chem. Res. Toxicol 29, 1956–1975. 10.1021/acs.chemrestox.6b00179 [DOI] [PMC free article] [PubMed] [Google Scholar]
- Valko M, Jomova K, Rhodes CJ, Kuča K, Musílek K, 2016. Redox- and non-redox-metal-induced formation of free radicals and their role in human disease. Arch Toxicol 90, 1–37. 10.1007/s00204-015-1579-5 [DOI] [PubMed] [Google Scholar]
- Walker DI, Lane KJ, Liu K, Uppal K, Patton AP, Durant JL, Jones DP, Brugge D, Pennell KD, 2019. Metabolomic assessment of exposure to near-highway ultrafine particles. J Expo Sci Environ Epidemiol 29, 469–483. 10.1038/s41370-018-0102-5 [DOI] [PMC free article] [PubMed] [Google Scholar]
- Wallwork RS, Colicino E, Zhong J, Kloog I, Coull BA, Vokonas P, Schwartz JD, Baccarelli AA, 2017. Ambient Fine Particulate Matter, Outdoor Temperature, and Risk of Metabolic Syndrome. American Journal of Epidemiology 185, 30–39. 10.1093/aje/kww157 [DOI] [PMC free article] [PubMed] [Google Scholar]
- Wang J-C, Gray NE, Kuo T, Harris CA, 2012. Regulation of triglyceride metabolism by glucocorticoid receptor. Cell Biosci 2, 19. 10.1186/2045-3701-2-19 [DOI] [PMC free article] [PubMed] [Google Scholar]
- Wang T, Han Y, Li H, Wang Y, Xue T, Chen X, Chen W, Fan Y, Qiu X, Gong J, Xu Y, Wang J, Li W, Zhu T, 2021. Changes in bioactive lipid mediators in response to short-term exposure to ambient air particulate matter: A targeted lipidomic analysis of oxylipin signaling pathways. Environment International 147, 106314. 10.1016/j.envint.2020.106314 [DOI] [PubMed] [Google Scholar]
- Yan L, Pang Y, Wang Z, Luo H, Han Y, Ma S, Li L, Yuan J, Niu Y, Zhang R, 2022. Abnormal fasting blood glucose enhances the risk of long-term exposure to air pollution on dyslipidemia: A cross-sectional study. Ecotoxicology and Environmental Safety 237, 113537. 10.1016/j.ecoenv.2022.113537 [DOI] [PubMed] [Google Scholar]
- Yan Q, Liew Z, Uppal K, Cui X, Ling C, Heck JE, von Ehrenstein OS, Wu J, Walker DI, Jones DP, Ritz B, 2019. Maternal serum metabolome and traffic-related air pollution exposure in pregnancy. Environment International 130, 104872. 10.1016/j.envint.2019.05.066 [DOI] [PMC free article] [PubMed] [Google Scholar]
- Yang B-Y, Bloom MS, Markevych I, Qian Z. (Min), Vaughn MG, Cummings-Vaughn LA, Li S, Chen G, Bowatte G, Perret JL, Dharmage SC, Heinrich J, Yim SH-L, Lin S, Tian L, Yang M, Liu K-K, Zeng X-W, Hu L-W, Guo Y, Dong G-H, 2018. Exposure to ambient air pollution and blood lipids in adults: The 33 Communities Chinese Health Study. Environment International 119, 485–492. 10.1016/j.envint.2018.07.016 [DOI] [PubMed] [Google Scholar]
- Yitshak Sade M, Kloog I, Liberty IF, Schwartz J, Novack V, 2016. The Association Between Air Pollution Exposure and Glucose and Lipids Levels. J Clin Endocrinol Metab 101, 2460–7. 10.1210/jc.2016-1378 [DOI] [PubMed] [Google Scholar]
- Zhou J, Yao N, Wang S, An D, Cao K, Wei J, Li N, Zhao D, Wang L, Chen X, Lu Y, 2019. Fructus Gardeniae-induced gastrointestinal injury was associated with the inflammatory response mediated by the disturbance of vitamin B6, phenylalanine, arachidonic acid, taurine and hypotaurine metabolism. Journal of Ethnopharmacology 235, 47–55. 10.1016/j.jep.2019.01.041 [DOI] [PubMed] [Google Scholar]
Associated Data
This section collects any data citations, data availability statements, or supplementary materials included in this article.