Abstract
Shape analysis is an important and powerful tool in a wide variety of medical applications. Many shape analysis techniques require shape representations which are in correspondence. Unfortunately, popular techniques for generating shape representations do not handle objects with complex geometry or topology well, and those that do are not typically readily available for non-expert users. We describe a method for generating correspondences across a population of objects using a given template. We also describe its implementation and distribution via SlicerSALT, an open-source platform for making powerful shape analysis techniques more widely available and usable. Finally, we show results of this implementation on mouse femur data.
Keywords: Complex Geometry, Non-Spherical Topology, Open Source Software, Diffeomorphic Shape Registration, Statistical Shape Modeling
1. INTRODUCTION
In many biomedical applications, the study of the shape of anatomical objects has been shown to be more powerful than analyzing more simple measures such as volume. Shape-based features are widely used in problems such as segmentation, registration, classification, and diagnosis. Studying how the shape of objects differs across a population, such as between healthy and diseased organs, or over time, such as during growth, ageing, or disease progression, can offer valuable insights into the cause of a disease, its effects, or possible treatment.
Generally, the first step in a shape analysis workflow is to create a representation of an object, most often as a set of points on its boundary. Many analysis techniques require these representations to be in correspondence: each representation should have the same number of points, and if a point is at a particular anatomical landmark in one object in the population, that point should be as close as possible to that landmark in other members of the population as well. Having representations which are not in correspondence add noise to the data and can cause errors in the analysis. Common techniques for creating shape representations, such as SPHARM-PDM, attempt to create models that already have inherent correspondence. For objects with simple topologies this often works well. However, for objects with more complicated geometries or topologies, other approaches are required. A variety of techniques have been developed to address this problem, but many of them do not have implementations that are available for wide use and come with groups of associated tools for analyzing the resulting representations. This mostly restricts their use to the labs in which they are developed instead of the wider community of shape researchers.
Slicer Shape AnaLysis Toolbox (SlicerSALT)1 is an open-source platform for the dissemination of powerful shape modeling and analysis methodologies. The goal of SlicerSALT is to bridge the gap between methodology researchers and the clinical researchers who want to put these methods to use. It has methods for creating boundary and skeletal shape representations as well as performing a variety of analyses such as principal component analysis, hypothesis testing, and regression.
In this paper we describe a new SlicerSALT module for creating corresponding representations of objects with complex geometry or non-spherical topology. It takes a mesh of a representative object as a template and matches this template to other objects of the population via registration to create correspondence. We describe the implementation of this method and demonstrate its effectiveness on mouse femur dataset.
2. MATERIALS
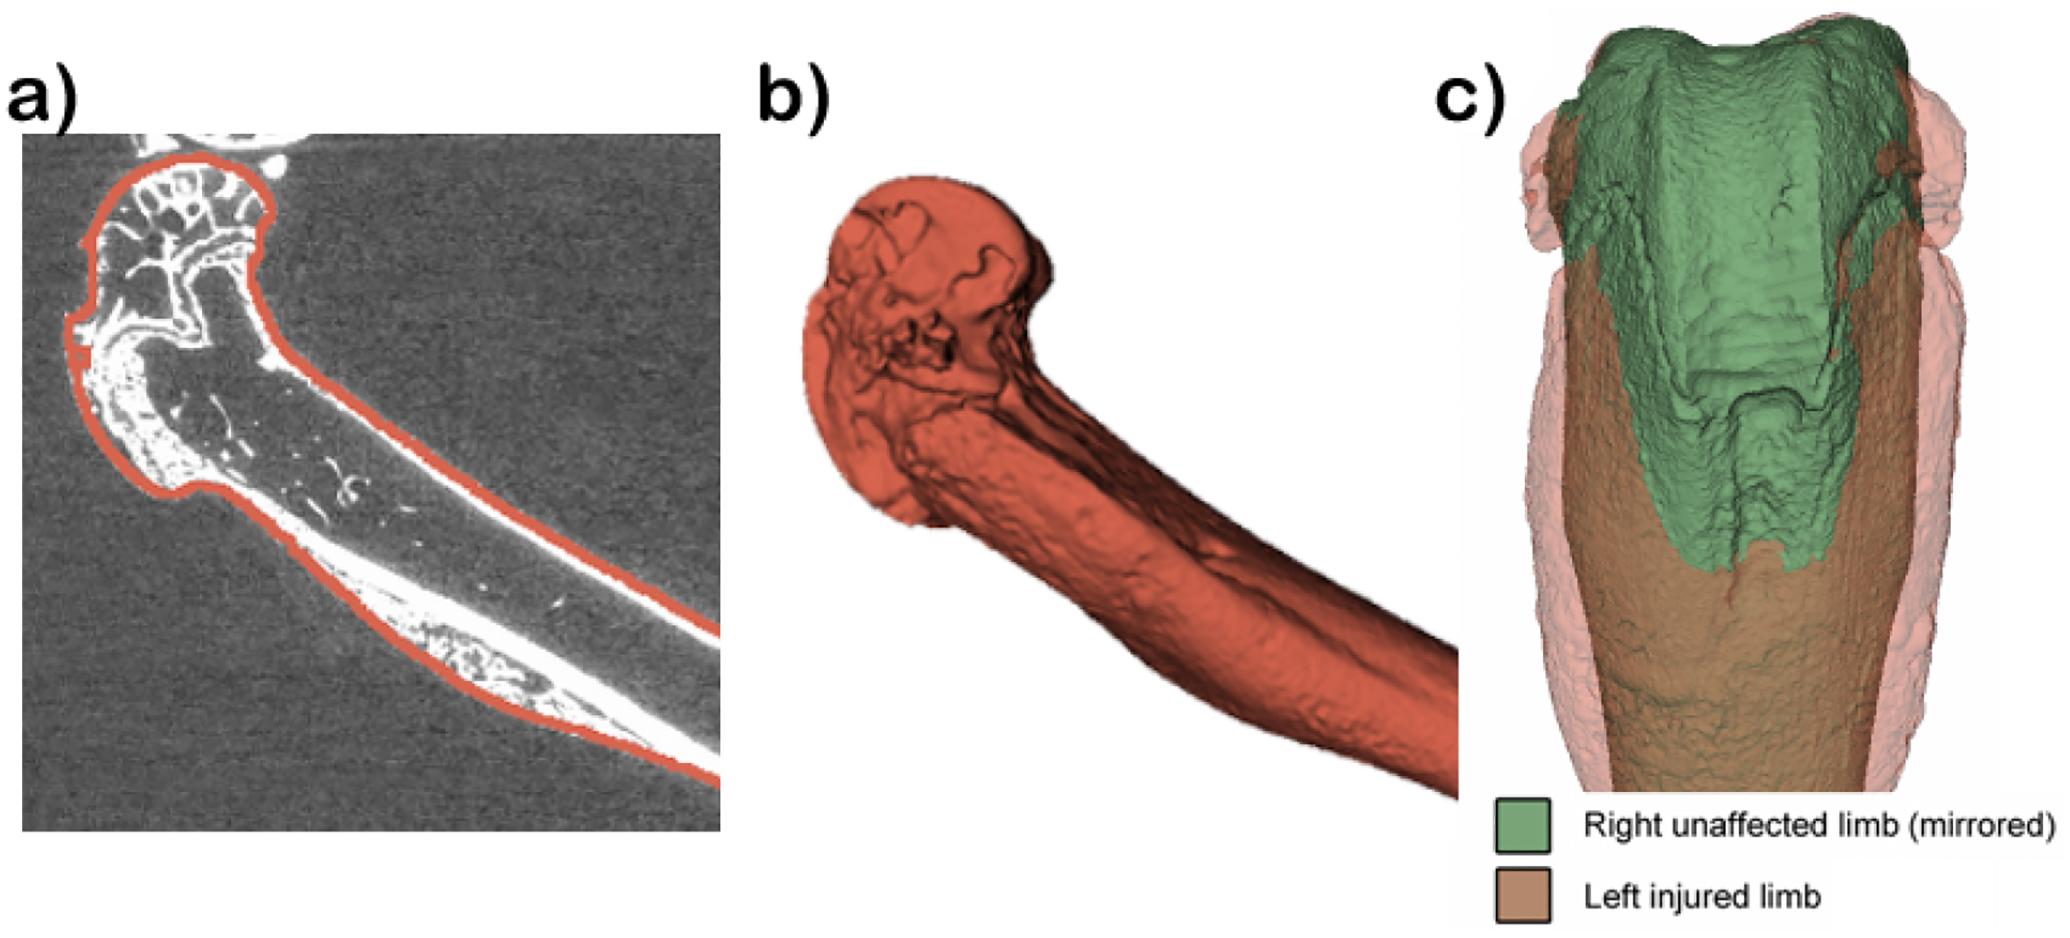
We test our approach using a collection of 24 femur head meshes from twenty-two week old skeletally mature genetically modified male mice, as seen in figure 1. In healthy individuals, the F8 gene provides instructions for making the protein coagulation factor VIII. Coagulation factors are a group of related proteins essential for the formation of blood clots. After injury, clots protect the body by sealing off damaged blood vessels and preventing further blood loss. Gene knockout (FVIII−/−) mice were used as a model for hemophilia in this study. These knockout mice have a pathogenic pathway that is similar to hemophilia, and they present bleeding-induced bone and joint damage.
Figure 1.

Geometries of mouse femurs obtained from microCT: a) MicroCT scan, b) femur geometry, c) Right vs Mirrored Left femurs.
Each mouse was subjected to knee joint hemorrhage in the left limb by puncturing the joint capsule with a needle. The right limb served as the uninjured control.2 Two weeks after injury simulation, the mice were euthanized. During the injury period, hemorrhage caused bone deterioration that we quantitatively characterized with the proposed methods. Hind limbs were scanned at 10μm resolution using microCT (μCT80; Scanco Medical AG, Brüttisellen, Switzerland). As a proof of concept, we will use the meshes generated by our approach to classify healthy from injured femurs.
While this data has spherical topology, due to the complicated geometry at the head of the femur, meshes created using SPHARM-PDM do not have good correspondence. Instead, a template mesh was created directly from the segmented image volume, after running marching cubes. Due to the high resolution of these volumes, we had to simplify the template mesh using progressive decimation3 and smoothing.
3. METHODS
Here we describe the algorithm we use to generate corresponding meshes, classify them and describe the software implementation in SlicerSALT.
3.1. Registration-based Approach
To generate corresponding meshes based on a template object, we take a similar approach as that described in.4 We use the Insight Toolkit’s (ITK)5 registration framework with the option of either a B-spline or diffeomorphic demons6 registration to register the template to each of the target objects. In our experience the use of a method yielding diffeomorphic transforms can reduce the occurrence of undesired changes to the template mesh such as large stretching or self-intersection that tend to occur more frequently with B-spline-based methods. We first create level-set representations of the template and target meshes by computing distance functions of each object. The template distance function is then registered to the target using the diffeomorphic demons registration algorithm. The resulting transform is then applied to the original template mesh, yielding a mesh that conforms to the target object’s boundary but is in correspondence with the template and, therefore, the rest of the population computed in this manner.
3.2. Statistical analysis
Classifying these meshes falls within the realm of high-dimension, low-sample-size statistics, with each of the 24 3D geometries represented as a single vector of dimension 12006. As such we choose to use distance-weighted discrimination (DWD)7 as our classification method and validated the results with direction-projection-permutation (DiProPerm) hypothesis tests.
DWD was developed as an alternative binary linear classifier to support vector machines (SVM). DWD is designed to avoid common pitfalls such as data piling which can prevent generalization when using SVM in high-dimension, low-sample-size cases. The motivation was to take more information into account when determining the separating hyperplane than just a small number of support vectors. The hyperplane, determined by a vector w and scalar β, is found by solving a second-order cone program of the form given in the equation below, where each xi is a d-dimensional observation and yi is the class label of xi (+1 or −1).
The ri represent the residuals from each data point to the hyperplane, so by minimizing the sum of reciprocals we maximize their distance to the hyperplane with more weight placed on points closer to the boundary. ξ is an error vector, penalized by a constant C in the objective, which allows for some data points to fall on the wrong side of the hyperplane if necessary.
DiProPerm8 is a permutation-based hypothesis test that assesses the chance that the observed degree of separation happened as a result of expected random variation. It was developed with DWD in mind as an area of application, but it represents a general framework of non-parametric hypothesis testing built to discern typical and atypical behavior in high-dimensional settings. To conduct the test, we randomly shuffle the class data labels and project the data onto the DWD direction determined by the two new classes. We record the mean difference and repeat the process 1000 times to create an empirical distribution of mean differences. The p-value of the test is the percent of the empirical distribution larger than the mean difference between the original classes.
3.3. Software Implementation
Our registration method is implemented as a 3D Slicer extension. This extension is packaged by default with SlicerSALT as of version 3.0 but is also available for installation via the 3D Slicer extension manager. The code is available at https://github.com/slicersalt/RegistrationBasedCorrespondence. Part of the motivation for the differences in our approach compared with that in4 is the availability of 3D Slicer and ITK on all common platforms. Several other libraries for performing registration, such as Deformetrica9 used for the diffeomorphic registrations in our previous work,4 are not available on all operating systems, with Windows being the most often unsupported system. Because one aim of SlicerSALT is to be fully cross-platform to reach the broadest base of users, we reimplemented the registration using ITK instead of the approach originally described.
4. RESULTS
4.1. Shape representation
To demonstrate the effectiveness of our methods we use the set of 24 mouse femurs described in section 2. First, we evaluate the effectiveness of our registrations by comparing our estimated meshes to the target meshes. Table 1 shows the mean and maximum distances for each of the 24 tested cases.
Table 1.
Mean and Maximum distances between original and warped templates.
| Case | Mean (mm) | Maximum (mm) | 95th Perc. (mm) |
|---|---|---|---|
| 901-L | 0.002 | 0.056 | 0.022 |
| 901-R | 0.002 | 0.064 | 0.026 |
| 902-L | 0.004 | 0.099 | 0.042 |
| 902-R | 0.002 | 0.07 | 0.029 |
| 906-L | 0.002 | 0.088 | 0.027 |
| 906-R | 0.001 | 0.071 | 0.024 |
| 907-L | 0.005 | 0.175 | 0.038 |
| 907-R | 0.002 | 0.073 | 0.027 |
| 908-L | 0.004 | 0.102 | 0.039 |
| 908-R | 0.002 | 0.061 | 0.024 |
| 915-L | 0.004 | 0.1 | 0.04 |
| 915-R | 0.001 | 0.073 | 0.026 |
| 916-L | 0.003 | 0.149 | 0.033 |
| 916-R | 0.003 | 0.161 | 0.034 |
| 917-L | 0.004 | 0.122 | 0.041 |
| 917-R | 0.001 | 0.064 | 0.026 |
| 918-L | 0.005 | 0.176 | 0.057 |
| 918-R | 0.002 | 0.102 | 0.039 |
| F9-3wk-02-L | 0.003 | 0.086 | 0.034 |
| F9-3wk-02-R | 0.002 | 0.082 | 0.032 |
| F9-8wk-01-L | 0.005 | 0.197 | 0.043 |
| F9-8wk-01-R | 0.002 | 0.098 | 0.031 |
| F9-8wk-02-L | 0.003 | 0.092 | 0.042 |
| F9-8wk-02-R | 0.005 | 0.096 | 0.042 |
| Mean | 0.002875 | 0.102375 | 0.034083333 |
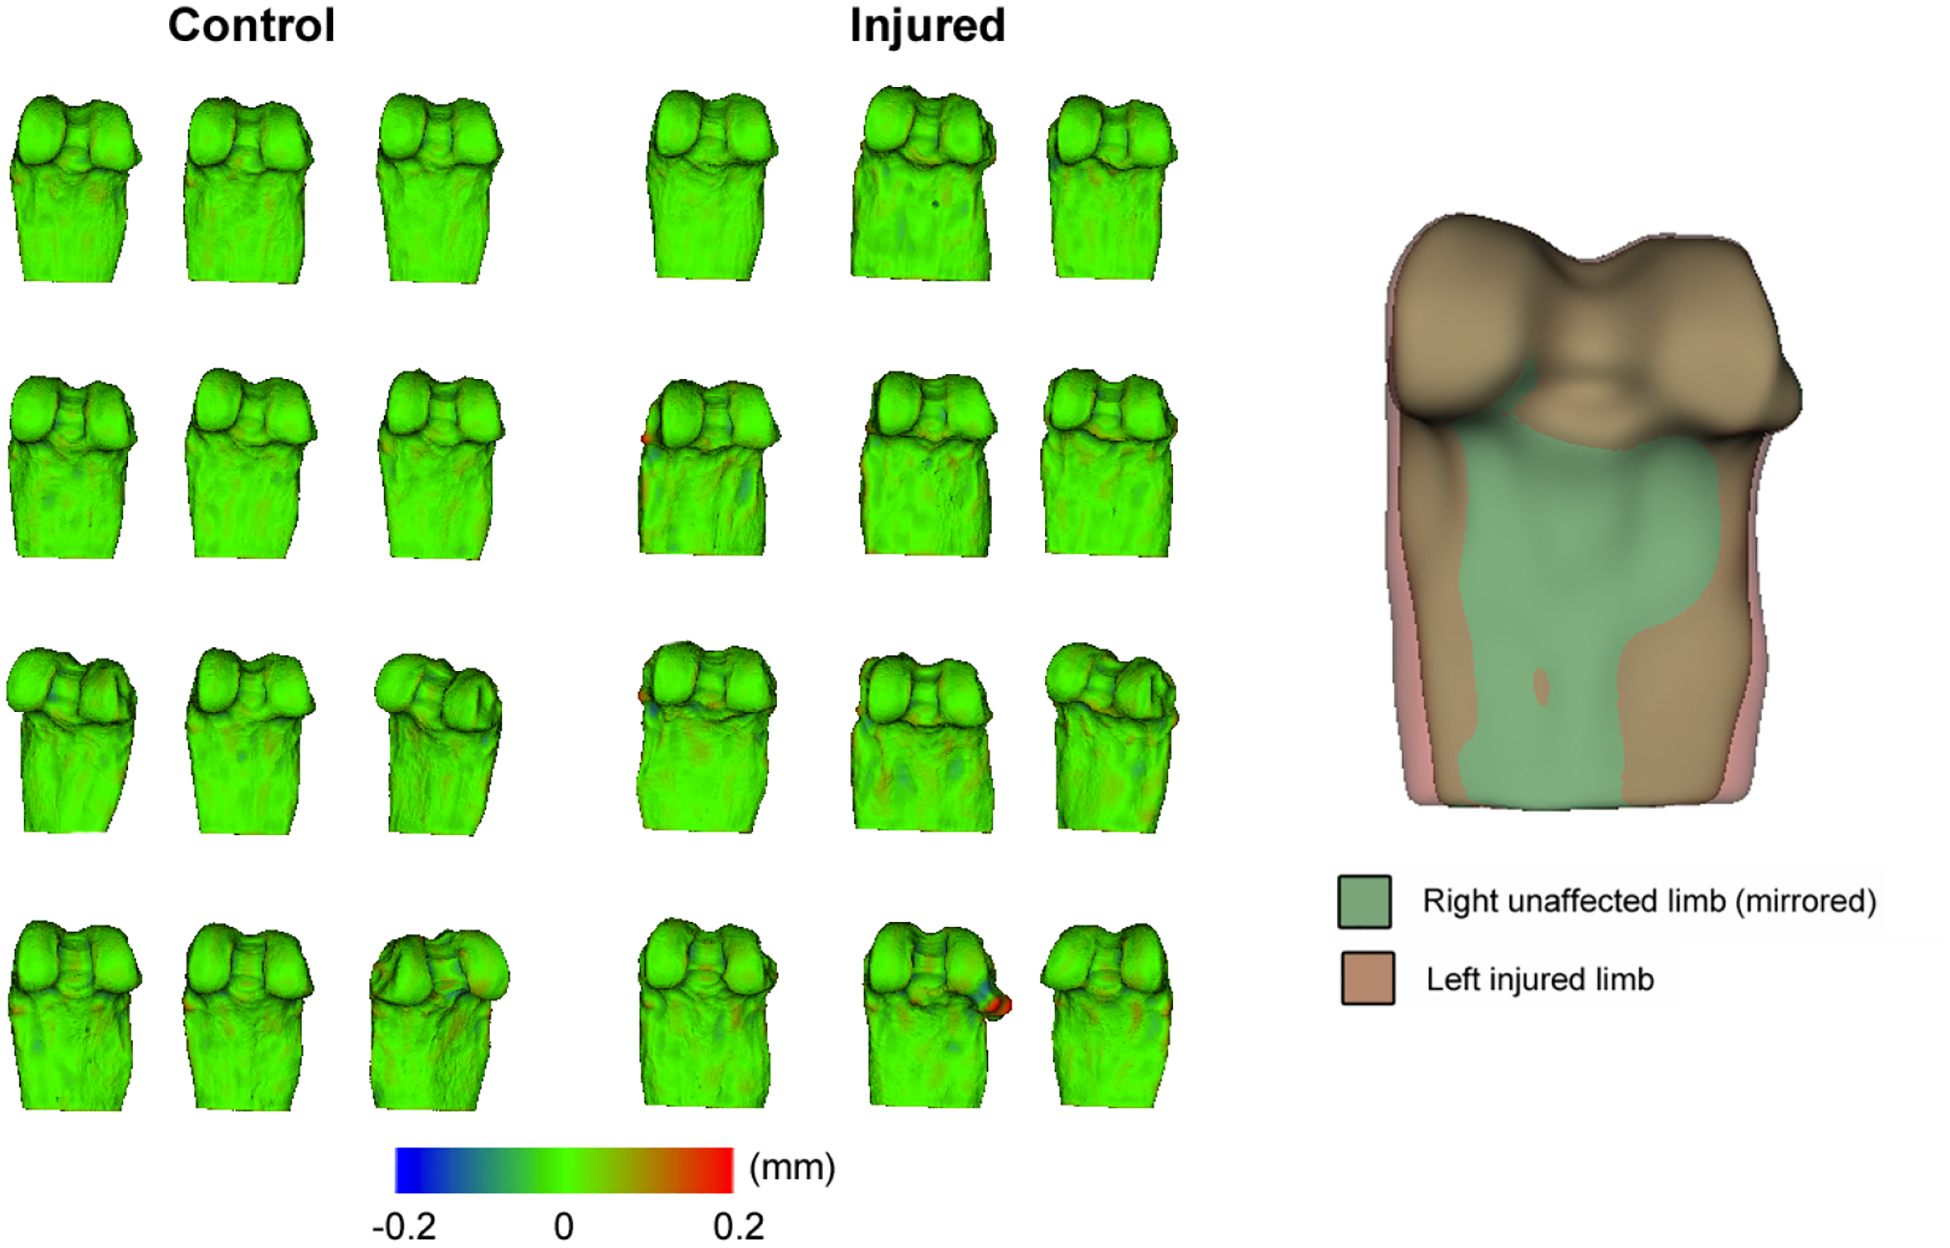
As we can see, both the mean and 95th percentile differences are quite small, showing good registration accuracy. The mean distance is close to sub-voxel accuracy. Figure 2 shows the meshes colored by distance to closest point on the original surface.
Figure 2.

Left: Meshes resulting from our registrations colored by distance to original mesh. As can be seen, the distance is typically close to 0. Right: An example injured and uninjured pair from the mean shapes for each group.
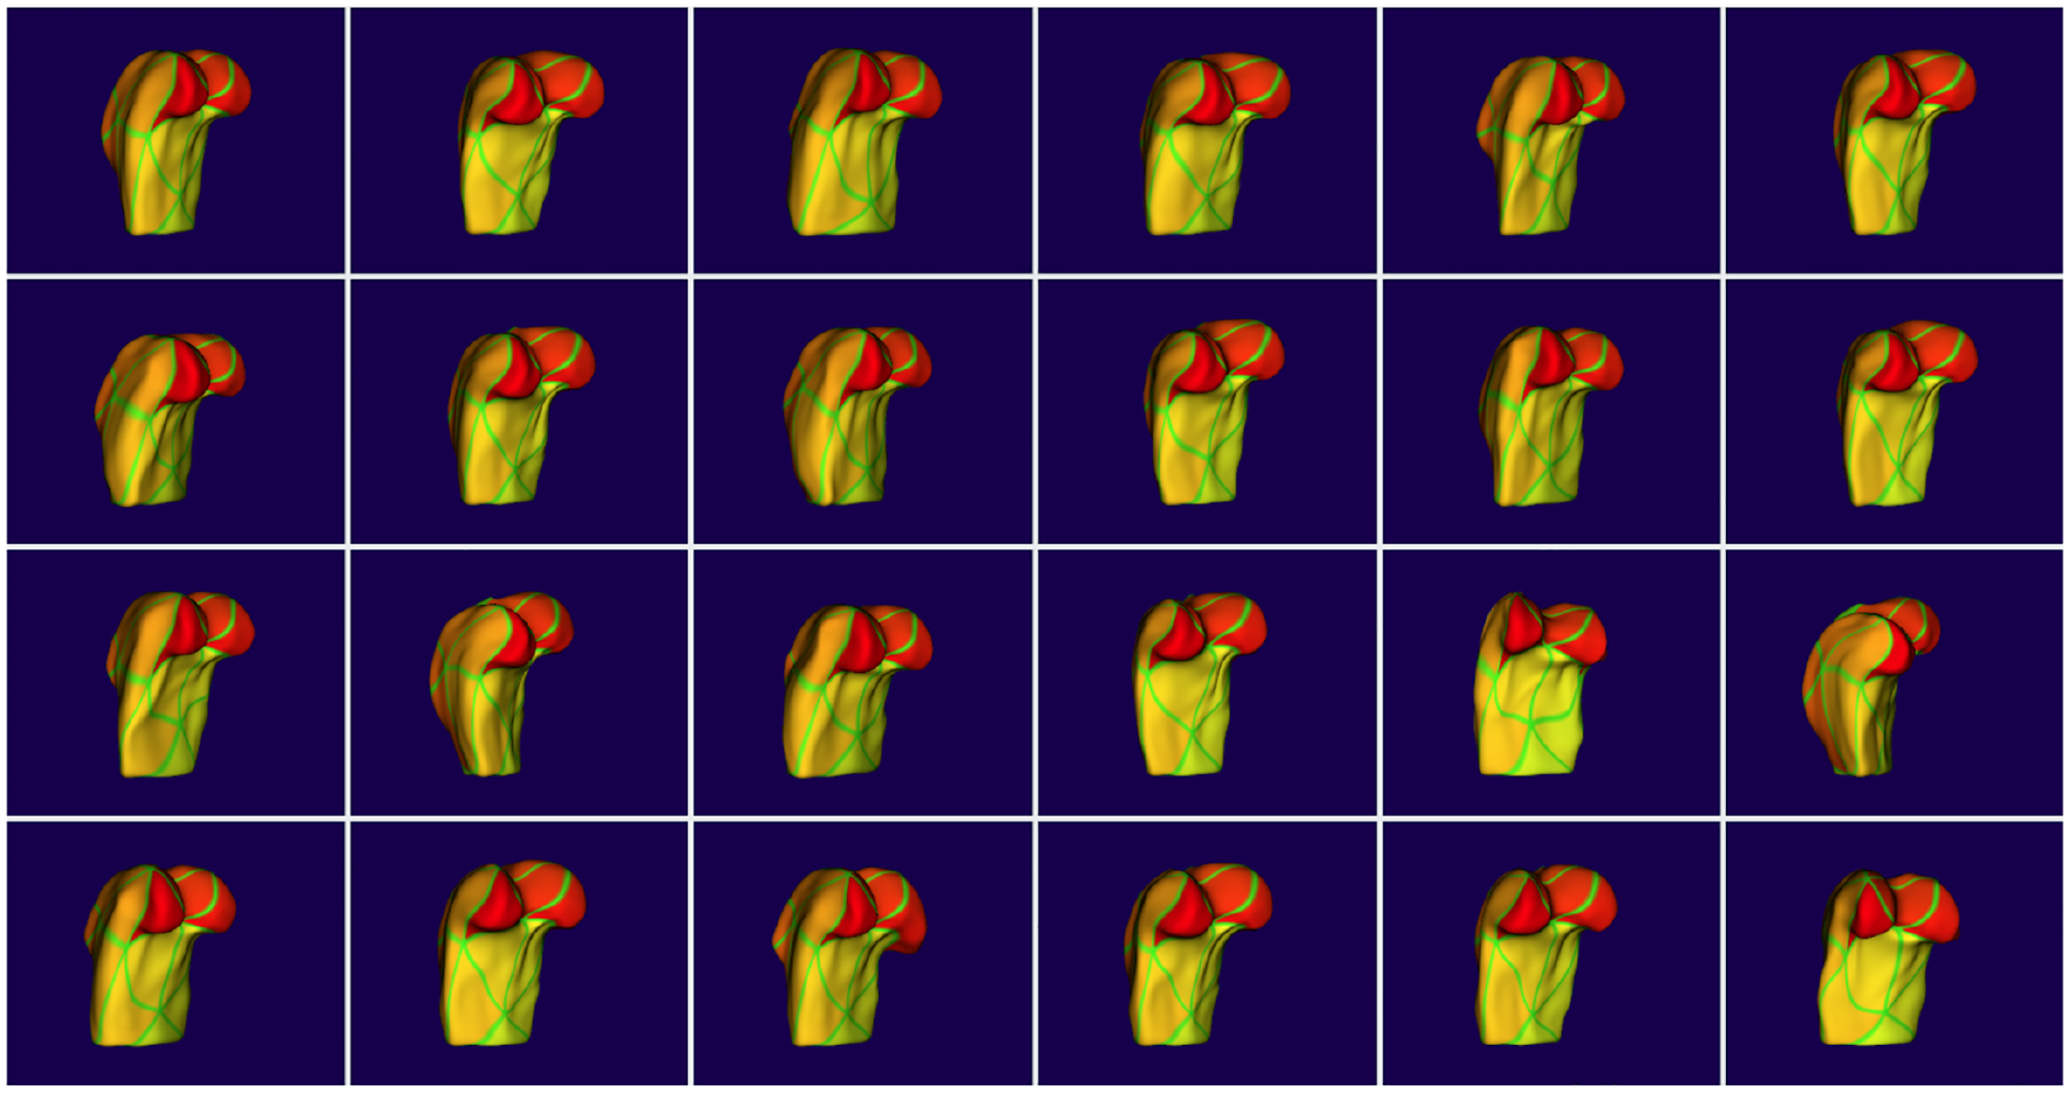
These results show that our registered meshes are close to the original surfaces but not that the resulting correspondences are good. Figure 3 shows the estimated correspondences for the 24 mouse femurs by mapping the color of each point on the mesh to its index. Consistent color in corresponding regions across the population shows good correspondence.
Figure 3.

The resulting correspondent meshes colored by point order. The consistency of the colors across cases shows that the meshes are in good correspondence.
4.2. Classification
Each data object is a mesh of a three-dimensional scan of a femur. In total there are 24 observations in the data set: 12 femur maps in the control group and 12 maps in the experimental group. Each mesh has 4002 vertices, so for each observation we have 12006 features as each vertex has three coordinates.
As described in section 3.2, we use Distance-Weighted Discrimination (DWD), a method designed specifically for use in high-dimension, low-sample-size scenarios such as this one, for classification. As shown in figure 4, DWD is able to separate these classes reasonably well. A notable aberration in the separation is a single left femur (red plus), F9-8wk-02-L, bunching up with the cohort of right femurs (blue circles).
Figure 4.

Left: Cases projected onto the DWD separating direction showing good separation aside from one point. Right: The Z-score of the actual mean difference plotted against all mean differences resulting from DiProPerm.
To test the classification for statistical significance, we perform a direction-projection-permutation (DiProPerm) hypothesis test on the data. For 1000 replications, we randomly reshuffle the class labels and refit DWD. We then compare the mean difference between the actual classes against the empirical null distribution of mean differences calculated from each replication. The results, shown in figure 4, show that while the actual mean is reasonably far from the mean of the null distribution (Z-score of 1.2708) it does not meet the typical p < 0.05 threshold for significance, likely due to low sample size (12 cases per class).
5. CONCLUSION
In this paper, we introduced a method and implementation for using registration to produce corresponding meshes for a population of objects based on a given template model. This is an important step in being able to use many shape analysis techniques on objects with complex geometry. Our method’s source code is available and our method is packaged in SlicerSALT as well as available to install as an extension in 3D Slicer. There are several routes for future improvement for this module, the most important of which would be to add the option to create a data-driven template by using a groupwise registration to bring all objects into a common coordinate system and then create a mesh from this common model.
In addition to the SlicerSALT module for generating correspondences, we are also creating a module to enable users to easily apply DWD, along with more traditional classifiers such as SVM and random forests, to their data.
ACKNOWLEDGMENTS
Supported by The National Institutes of Health, National Institute of Biomedical Imaging and Bioengineering (NIBIB), project R01EB021391 (PI. Paniagua), and National Institute of Arthritis and Musculoskeletal and Skin Diseases (NIAMS) 1R44AR074375 (PI. McCormick). We thank Dr. Jacque Cole and her team for aiding with data collection for the testing of our methods.
REFERENCES
- [1].Vicory J, Pascal L, Hernandez P, Fishbaugh J, Prieto J, Mostapha M, Huang C, Shah H, Hong J, Liu Z, Michoud L, Fillion-Robin J-C, Gerig G, Zhu H, Pizer SM, Styner M, and Paniagua B, “SlicerSALT: Shape AnaLysis Toolbox,” in [Shape in Medical Imaging : International Workshop, ShapeMI 2018, held in conjunction with MICCAI 2018, Granada, Spain, September 20, 2018, Proceedings. International Workshop on Shape in Medical Imaging (2018 : Granada, Spain)], 11167, 65–72, Springer, Cham; (sep 2018). [DOI] [PMC free article] [PubMed] [Google Scholar]
- [2].Lau AG, Sun J, Hannah WB, Livingston EW, Heymann D, Bateman TA, and Monahan PE, “Joint bleeding in factor VIII deficient mice causes an acute loss of trabecular bone and calcification of joint soft tissues which is prevented with aggressive factor replacement,” Haemophilia 20, 716–722 (sep 2014). [DOI] [PMC free article] [PubMed] [Google Scholar]
- [3].Schroeder WJ, Zarge JA, and Lorensen WE, “Decimation of triangle meshes,” in [Proceedings of the 19th annual conference on Computer graphics and interactive techniques - SIGGRAPH ‘92], 65–70, Association for Computing Machinery (ACM), New York, New York, USA: (1992). [Google Scholar]
- [4].Fishbaugh J, Pascal L, Fischer L, Nguyen T, Boen C, Goncalves J, Gerig G, and Paniagua B, “Estimating shape correspondence for populations of objects with complex topology,” in [2018 IEEE 15th International Symposium on Biomedical Imaging (ISBI 2018)], 1010–1013, IEEE; (apr 2018). [DOI] [PMC free article] [PubMed] [Google Scholar]
- [5].McCormick M, Liu X, Jomier J, Marion C, and Ibanez L, “ITK: enabling reproducible research and open science.,” Frontiers in neuroinformatics 8, 13 (2014). [DOI] [PMC free article] [PubMed] [Google Scholar]
- [6].Vercauteren T, Pennec X, Perchant A, and Ayache N, “Diffeomorphic demons: Efficient non-parametric image registration,” NeuroImage 45(1), S61–S72 (2009). [DOI] [PubMed] [Google Scholar]
- [7].Marron JS, Todd MJ, and Ahn J, “Distance-Weighted Discrimination,” Journal of the American Statistical Association 102, 1267–1271 (dec 2007). [DOI] [PMC free article] [PubMed] [Google Scholar]
- [8].Wei S, Lee C, Wichers L, Li G, and Marron JS, “Direction-Projection-Permutation for High Dimensional Hypothesis Tests,” (apr 2013).
- [9].Bône A, Louis M, Martin B, and Durrleman S, “Deformetrica 4: an open-source software for statistical shape analysis,” in [International Workshop on Shape in Medical Imaging], 3–13, Springer; (2018). [Google Scholar]


