Summary:
Immunoglobulin A (IgA) secretion by plasma cells, terminally differentiated B cells residing in the intestinal lamina propria, assures microbiome homeostasis and protects the host against enteric infections. Exposure to diet-derived and commensal-derived signals provides immune cells with organizing cues that instruct their effector function and dynamically shape intestinal immune responses at the mucosal barrier. Recent data have described metabolic and microbial inputs controlling T cell and innate lymphoid cell activation in the gut; however, whether IgA-secreting lamina propria plasma cells are tuned by local stimuli is completely unknown. While antibody secretion is considered to be imprinted during B cell differentiation and therefore largely unaffected by environmental changes, a rapid modulation of IgA levels in response to intestinal fluctuations might be beneficial to the host.
Here we showed that dietary cholesterol absorption and commensal recognition by duodenal intestinal epithelial cells lead to the production of oxysterols, evolutionarily conserved lipids with immunomodulatory functions. Using conditional CH25H deleter mouse line we demonstrated that 7a,25-HC from epithelial cells is critical to restrain IgA secretion against commensal and pathogen-derived antigens in the gut. Intestinal plasma cells sense oxysterols via the chemoattractant receptor GPR183 and couple their tissue positioning with IgA secretion.
Our findings revealed a new mechanism linking dietary cholesterol and humoral immune responses centered around plasma cell localization for efficient mucosal protection.
Introduction
IgA-secreting plasma cells (PCs) are the dominant lymphocyte population in the gut1. They are required for protection from enteric pathogens and toxins2,3, while controlling microbiome composition4. As terminally differentiated B cells, PCs possess transcriptional and metabolic programs that sustain stable immunoglobulin production: it is generally thought that PC effector function is minimally impacted by environmental cues from the tissue. While this notion likely applies to PCs residing in bone marrow and spleen, that can only sense blood-derived molecules, IgA+ PCs are located beneath the absorptive epithelium, thus routinely exposed to luminal microbial and dietary cues entering the gut. Cholesterol is particularly enriched in the intestinal tissue: cholesterol can be produced by all nucleated cells from acetyl coenzyme A, yet a sizable fraction of circulating cholesterol is derived from the diet. In the gut, dietary cholesterol absorption is restricted to the duodenum: cholesterol is initially taken up by epithelial cells via the transmembrane protein Niemann-Pick C1-Like 1 protein (NPC1L1)5, then incorporated into chylomicrons for access to the lymph, and eventually to the bloodstream. While cholesterol is a hydrophobic molecule that cannot easily circulate in aqueous environments in absence of lipoproteins, oxidized cholesterol byproducts (oxysterols) possess hydroxyl groups that increase polarity and allow for a wide range of biological activities6. Oxysterols with a hydroxyl group at the carbon 25, 25-hydroxycholesterol (25-HC) and 7α,25-dihydroxycholesterol (7α,25-HC), have been reported to control different aspects of immune cell activity in spleen and lymph nodes7,8, but their generation and function in the gut remain largely uncharacterized9,10. Oxysterols are generated from cholesterol, and the intestinal tissue underneath the epithelium is exposed to a sterol-rich environment that fluctuates according to the diet; nevertheless, a precise mechanistic understanding of the role that oxysterols play in shaping the effector function of tissue resident adaptive immune cells in the small intestine is lacking.
Here we set out to identify the source and requirements for oxysterol production, and to define the crosstalk with intestinal antibody-secreting PCs. We found that intestinal epithelial cells produce oxysterols in response to both microbial ligands and dietary cholesterol. Conditional ablation of the essential enzyme cholesterol 25-hydroxylase (CH25H) abrogated 25-HC and 7α,25-HC in the intestinal tissue and enhanced IgA secretion by PCs. The amino acid transporter CD98 was rapidly regulated in response to tissue oxysterols and marked PCs with higher secretory capacity. Intestinal PCs express the G protein-coupled receptor 183 (GPR183, also known as EBI2), the unique surface receptor for 7α,25-HC. PCs lacking GPR183 failed to cluster in the intestinal villi and were characterized by increased CD98 expression and enhanced IgA secretory ability. Using a combination of dietary intervention, and drugs that block cholesterol absorption or prevent lipase activity, we elucidated the role of chylomicron in the oxysterols-immune cell crosstalk. Modulation of oxysterol production or oxysterol sensing shaped resistance to the enteric pathogen Salmonella typhimurium, highlighting the translational implications of tissue regulation of humoral immune response.
Our findings elucidate a tripartite circuit that links intestinal luminal cues, epithelial cell metabolism and humoral immune response at both steady state and during response against enteric pathogens. This novel mode of action for immunoglobulin secretion at the intestinal barrier dovetails well with the ever-changing gut environment and equips that host with the ability to rapidly control the magnitude of IgA effector response.
RESULTS
Diet and microbiome induce oxysterols in IECs.
25-HC and 7α,25-HC are generated from cholesterol by the sequential activity of the enzymes Cholesterol 25-Hydroxylase (CH25H) and Cytochrome P450 Family 7 Subfamily B Member 1 (CYP7B1)11 (Fig. 1a). In the small intestine, these enzymes were differently expressed in anatomically distinct segments, with both Ch25h and Cyp7b1 (Extended data Fig. 1a) transcripts more abundant in the duodenum compared to the ileum. Hsd3b7, the enzyme that inactivates 7α,25-HC (Extended data Fig. 1b), was only marginally reduced in the duodenum (Extended data Fig. 1c), suggesting the existence of differential oxysterol production along the small intestine. 7α,25-HC is the ligand for GPR183 (GPR183L): analytic measurement of analysis of oxysterols via mass spectrometry (MS) is challenging due their low abundance in comparison to cholesterol12 and possible overlapping MS/MS transition and retention times13. Thus, we measured 7α,25-HC in lipid extracts14 from intestinal tissue by using an established in vitro bioassay8–10 that is based on GPR183 binding to 7α,25-HC with sub-nanomolar sensitivity and reliably recapitulates oxysterol levels measured by analytic methods7. We observed that the duodenum contained the highest GPR183L concentration in the small intestine (Fig. 1b, Extended data Fig. 1d), suggesting the existence of a restricted anatomical zonation dedicated to GPR183L production.
Figure 1: Intestinal epithelial cells integrate microbial and dietary cues to produce oxysterols for chylomicrons packaging and lymphatic secretion.
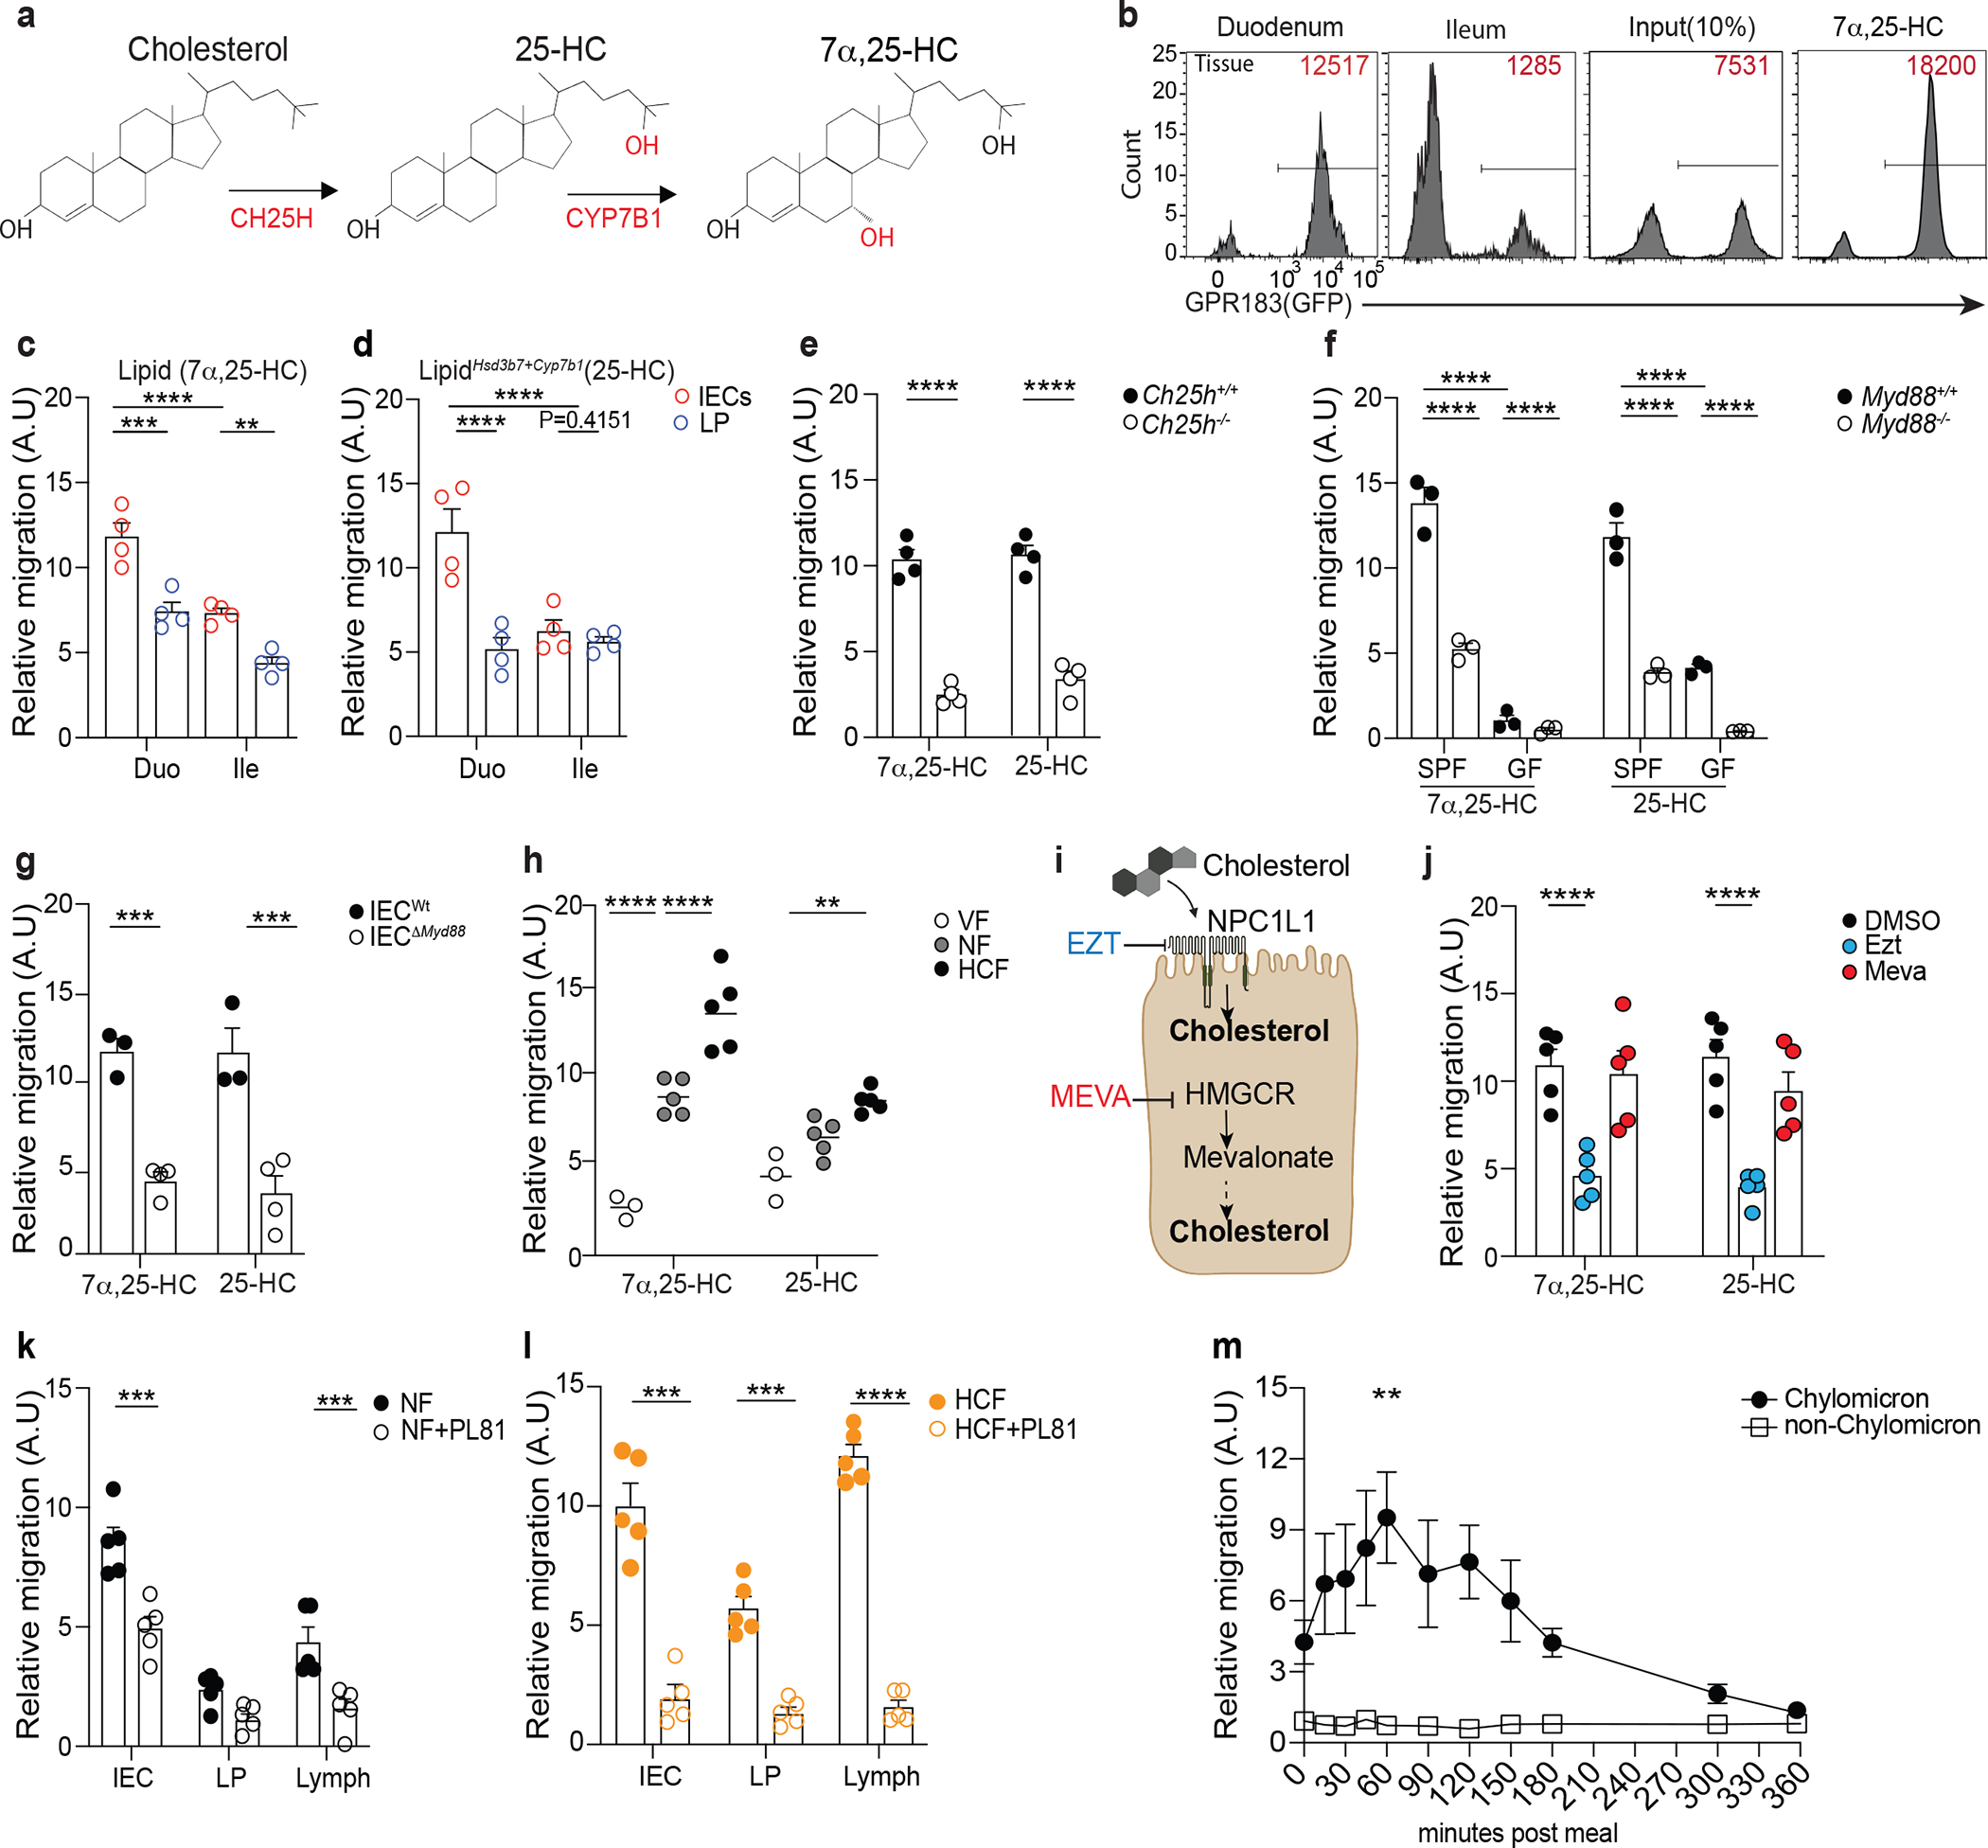
a, 7α,25-HC biosynthetic pathway from cholesterol. b, Representative flow cytometry plot and number of GPR183+ M12 cells migrating upon exposure to lipids extracts from duodenum and ileum tissue. The relative migration (A.U) was measured and plotted as ratio between number of migrating GFP+ M12 cells and number of migrating GFP- M12 cells and normalized to migration toward lipid free migration media (Nil). 100nM of 7α,25-HC was used as positive control for the migration assay. c,d, Summary data of 7α,25-HC (Lipid) and 25-HC (LipidHsd3b7+Cyp7b1) quantification in IECs and lamina propria (LP) of duodenum and ileum from C57Bl/6 mice (d). e, M12 migration assay of IEC lipids from Ch25h−/− and LMC mice. f, M12 migration assay of IEC lipids from germ free (GF) and specific pathogen free (SPF) MyD88−/− mice and littermate controls. g, M12 migration assay with lipids from IECs of VillincreMyD88fl/fl and LTC mice. h, Relative quantification of 7α,25-HC and 25-HC in IECs from wild type mice fed for 24 hours with normal food (NF), food with 2% of cholesterol (HCF) and vegetarian food (VF). i, Schematic representation of the pharmacological activity of Ezetimibe (Ezt) and Mevastatin (Meva) in IECs (Created with Biorender.com). j, M12 migration assay with lipids from IECs of mice treated for 24hrs with 10mg/kg (body weight) of Ezetimibe (Ezt), 20 mg/kg (body weight) of Mevastatin (Meva) or vehicle (DMSO). k, M12 migration assay with 7α,25-HC from IECs, lamina propria (LP) and Lymph of mice treated with 3% of Pluronic81(PL81) in NF condition or (l) HCF (vol/vol). m, M12 migration assay with human plasma from healthy patients upon exposure to lipid-based meal. Plasma was separated into chylomicron and non-chylomicron fractions and analyzed at the indicated time point. The results were pooled from three experiments (c,d,e,f and g)(n=3–4 mice per group); (h,j,k and l)(n=5 mice per group) and two independent experiments (m)(n=3 biologically independent samples). Statistics were measured by two-way ANOVA with Bonferroni’s correction (*p<0.05, **p<0.01,***p<0.001, ****p<0.0001) in (c,d,f,h and m) and two-sided unpaired Student’s t-test (e,g,j,k and l). Exact P values and adjustments are provided in Source data. The error bars represent the mean ± s.e.m.
In vitro bioassays and qRT-PCR revealed that intestinal epithelial cells (IECs), not lamina propria (LP) cells, were responsible for the generation of 7α,25-HC in an anatomically restricted fashion (Fig. 1c, Extended data Fig. 1e and Extended data Fig. 1f). A similar trend was observed for the GPR183 ligand precursor 25-HC (Fig. 1d), measured using a modified in vitro bioassay that enzymatically quantifies the existing 7α,25-HC and then converts the remaining 25-HC to 7α,25-HC (LipidHsd3b7+Cyp7b1)9 (Extended data Fig. 1g).
Oxysterol production was dependent on CH25H, as their levels were minimal in IECs of Ch25h−/− mice (Figure 1e) and high purity sorting of intestinal cell subsets confirmed that duodenal IECs were the main producer of oxysterols, with stromal cells minimally contributing to it (Supplementary Fig.1a and Supplementary Fig.1b). Collectively, our data show that duodenal, but not ileal, IECs can produce immunomodulatory oxysterols in a CH25H-dependent fashion.
Ch25h induction in immune cells is downstream TLR signaling15,16: to investigate whether commensal recognition through TLRs is involved in establishing oxysterol production in the gut, we analyzed IECs from wild-type mice and from mice lacking the adaptor protein MyD88 (Myd88−/−) in both specific pathogen-free (SPF) and germ-free (GF) facilities. IECs isolated from Myd88−/− mice showed reduced Ch25h and Cyp7b1, but not Hsd3b7 transcripts (Supplementary Fig.1c). MyD88-dependent Ch25h induction was partially driven by commensal sensing, as IECs from GF mice were characterized by minimal Ch25h, while Cyp7b1 and Hsd3b7 expression remained unaffected (Supplementary Fig.1d). As a result, generation of both 7α,25-HC and 25-HC was largely dependent on MyD88-mediated microbiome recognition in the gut (Fig. 1f). To further assess the intrinsic MyD88 role in IECs for oxysterol production, we analyzed IECs from mice with an epithelial cell-specific deletion of Myd88 (VillCre Myd88flox/flox: IECΔMyd88)17. In these animals Ch25h and Cyp7b1 expression (Supplementary Fig.1e)) and oxysterol production were reduced (Fig. 1g) in IECwt. Thus, Myd88 is required in IECs for the generation of oxysterols upon commensal sensing, suggesting that cholesterol metabolite production might be dynamically instructed by microbial recognition.
GPR183L and its precursor are enriched in IECs from the duodenum, the most proximal portion of the small intestine that mediates cholesterol absorption from food18. Therefore, we sought to investigate the impact of dietary cholesterol on oxysterol production. We fed mice with either normal food (NF), vegetarian food (VF) or normal food with the exclusive addition of cholesterol found in the Western diet (2% cholesterol food, HCF). Dietary cholesterol shaped IEC-derived oxysterol production: HCF drove increased 25-HC and 7α,25-HC concentrations, while VF virtually abolished oxysterol levels (Fig. 1h). Response to dietary cholesterol required CH25H activity, as oxysterol production was unaffected in Ch25h deficient mice irrespectively of the food composition (Supplementary Fig.1f).
Cholesterol can be either synthetized intracellularly or absorbed from the intestinal lumen. To define the cholesterol source underpinning oxysterol production, we treated mice with either Ezetimibe (Ezt), a drug that inhibits dietary cholesterol absorption by blocking the NPC1L118, or Mevastatin (Meva), an HMG-CoA reductase inhibitor that lowers cholesterol biosynthesis19 (Fig. 1i). Ezetimibe, but not Mevastatin, markedly reduced 7α,25-HC and 25-HC production in IECs (Fig. 1j). Food and drugs interfering with lipid absorption can affect bile acid levels, thus11,20, we tested whether short treatment with HCF and Ezt could modify intestinal bile acids. In contrast to prolonged modulation of dietary cholesterol, short term dietary intervention and Ezt treatment did not impact intestinal bile acid levels. Moreover, as previously reported, Ch25h deficiency does not lead to alteration of bile acid11, in contrast to deficiency in Cyp27a121,(Supplementary Fig.1g). Together, our result suggested that GPR183L production in IECs is directly dependent on enzymatic modification of dietary cholesterol, and it is not secondary to bile acid changes.
Requirements for Ch25h and Cyp7b1, as well as for NPC1L1 activity, in shaping IEC oxysterol production were also maintained in primary intestinal organoids (Supplementary Fig.2a–e). Liver X receptors (LXR) α and β play an important role in the regulation of cholesterol homeostasis22, however IECs and organoids from Lxrα−/−β−/− showed no defect in oxysterol production (Supplementary Fig.2f). Together our data identify dietary cholesterol absorption as the limiting step in the generation of oxysterols in IECs, suggesting the existence of a dynamic regulation of immunomodulatory lipid metabolites centered on CH25H.
Upon absorption by IECs, dietary cholesterol is packaged in chylomicrons for delivery to lymph23. To test whether oxysterols gain access to lymphatics, we first measured 7α,25-HC and 25-HC in lymph from cisterna chyli of mice fed with NF or HCF. While both oxysterols were present in lymph, HCF increased 7α,25-HC, but not 25-HC, concentration (Extended data Fig. 2a), suggesting that lymph 25-HC was minimally dependent on cholesterol uptake. In vivo administration of Pluronic L-81 (PL81), an inhibitor of chylomicron secretion24 (Extended data Fig. 2b) revealed that IECs delivered 7α,25-HC in LP and lymph via chylomicrons (Fig. 1k), and that this process was enhanced by dietary cholesterol (Fig. 1l). Treatment with Poloxamer P407, a hepatic lipoprotein lipase inhibitor that prevents chylomicron clearance25(Extended data Fig. 2c), increased relative abundance of GPR183L in both lymph and plasma of treated mice (Extended data Fig. 2d) highlighting how 7α,25-HC delivery was dependent on chylomicrons. GPR183L, but not triglycerides, was confirmed to chylomicron fraction of human volunteers after a lipid-rich mixed liquid meal26, suggesting that the partitioning of GPR183L to chylomicrons was conserved in humans (Fig. 1m, Extended data Fig. 2e). Our results recognize IECs as a central cell type that integrates commensal recognition, dietary cholesterol absorption and chylomicron synthesis to shape oxysterol production and delivery.
IEC-derived 7α,25-HC tunes intestinal IgA secretion.
To study the functions of IEC-derived oxysterols in the gut with increased precision, we generated a mouse line lacking Ch25h in IECs (VillCreCh25hFlox/Flox: IECΔCh25h) (Extended data Fig. 3a and Extended data Fig. 3b). IECΔCh25h was characterized by a sharp reduction of both GPR183L and 25-HC in IECs, which remained unaffected by increased dietary cholesterol content (Fig. 2a). Moreover, GPR183L is greatly reduced in LP and lymph of IECΔCh25h compared to littermate controls independently of the cholesterol contained in the chow (Fig. 2b). In contrast, tissue and lymphatic 25-HC concentration showed differential dependency on CH25H+ IECs and dietary cholesterol (Fig. 2c). These findings suggest that in the gut tissue GPR183L is mainly derived from IECs and can be modulated by cholesterol uptake. Given the ability of oxysterols to travel in the tissue and to be sensed by surrounding cells, we hypothesized that IEC-derived GPR183L might work as a paracrine signal to convey luminal cues to gut resident immune cells. Intestinal plasma cells (PCs) secrete IgA to maintain luminal homeostasis and protect against pathogens and toxins2,3. IgA secretion was analyzed by an ELISPOT assay, and it was increased in LP PCs from IECΔCh25h as measured by absolute number, area, and intensity of IgA+ spots (Fig. 2d, Extended data Fig. 3c). HCF impaired PCs ability to secrete IgA but had no effect in the absence of IEC-derived GPR183L (Fig. 2d, Extended data Fig. 3c). Intestinal, but not serum, IgA levels were also higher in IECΔCh25h animals compared to littermate controls, irrespectively of dietary cholesterol (Fig. 2e), highlighting how GPR183L produced by IECs specifically impacts intestinal resident IgA PC effector function.
Figure 2: Diet-dependent, IEC-derived oxysterols modulate IgA secretion in the small intestine.
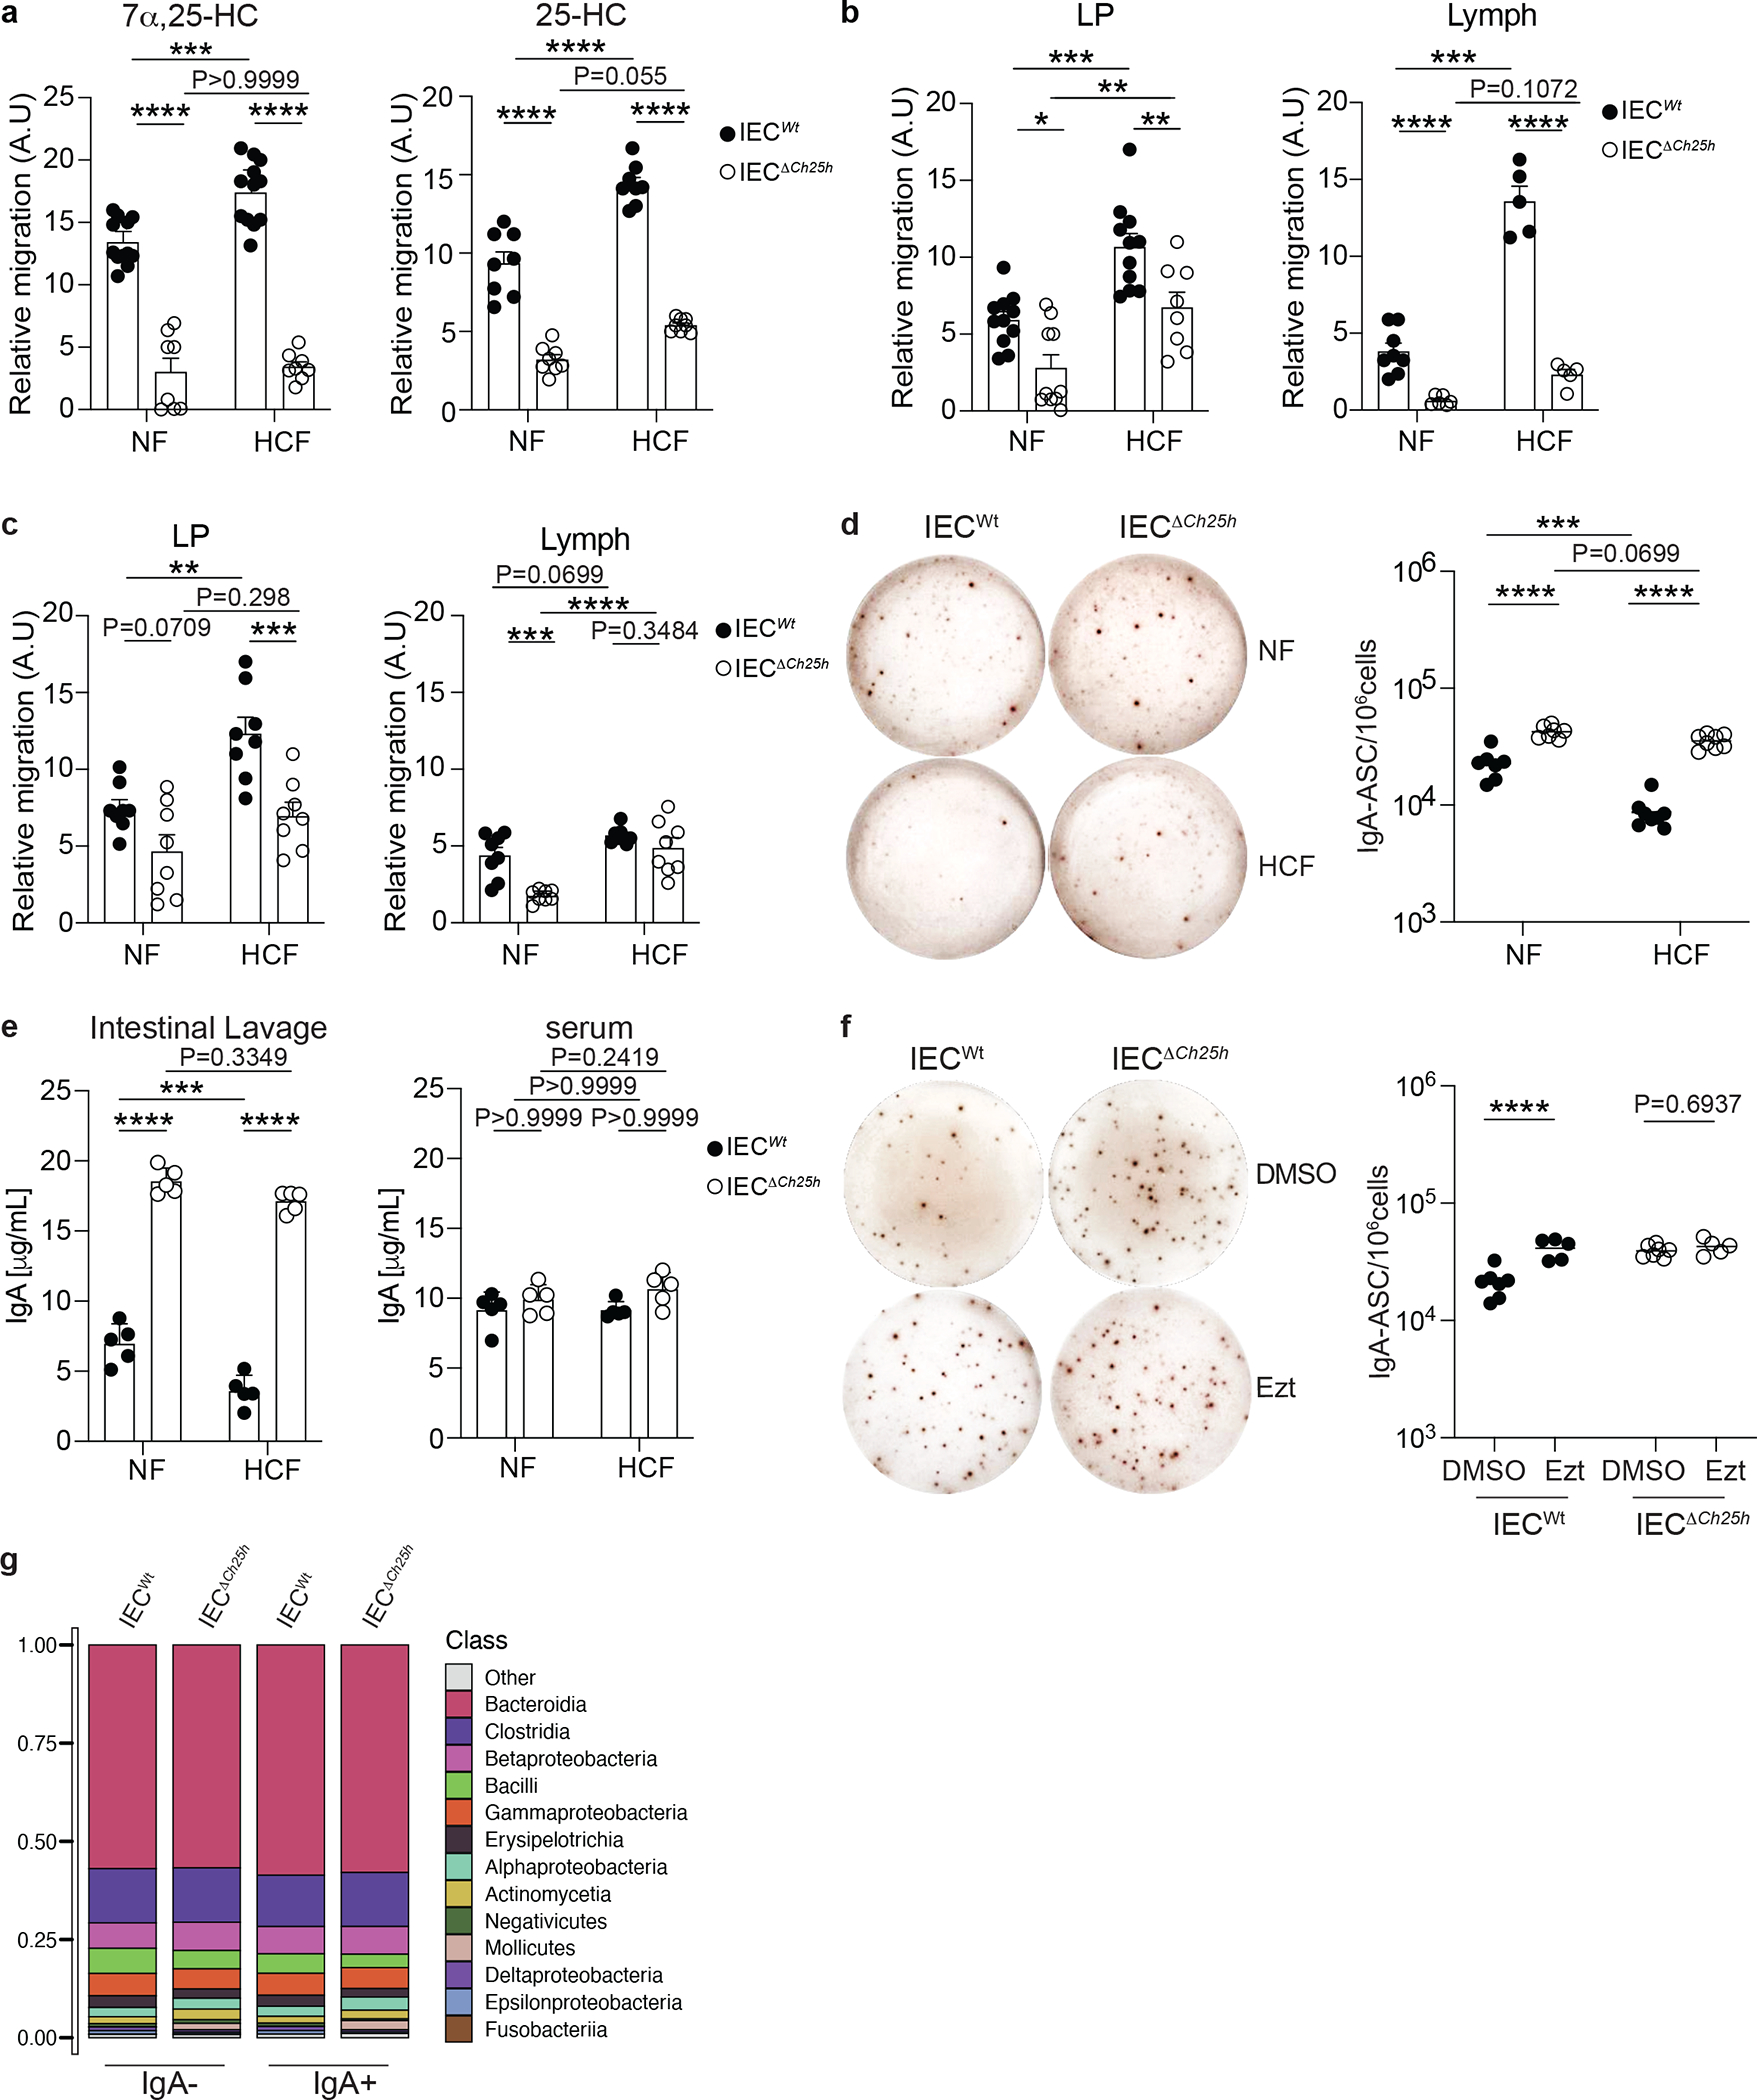
a, M12 migration assay with lipid extracts of IECs from VillincreCh25hfl/fl (IECΔCh25h) and littermate controls (IECWt) treated with NF and 2% of cholesterol diet (HCF). b, Relative 7α,25-HC and 25-HC quantification (c) in lamina propria (LP) and Lymph of IECΔCh25h and littermate mice upon NF and 2% HCF. d, Representative IgA ELISPOT and compiled quantification of IgA secreting PCs in lamina propria of IECWt and IECΔCh25h mice fed for 1 week with NF or HCF. e, ELISA of IgA in intestinal lavages and serum of IECWt and IECΔCh25h mice treated as in (d). f, Representative IgA ELISPOT and compiled quantification of IgA secreting PCs in lamina propria of IECΔCh25h and littermate control mice treated with 10 mg/kg of Ezetimibe (EZT) or vehicle (DMSO) for 24 hours. g, Analysis of the IgA+coated and non-coated commensal bacteria in the intestinal lumen of IECWt and IECΔCh25h mice by 16S rRNAseq. The results are pooled from three independent experiments (a,b,c)(n=8–12 mice per group); (d)(n=7–8 mice per group);(g)(n=3 mice per group) and two independent experiments (e,f)(n=5 mice per group). Statistic were measured with two-way ANOVA with Bonferroni’s correction (*p<0.05, **p<0.01, ***p<0.001, ****p<0.0001) in (a,b,c,d and e) and two-sided unpaired Student’s t-test (****p<0.0001) in (f). Exact P values and adjustments are provided in Source data. The error bars represent the mean ± s.e.m.
Accordingly, acute removal of Ch25h in IECs via tamoxifen (VillinERT2/Cre Ch25hFlox/Flox : IECiΔCh25h)(Extended data Fig. 3d–e), coupled with blockade of newly generated PC migration via anti-Madcam1 treatment27, revealed that IEC oxysterol modulation shaped IgA secretion specifically in duodenum lamina propria (Extended data Fig. 3f), but not in the ileum (Extended data Fig. 3g). In contrast, B cell activation and IgA class switch recombination in mesenteric lymph nodes (mLN) (Supplementary Fig.3a) and Peyer’s patches (PPs) (Supplementary Fig.3b) were normal in IECΔCh25h. Thus, production of a cholesterol metabolite by IECs profoundly specifically affects tissue-resident PC function in duodenum.
We sought to test whether dietary cholesterol absorption, or cholesterol biosynthesis, was required for regulating IgA secretion via oxysterol generation. Exposure of lamina propria PCs to Ezetimibe, Mevastatin or vehicle revealed that only inhibition of exogenous cholesterol absorption, not of endogenous cholesterol synthesis, enhanced intestinal IgA secretion (Extended data Fig. 4a). Thus, we treated IECΔCh25h mice and wildtype with Ezetimibe for 24h. While IgA secretion by PCs was enhanced in wild type animals when cholesterol absorption was inhibited, IECΔCh25h displayed no changes in IgA secretion upon Ezetimibe treatment, (Fig. 2f, Extended data Fig. 4b), and the number of IgA PCs was unaltered upon HCF and Ezt treatment irrespectively of the genotype (Extended data Fig. 4c). Moreover, bone marrow (BM) IgA PC effector function remained unaffected by Ezetimibe (Extended data Fig. 4d). To evaluate whether altered IgA secretion in IECΔCh25h was accompanied by differential commensal binding, we sorted IgA coated and non-coated commensals from the small intestine lavages of IECΔCh25h and littermate, co-housed controls and performed 16S rRNA gene sequencing28. No differences were observed in the relative abundance of IgA-coated and non-coated microbial fractions in both genotypes (Fig. 2g), as well as in global microbiome profile between IECΔCh25h and wild type mice (Extended data Fig. 4e and Supplementary Tables 1 and 2), suggesting that increased IgA secretion in absence of IEC-derived oxysterols does not preferentially bind specific commensals.
IEC-derived 7α,25-HC modulates CD98 in intestinal PCs.
The PC master transcription factor BLIMP1, encoded by the Prdm1 gene, controls the expression of the amino acid transporter CD9829. We discovered that the surface expression of CD98 identified intestinal PCs that were actively secreting IgA and correlated with Blimp-1 transcription (Fig. 3a–b). While both CD98+ PC populations expressed PC makers, IRF4 and IgK (Supplementary Fig.4a–c) and are therefore of B cell origin (Supplementary Fig.4d), CD98lo PCs showed reduced levels of Ab secretion machinery compared to CD98hi cells (Supplementary Fig.4e). However, low-dose of tunicamycin (TM) and dithiothreitol (DTT), that are known to activate the IRE1-XBP-1 pathway and induce the unfolded protein response (UPR)30, rescued CD98lo cells ability to secrete IgA (Fig. 3c). TM and DTT marginally enhanced IgA secretion by CD98hi cells, suggesting that UPR is differentially regulated in these two PC populations in vivo to tune their contribution to the intestinal humoral response.
Figure 3: Intestinal IgA plasma cells have discrete secretory capacity that segregates with CD98 expression.
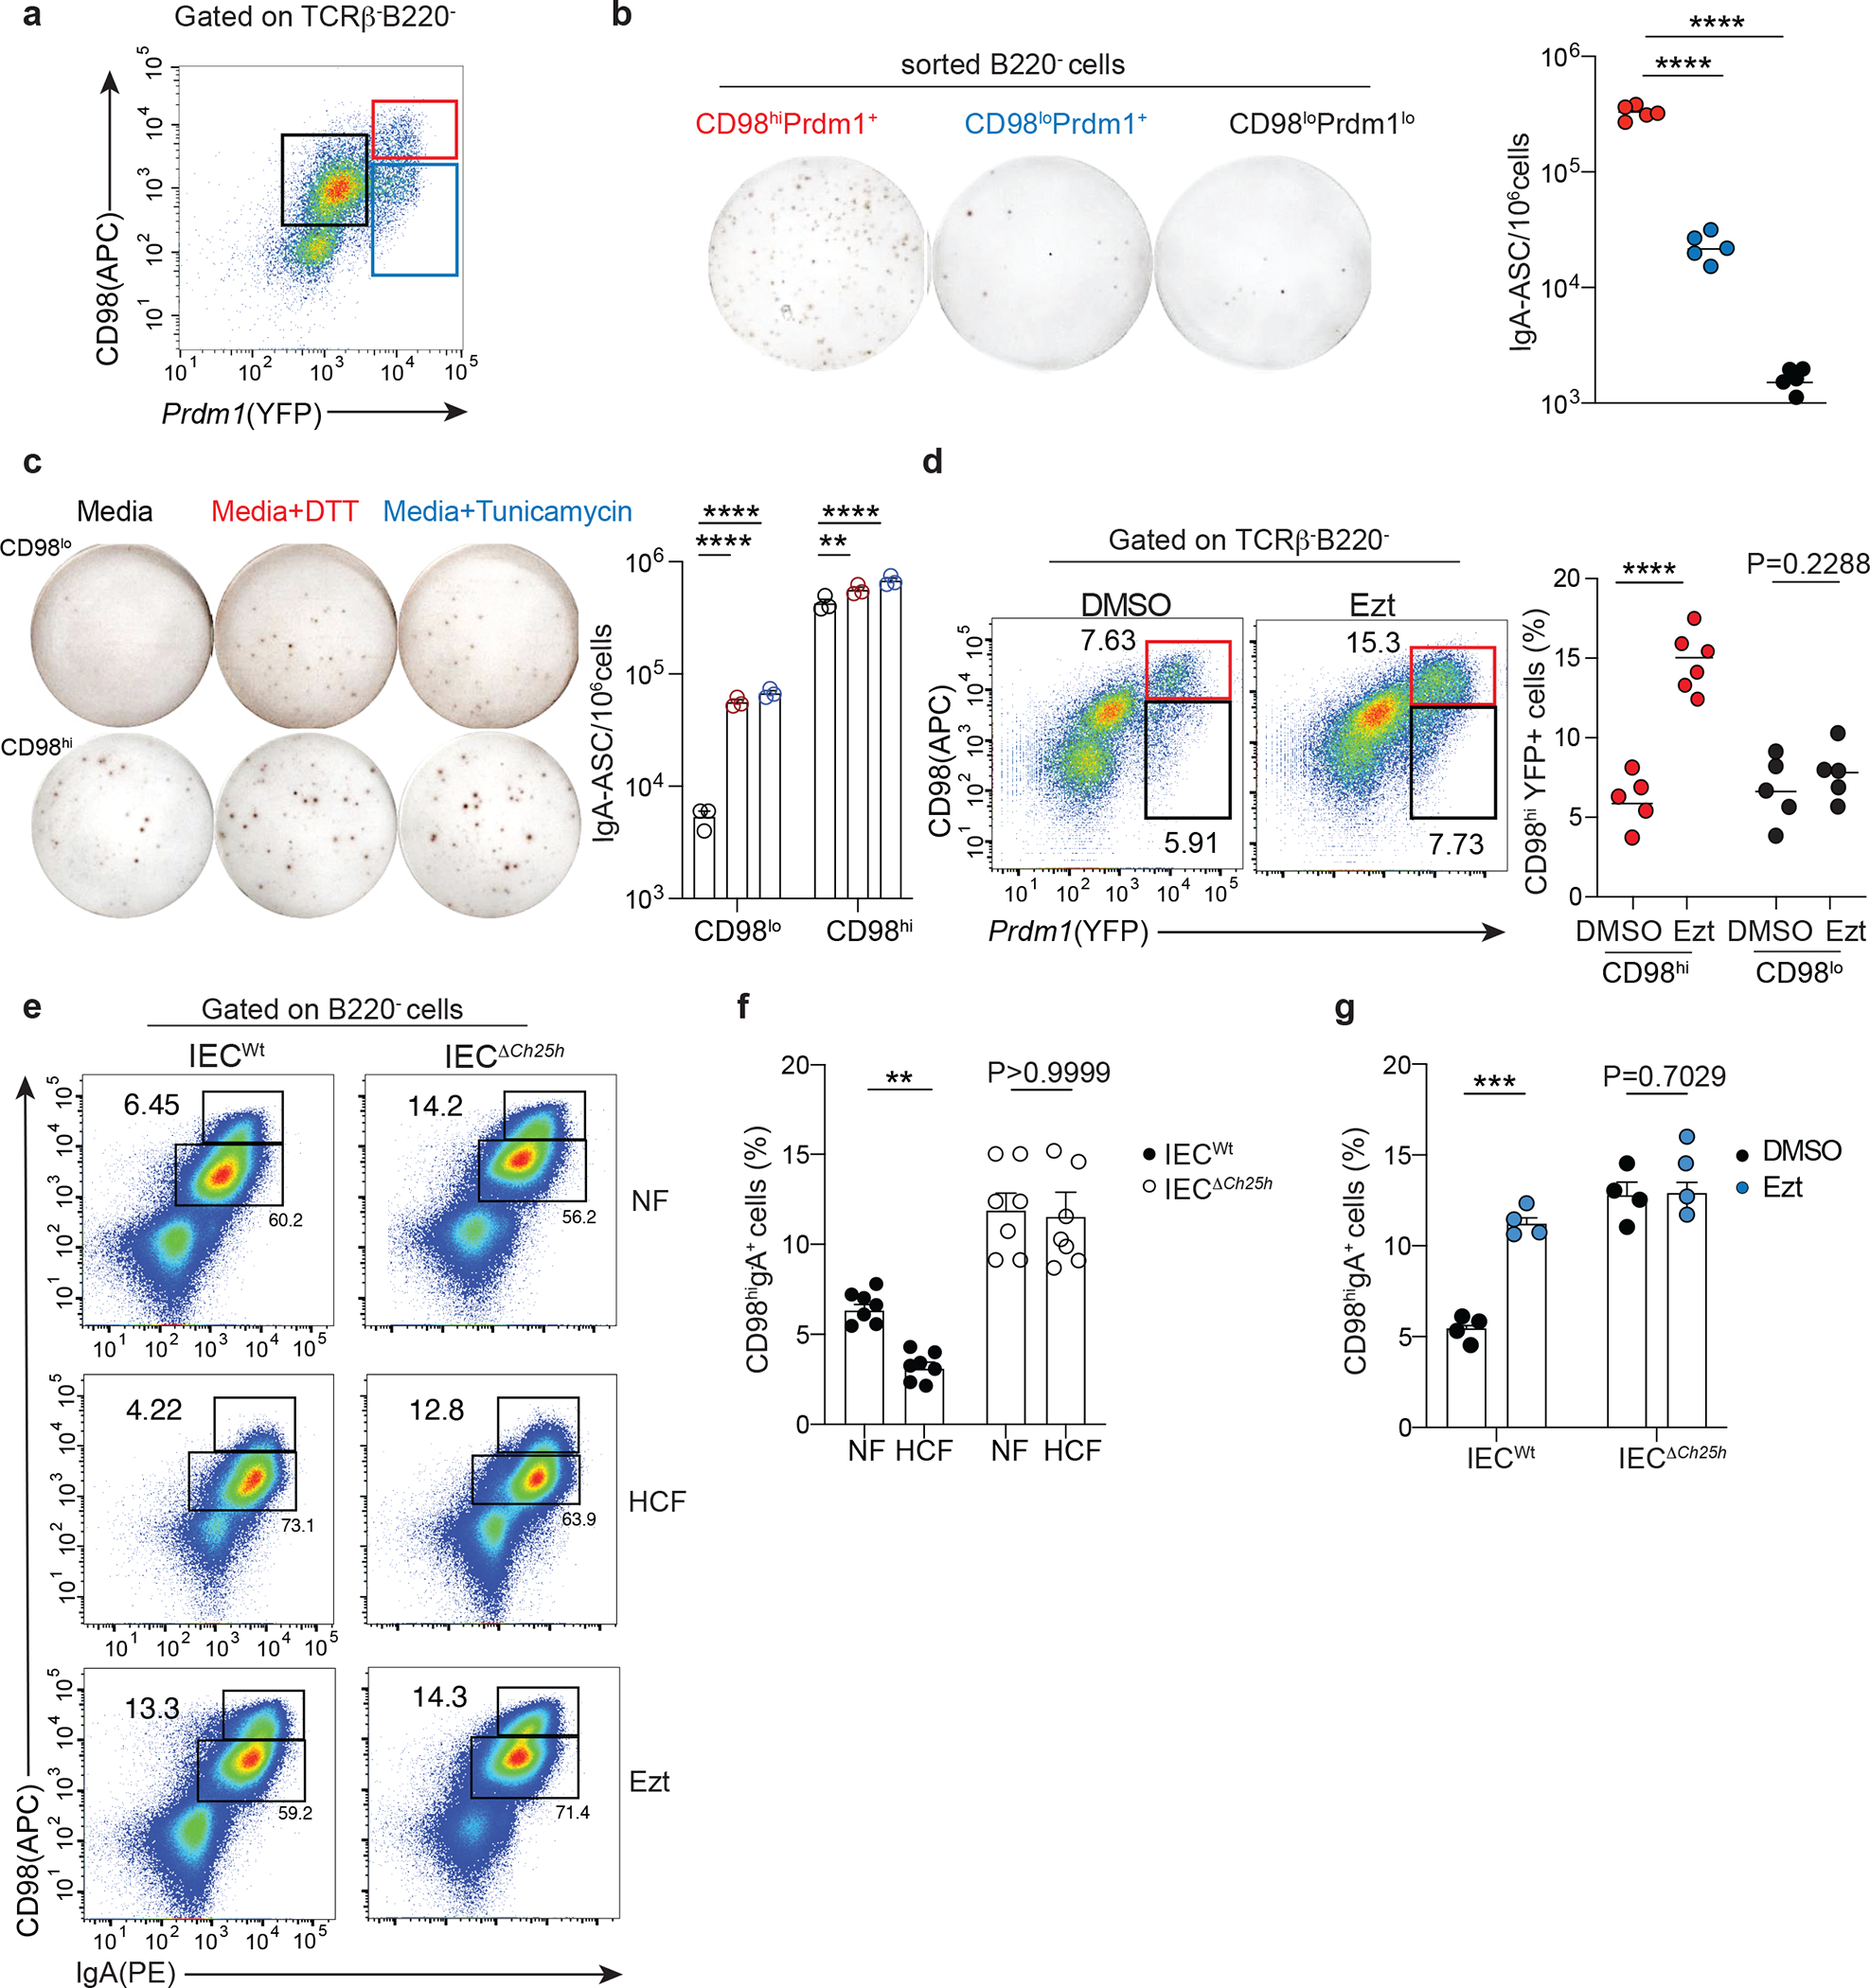
a, Representative sorting strategy for CD98 and BLIMP1 expressing PC cells and (b) quantification of IgA secreting cells by ELISPOT (b). c, ELISPOT of CD98hi and CD98lo sorted cells and treated for 3 hours with media or ER stress inductors, 0.5mM of DTT and 1 μg/mL of Tunicamycin. d, Representative flow cytometry and compiled data of lamina propria PCs in Prdm1YFP reporter mice gavage once with 10 mg/kg of Ezetimibe (Ezt+HCF) or vehicle (DMSO+HCF) and euthanized 24 hours later. Secreting PCs were gated as B220-, TCRβ-, YFP+ and CD98hi or CD98lo expressing cells. e, Representative flow cytometry of CD98hiIgA+ PCs frequency pre-gated on B220- cells in duodenal lamina propria of IECWt and IECΔCh25h mice treated with NF, HCF or 10 mg/kg Ezt. f-g, Compiled data of (e). The results are pooled from three independent experiments (b)(n=5 mice per group); (c)(n=3 mice); (d)(n=5–6 mice per group); (f)(n=7 mice per group) and two independent experiments (g)(n=4 mice per group). Statistics were measured with two-sided unpaired Student’s t-test (**P<0.01, ***p<0.001, ****P<0.0001) in (d,f and g) and one-way ANOVA with Bonferroni’s correction (****p<0.0001) in (b and c). Exact P values and adjustments are provided in Source data. The error bars represent the mean ± s.e.m.
To establish whether dietary cholesterol absorption regulated IgA secretion through Blimp1 expression, we treated BLIMP-1 reporter mice (Prdm1YFP)29 with Ezetimibe or vehicle for 24hrs. Ezetimibe induced a rapid upregulation of frequency (Fig. 3d) and number of CD98 and BLIMP1, but not absolute number of IgA+ PCs (Extended data Fig. 5a), suggesting that enhanced production of GPR183L in IEC negatively modulated IgA secretion in the duodenum.
Indeed, in mice deficient for GPR183L production by IECs (IECΔCh25h or Ezetimibe-treated), CD98 surface level was increased in LP PCs compared to littermate controls and was unaffected by HCF feeding (Fig. 3e–f). Accordingly, Ezetimibe treatment drastically increased CD98 expression in the duodenum of wild-type mice (Fig. 3g). In the ileum, CD98 expression and absolute number of IgA+ PCs, either in steady state, upon HCF or Ezt, were unchanged (Extended data Fig. 5b–e) highlighting the highly anatomically restricted function of GPR183L in the duodenum, which coincides with dietary cholesterol absorption zonation.
In line with this concept, we observed that CD98 expression was increased in IgA+ PC upon Ezetimibe, but not Mevastatin treatment, (Extended data Fig. 5f), and this effect was absent in BM (Extended data Fig. 5g), confirming that cholesterol absorption, but not cholesterol synthesis, tunes intestinal LP resident PCs via GPR183L generation.
GPR183L regulates intestinal antigen-specific IgA response.
To uncouple PC generation in intestinal lymphoid organs and PC effector function in the LP, we devised an adoptive transfer protocol using Bortezomib (BTZ), a drug that depletes PCs31 (Fig. 4a). LP GFP+ PCs transferred into Bortezomib -conditioned mice preferentially homed back to the duodenum, with little to no migration to bone marrow (Fig. 4b). Virtually all intestinal IgA+ PCs were of donor origin (GFP+), highlighting the high efficiency of the protocol (Fig. 4c–d and Extended data Fig. 6a). LP PC transferred into mice pretreated with antibiotic (Ampicillin, Vancomycin, Neomycin, Metronidazole, AVNM) showed higher IgA secretion activity and CD98 expression than LP PC transferred in PBS pretreated mice (Extended data Fig. 6b–c). This finding suggested that microbial changes, which affect IEC-mediated GPR183L production, shape IgA secretion in the small intestine.
Figure 4: IEC-derived oxysterols restrain Blimp-1 upregulation and antigen-specific IgA response.
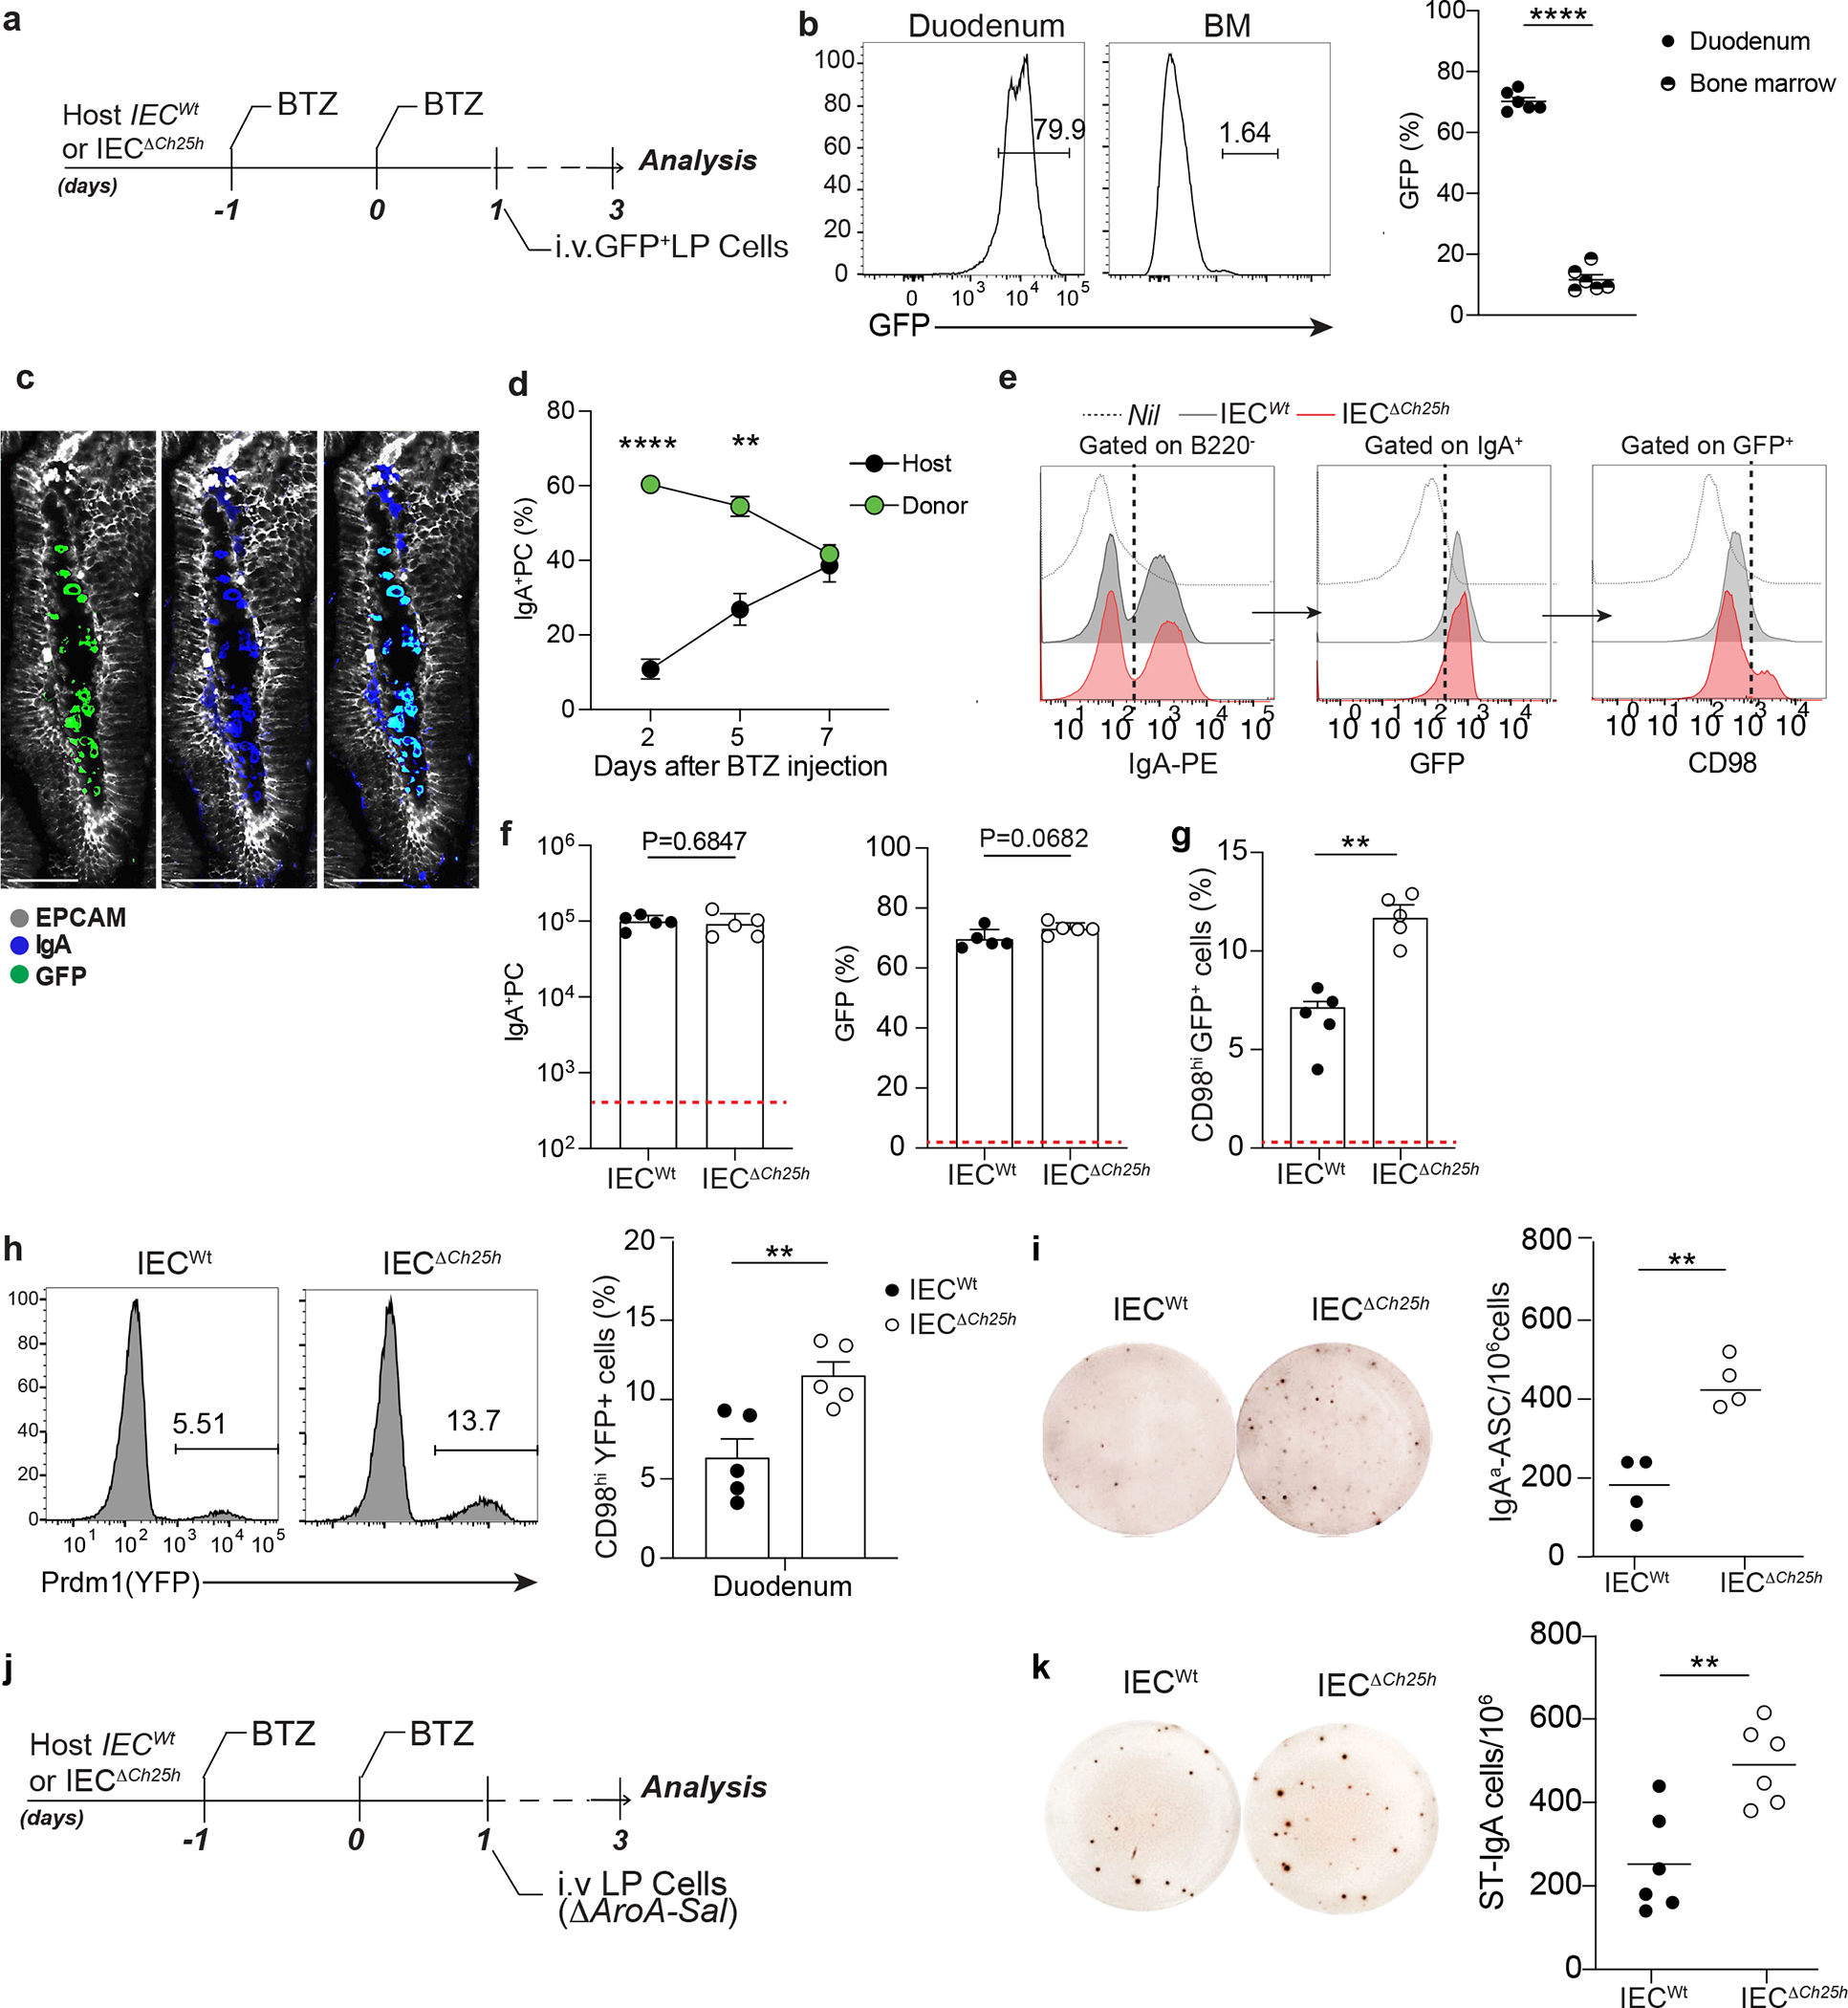
a, Experimental model of in vivo Bortezomib (BTZ) treatment and adoptive transfer of 1×10⁶ cells from lamina propria of B6-GFP mice into IECWt and IECΔCh25h mice. b, Representative frequency and compiled quantification of adoptively transferred GFP+ cells in duodenum and bone marrow of wildtype mice. c, Representative immunofluorescence of IgA+PCs in duodenum of C57BL/6 mouse previously treated with BTZ and systemically injected with lamina propria GFP+ cells. Bar is 50μm. d, Frequency of donor (GFP+) and host (GFP-) IgA+ cells in lamina propria of mice treated with BTZ and analyzed at 2,5 and 7 days after the adoptive transfer of GFP+ cells. e, Representative flow cytometry plot of IgA, GFP and CD98 cells in duodenum from IECWt and IECΔCh25h mice treated as in (a) and compiled data (f and g). The red dashed line indicates values in the nil mouse. h, Representative flow cytometry plot and compiled quantification of Prdm1YFP+ PCs adoptively transferred in BTZ-treated IECΔCh25h and littermate control (for experiment details see Extended Data Fig. 6d). i, Representative IgAa ELISPOT and compiled quantification of secreting PCs in lamina propria of IECΔCh25h and IECWt treated with BTZ and injected with lamina propria cells from IgMa mice. j, Experimental model of BTZ treatment and adoptive transfer of 1×10⁶ cells from lamina propria of mice infected with three doses of non-replicative ΔAroA Salmonella Typhimurium into IECWt and IECΔCh25h mice. k, Representative ELISPOT of Salmonella-specific IgA with lamina propria PCs from mice treated as in (j). The results were pooled from three independent experiments (b)(total n=6 mice); (f,g and h)(n=5 mice per group); (k)(n=6 mice per group) and two independent experiments (d)(n=3 biologically independent mice). Statistics were calculated with two-sided unpaired Student’s t-test (**P<0.01, ***P<0.001, ****P<0.0001) in (b,f,g,h,i and k) and one-way ANOVA in (d)(**P<0.01, ***p<0.0005) with Bonferroni’s correction. Exact P values and adjustments are provided in Source data. The error bars represent the mean ± s.e.m.
While frequency and number of GFP+ IgA+ PC donor cells transferred in either Bortezomib-treated IECΔCh25h or littermate control mice were comparable (Fig. 4e–f), GFP+ PCs transferred in IECΔCh25h mice showed higher levels of CD98 expression (Fig. 4g), Prdm-1 transcription (Fig. 4h, Extended data Fig. 6d) and IgA secretion (Fig. 4i) compared to GFP+ PCs transferred in wild type mice. This phenotype was again restricted to the duodenum as no difference was observed in the bone marrow of IECΔCh25h mice (Extended data Fig. 6e). To test whether IEC-derived oxysterols could influence antigen-specific IgA responses, we adoptively transferred LP PCs from mice infected with metabolically deficient Salmonella strain (ΔAroA)2 into IECΔCh25h and littermate controls (Fig. 4j). Secretion of Salmonella-specific IgA was increased in LP (Fig. 4k, Extended data Fig. 6f), but not in the bone marrow or spleen (Extended data Fig. 6g), of IECΔCh25h. Taken together, our results indicate that IEC-derived oxysterol can rapidly shape PC effector function via modulation of IgA secretion and antigen-specific response at the intestinal interface.
GPR183 controls PC migration and restrains IgA secretion.
In line with data from splenic PCs, intestinal PCs expressed GPR183 (Fig. 5a–b). Indeed, LP PCs migrated in response to GPR183L ex vivo (Fig. 5c), suggesting that GPR183/GPR183L axis might contribute to control intestinal PC function. To confirm that IEC-derived oxysterols influence IgA PC effector function via the GPR183L-GPR183 axis, we generated mice where PCs lacked GPR183 (Aicdacre Gpr183flox/flox : PCΔGpr183) and therefore did not migrate in response to GPR183L in vitro (Fig. 5d).
Figure 5: Intestinal plasma cells express GPR183 and migrate in response to 7α,25-HC.
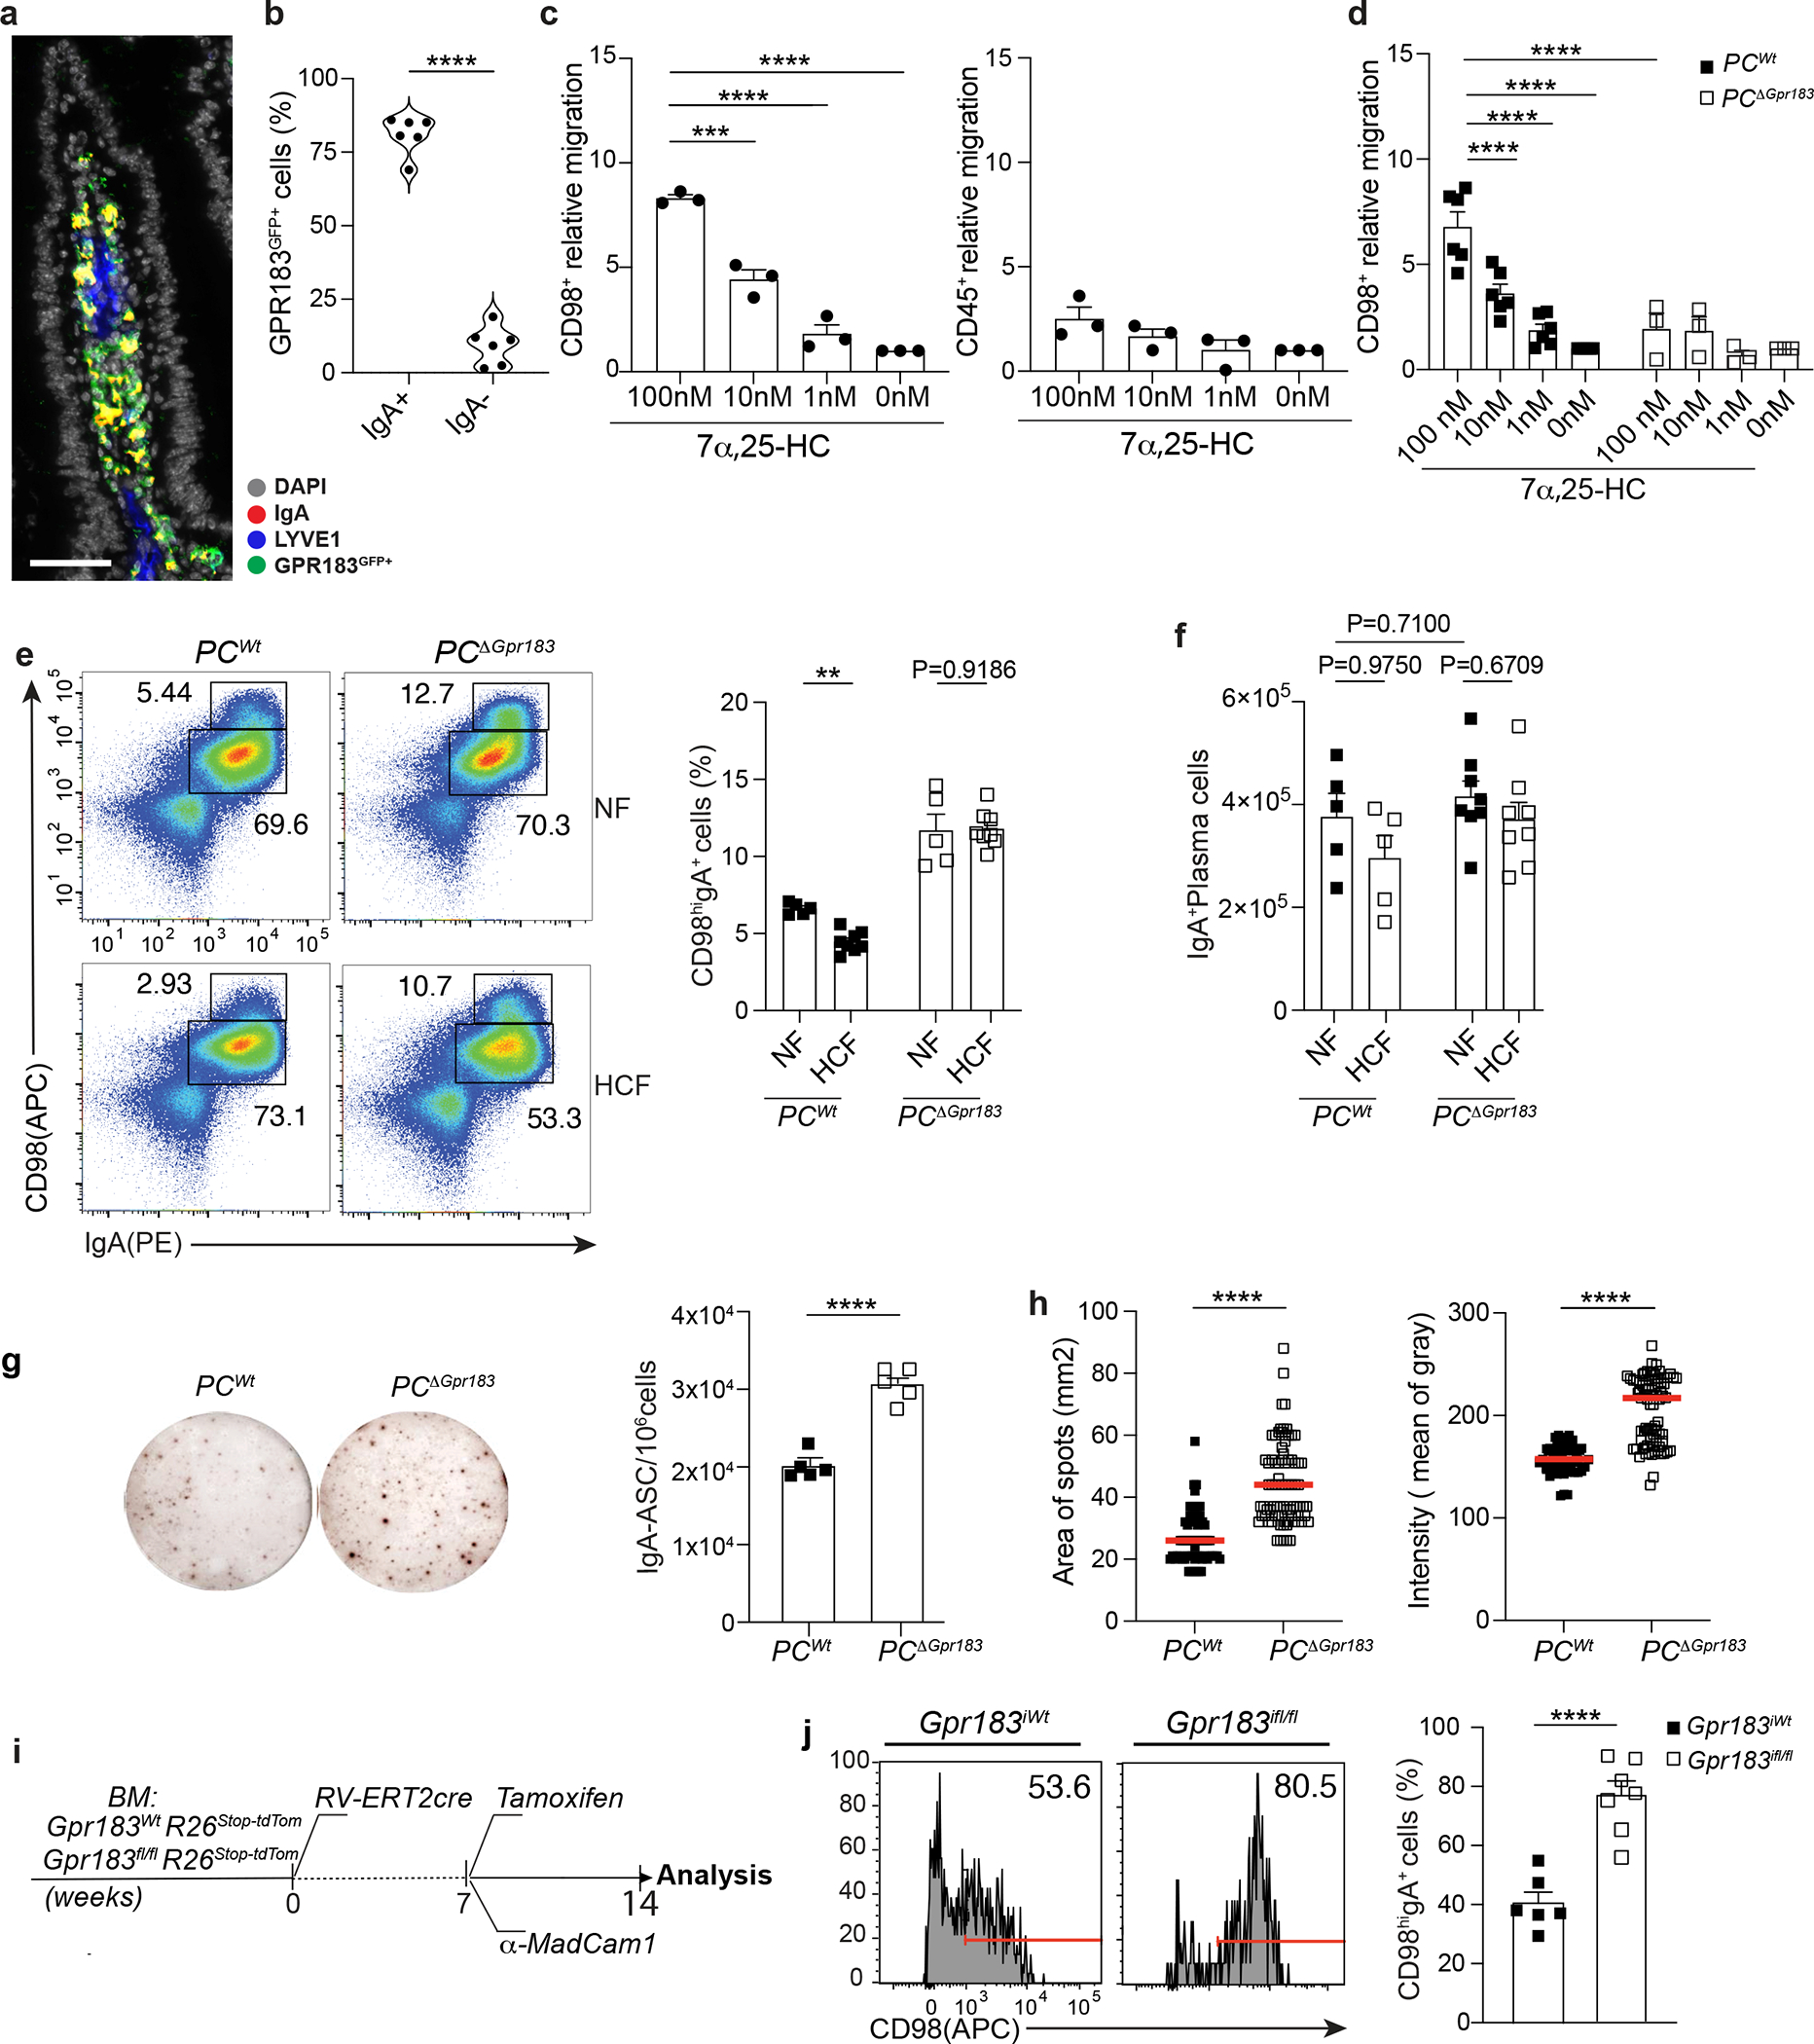
a, Immunofluorescence of IgA, GPR183, LYVE1 and DAPI on duodenum sections from a Gpr183GFP/+ reporter mouse. Scale bar is 100μm. b, Frequency of GPR183 in lamina propria of Gpr183GFP/+ reporter mouse measured by flow cytometry. c, Relative migration of lamina propria plasma cell and CD45+ in response to different concentrations of 7α,25-HC. d, Relative migration of lamina propria PCΔGpr183 and wild type at the indicated concentration of GPR183 ligand. Number of migrated cells were analyzed by flow cytometry and the relative migration was measured as fold of changes. e, Representative flow cytometry plot and percentage of IgA secreting PCs (CD98hiIgA+) in PCΔGpr183 and control mice, fed for one week with NF or HCF. f, Number of total IgA+ PC in duodenum of mice from (e). g, Representative IgA ELISPOT and compiled quantification of secreting IgA+ PCs from PCΔGpr183 and controls mice at steady state. h, Area and intensity quantification of IgA+ spots from (g). Each dot represents single IgA+spot. i, Experimental model illustrating the development of Tamoxifen inducible bone marrow (BM) retroviral chimera mice. BM cells from Rosa26-STOP-tdtomato Gpr183fl/fl and Rosa26-STOP-tdtomato Gpr183Wt were transduced with retroviral vector encoding for ERT2-cre. BM cells (10X106) were injected in irradiated C57/BL6 mice. j, 8 weeks after BM reconstitution mice were injected with Tamoxifen and 100μg of anti-MadCam1 for one week and euthanized for flow cytometry analysis of IgA+ PCs. CD98 PCs were previously gated on tdTomato+ cells. The results were pooled from three independent experiments (a and b)( n=6 mice); (c)(total of n=3 mice ); (d)(n=6mice for PCWt and n=3 mice for PCΔGpr183); (e)(n=5 mice for NF fed mice n=8 for HCF fed mice); (g)(n=5 mice per group); (h)(n=64–79 cells per group) and (j)(n=6 mice per group). Statistics were calculated with one-way ANOVA in (c,d)(****p<0.0001), two-way ANOVA in (f) and two-sided unpaired Student’s t-test (**p<0.01, ****p<0.0001) in (b,e,g,h and j) with Bonferroni correction. Exact P values and adjustments are provided in Source data. The error bars represent the mean ± s.e.m.
IgA+ PCs unable to sense GPR183L showed increased CD98 surface level (Fig. 5e), but similar total number (Fig. 5f) compared to controls. HCF diet blunted PC CD98 expression in wild-type mice but had no effect in PCΔGpr183 confirming that GPR183 was required on PCs to mediate HCF-dependent CD98 modulation (Fig. 5e). Similar to the phenotype observed in IECΔCh25h, the lack of GPR183 on PCs led to enhanced IgA secretion (Fig. 5g–h). Aicdacre is active in germinal center B cells: while GC B cells do not express GPR183, GPR183 removal from early generated PCs in intestinal SLOs might contribute to the effect observed in LP. Therefore, to test whether deletion of GPR183 in the tissue was sufficient to mediate IgA secretion enhancement, we retrovirally transduced Gpr183Wt and Gpr183flox/flox BM cells with a retrovirus encoding tamoxifen-dependent Cre (MSCV-ERT2/Cre). Both Gpr183Wt and Gpr183flox/flox BM cells also carried a tdTomato fluorescent protein downstream a STOP cassette in the Rosa26 locus to assess the efficiency of Cre recombination in vivo (Fig. 5i). Tamoxifen administration and anti-Madcam1 injection in reconstituted BM chimeras allowed us to specifically measure the effect of GPR183 deletion on tissue-resident PCs. PCs that deleted GPR183 in tissue (tdTom+) showed increased expression of CD98 compared to controls (Fig. 5j). Our findings highlight the essential role of GPR183 in PCs for sensing tissue oxysterols during IgA secretion.
While GPR183L is produced by IECs, GPR183+ PCs did not localize close to the intestinal epithelium. We reasoned that surface GPR183 on PCs would not be able to sense GPR183L unless chylomicron content was made accessible in the extracellular space by enzymatic degradation. Orlistat is a lipoprotein lipase inhibitor that prevents lipid absorption and chylomicron formation when given orally32, while reducing tissue lipase activity when given intraperitoneally (i.p.)33. In vivo i.p. treatment with Orlistat increased CD98 surface expression on PCs (Extended data Fig. 7a). GPR183L was decreased in LP and increased in the lymph (Extended data Fig. 7b); and direct measurement of lipoprotein lipase activity in the LP showed inhibited function (Extended data Fig. 7c). Together these data suggest that chylomicron-derived oxysterols are made available via enzymatic processing in the LP, possibly close to lymphatics, and drive tissue-resident PC re-localization (Extended data Fig. 7d).
GPR183/GPR183L axis modulates intestinal PC localization.
PCs in the bone marrow are thought to be mainly sessile34, however, less is known about the dynamics of PCs in the gut. While recent data suggest that intestinal PCs might be motile35, the mechanisms that modulate PCs zonation in the tissue remain largely unknown. Since the GPR183-GPR183L axis controls some aspects of cell positioning in SLOs36, we sought to characterize PCs location in the gut in response to oxysterols. In wild-type mice, IgA+ PCs were mainly clustered at the center of the villi surrounding lacteals (Fig. 6a and Supplementary video1). In contrast, IgA+ PCs from either PCΔGpr183 or IECΔCh25h were scattered in the LP (Fig. 6b and Supplementary video2) and at a greater distance from lymphatics (Fig. 6c, 6d and Extended data Fig. 7e,f), suggesting that IEC-derived oxysterols directed PC tissue localization via surface recognition.
Figure 6: Diet-derived oxysterols control spatial localization of intestinal IgA+ plasma cells via GPR183.
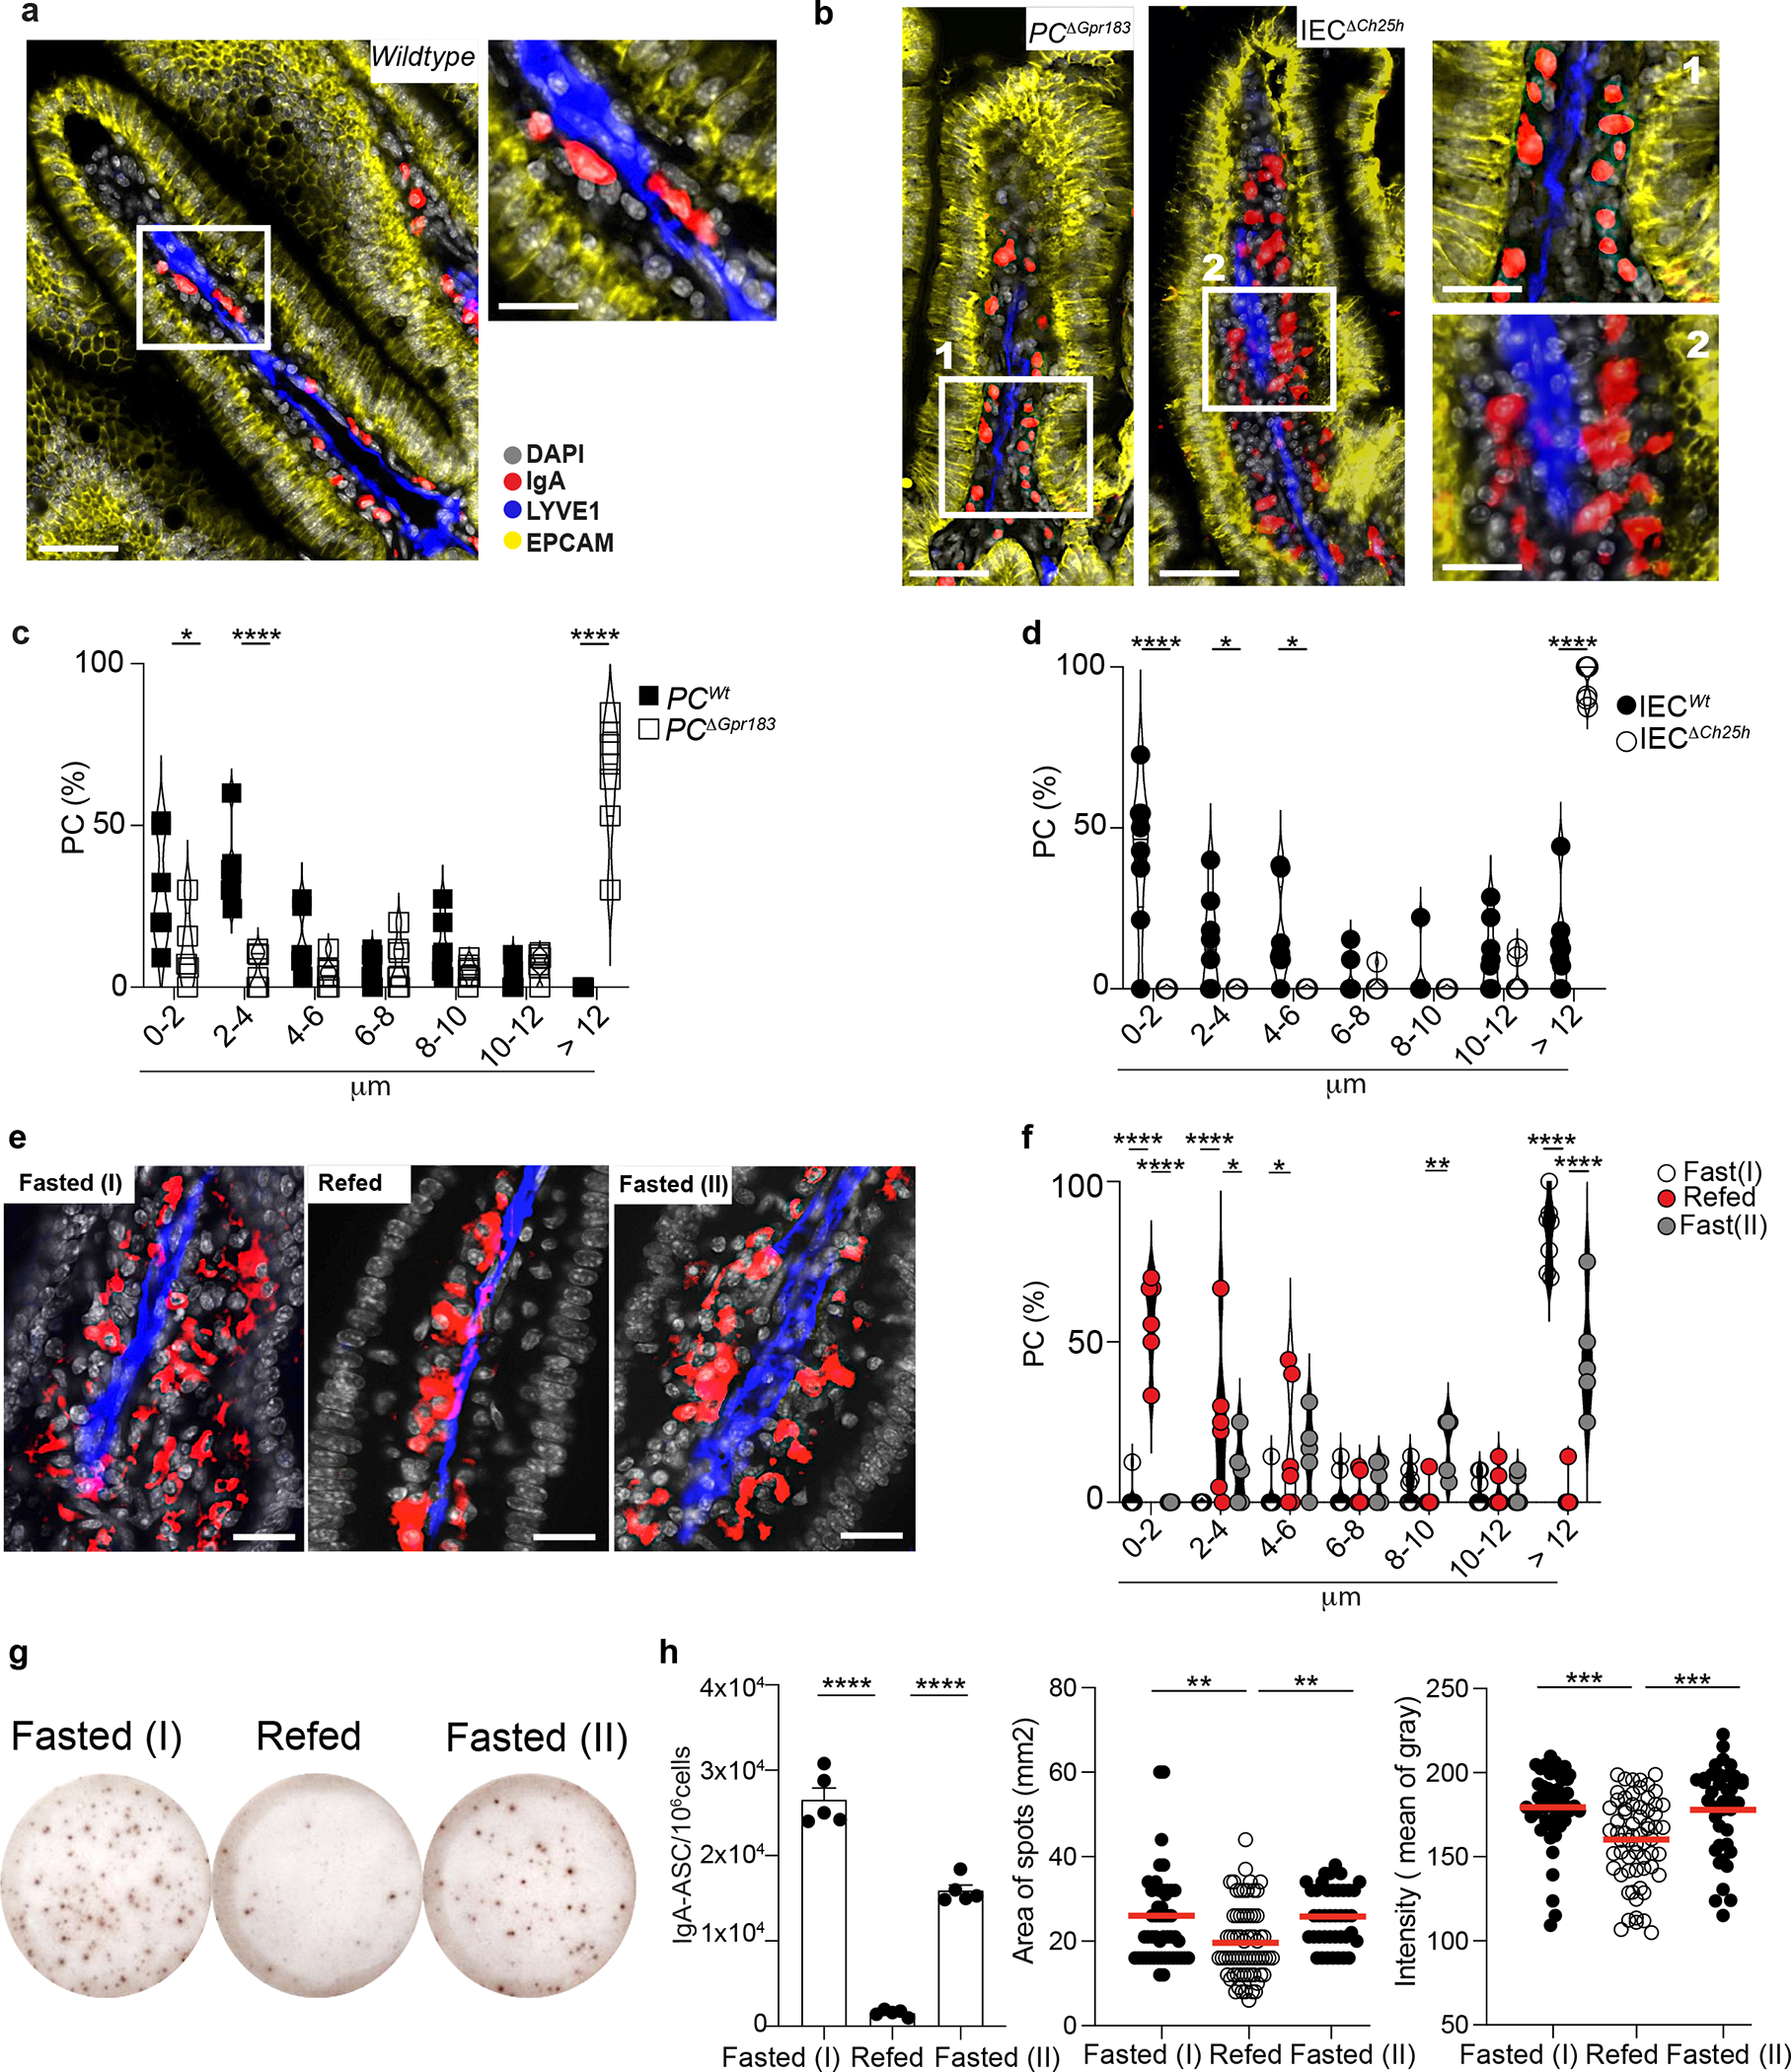
a, Representative immunofluorescence of PCs (IgA+), lymphatics (LYVE1+) and IECs (EPCAM+) on duodenum sections from wild type mice. Scale bar is 100μm (left) and 50 μm (right). b, Representative immunofluorescence of PCs (IgA+), lymphatics (LYVE1+) and IECs (EPCAM+) in PCΔGpr183 and IECΔCh25h sections and compiled data (c,d). Scale bar is 100μm (left) and 50 μm (right). Each dot represents the average of PCs frequency at the indicated range of distance measured in a total of n=7 mice per each treatment. e, Representative immunofluorescence of PCs (IgA+), lymphatics (LYVE1+) and DAPI in duodenum sections of mice fasted for 12hrs, refed once with HCF and then harvested at 3 or 12 hrs post-HCF. Scale bar is 50 μm. f, Frequency of PCs at the indicated distance from lymphatics from mice in (e). Each dot represents the average of PCs frequency at the indicated range of distance measured in n=6 mice per each treatment. g, Representative IgA ELISPOT and number (h), area and intensity of IgA spots from lamina propria of fasted mice for 12 hours (I), refed with HCF and fasted again for 6 hours (II). The results were pooled from three independent experiments (a,b,c,d,e and f)(n=6–7 mice pre group) and 2 independent experiments (g and h)(n=5 mice per group or n=40–68 cells). Statistics were measured as two-sided unpaired Student’s t-test (*p<0.05, ****p<0.0001) with Bonferroni’s correction in (c and d), two-way ANOVA (*p<0.05, **p<0.01,***p<0.001, ****p<0.0001) in (f) and one-way ANOVA in (h) with Bonferroni’s correction. Exact P values and adjustments are provided in Source data. The error bars represent the mean ± s.e.m.
We observed no difference in PC distribution in the ileum of IECΔCh25h compared with littermate controls (Extended data Fig. 7g–i), confirming the tissue specific function of oxysterols in the regulation of IgA+PC localization and activity.
IgA+ PCs can establish contact with IEC by the integrin αE (CD103)37. We observed that CD98hi cells expressed higher levels of CD103 than CD98lo cells, with CD103 being increased in IECΔCh25h mice compared to littermates (Extended data Fig. 7j). This finding suggested that PCs actively secreting IgA upregulate the expression of CD103, possibly to facilitate direct interactions with IEC.
To test whether PC different position within the tissue was part of a response to fluctuation in nutrient uptake that was relayed to the tissue via oxysterol production, we initially analyzed PC localization after dietary cholesterol modulation.
Intestinal PCs responded to altered tissue oxysterols by re-localizing: HCF induced a tight cluster of PCs around lymphatics, while VF permitted dispersion of PCs across LP (Extended data Fig. 8a–c). In the absence of food (fasting) PCs IgA secretion activity (Extended data Fig. 8d) and CD98 expression increased (Extended data Fig. 8e), phenocopying the findings in IECΔCh25h or PCΔGpr183. Refeeding mice with HCF gavage restored PC positioning adjacent to the lymphatic (Fig. 6e–f, Extended data Fig. 9a) and reduced IgA secretion (Fig. 6g–h) after 3 hours. However, the effect of dietary cholesterol was diminished after 12h and correlated with higher tissue GPR183L concentration (Extended data Fig. 9b).
Similarly, modulation of intestinal oxysterol concentration, by blocking cholesterol uptake (via Ezetimibe), or chylomicron formation (via PL81) or chylomicron tissue degradation (via Orlistat) impaired the ability of PCs to localize close to the lymphatics (Extended data Fig. 9c,d), underlying the requirements of the generation of GPR183-containing chylomicrons for PC positioning.
Finally, we took advantage of NIBR189, a functional antagonist of GPR18338. PCs isolated from LP of mice treated with NIBR189 showed impaired migration ex vivo (Extended data Fig. 10a) and altered PC position in vivo (Extended data Fig. 10b–d). Together, our data reveal a tissue-restricted modulation of PC positioning that is centered around dietary cholesterol metabolites and GPR183 function.
Oxysterols modulate humoral immunity to Salmonella.
The rapid modulation of IgA secretion by intestinal resident PCs suggests that changes in oxysterol abundance in the gut might underpin the humoral response and pathogen infectivity at the mucosal interface. To test whether transient reduction of cholesterol metabolites in the LP could enhance protection from enteric pathogens, we initially infected wild-type mice with the metabolic mutant ΔAroA Salmonella. After 2 weeks, to allow for the generation of the antigen-specific IgA PC response, we administered Ezetimibe or vehicle before challenging the animals with virulent Salmonella (Fig. 7a). Salmonella colony forming units (CFU) quantification showed that cholesterol absorption-inhibition led to reduced Salmonella in mLN and spleen, suggesting inhibition of Salmonella systemic dissemination (Fig. 7b). Accordingly, Salmonella-specific IgA measured by ELISA (Fig. 7c) and flow cytometry (Fig. 7d–f) were increased in the intestinal lavage of mice exposed to Ezetimibe, demonstrating that inhibition of cholesterol uptake by IECs enhanced antigen-specific IgA secretion. To evaluate whether the production of 25-oxysterols in IECs affected Salmonella dissemination in vivo, we infected pre-immunized IECΔCh25h and wildtype mice with Salmonella. Lack of 25-oxysterols in IECs reduced systemic Salmonella dissemination (Supplementary Fig.5a): this was accompanied by the higher Salmonella-specific IgA titer in vivo (Supplementary Fig.5b–c) and IgA-dependent reduced bacterial replication in vitro (Supplementary Fig.5d).
Figure 7: Cholesterol uptake and GPR183 inhibition enhance Salmonella-specific intestinal IgA response.
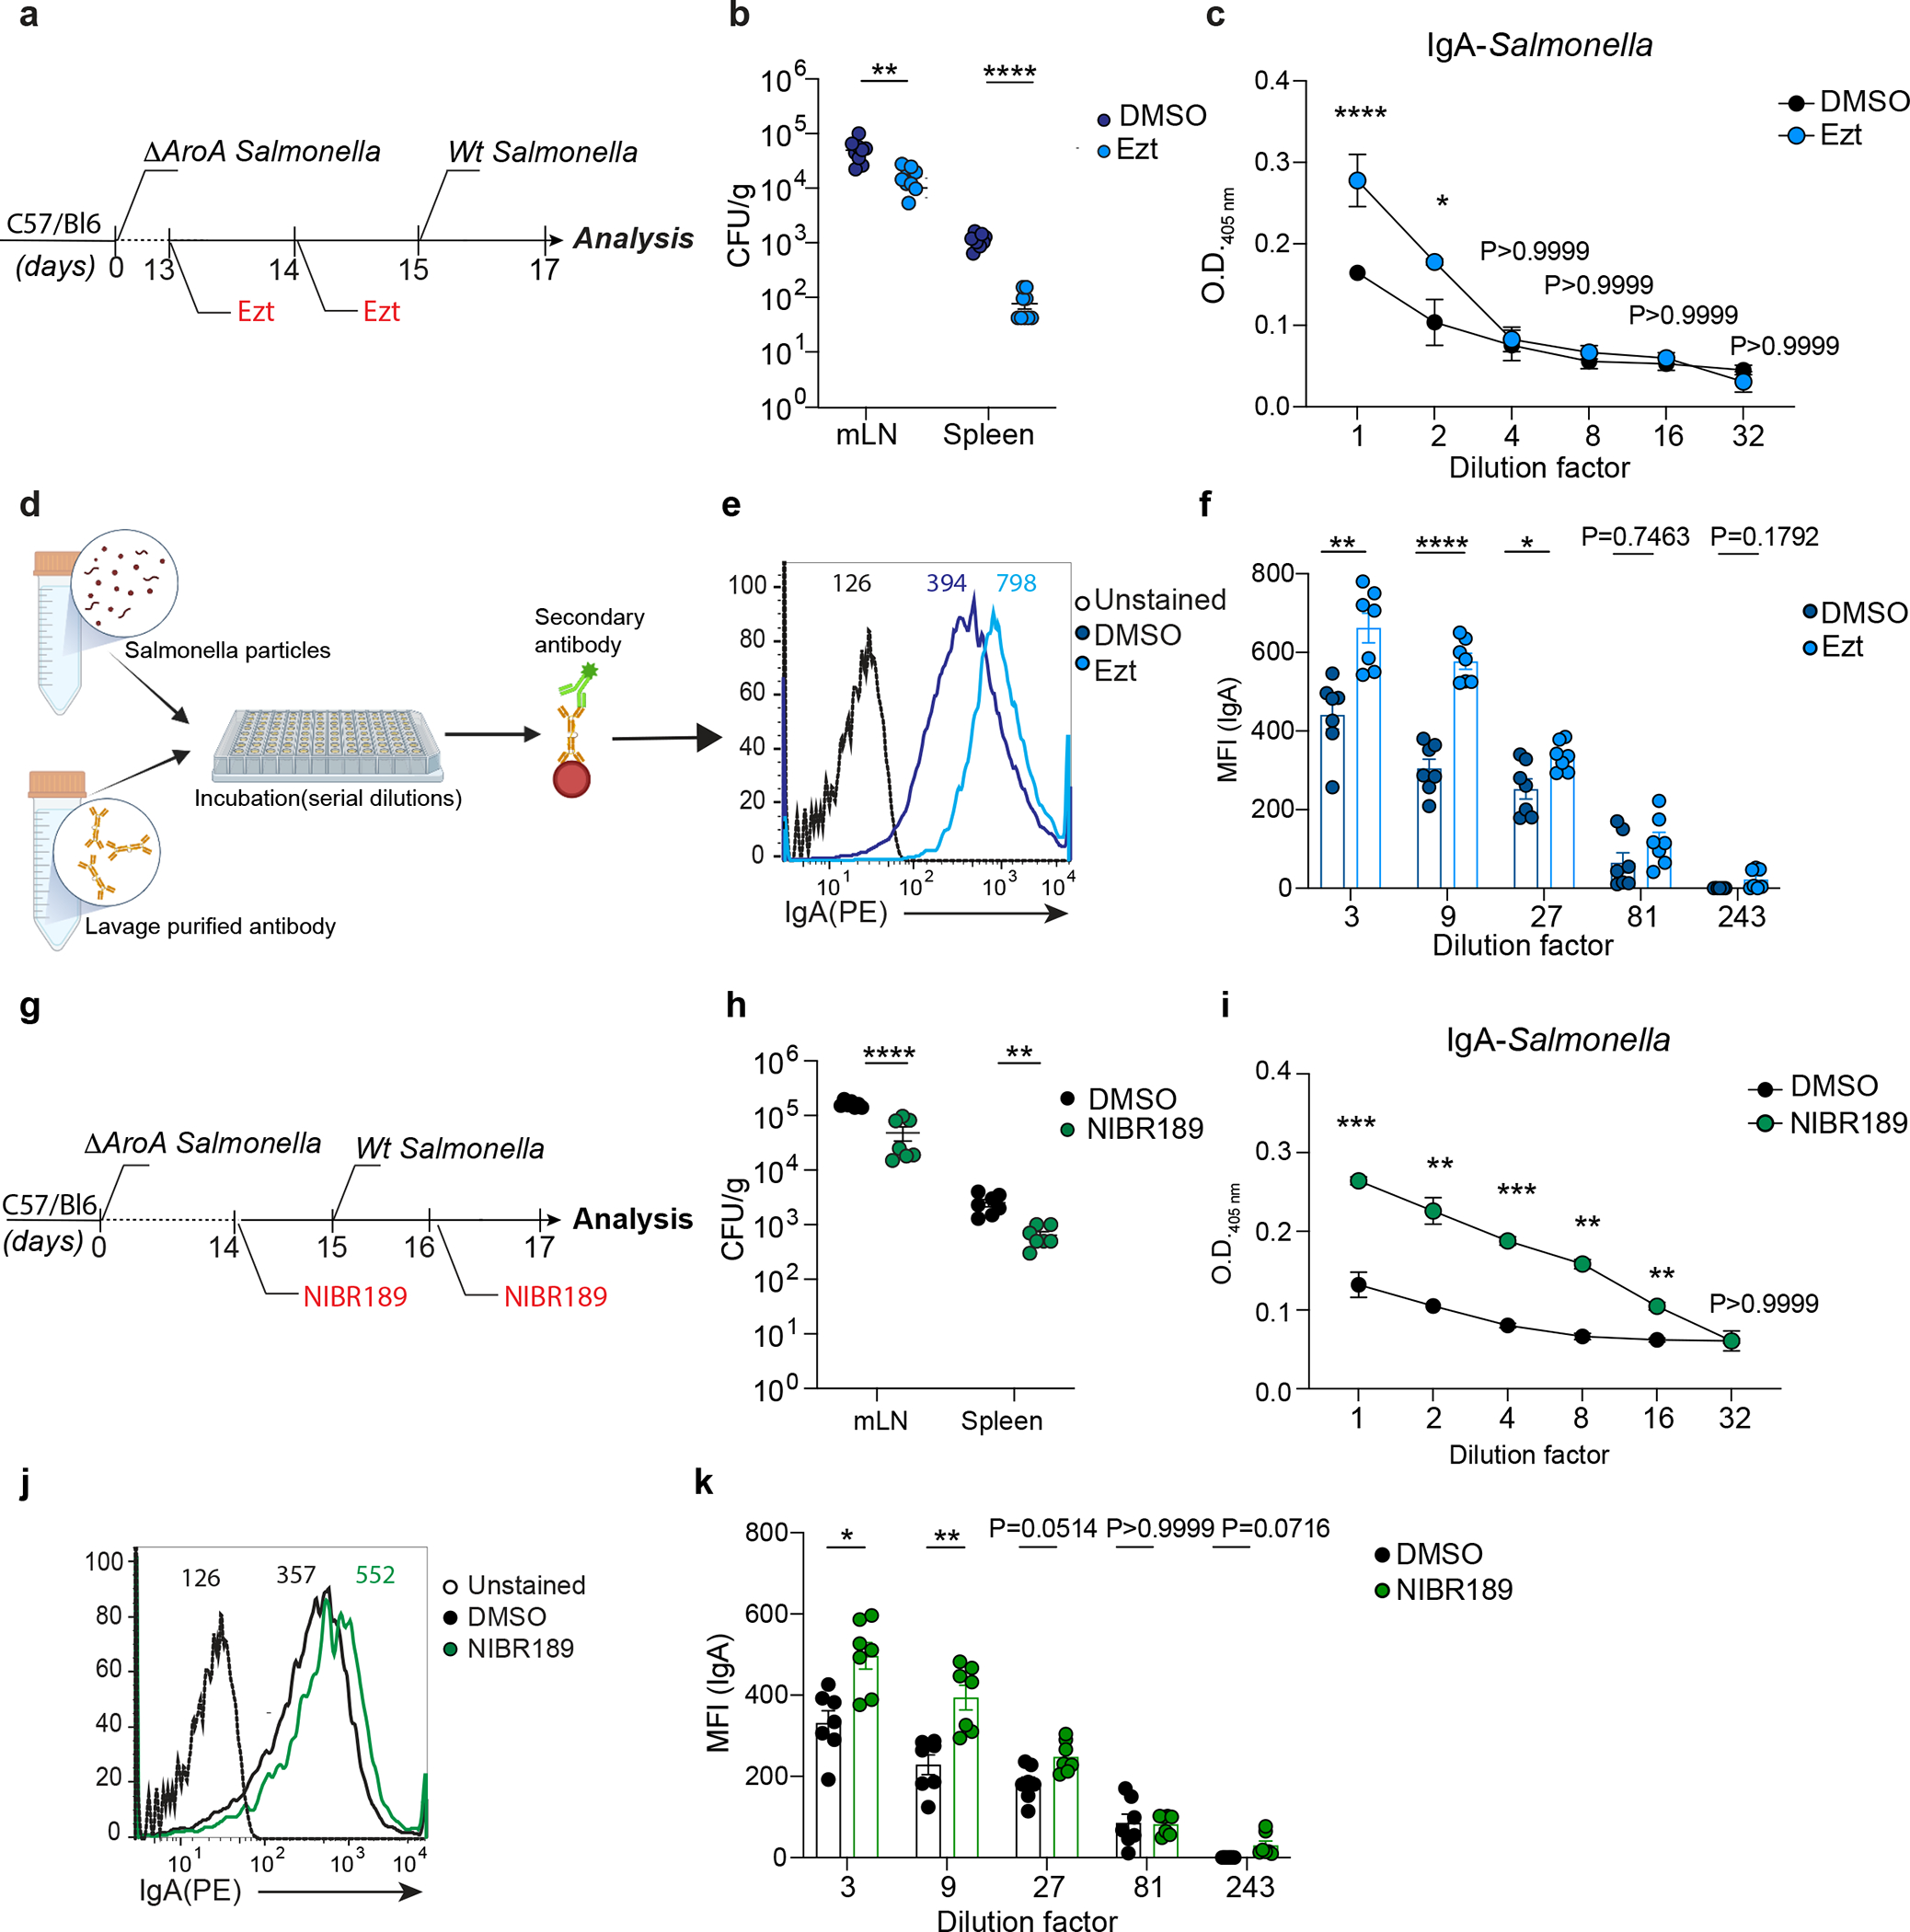
a, Experimental model illustrating the infection with ΔAroA Salmonella and after 2 weeks with Wt-Salmonella upon inhibition of cholesterol uptake by Ezt. b, Salmonella CFU quantification in the indicated organs from mice initially infected with non-invasive ΔAroA Salmonella, treated with Ezt or vehicle (DMSO) and challenge with a lethal dose of invasive Wt-Salmonella. c, ELISA for Salmonella-specific IgA quantification in intestinal lavages of mice treated with Ezt and infected with Salmonella (n=7). d, Diagrammatic representation of how a basic bacterial flow cytometry experiment is carried out with antibodies purified from intestinal lavages of mice orally infected with Salmonella. e, Representative flow cytometry (dilution 1:3) and compiled quantification (f) of Salmonella-specific binding IgA (MFI) in intestinal lavage of mice infected as in (a). g, Experimental model illustrating the infection with ΔAroA Salmonella and after 2 weeks with Wt-Salmonella in mice pretreated with the GPR183 agonist inverse, NIBR189 (Created with Biorender.com). h, CFU measurement of Salmonella in the indicated tissues harvested from mice infected as indicated in (g). i, ELISA of Salmonella-specific IgA in intestinal lavages of mice treated as in (g). j, Representative flow cytometry of Salmonella-specific binding IgA in intestinal lavages (dilution 1:3) of mice infected first with ΔAroA Salmonella and then with Wt-Salmonella upon NIBR189 treatment and compiled quantification of IgA (MFI)(k). The results were pooled from three independent experiments (b,f,h and k)(n=7 mice per group); (c)(n=4 mice per group); (i)( n=3 mice per group). Statistics were measured as two-sided unpaired Student’s t-test (*p<0.05,**p<0.01,***p<0.001,****p<0.0001)in (b,c,f,h,i and k). Exact P values and adjustments are provided in Source data. The error bars represent the mean ± s.e.m.
Immunized mice treated with Bortezomib before Salmonella infection showed reduced Salmonella-specific IgA (Supplementary Fig.5e–f) and increased Salmonella dissemination (Supplementary Fig.5g) indicating that modulation of secretion of Salmonella-specific IgA mediates outcomes upon Salmonella infection.
Together, our data reveal a tissue-restricted modulation of IgA secretion by PCs that is centered around dietary cholesterol metabolites, and that underpins humoral response against enteric infection.
DISCUSSION
In contrast to lymphocytes in secondary lymphoid organs, tissue-resident immune cells are heavily influenced by the environment and need to tune their function in response to local concentrations of nutrients and other physiological factors39. Such crosstalk has been mainly characterized in tissue-resident memory T cells where metabolic adaptations to both lipids and amino acids have been shown to shape their function40,41. Recently, it was reported that intestinal IgA secretion exhibits diurnal rhythmicity, which is independent by cell-intrinsic circadian clock and instead associated with feeding cues42. These findings suggest that general nutrient availability is potentially involved in IgA secretion by fueling IgA+ PC metabolism.: in line with this concept, in vitro experiments showed that glucose and leucine can boost IgA secretion. However, in vivo PC intrinsic requirements for nutrient sensing and IgA secretion were not tested, thus no mechanistic data currently exist regarding the tissue-derived signals that act on PCs and calibrate the humoral response at the intestinal barrier.
In this study, we identified an immune-metabolic circuit that rapidly tunes the secretion of commensal- and pathogen-reactive IgA, and that is dependent on IEC cholesterol metabolism. This IEC-PC circuit is centered on cholesterol metabolite production and sensing: the enzyme CH25H is necessary in IECs for the control of IgA secretion; conversely, cholesterol byproduct sensing by the Gαi-coupled receptor GPR183 connects intra-tissue zonation of IgA+ PCs with their ability to secrete antibody. Moreover, we identified microbiome detection via MyD88-dependent pattern recognition receptors and cholesterol absorption via NPC1L1 as requirements in IECs that underpin metabolic cues acting on IgA-secreting PCs.
Central to our investigation of the effect of oxysterols on LP PCs was the discovery that the surface level of the amino acid transporter CD98 identifies LP PCs with different in vivo Ab secretory abilities. It has been previously reported that CD98 is regulated by Blimp-1 levels29 and assures the supply of amino acids required for mTORC1 activity43, thus directly controlling Ab secretion29. However, the metabolic pathways in intestinal PC function remains unexplored. Our results suggested that three biological processes, cholesterol absorption, commensal recognition, and GPR183-dependent migration coordinate PC IgA secretion in the gut. Further studies will be needed to understand metabolic checkpoints involved in intestinal PC effector function.
In our model, the GPR183 ligand generated by IECs upon dietary cholesterol acts as a secondary messenger to inform tissue-resident PC of perturbations in the luminal environment. While cholesterol absorption is proportional to the cholesterol ingested, it also requires bile acid emulsification for efficient absorption44. In our experimental settings, rapid dietary modulations and Ch25h deficiency did not impact the bile acids; however, bile acid levels can be sensitive to commensal composition and abundance45,46. Thus, we posit that prolonged diet alteration or microbial fluctuations might also be relayed to PCs to tune IgA secretion with the contribution of bile acid. This mode of action for humoral immunity dovetails well with the need of a flexible, swift response to the rapidly changing luminal environment, and the polyreactive nature of IgA47 makes such a tunable system an attractive mode of microbial control without the need of a de-novo generation of antigen-specific PCs. Other tissue-resident immune cells that do not respond directly to antigen (i.e. ILCs) are known to detect alterations in the microenvironments, thus coordinating a faster immune response geared toward the maintenance of tissue homeostasis in anticipation or substitution of de-novo adaptive immunity48. We reasoned that in the future dietary interventions modulating cholesterol intake could be used to boost immune responses to enteric infections or to reduce unwanted intestinal inflammation during IBD28.
Our data showed that intestinal PCs respond to GPR183L by relocalizing and increasing IgA secretion. However, how PC migration and effector function are coupled via GPR183 remains unknown. Previous work has showed that GPR183 drives lymphocyte to niches that provide either soluble or membrane bound signals for cell fate decisions8. While PC are terminally differentiated cells, it is possible that their sensing of GPR183L might promote migration to microanatomical niche that support cellular processes underpinning heightened antibody production. Moreover, additional work will be required to identify additional migratory cues that allow for PCs localization when GPR183-GPR183L axis is reduced. In the future, increased sensitivity for analytic measurements of GPR183L and other oxysterols in discrete cell populations ex vivo, and enhanced granularity for cholesterol metabolite spatial assessment in vivo will be critical to map local modulation of lipid byproducts upon dietary or microbial changes.
We have previously shown that a high cholesterol diet negatively impacts GC B cell activation and PC differentiation in Peyer’s patches via 25-HC production by follicular dendritic cells to restrain the sterol sensor SREBP29.Together with the current study, our results uncover a complex interaction of diet-derived oxysterols with the IgA response. We posit that both processes coordinate an overall reduction in IgA upon exposure to a cholesterol-rich diet. While tissue-resident PCs respond to rapid changes in cholesterol absorption by transiently modulating IgA secretion, longer exposure to dietary cholesterol reduces PC differentiation in Peyer’s patches to halt the de-novo generation of IgA.
While immunological complications of hyperlipidemia and obesity have been described in the context of chronic metabolic dysregulation49, mechanisms that integrate fluctuations in nutrient absorption with the response of tissue-resident immune cells have been largely overlooked50. Our study raises the possibility that chronic exposure to cholesterol metabolites might reduce the fraction of commensal species coated by IgA over time28 and contribute to the dysbiosis observed in obesity49. Thus, our findings provide a new model to understand the humoral response in individuals exposed to a high cholesterol diet.
Material and Method
Human subjects and isolation of fractions
This study was done in accordance with the ethical guidelines of the Washington University’s Clinical and Translational Research23. Blood obtained from healthy volunteers was covered by the IRB protocol #201712103 to G.J.R. All samples were collected after providing written informed consent and they were handled anonymously. Blood samples (10 mL, EDTA tubes) were collected immediately before the meal was consumed (t=0, baseline) and at 15, 30, 45, 60, 90,120, 150, 180, 240, 300, and 360 minutes after meal initiation while participants reclined in a hospital bed. Chylomicrons and “non-chylomicron” fractions were isolated as described26.
Mouse Models
C57BL/6J (CD45.2) (Stock No: 00064), Ly5.2 (CD45.1) congenic C57BL/6 (B6) (Stock No: 002014), Villincre(Stock No: 031792), Villincre/ERT2 (stock No: 020282), Ch25h−/− (Stock No: 016263), Cyp27a1tm1Elt (Stock No: 009106), Aicdacre (Stock No: 007770), Rosa26flox-Stop-flox-tdTomato (AI14)(Stock No: 007914), C57BL/6-Tg(UBC-GFP)30Scha/J (Stock No:004353), B6;129S-Nr1h1tm1Djm/J(stock No:014635), Rosa26Stop-Cas9-EGFP(Stock No:024858),Ch25hflox/flox, Prdm1YFP(Stock No: 008828), muMT(stock No: 002288), B6.Cg-Gt(ROSA)26Sortm14(CAG-tdTomato)Hze/J (Stock No 007914) were purchased from the Jackson Laboratory. Gpr183flox/flox, C57BL/6 (B6) Ebi2GFP/+ were previously described51,52. Ch25h floxed mice were generated by inserting loxP sites 690bp 5’ and 20bp 3’ of the single coding exon. LoxP sites were inserted using CRISPR-EZ53 using ultramer guides (Dharmacon). Homology arms flanking each loxP element were 500–600bp. All mice were bred and maintained under standard 12:12 hours light/dark conditions, at the temperature of 18–23°C with 40–60% of humidity and housed in specific pathogen-free (SPF) facility at the University of Massachusetts Chan Medical School. Unless noted, both female and male mice were analyzed at 7–12 weeks of age. All procedures were conformed to ethical principles and guidelines approved by the UMass Chan Institutional Animal Care and Use Committee.
Mouse Diets
Mice were either fed a standard chow diet (ProLab Isopro RMH3000, #5P76), a 2% cholesterol diet (Envigo, # TD.200179) or a diet containing no cholesterol and animal-derived fats (Envigo, #TD.2918.15) (referred as vegetarian food)
Infections and treatment
Non-replicative (ΔAroA) S. Typhimurium strain SL1344 was provided by Milena Bogunovic laboratory at UMass Chan Medical School and was grown at 37°C in Luria broth supplemented. Mice were orally gavage three times on alternate days or once when indicated with 109 CFUs of ΔAroA Salmonella in 200 μl 5% sodium bicarbonate. Serial dilutions of bacterial preparations were plated onto LB-agar plates to confirm administered dose. Wild type invasive strain (Wt-Salmonella) was grown following the above protocol. To determine the invasive activity of Wt-Salmonella, mice were fed once with 109 Salmonella and after 48 hours evaluation of bacteria colonization was addressed as described below. For lethal dose challenges, mice were first fed with one dose of 109 CFUs of ΔAroA Salmonella and after two weeks injected i.p. with 105 CFUs of Wt-Salmonella.
For the depletion of intestinal PC mice were treated once with 0.8mg/kg (body weight) of Bortezomib (MCE MedChemExpress,#HY-10227/CS-1039) and after 24 hours injected with about 1×10⁶ intestinal lamina propria cell suspension. Ezetimibe (10 mg/kg body weight, Sigma,#SML1629), PL81 (3% vol/vol, Sigma,#435430), PL407 (3% vol/vol, Sigma,#16758) were orally gavaged. Orlistat (50mg/kg body weight, Sigma,#O4139), NIBR189 (1.5mg/kg, Avanti Polar lipids, #857397P), Mevastatin (20mg/kg body weight, Sigma, #M2537) were given i.p.
Quantification of Wt-Salmonella Colonization
Intestinal lavages from single mice infected with ΔaroA (2 weeks) were collected and homogenized in 3 mL of sterile PBS after Wt Salmonella (48hrs) infection. Serial dilutions of the suspension were plated onto MacConkey agar plates supplemented with 50μg/mL of streptomycin. Mesenteric lymph-nodes and spleen were collected, weighed and homogenized in sterile PBS at a concentration of 100mg/ml. Cells were mechanically lysed and plated onto MacConkey agar plates for colony-forming unit quantification [CFU].
Salmonella-specific IgA binding
Anti-Salmonella IgA response was analyzed by flow cytometry as previously described3,54. Briefly, 105 GFP+ Salmonella particles were first stained with ex-vivo intestinal IgA, followed by anti-mouse IgA and analyzed by flow cytometry.
Evaluation of S-IgA effect on Salmonella grown
Intestinal lavages were processed as previously described55. Samples were serially diluted in Luria broth containing 50μg/mL of streptomycin and 105 GFP-Salmonella and incubated overnight at 37°C. After 16 hours Salmonella number was measured by flow cytometry.
Retroviral constructs
For retroviral transduction, PlatEcells were transfected with murine stem cell virus (MSCV) retroviral constructs encoding a tamoxifen-regulated form of Cre recombinase and two estrogen receptor T2 (ERT2) genes (ERT2-cre-ERT2). For transduction of BM-derived cells, BM cells from Rosa26lox-stop-lox-tdTomatoGpr183flox/flox mice and littermate control mice were harvested 4 days after 5-flurouracil (Sigma, #F6627) injection and cultured in the presence of recombinant f 20 ng/ml of IL-3, 50 ng/ml of IL-6 and 100 ng/ml of mouse stem cell factor (SCF) (Peprotech). BM cells were spin-infected twice with the retroviral construct expressing Thy1.1cassette as a reporter. One day after the last spin infection, the cells were injected into lethally irradiated C57BL/6 recipients.
Cell line culture
Human embryonic kidney (HEK) 293T cells (SigmaAldrich, #12022001) were grown in a monolayer at 37°C and 5% of CO2. Cells were maintained in DMEM supplemented with 100 units/mL penicillin and 100 μg/mL streptomycin sulfate supplemented with 5% fetal bovine serum (FBS) and 10mM of HEPES (pH 7.2). Before transfection, 1.5×10⁵ cells were transferred in 24 well plates and were sequentially transfected with 500ng/well of MSCV retroviral constructs encoding full-length mouse Cyp7b1 or Hsd3b7 with Lipofectamine 2000 (Invitrogen) following the manufacturer’s protocol. Plat-E cells (Cell Biolabs,# RV-101)were grown as a monolayer in DMEM supplemented with 100 units/mL penicillin and 100 μg/mL streptomycin sulfate supplemented with 5% fetal bovine serum (FBS) and 10mM of HEPES (pH 7.2). L-WRN cells (ATCC, #CRL-3276) were used for making organoid conditioned media as described below56. Briefly, L-WRN cells were cultured in DMEM/F12 media supplemented with 20% FBS to support the secretion of recombinant factors from cells and the growth of epithelial organoids.
Collection of lymphatic fluid from mouse
200 μl of oil was administered by gavage to mice 3 hours before euthanasia. Lymph was collected from cisterna chyli of mice after 3 hours of food gavage, by using a glass capillary. 5μl of collected lymph was used for lipid extraction.
Isolation of Intestinal Epithelial cells
SI was harvested from mice, flushed with PBS, divided into three equal parts, cut open longitudinally, and incubated with 10 mM EDTA and 1 mM DTT for 30 minutes at 37C in rotation movement. Supernatant was then passed through a 100-micron filter and centrifuged at 350×g for 5 minutes. For RNA, IECs were then resuspended in Trizol, homogenized by passing repeatedly through a 25-gauge needle, and stored at −80°C until RNA was isolated. For Flow cytometry, after centrifugation IECs were resuspended in flow cytometry buffer (PBS plus 2% fetal calf serum, 2mM EDTA, and 0.05% sodium azide) before treating with anti-CD16/32 antibodies (2.4G2, Biolegend, used 1:200) and staining with antibodies against CD326 (G8.8, ebioscience, used 1:1000), CD45 (30-F11, Biolegend, used 1:500), and fixable dye (65–0865-14, ebioscience, used 1:10000). Data were collected on an LSRII (BD Biosciences) and analyzed using FlowJo software. The purity of IEC isolations was repeatedly assessed for RNA experiments and was consistently 95–99% of CD45- IECs.
Intestinal Organoids
SI organoids were generated as previously described56. Briefly, Digested SI was mechanically disrupted with a syringe. The resulting supernatants were passed through a 100-micron filter and crypts were enriched by repeated centrifugation at low speeds. Crypts were then embedded in Matrigel (Corning, # 356234) in 24 well plates. Organoids were incubated for 5 days in Advanced DMEM/F12 (Life Technologies) supplemented with glutamine, penicillin/streptomycin, HEPES (pH 7.2) and 50% conditioned media from L-WRN conditioned media (CM) containing 10μM Y27632 and 10μM SB431542. Once differentiated, organoids were trypsinized and 2×10⁵ cells were plated in a 96 well plate and treated for 24 hours with the indicated treatments.
Isolation of Intestinal Lamina Propria
The SI was divided into 3 equal parts, the proximal (duodenum) and distal (ileum) were opened longitudinally and vortexed in a 50ml conical tube containing HBSS supplemented with 5% heat-inactivated FBS and 10mM HEPES (pH 7.2). Epithelial cells were removed by rotating the small intestine tissue in pre-digestion media (RPMI medium, 5% heat-inactivated FBS, 10mM HEPES (pH 7.2), 10mM EDTA) for 30 minutes at 37°C. The intestinal pieces were then washed with complete media (10% heat-inactivated FBS, 10 mM HEPES (pH 7.2), 1% pen strep), chopped with scissors, and digested at 37°C for 30 minutes in digestion media (RPMI medium, 5% heat-inactivated FBS, 10mM HEPES (pH 7.2), 1mg/mL of Collagenase IV(Worthington Biochemical,#LS004189), 25mg/mL of DNase I (Sigma,#DN25)). Digested tissue was passed through 70 um cell strainer and isolated cells were resuspended in 40% Percoll-RPMI and layered with 80% Percoll-RPMI and subsequently centrifuged for 20min at 650g. The isolated LP cells were enumerated on a BD LSRII using AccuCheck Counting Beads (Invitrogen) as per manufacturer recommendations and subjected to ELISPOT analysis or Flow cytometry. For flow cytometry cells were fixed and permeabilized in BD Fix/Perm kit (BD) and incubated for 20 minutes on ice with antibodies to CD45.2 (30-F11, Biolegend,), B220 (RA3–6B2, Biolegend) (used 1:500), TCRβ (H57–597,Biolegend, used 1:200), CD98 (RL388,Biolegend, used 1:1000), IgA (polyclonal, Southern Biotech, used 1:1000), IRF4 (Clone 3E4, Invitrogen, used 1:200) and Igk (Clone RMK-45, Biolegend, used 1:400).Data were collected on a BD LSR II and analyzed in FlowJo v10.7 software. For PC sorting, cells were gated on TCRβ−B220−CD98+ and collected for RT-PCR and ELISPOT.
Isolation of gut lymphoid tissues and Bone Marrow
Peyer’s patches and mLN were digested in digestion media (RPMI, 5% heat-inactivated FBS, 10 mM HEPES (pH 7.2), 1% pen/strep, 25mg/mL DNase I (Sigma,#DN25), and 0.5 mg/mL Collagenase IV (Worthington Biochemical,#LS004189) rotating at 37°C for 15 minutes. The digested tissue was then smashed through 70μm cell strainers. BM was harvested and cells were flushed with an insulin syringe and cells were filtered through a 70μm cell strainer. Single-cell suspension was then washed with FACS buffer (1X DPBS, 2% heat-inactivated FBS, 2mM EDTA) and counted for further analysis. Cells were incubated for 20 min on ice with antibodies to B220 (Clone RA3–6B2, Biolegend), IgG1 (RMG1–1,Biolegend), IgG2b (R12–3, Biolegend,IgA), IgG3 (R40–82, BDBioscience), GL7 (GL7, Biolegend), GL7 (GL7, Biolegend), CD138 (281–2, Biolegend), CD38 (90, Biolegend), CD45.2 (30-F11,ebioscience) (all used 1:500), IgA (polyclonal, Southern Biotech and IgD (11–26c.2a, Biolegend)(used 1:1000). Data were collected on a BD LSR II and analyzed in FlowJo v10.7 software.
Immunofluorescence
SI was harvested and immediately fixed at 4°C in Phosphate buffer (PB) containing 4% PFA overnight, followed by 2 hours of washing in PB and overnight incubation at 4°C in a solution of 30% sucrose in PB. Tissues were embedded in optimum cutting temperature compound and cut into 5 mm sections using a Leica Cryostat Microtome. 7μm sections were blocked with specific serum and 5% of BSA. Samples were stained with Rabbit anti-Red Fluorescence protein (RFP), Goat anti-mouse IgA (C10–3, BD Biosciences, used 1:500), Rat anti-mouse LYVE1 (223322, RD system, used 1:100), Rat anti-CD326 (G8.8, Biolegend, used 1:200), followed by Cy3 anti-goat Donkey (polyclonal, Jackson ImmunoResearch Lab, used 1:1000), AF647 anti-rat Goat (polyclonal, Jackson ImmunoResearch Lab., used 1:1000) and DAPI. Incubations were performed in TBS containing 5% BSA, 10% normal mouse serum and 0.1% Triton X-114. Sections were mounted in Fluoromount-G (SouthernBiotech, #0100–01) and imaged on a Zeiss fluorescent microscope using a 20X objective with a numerical aperture of 0.8. 3D pictures were generated from 30 μm sections acquired by using a ZEN module Z-stack. 15–25μm of focal planes was combined to generate 3D display of tissue rotating on the y axis.
Oil Red oil stain
Oil Red O staining was performed as described25. Oil Red O solution working solution (Sigma,#00625) was freshly prepared and filtered before covering the sections. Sections were incubated for 15 minutes at RT, then washed under running tap water for 30 minutes. Sections were then mounted on slides with aqua mount mounting medium and images were captured as described above.
RNA isolation and Real-Time PCR
RNA from IECs and organoids was isolated by following TRIzol extraction manufacture protocol. Total RNA was used for RT-PCR. cDNA was generated using iScript Reverse Transcription Supermix (Invitrogen,# 18080–044). For quantitative RT-PCR, cDNA was mixed with appropriate primers (Supplementary Table 3) and SYBR green master mix (BioRad,# 1708882) and run on a Termocycler T100(BioRad).
16S rRNA gene sequencing
DNA was extracted from mice stool with the DNeasy Powersoil Pro Kit (Qiagen) according to the manufacturer’s protocol. The bacterial 16S rRNA gene (variable regions V3 to V4) was subjected to PCR amplification using the universal 341F and 806R barcoded primers for Illumina sequencing. Using the SequalPrep Normalization kit, the products were pooled into sequencing libraries in equimolar amounts and sequenced on the Illumina MiSeq platform using v3 chemistry for 2 × 300 bp reads. The forward and reverse amplicon sequencing reads were dereplicated and sequences were inferred using dada257. Differential microbiome analysis and visualization were performed in ‘R’ using DESeq258.
Lipid quantification
Oxysterols:
Lipids from tissues and IEC were extracted using the Folch method for lipid extraction14. Briefly, tissues were weighed, homogenized in serum-free media containing 0.5% of BSA and prepared at a concentration of 100mg/mL. Total lipids were extracted by adding 20 volumes of a mixture of chloroform/methanol (2:1). Then, samples were filtered, mixed and left on ice until two liquid phases are formed. The chloroform fraction was transferred to a new tube and dried by using N2.
Lyophilized lipid was dissolved at 100 mg/ml in ethanol. 25-HC was measured by using HEK 293T cells supernatant from cells transfected with Hsd3b7 or Cyp7b1 as described above. Next, the 7α,25-HC activity was evaluated by transwell chemotaxis assay. Thus, lipid extracts were diluted in 10 volumes of sterile chemotaxis media (RPMI + 0.5% fatty acid-free BSA) and tested for GPR183 dependent bioactivity by seeding on transwell 50:50 mixed M12 B cell line transduced with an GPR183 -IRES-GFP retroviral construct and mock M12 cells. The migration assay was performed at 37°C for 3 hours and cells were analyzed by flow cytometry. The migration of GPR183-GFP+ M12 cells over M12 cells (which indicate the relative concentration of the GPR183 ligand, 7α,25-HC) was normalized to the migration toward lipid-free migration media and indicated in the text as “Relative migration (A.U.) ”. The purified 7α,25-HC was used as a positive control at a concentration of 100nM.
Triglycerides(TG):
Triglyceride concentration was measured in chylomicron and VLDL using the Wako L-type TG M test (Fujifilm Wako Diagnostics) and normalized for the lipid standard.
Enzyme-linked ImmunoSorbent Assay (ELISA)
Ninety-six–well high binding flat-bottom plates (Corning) were coated with 25μl of 2 μg/ml purified anti-IgA (RMA-1, BD Bioscience) or 106 CFU/ml of heat-killed Salmonella (obtained at 56°C) diluted in PBS overnight at 4°C. Plates were washed and blocked with PBS+5% BSA before diluted intestinal wash or fecal samples were added and threefold serial dilutions were made. Clear intestinal lavage samples were processed and incubated overnight at 4°C. Bound antibodies were detected by anti-IgA-conjugated horseradish peroxidase (polyclonal, Southern Biotech) and visualized by the addition of TMB substrate set (Biolegend,#421101). Color development was stopped with 3 M of H2SO4 stop solution (Biolegend). Unlabeled mouse IgA (Southern Biotech, #0106–01) served as standard. Absorbances at 450 nm were measured on a tunable microplate reader (VersaMax, Molecular Devices). Antibody titers were calculated by extrapolating absorbance values from standard curves where known concentrations were plotted against absorbance using SoftMax Pro 5 software.
Bile acids quantification
Intestinal lavages were centrifugated at 12000×g per 15 minutes at 4°C. Supernatant was transferred into a new tube and diluted 5, 10 and 20-fold in deionized water. Quantification of bile acids was addressed by using a colorimetric assay and following the manufacture’s protocol (Cell Biolabs,Inc. #STA-631).
Measurement of Lipoprotein lipase activity
Lipoprotein lipase activity was analyzed in duodenum lamina propria by following the manufacturer’s protocol (Cell Biolabs,#STA-610). 100mg of duodenum devoid of IECs were homogenized in 1 mL of cold, 20 mM Tris (pH 7.5), 150 mM NaCl and centrifugated at 10,000×g for 10 minutes at 4°C. The supernatant was carefully collected and diluted at 1:100 or greater in 1X LPL Assay Buffer before assaying. The fluorometric intensity was measured in a 96-well fluorescence microtiter plate and by a fluorescence microplate reader equipped for excitation in the 480–485 nm range and emission in the 515–525 nm range. Results were measured by using an LPL enzyme standard.
ELISpot
ELISpot plates (Millipore) were coated with 100μl of 2 μg/ml purified anti-IgA (RMA-1, BD Bioscience) in PBS overnight at 4°C. Plates were washed three times with PBS then blocked for 2 hours at 37°C with 10% FCS-RPMI. Cells were isolated from BM and LP and counted as described above then diluted with 10% RPMI in blocked ELISpot plates and incubated 12 hours in a 37°C and 5%CO2 tissue culture incubator. The next day, plates were washed three times with PBS-0.1% Tween then PBS. Detection of and antigen-specific IgA spots was achieved by using anti-IgA-conjugated horseradish peroxidase (polyclonal, Southern Biotech,used 1:2000) and developed with 3-amino-9-ethyl carbazole (Sigma-Aldrich). Color development was stopped by washing several times with water. Once dried, plates were scanned, and spots counted using the CTL ELISPOT reader system (Cellular Technology).
Immunoblotting
Protein extract from IECs were prepared using RIPA Lysis Buffer (Thermo Fisher, #89900) and proteinase inhibitors (Roche, #11836153001). Then, 10mg of extract was resolved by SDS-PAGE and CH25H was quantified by immunoblotting with anti-CH25H (Bioss antibodies, #Bs6480R, used 1:500), followed by incubation with HRP-conjugated anti Rabbit antibody (Jackson Labs, #711–035-152) and ECL detection kit (GE healthcare, #RPN2232). Anti-β-actin (13E5, Cell signaling, used 1:2000) and anti-EpCam (G8.8, Biolegend, used 1:1000) antibodies were used to ensure equal protein loading.
Statistical analysis
Statistical tests were selected based on appropriate assumptions with respect to data distribution and variance characteristics. The exact values of n indicating the total number of animals or human participants per group are reported in each figure and figure legend. Statistical significance was defined as P<0.05. Student t-test, one way ANOVA or Two ways ANOVA with Bonferroni corrections were performed as depicted in the Figures. Asterisks indicate statistical significance (* p < 0.05; ** p < 0.01; *** p < 0.001; **** p < 0.0001; non-significant with indicated P values). Individual values for each animal are plotted as dots and bars represent the mean+-SEM of each group. Analyses were carried out using Prism software v. 7.0 (GraphPad).
No statistical methods were used to pre-determine sample sizes but our sample sizes are similar to those reported in previous publications (ref x,y,z). Data collection and analysis were not performed blind Data distribution was assumed to be normal, but this was not formally tested.
Extended Data
Extended data Fig. 1: 7α,25-HC production is mainly restricted to the duodenum.
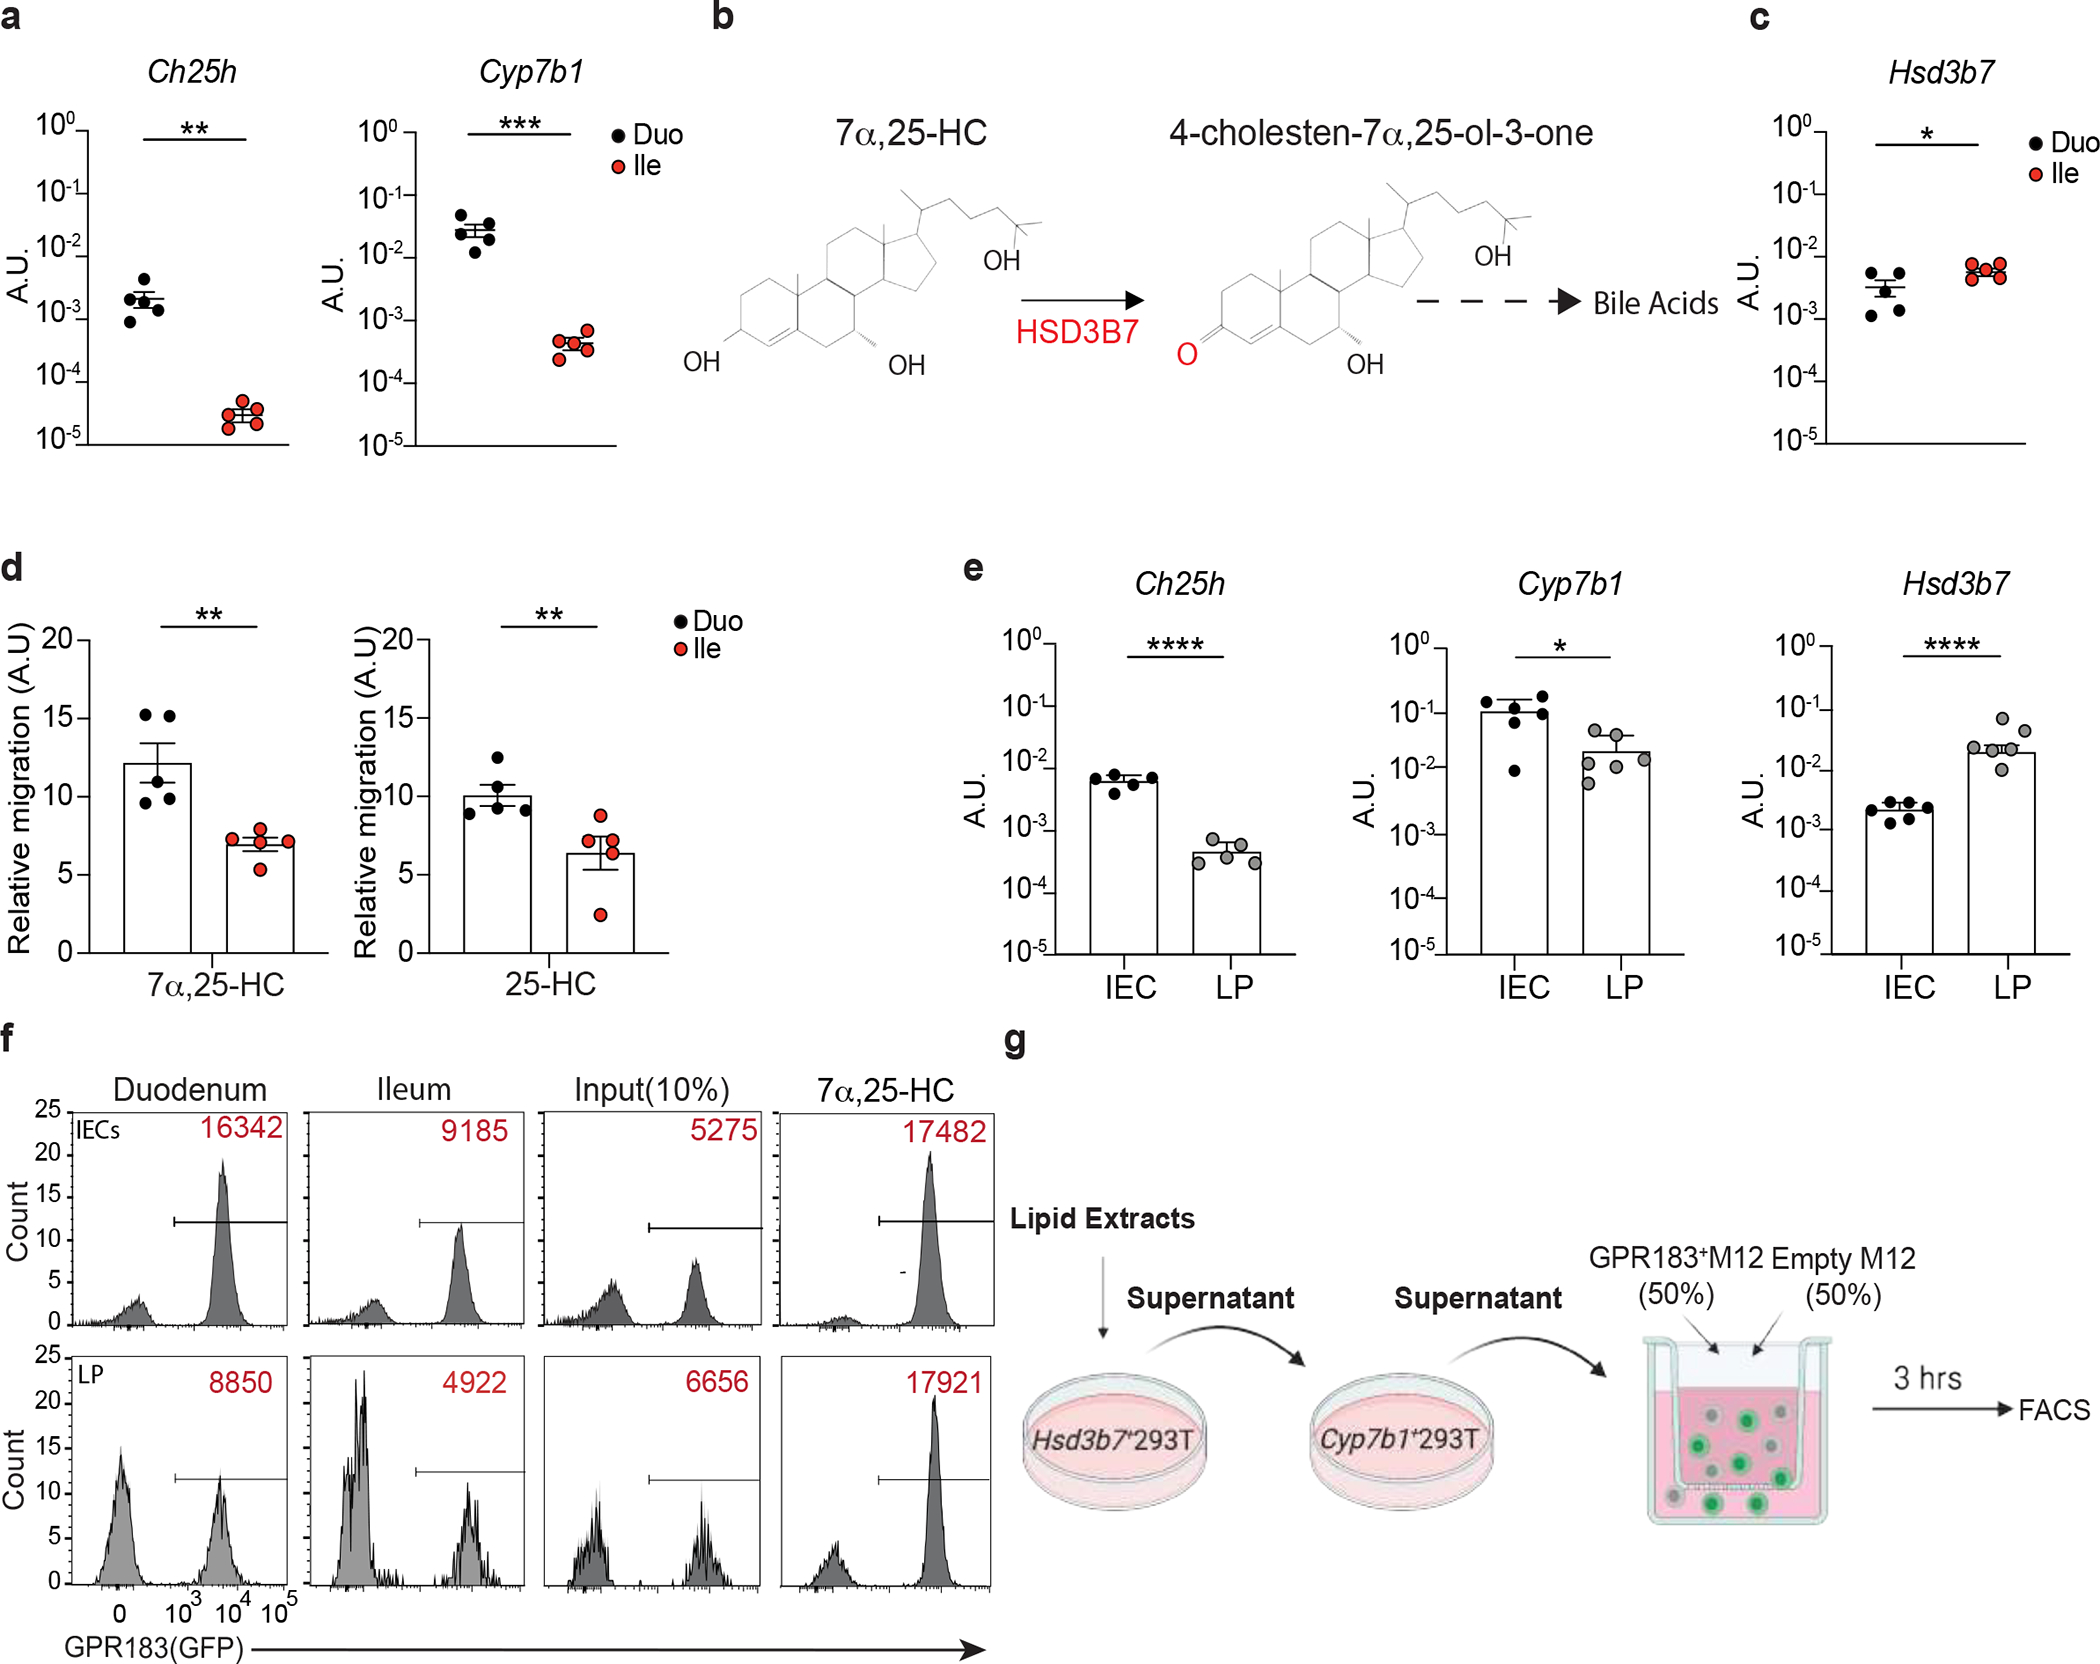
a, Ch25h and Cyp7b1 mRNA expression (A.U.) in duodenum and ileum of C57BL/6 mice. b, 7α,25-HC reduction in bile acids precursor (4-cholestern-7α,25-ol-3-one) by HSD3B7. c, Hsd3b7 mRNA expression (A.U.) in duodenum and ileum of C57BL/6 mice. d, Relative migration of GPR183+ cells with tissue lipid extracts from duodenum and ileum. e, mRNA quantification of Ch25h, Cyp7b1, Hsd3b7 in IECs and LP of C57BL/6 mice. f, Representative flow cytometry plot and number of GPR183+ cells migrating upon exposure to lipid extracts from duodenal and ileal IECs and lamina propria used in Figure 1c,d. g, Schematic depiction of in vitro 25-HC quantification strategy. The results were pooled from three independent experiments (a,c,d and e)(n=5 mice per group). Statistics were measured as two-sided unpaired Student’s t-test (*p<0.05,**p<0.01,***p<0.001) in (a,c,d and e) with Bonferroni’s correction. Exact P values and adjustments are provided in Source data.The error bars represent the mean ± s.e.m.
Extended data Fig. 2: Inhibition of chylomicron production reduces 7α,25-HC, but not 25-HC, in the lymph.
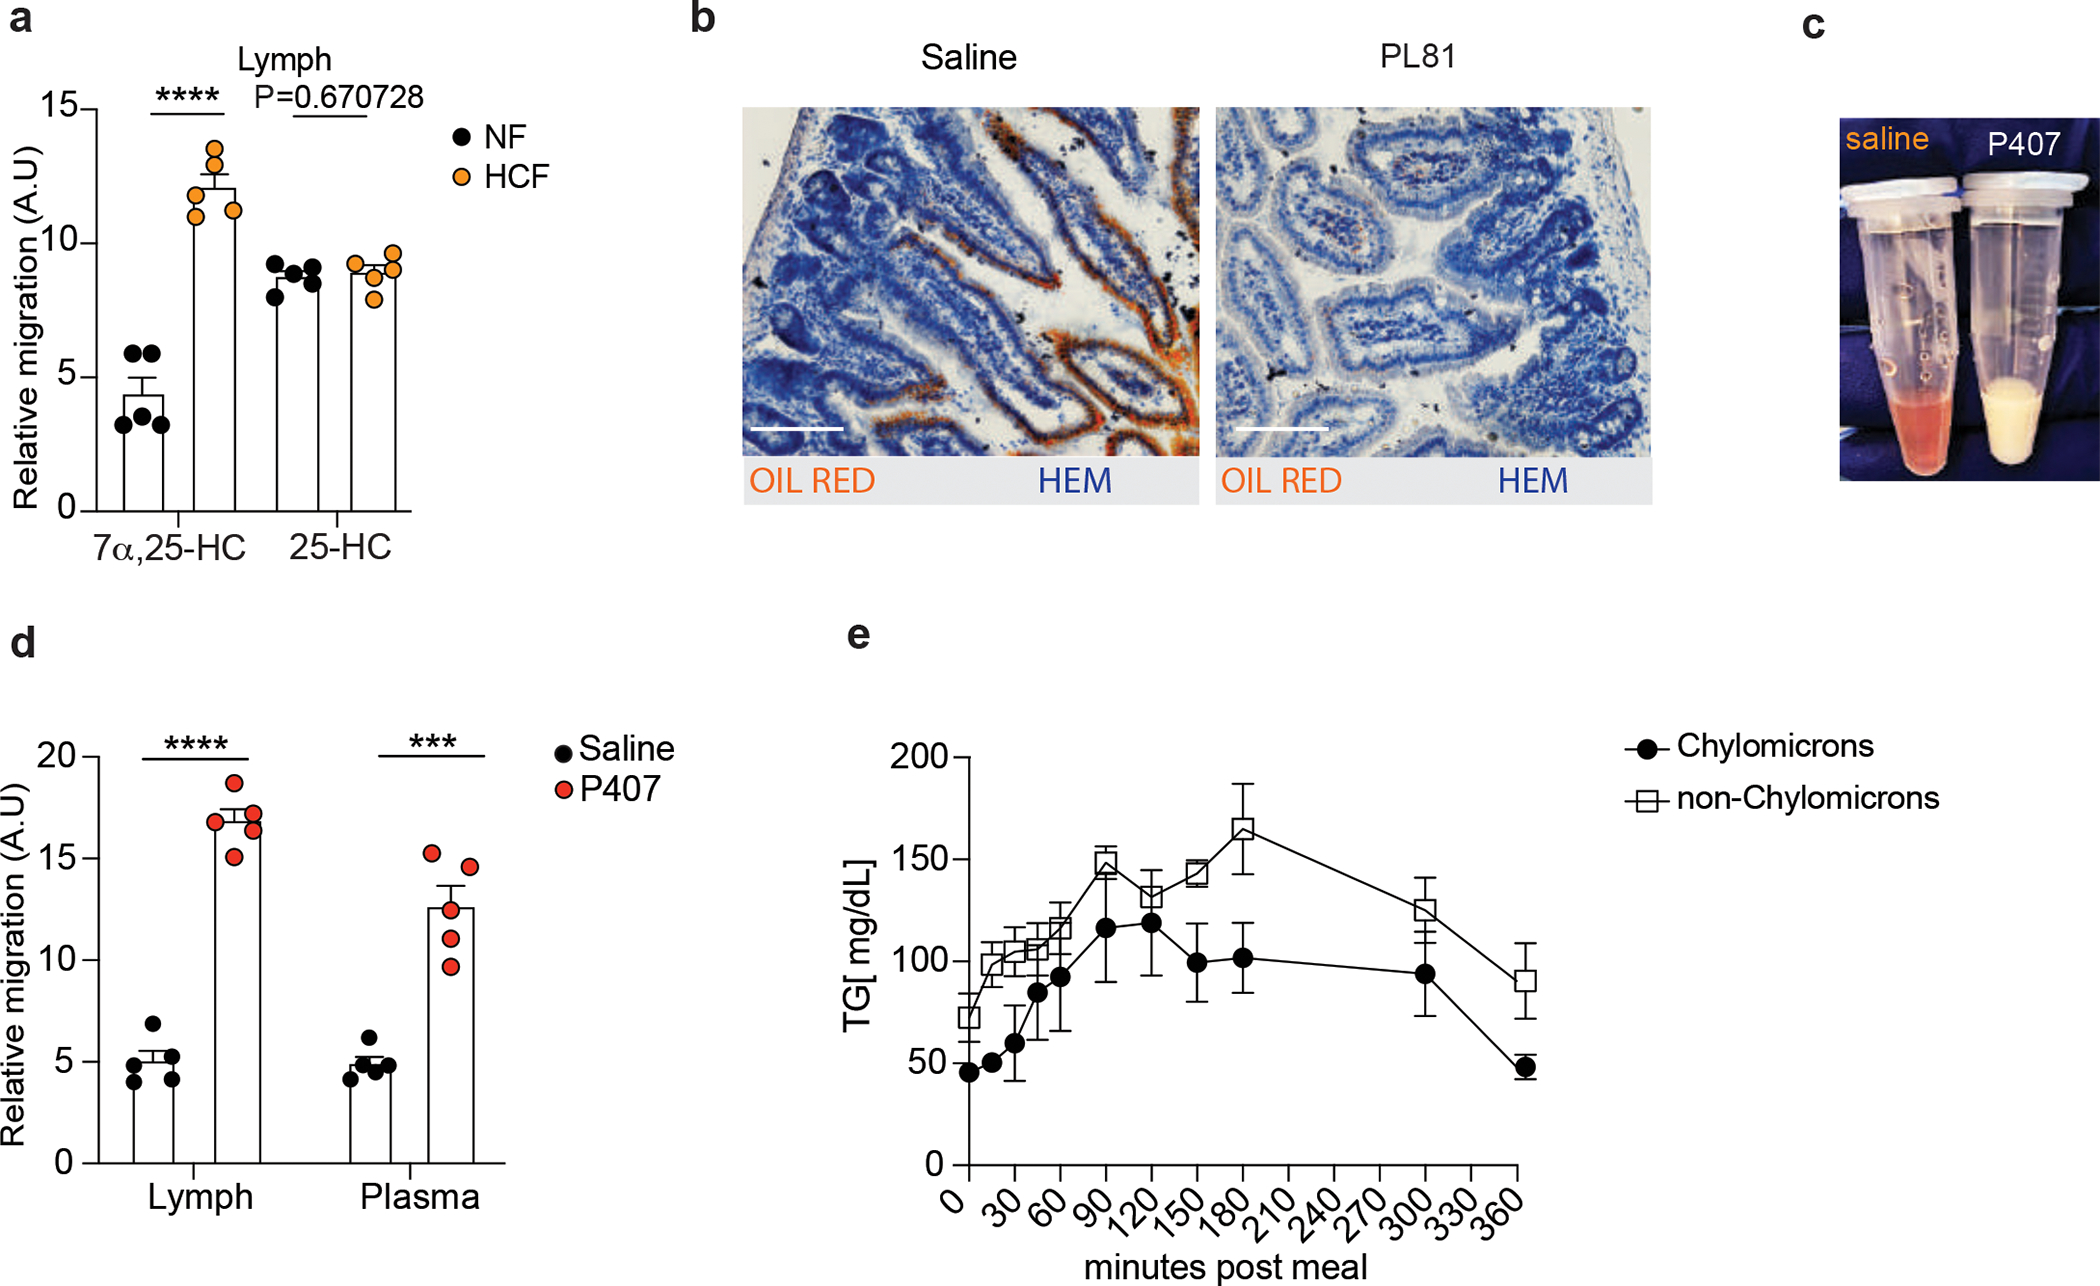
a, Quantification of GPR183 ligand (Lipid) and precursors (LipidHsd3b7+Cyp7b1) in lymph of mice treated for 24 hours with NF or HCF. b, Representative staining of lipids by Oil Red O and Hematoxylin counterstaining of 7μm duodenum section from mice treated with 3% of PL81 (vol/vol) or vehicle (saline). Scale bar is 100μm. c, Plasma of mice untreated (red-clear apparency) or treated (milky apparency) with Poloxamer 407 to prevent chylomicrons clearance. d, M12 migration assay with lipid extracts (GPR183 ligand) from lymph and plasma of mice upon Poloxamer 407 or saline treatment. e, Triglycerides (TG) quantification in chylomicron and non-chylomicron fractions isolated from human plasma at the indicated time after exposure to lipid-based meal. The results were pooled from three independent experiments (a and d)(n=5 mice per group); (e)(n=3 biologically independent samples). Statistics were measured as two-sided unpaired Student’s t-test (***p<0.001,****p<0.0001) in (a,d) and two-way ANOVA with Bonferroni’s correction (***p<0.001, ****p<0.0001) in (e). Exact P values and adjustments are provided in Source data. The error bars represent the mean ± s.e.m.
Extended data Fig. 3: 25-HC pathway controls duodenum IgA secretion.
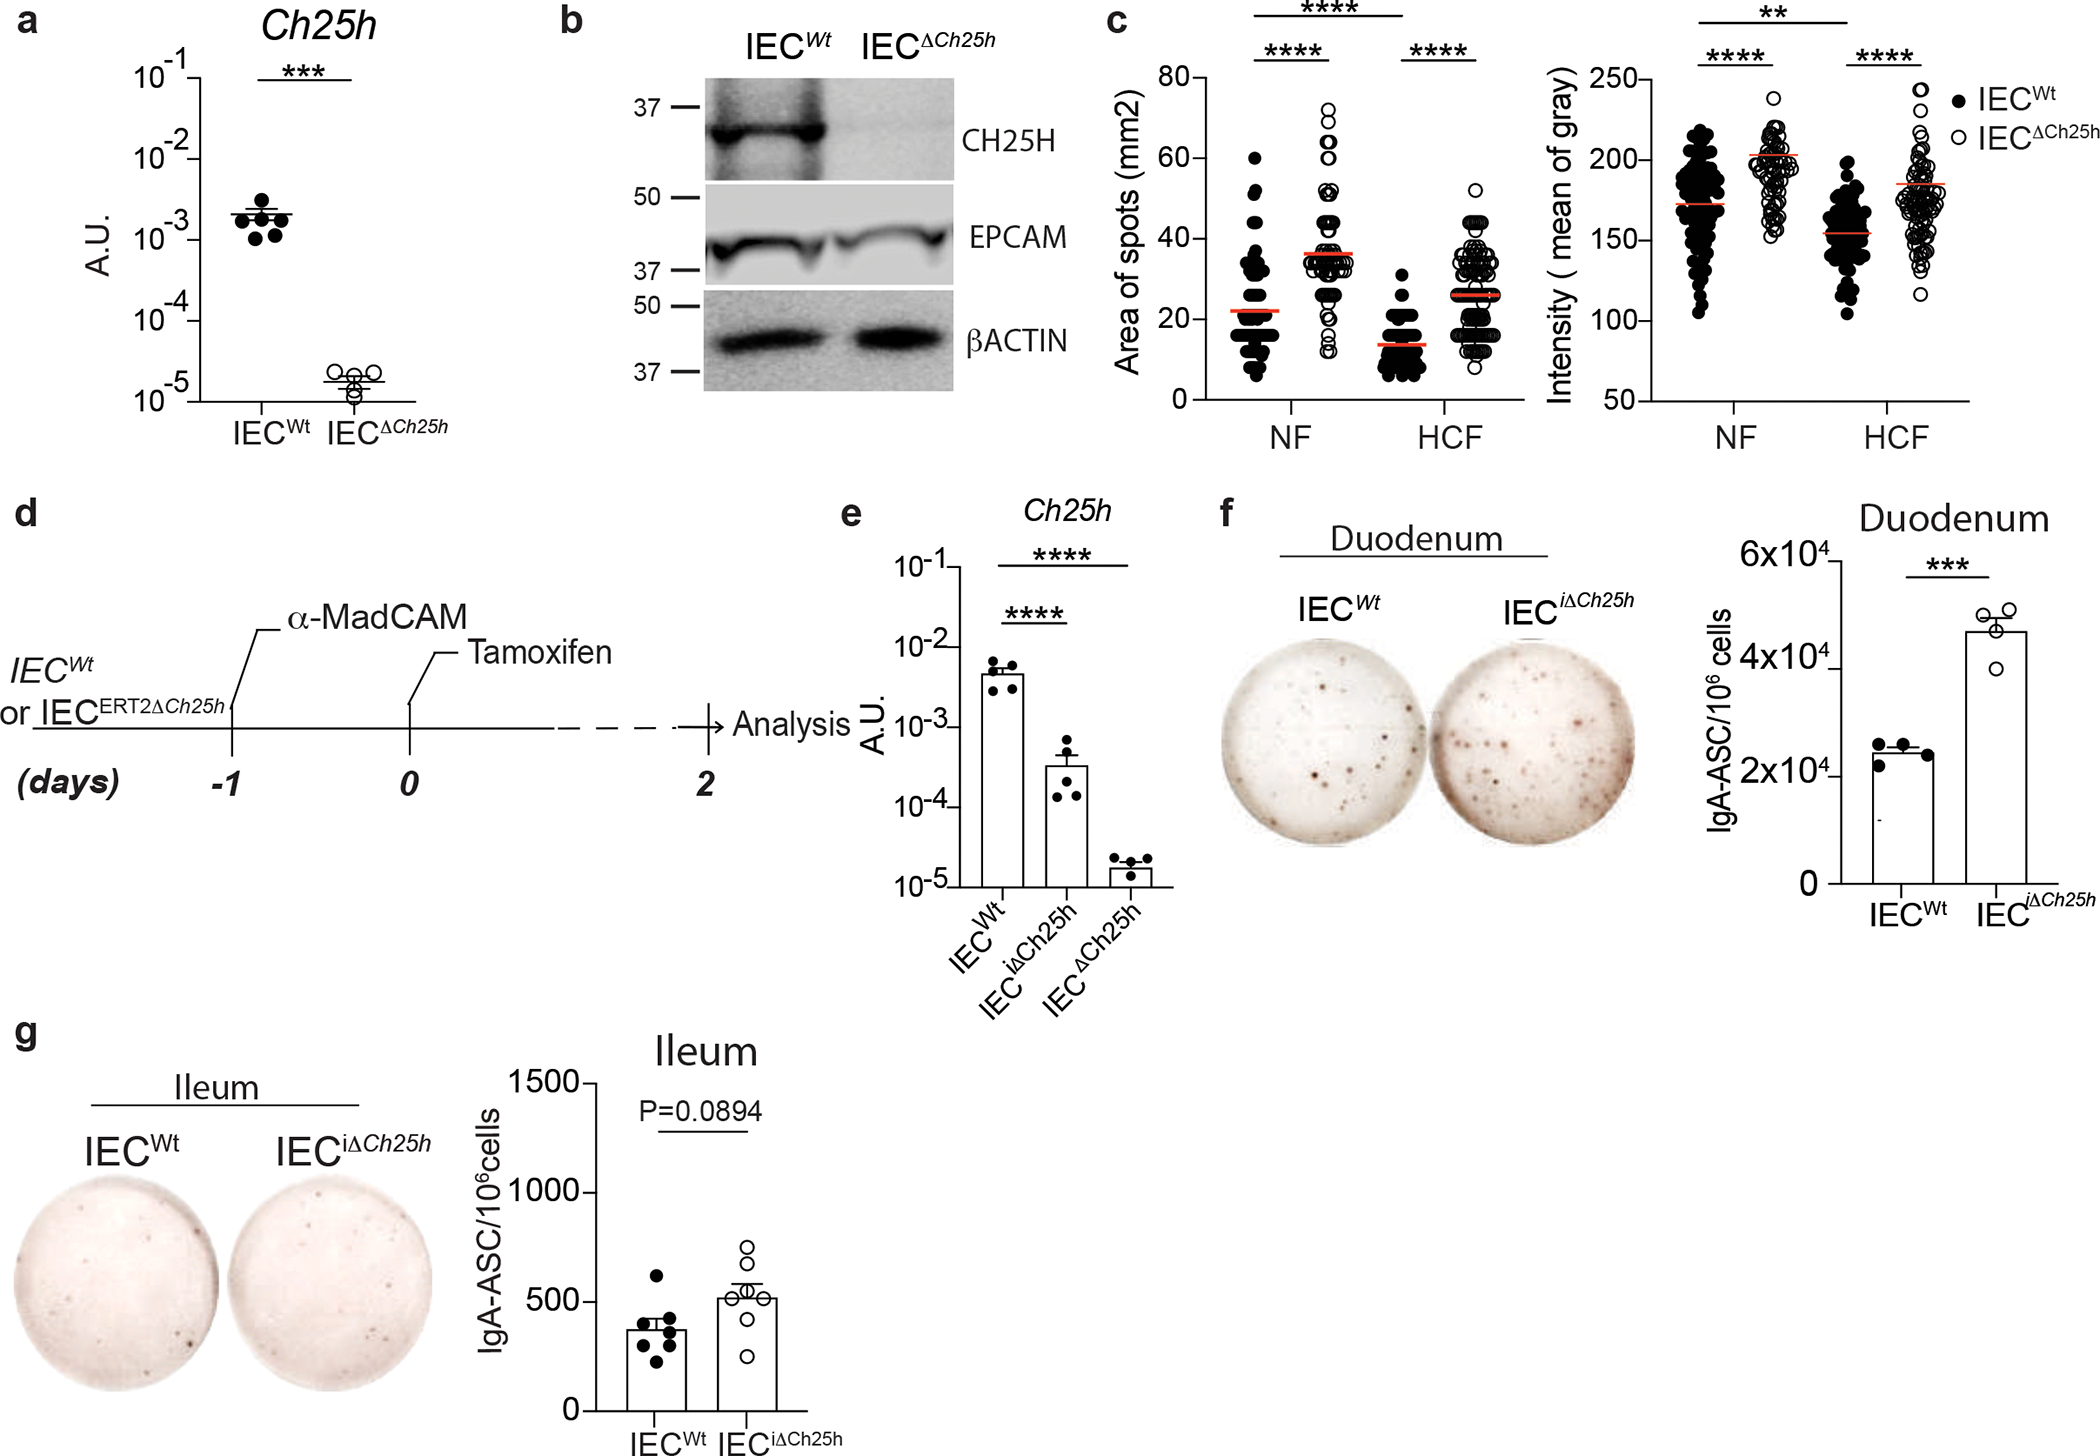
a, Quantification of Ch25h mRNA by RT-qPCR in intestinal epithelial cells from VillincreCh25hfl/fl (IECΔCh25h) and littermate controls (IECWt). b, Western blot of CH25H (~31.74KDa), EPCAM (~40KDa) and β-ACTIN (~42KDa) quantification in IECs of IECΔCh25h and IECWt mice. Samples derived from the same experiment and gel were processed in parallel. c, Area and intensity quantification of IgA+ spots from lamina propria of IECWt and IECΔCh25h mice treated with normal food (NF) or 2% of cholesterol food (HCF). Each dot represents single IgA+spot. d, Tamoxifen inducible knockout model of Ch25h in IECs, upon restriction of PCs circulation by i.p. injection of 100 μg of anti-MadCam. e, Quantification of Ch25h mRNA by RT-qPCR in intestinal epithelial cells from IECΔCh25h and littermate controls (IECWt) two days after tamoxifen injection. f, Representative IgA ELISPOT and compiled data of duodenum and (g) ileum lamina propria cells from IECWt and IECiΔCh25h mice after Tamoxifen treatment. The results were pooled from three independent experiments (a)(n=5–6 mice per group); (b)(n=3 independent samples per group); (c)(n=76–114 cells per group); (e)(n=5 mice per group); (g)(n=7 mice per group) and two independent experiments (f)(n=4 mice per group). Statistics were calculated with two-sided unpaired Student’s t-test (***P<0.001) in (a,f,g), two-way ANOVA (****P<0.0001,***P<0.001,**P<0.01,*P<0.05) in (c) and one-way ANOVA with Bonferroni correction (*p<0.05, ***p<0.001, ****P<0.0001) in (e). Exact P values and adjustments are provided in Source data. The error bars represent the mean ± s.e.m.
Extended data Fig. 4: Inhibition of cholesterol uptake, but not cholesterol biosynthesis, controls duodenum IgA secretion.
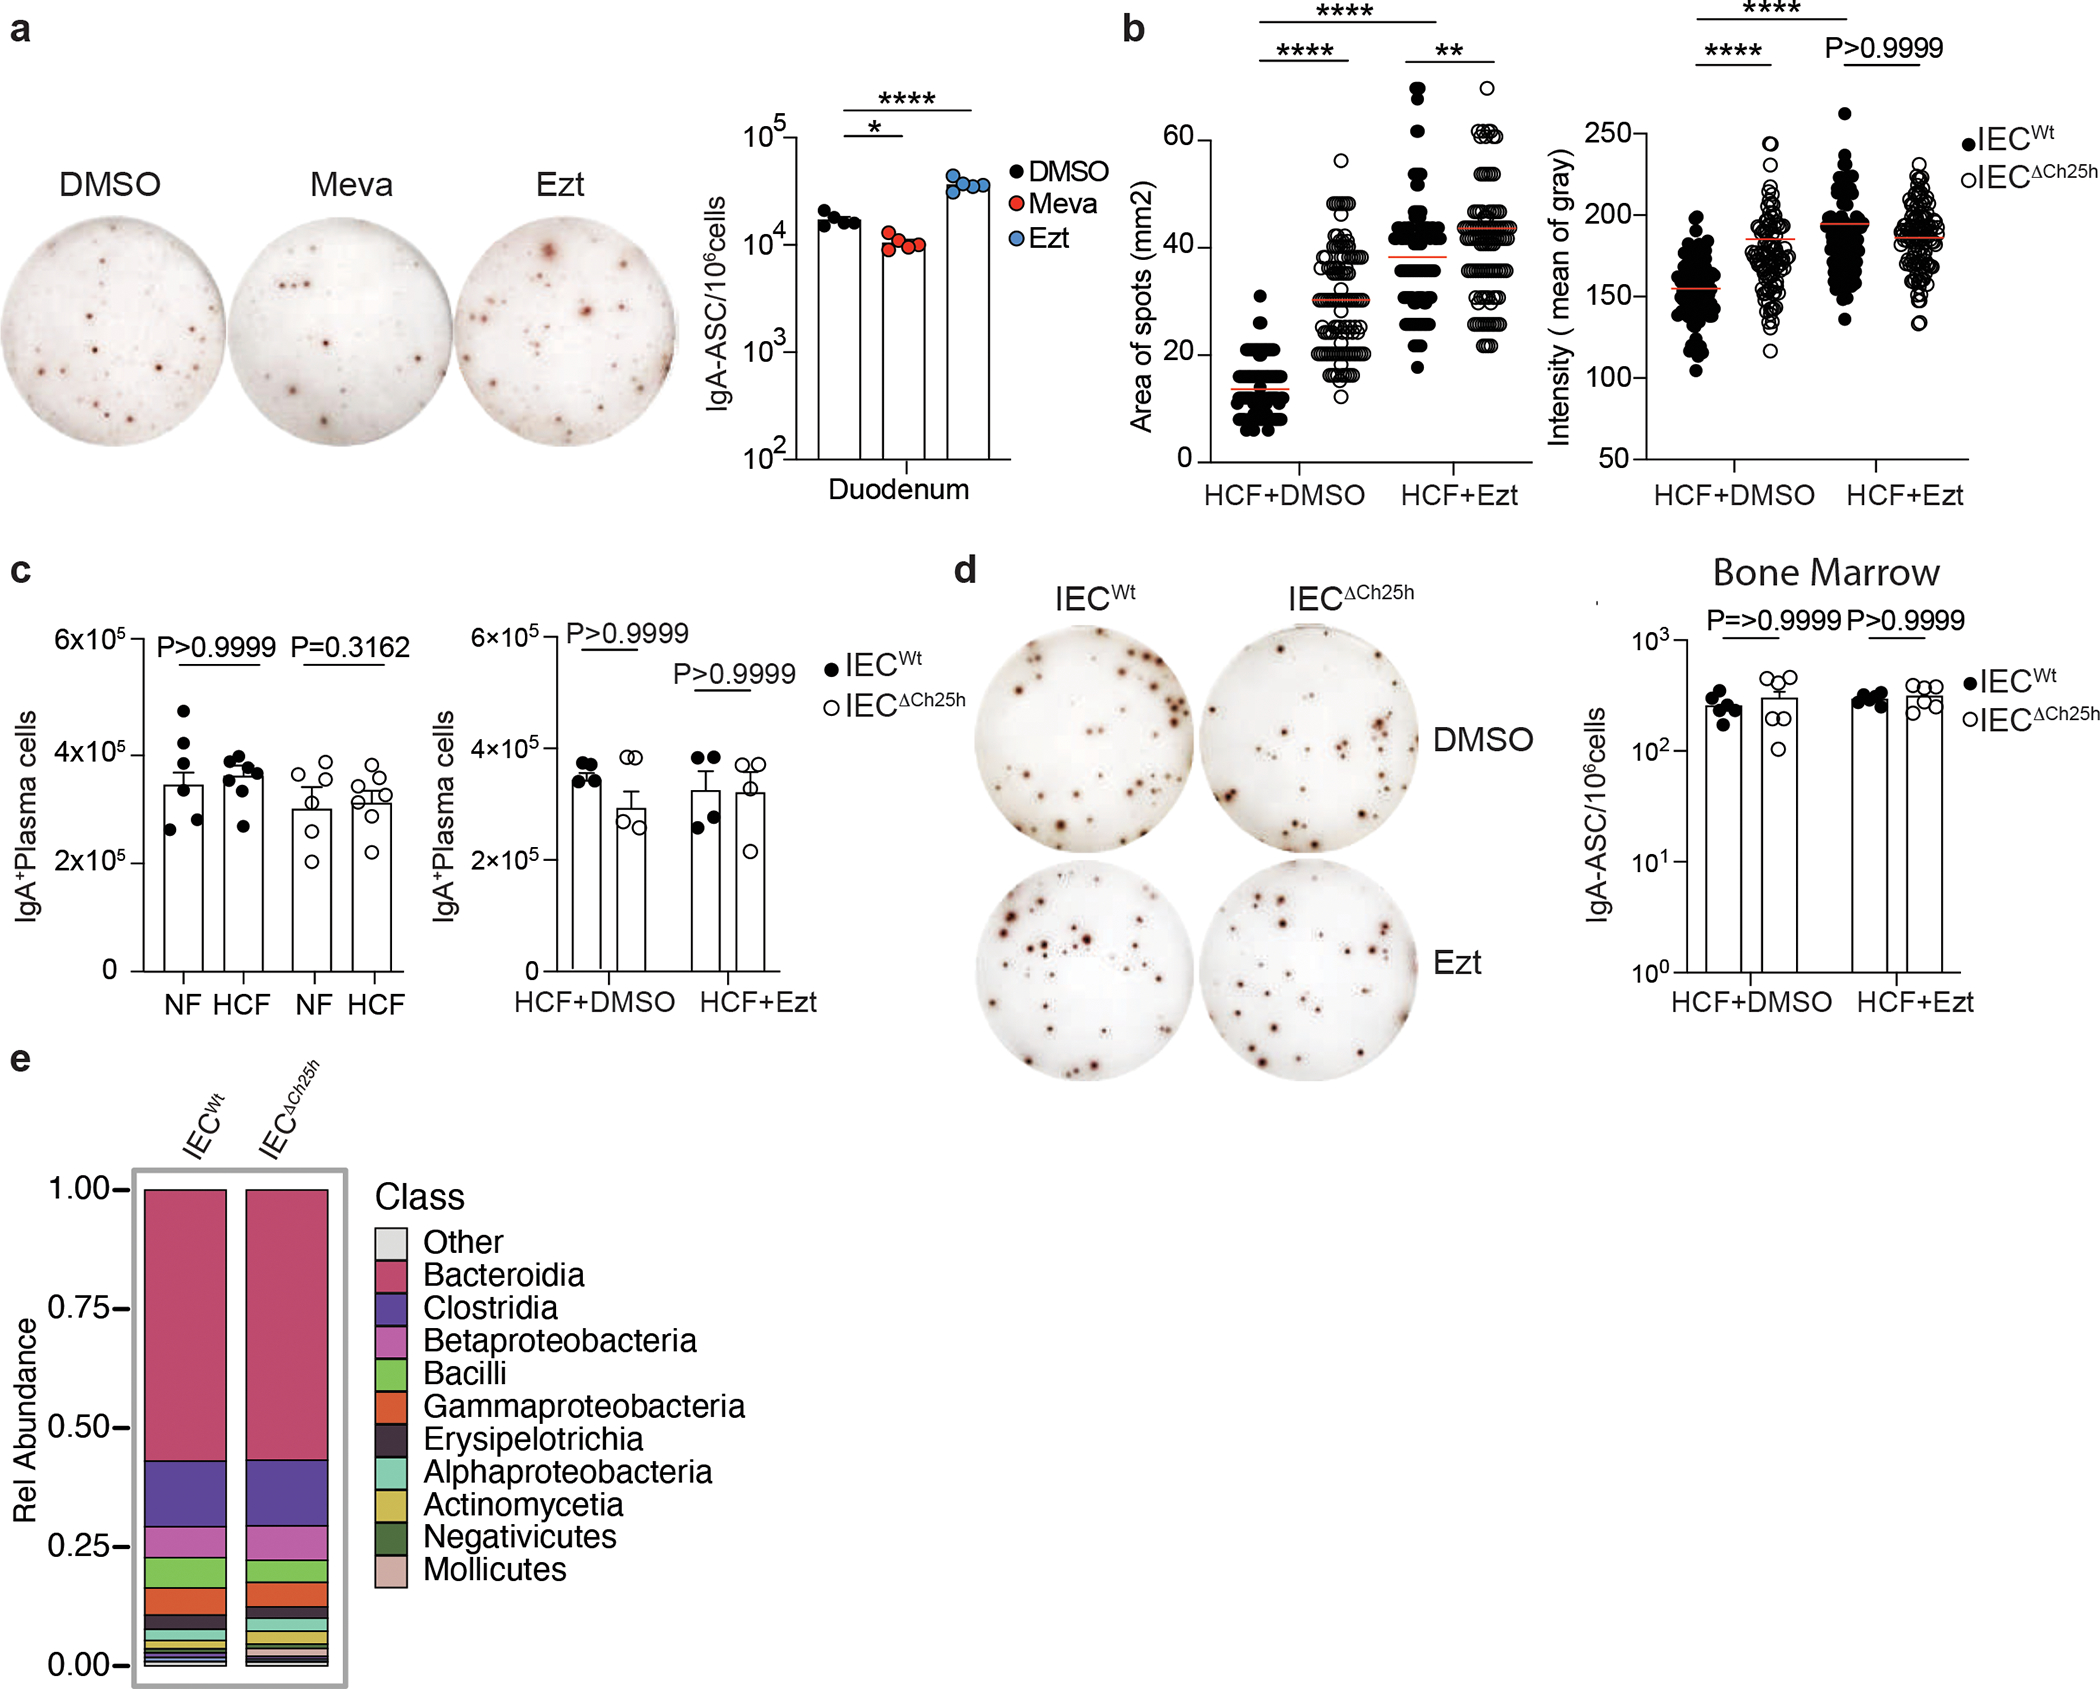
a, Representative IgA ELISPOT and compiled data of duodenum lamina propria of mice treated with 10mg/kg (body weight) of EZT or 20mg/kg (body weight) of Mevastatin or Vehicle (DMSO) for 24hours. b, Area and intensity quantification of IgA+ spots from lamina propria of IECWt and IECΔCh25h mice treated with EZT or DMSO as in Figure 2f. Each dot represents single IgA+spot. c, Total number of PCs measured by flow cytometry and gated on B220− IgA+ cells in duodenal lamina propria of IECWt and IECΔCh25h mice treated with NF, HCF or EZT. d, Representative IgA ELISPOT of bone marrow of IECWt and IECΔCh25h mice treated with EZT or DMSO. e, Analysis of total microbiome populations in luminal small intestine of IECWt and IECiΔCh25h mice by 16S. The results were pooled from three independent experiments (a)(n=5 mice per group); (b)(n=104–117 cells per group); (c)(n=4–7 mice per group); (d)(n=6 mice per group); (e)(n=3 mice per group). Statistics were calculated with two-sided unpaired Student’s t-test (***P<0.001) in (c,d), two-way ANOVA (****P<0.0001,***P<0.001,**P<0.01,*P<0.05) in (b) and one-way ANOVA with Bonferroni’s correction (*p<0.05, ***p<0.001, ****P<0.0001) in (a). Exact P values and adjustments are provided in Source data. The error bars represent the mean ± s.e.m.
Extended data Fig. 5: Lack of Ch25h in IECs and cholesterol uptake inhibition control CD98 expression IgA secreting plasma cells in the duodenum.
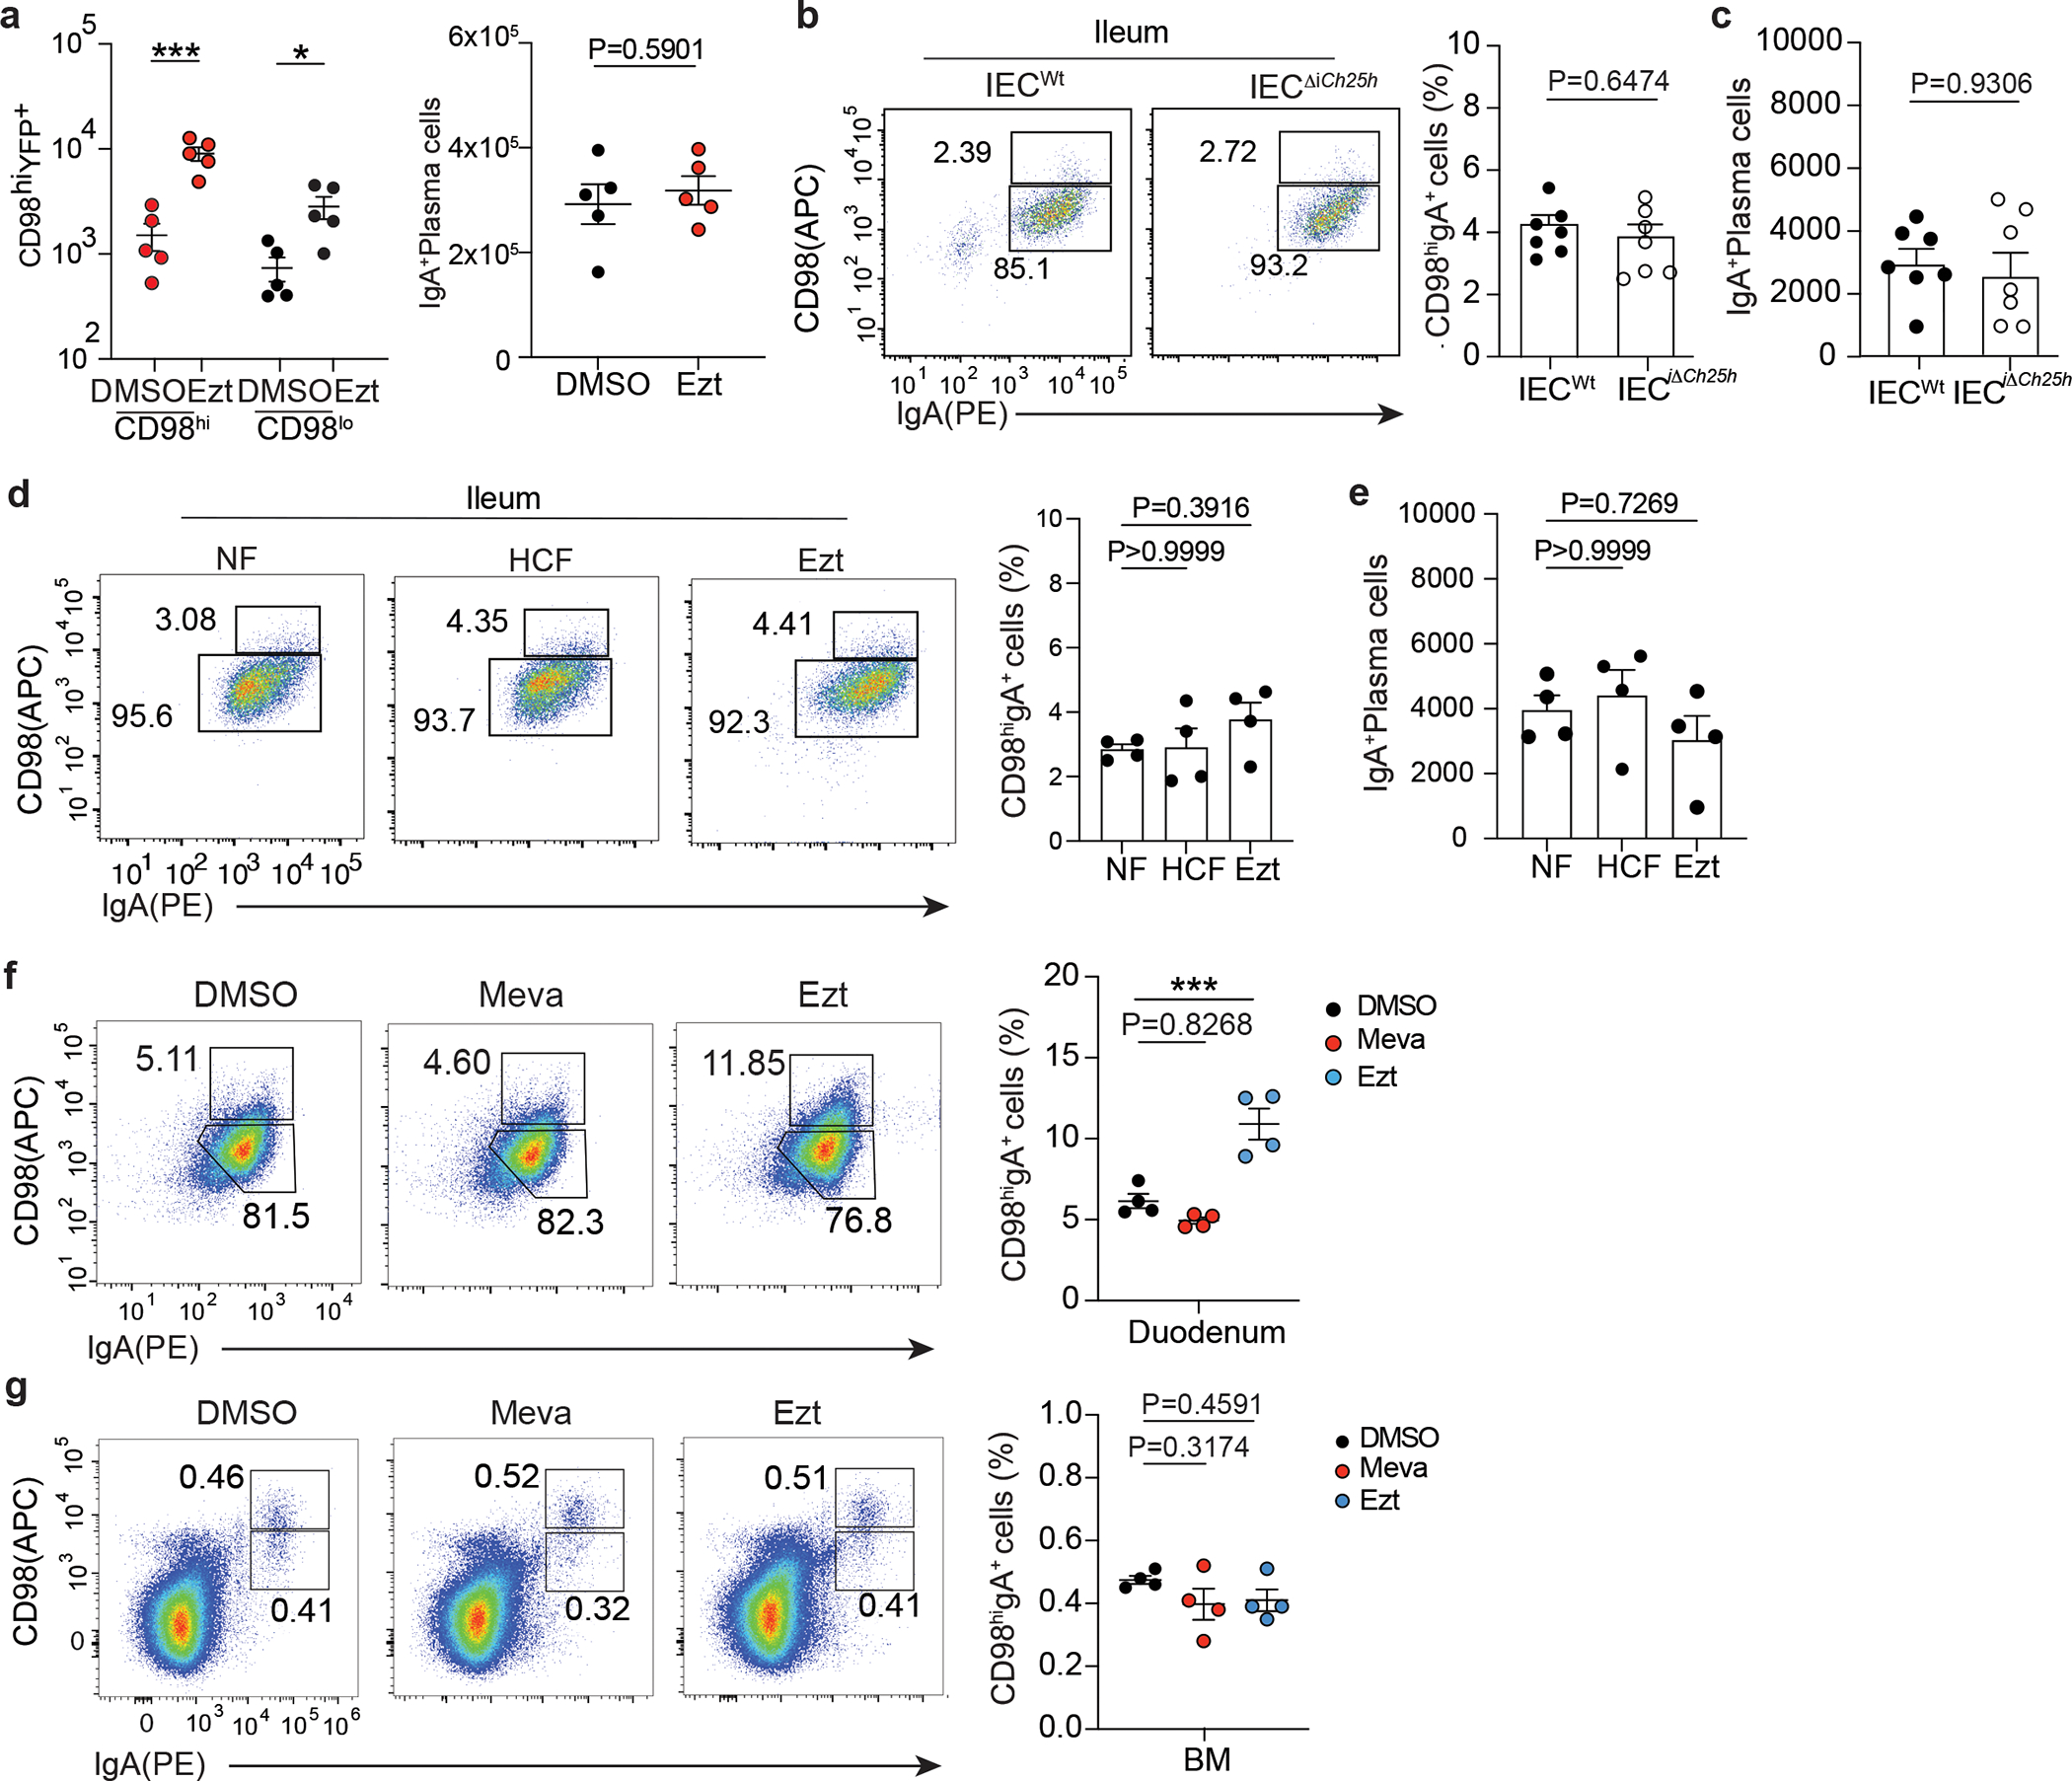
a, Number of CD98hi and CD98lo PCs and total IgA+PC in lamina propria of mice treated with 10mg/kg (body weight) of EZT or vehicle and euthanized 24 hours later. b, Representative flow cytometry and frequency and total number of IgA+ PCs in the ileum of IECWt and IECiΔCh25h mice (c). d, Representative flow cytometry and compiled quantification of frequency and total number of IgA+ PCs in the ileum of mice treated for 24 hours with NF, HCF and EZT (e). f, Representative flow cytometry and frequency of IgA+PCs in duodenum lamina propria of mice treated with EZT or Mevastatin or vehicle and euthanized 24 hours later. g, Flow cytometry and frequency of IgA+ PCs in BM of mice treated with EZT and Mevastatin as in (f). The results are pooled from three independent experiments (a)(n=5 mice per group); (b and c)(n=7 mice per group) and two independent experiments in (d,e,f and g)(n=4 mice per group). Statistics were measured as two-sided unpaired Student’s t-test (**p<0.01,***p<0.001) in (a,b and c) and one-way ANOVA with Bonferroni’s correction (***p<0.001) in (d,e,f and g). Exact P values and adjustments are provided in Source data.The error bars represent the mean ± s.e.m.
Extended data Fig. 6: Ch25h-expressing epithelial cells restrain BLIMP1 upregulation and antigen-specific mucosal response in intestinal plasma cells.
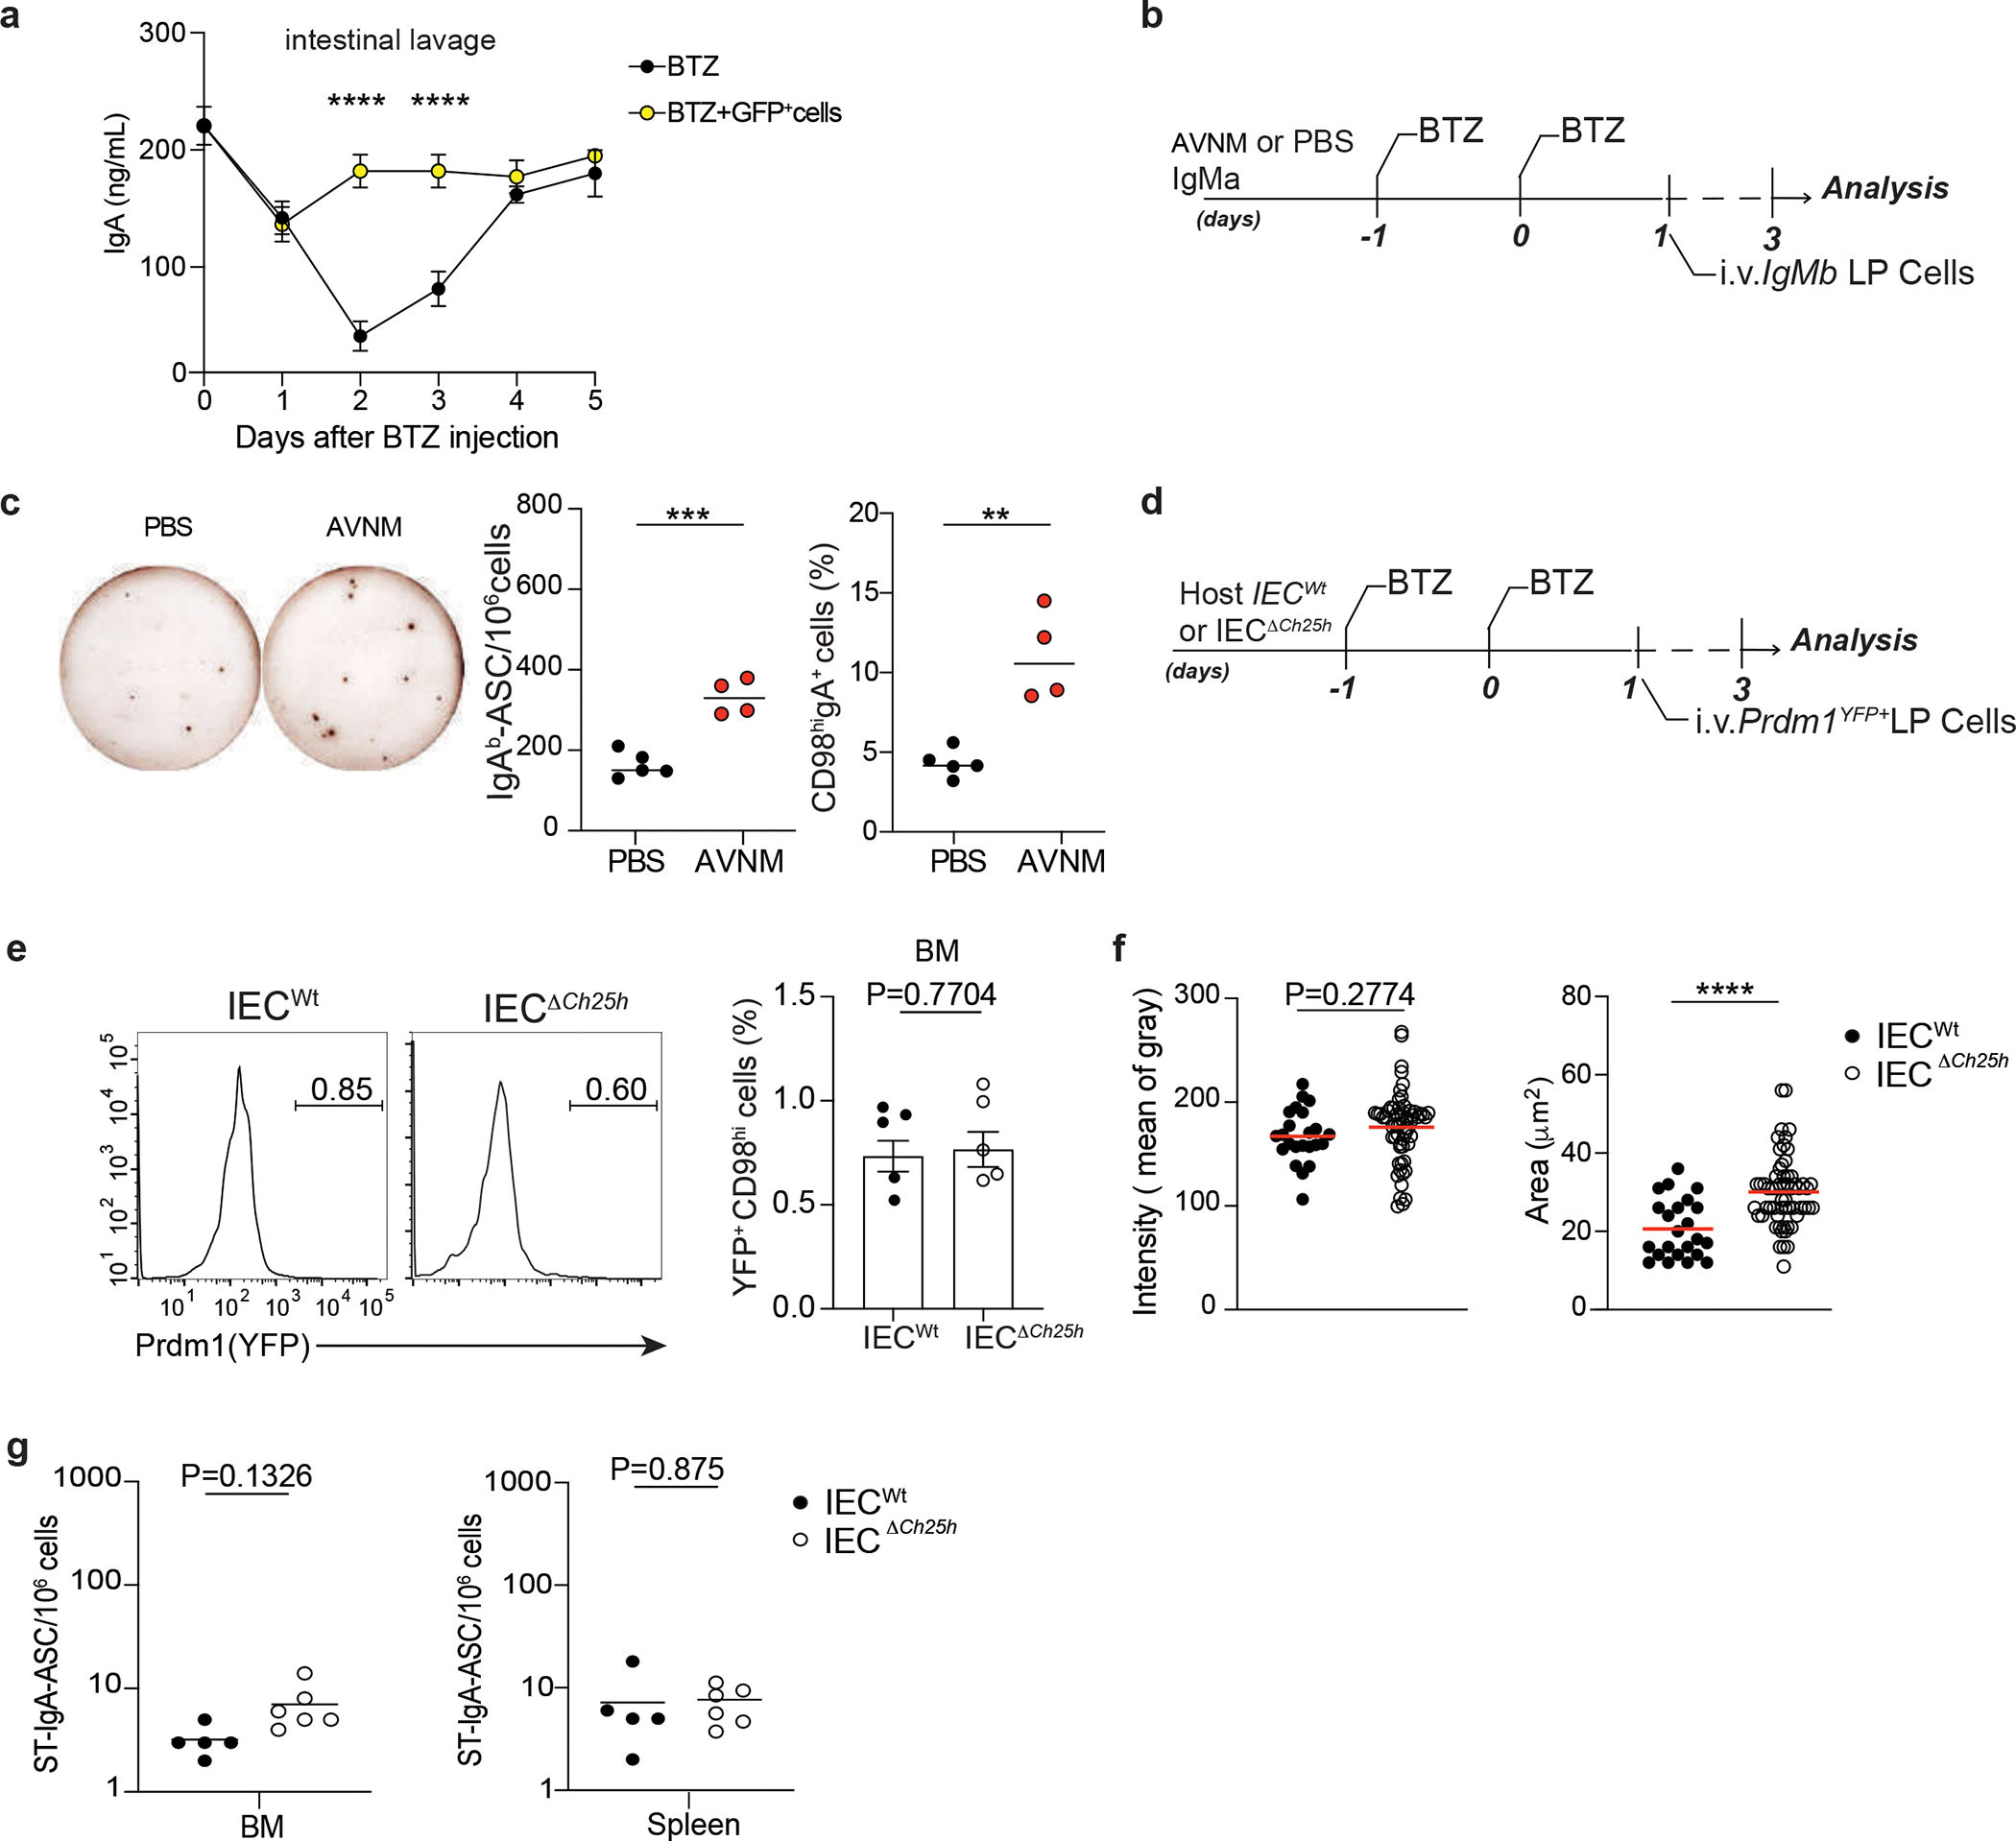
a, IgA ELISA of intestinal lavages from wild type mice treated for two consecutive days with BTZ and injected with GFP+ cells (1×10⁶). Intestinal lavages were collected at the indicated days after BTZ injection. b, Experimental model of BTZ treatment and adoptive transfer of 1×10⁶ cells from lamina propria of IgMa mice treated 10 days with antibiotics (AVNM) or PBS into IgMb mice. c, Representative IgAb Elispot of LP PCs and CD98hiIgA+ PCs frequency from mice treated as (b). d, Experimental model of BTZ treatment and adoptive transfer of 1×10⁶ cells from lamina propria of Prdm1YFP+ reporter mouse into IECWt and I IECΔCh25h mice. e, Representative flow cytometry plot and compiled quantification of BLIMP1+ PCs in bone marrow of IECWt and IECΔCh25h mice treated as in (d). f, Area and intensity quantification of IgA+ spots from lamina propria of IECWt and IECΔCh25h mice treated with BTZ and injected with lamina propria cells from mice infected with non-replicative ΔAroA Salmonella Typhimurium. Each dot represents single IgA+spot. g, Salmonella-specific IgA ELISPOT in bone marrow and spleen of mice treated as in Figure 4J. The results are pooled from two independent experiments (a)(n=2 mice per group) and three independent experiments (c,e and g)(n=4–6 mice per group). Statistics were measured as two-sided unpaired Student’s t-test (**p<0.01; ***p<0.001; ****p<0.0001) in (a,c,e,f and g). Exact P values and adjustments are provided in Source data.The error bars represent the mean ± s.e.m.
Extended data Fig. 7: Sensing of GPR183 ligand in plasma cells depends on intestinal lipoprotein lipase activity.
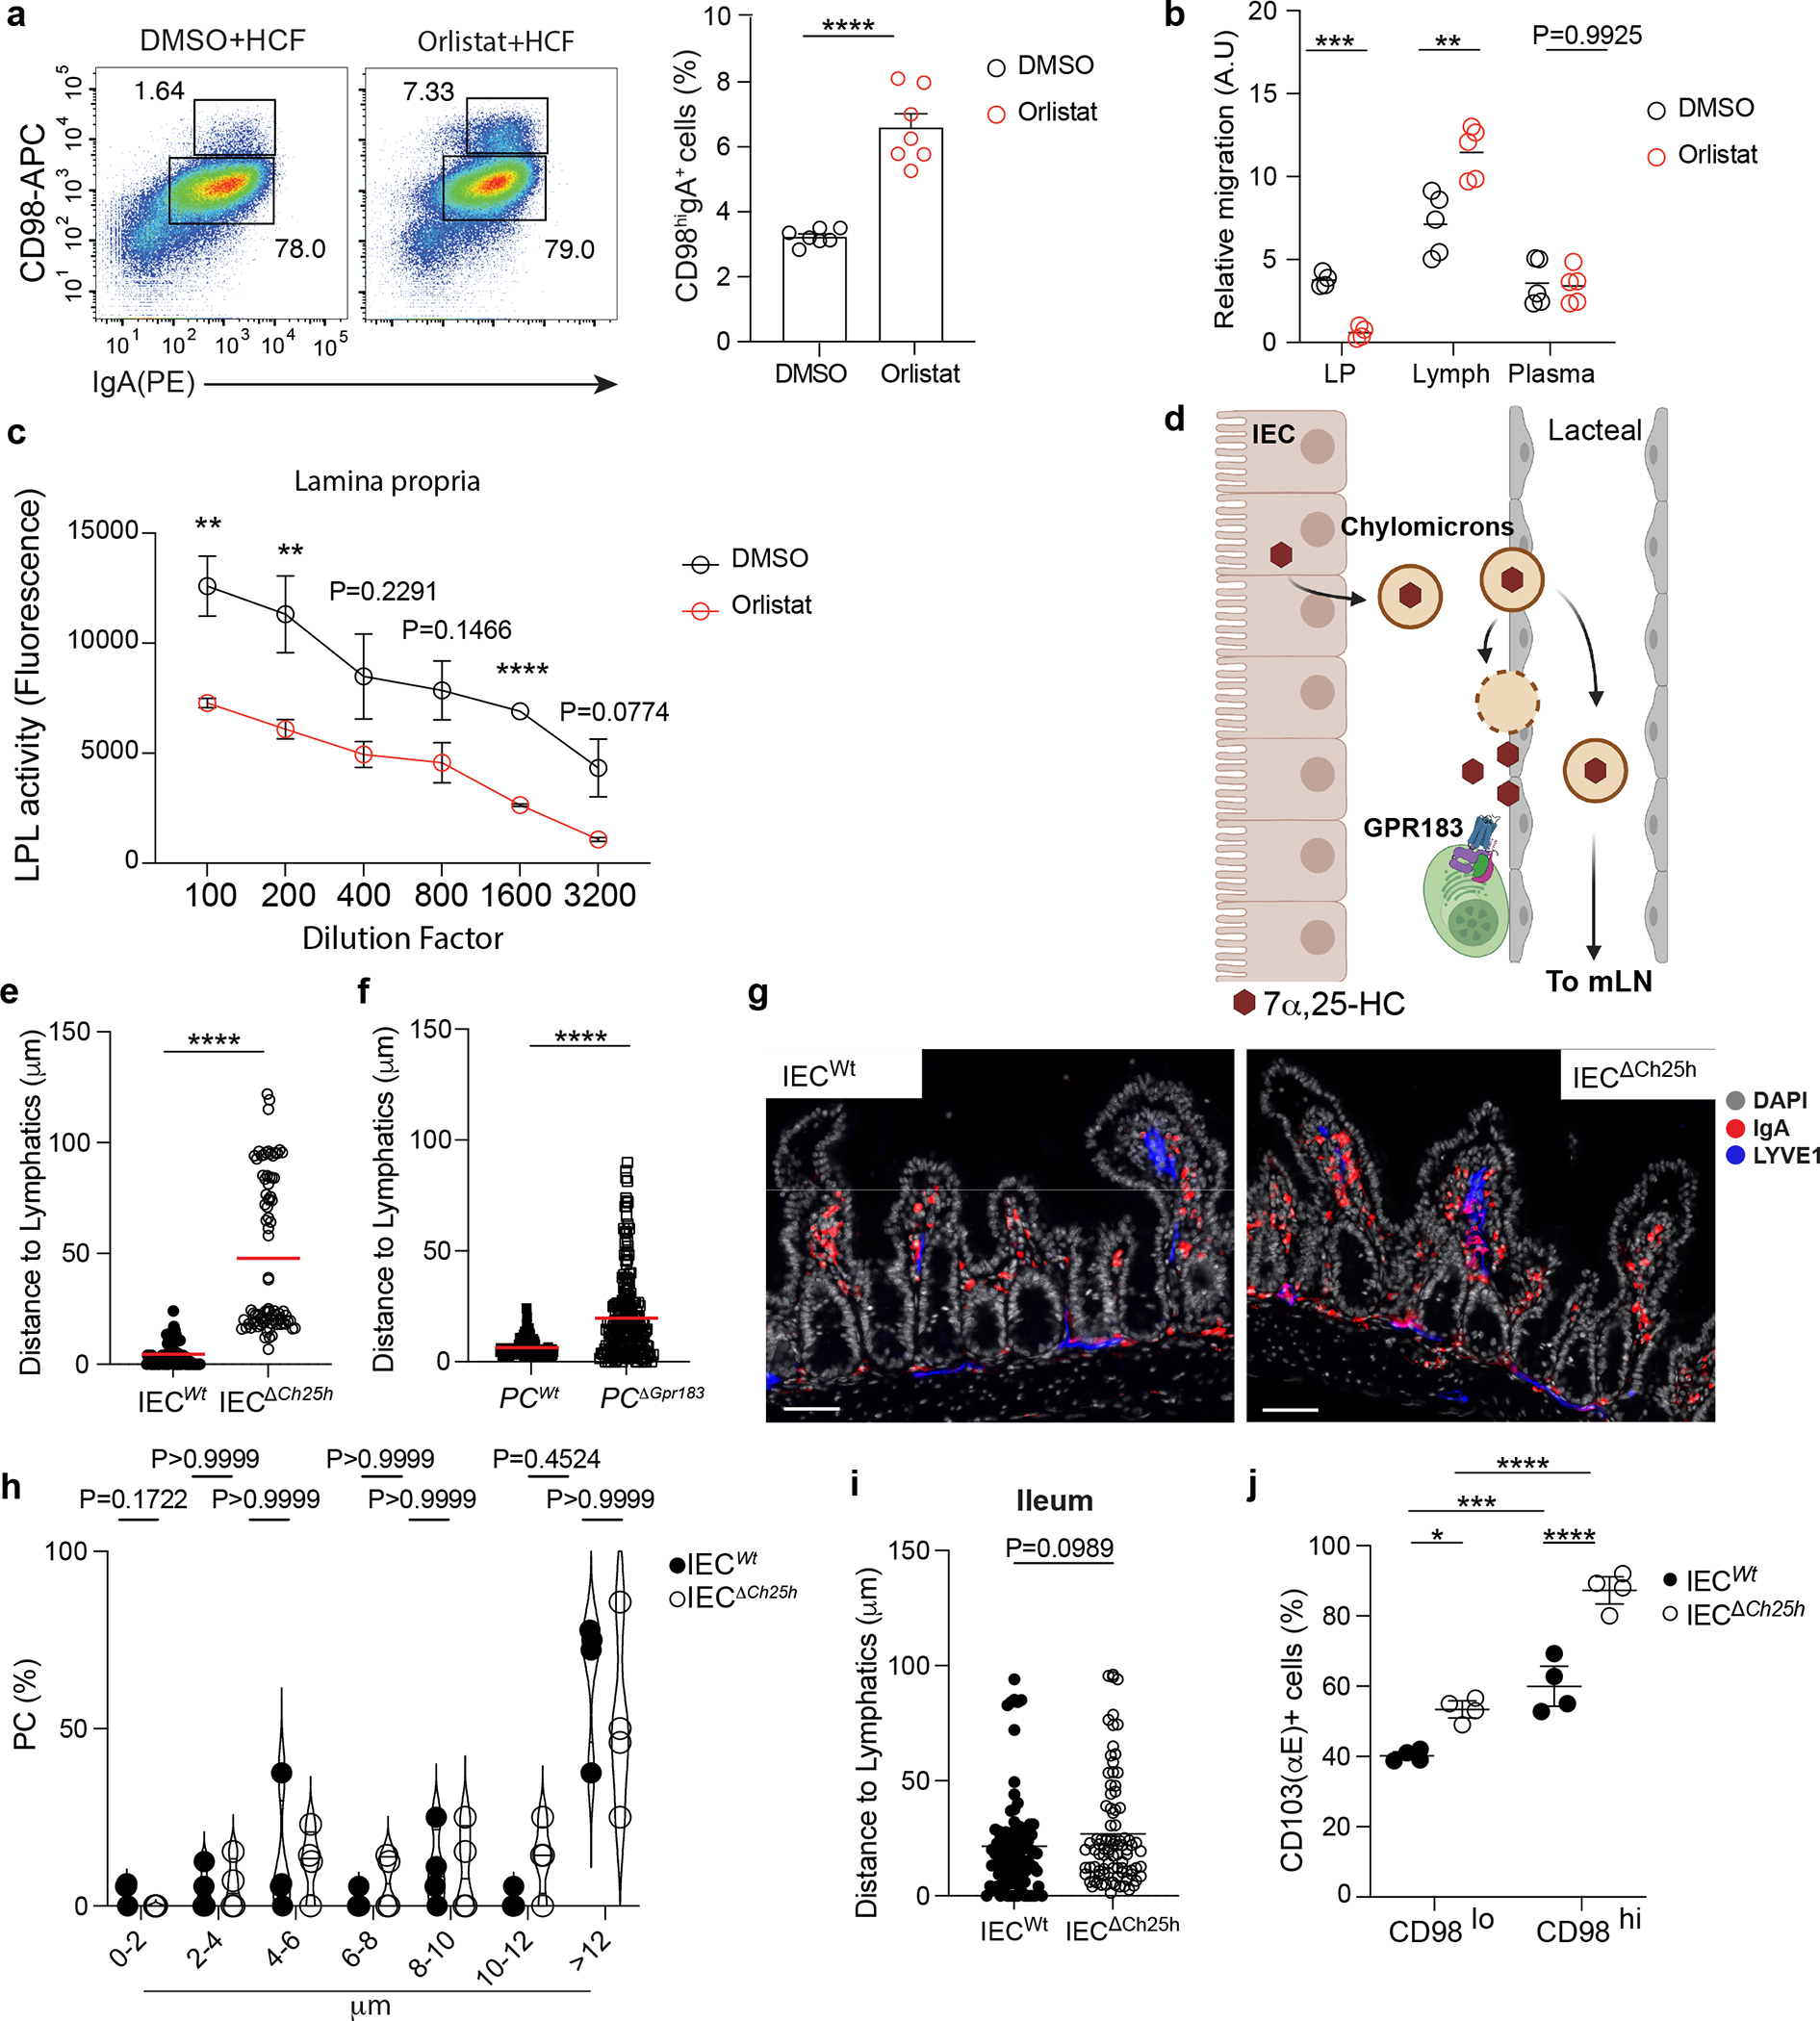
a, Representative flow cytometry plot and compile frequency of secreting IgA+ PCs (CD98hiIgA+) in mice treated for 24 hours with a lipoprotein lipases (LPL) inhibitor, Orlistat, or DMSO. b, GPR183 ligand quantification in lamina propria, lymph and plasma of mice treated for two consecutive days with 50mg/kg (body weight) of Orlistat. c, Quantification of LPL activity by fluorometric assay in duodenum lamina propria of mice treated as in (a and b). d, Illustration of the mechanism regulating 7α,25-HC trafficking from IECs to lamina propria. IEC-produced chylomicrons enter the intestinal lacteal and reach the lamina propria by LPL-mediated degradation or travel versus lymphoid organs (Created with Biorender.com). e-f, Quantification of PC distance from lymphatics in the indicated mice used in Fig.1c and Fig.1d. Each dot represents a single PC. g, Representative immunofluorescence of IgA+PCs, lymphatics and DAPI in ileum sections from wild type and IECΔCh25h mice used in Figure 6a,b and d. Scale bar is 100 μm. h, Quantification of PC frequency at the indicated distance from lymphatics. Each dot represents the average of PCs distance measured in sections from n=4 mice per each treatment. i, Quantification of PCs distance from lymphatics in section of ileum from wild type and IECΔCh25h mice. Each dot represents a single PC. j, Frequency of α chainCD103 (αE) in CD98lo and CD98hi cells from duodenum of IECWt and IECΔCh25hmice used in Fig. 6a,b and d. The results were pooled from three independent experiments (a and b)(n=6–7 mice per group); (e and f)( n=136–210 cells); (h and i)( n=4 mice per group and n=90–97 cells (i)) and two independent experiments (c and i)(n=3–4 mice per group). Statistics were calculated with two-sided unpaired Student’s t-test (**P<0.01,***p<0.001,****P< .0001) in (a,b,c,e,f, h and i) and two-way ANOVA with Bonferroni’s correction (*p<0.05, ***p<0.001, ****p<0.0001) in (j). Exact P values are provided in Source data. The error bars represent the mean ± s.e.m.
Extended data Fig. 8: Diet-derived oxysterols shape spatial localization of IgA+ plasma cells in lamina propria.
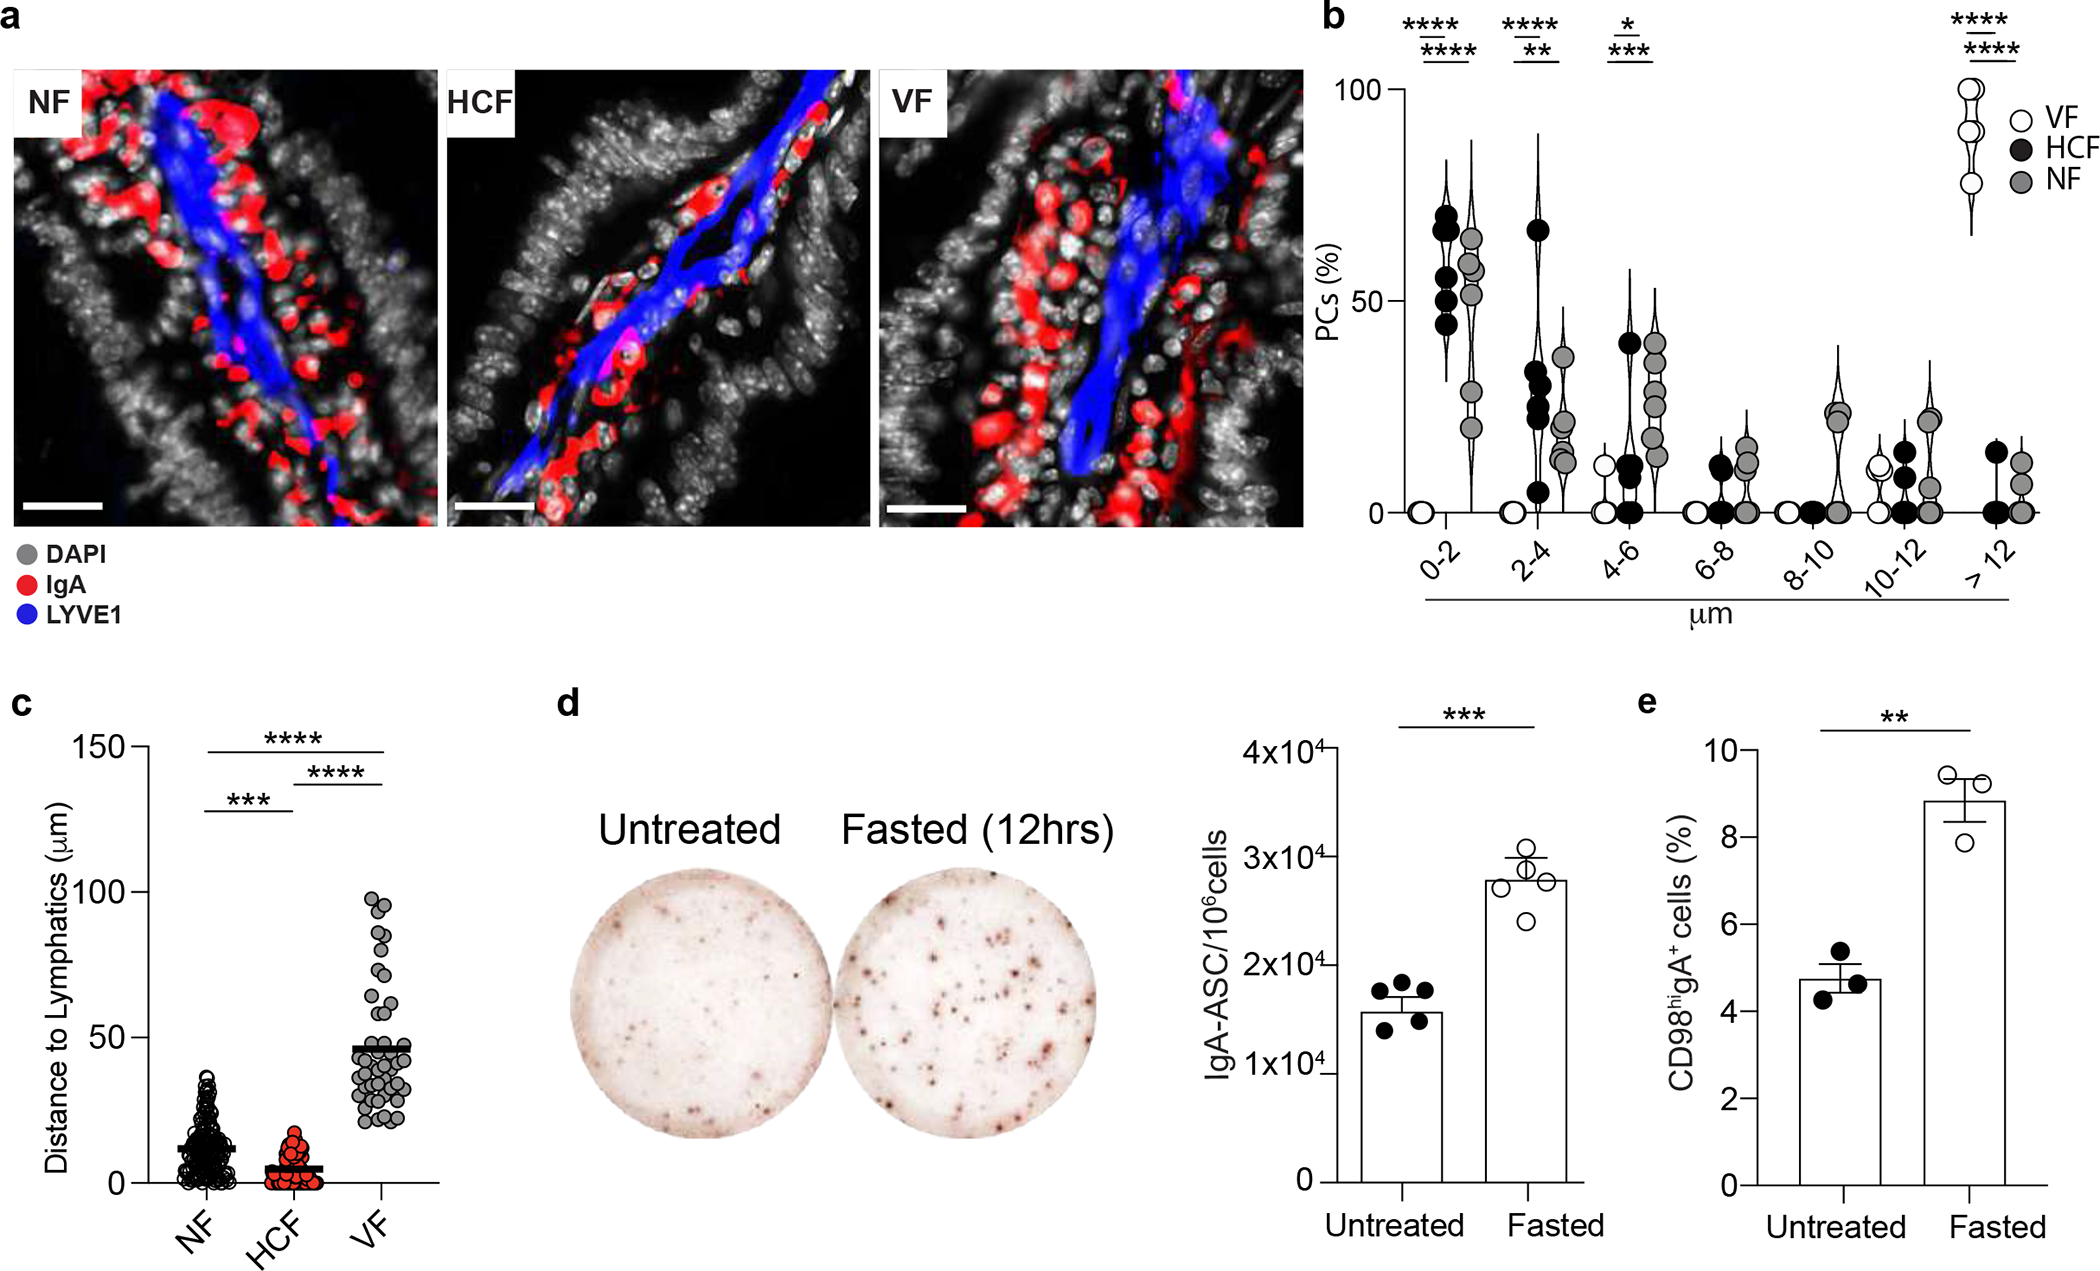
a, Representative immunofluorescence of duodenum sections from mice treated for 24 hrs with NF, HCF and VF. b, Quantification of PC frequency at the indicated distance from lymphatics (LYVE1+) in duodenum of mice treated as in (a). Each dot represents the average of PCs distance measured from n=6 mice per each treatment. c, Quantification of PCs distance from lymphatics in mice treated with the indicated food changes. Each dot represents a single PC. d, Representative IgA ELISPOT and compiled data from duodenum of untreated or fasted mice for 12 hours. e, Frequency of IgA+CD98hi cells analyzed by flow cytometry in LP of mice fasted for 12hrs, or untreated. The results were pooled from three experiments (a,b and c)(n=7 mice per group and n=50–145 cells (c)) and two independent experiments (d,e)(n=3–5 mice per group). Statistics were calculated with two-way ANOVA with Bonferroni’s correction (*p<0.05, **p<0.01,***p<0.001, ****p<0.0001) in (b and c) and two-sided unpaired Student’s t-test (**P<0.01,****P<0.0001) in (d and e). Exact P values are provided in Source data. The error bars represent the mean ± s.e.m.
Extended data Fig. 9: Modulation of intestinal oxysterol concentration shapes intestinal plasma cell positioning.
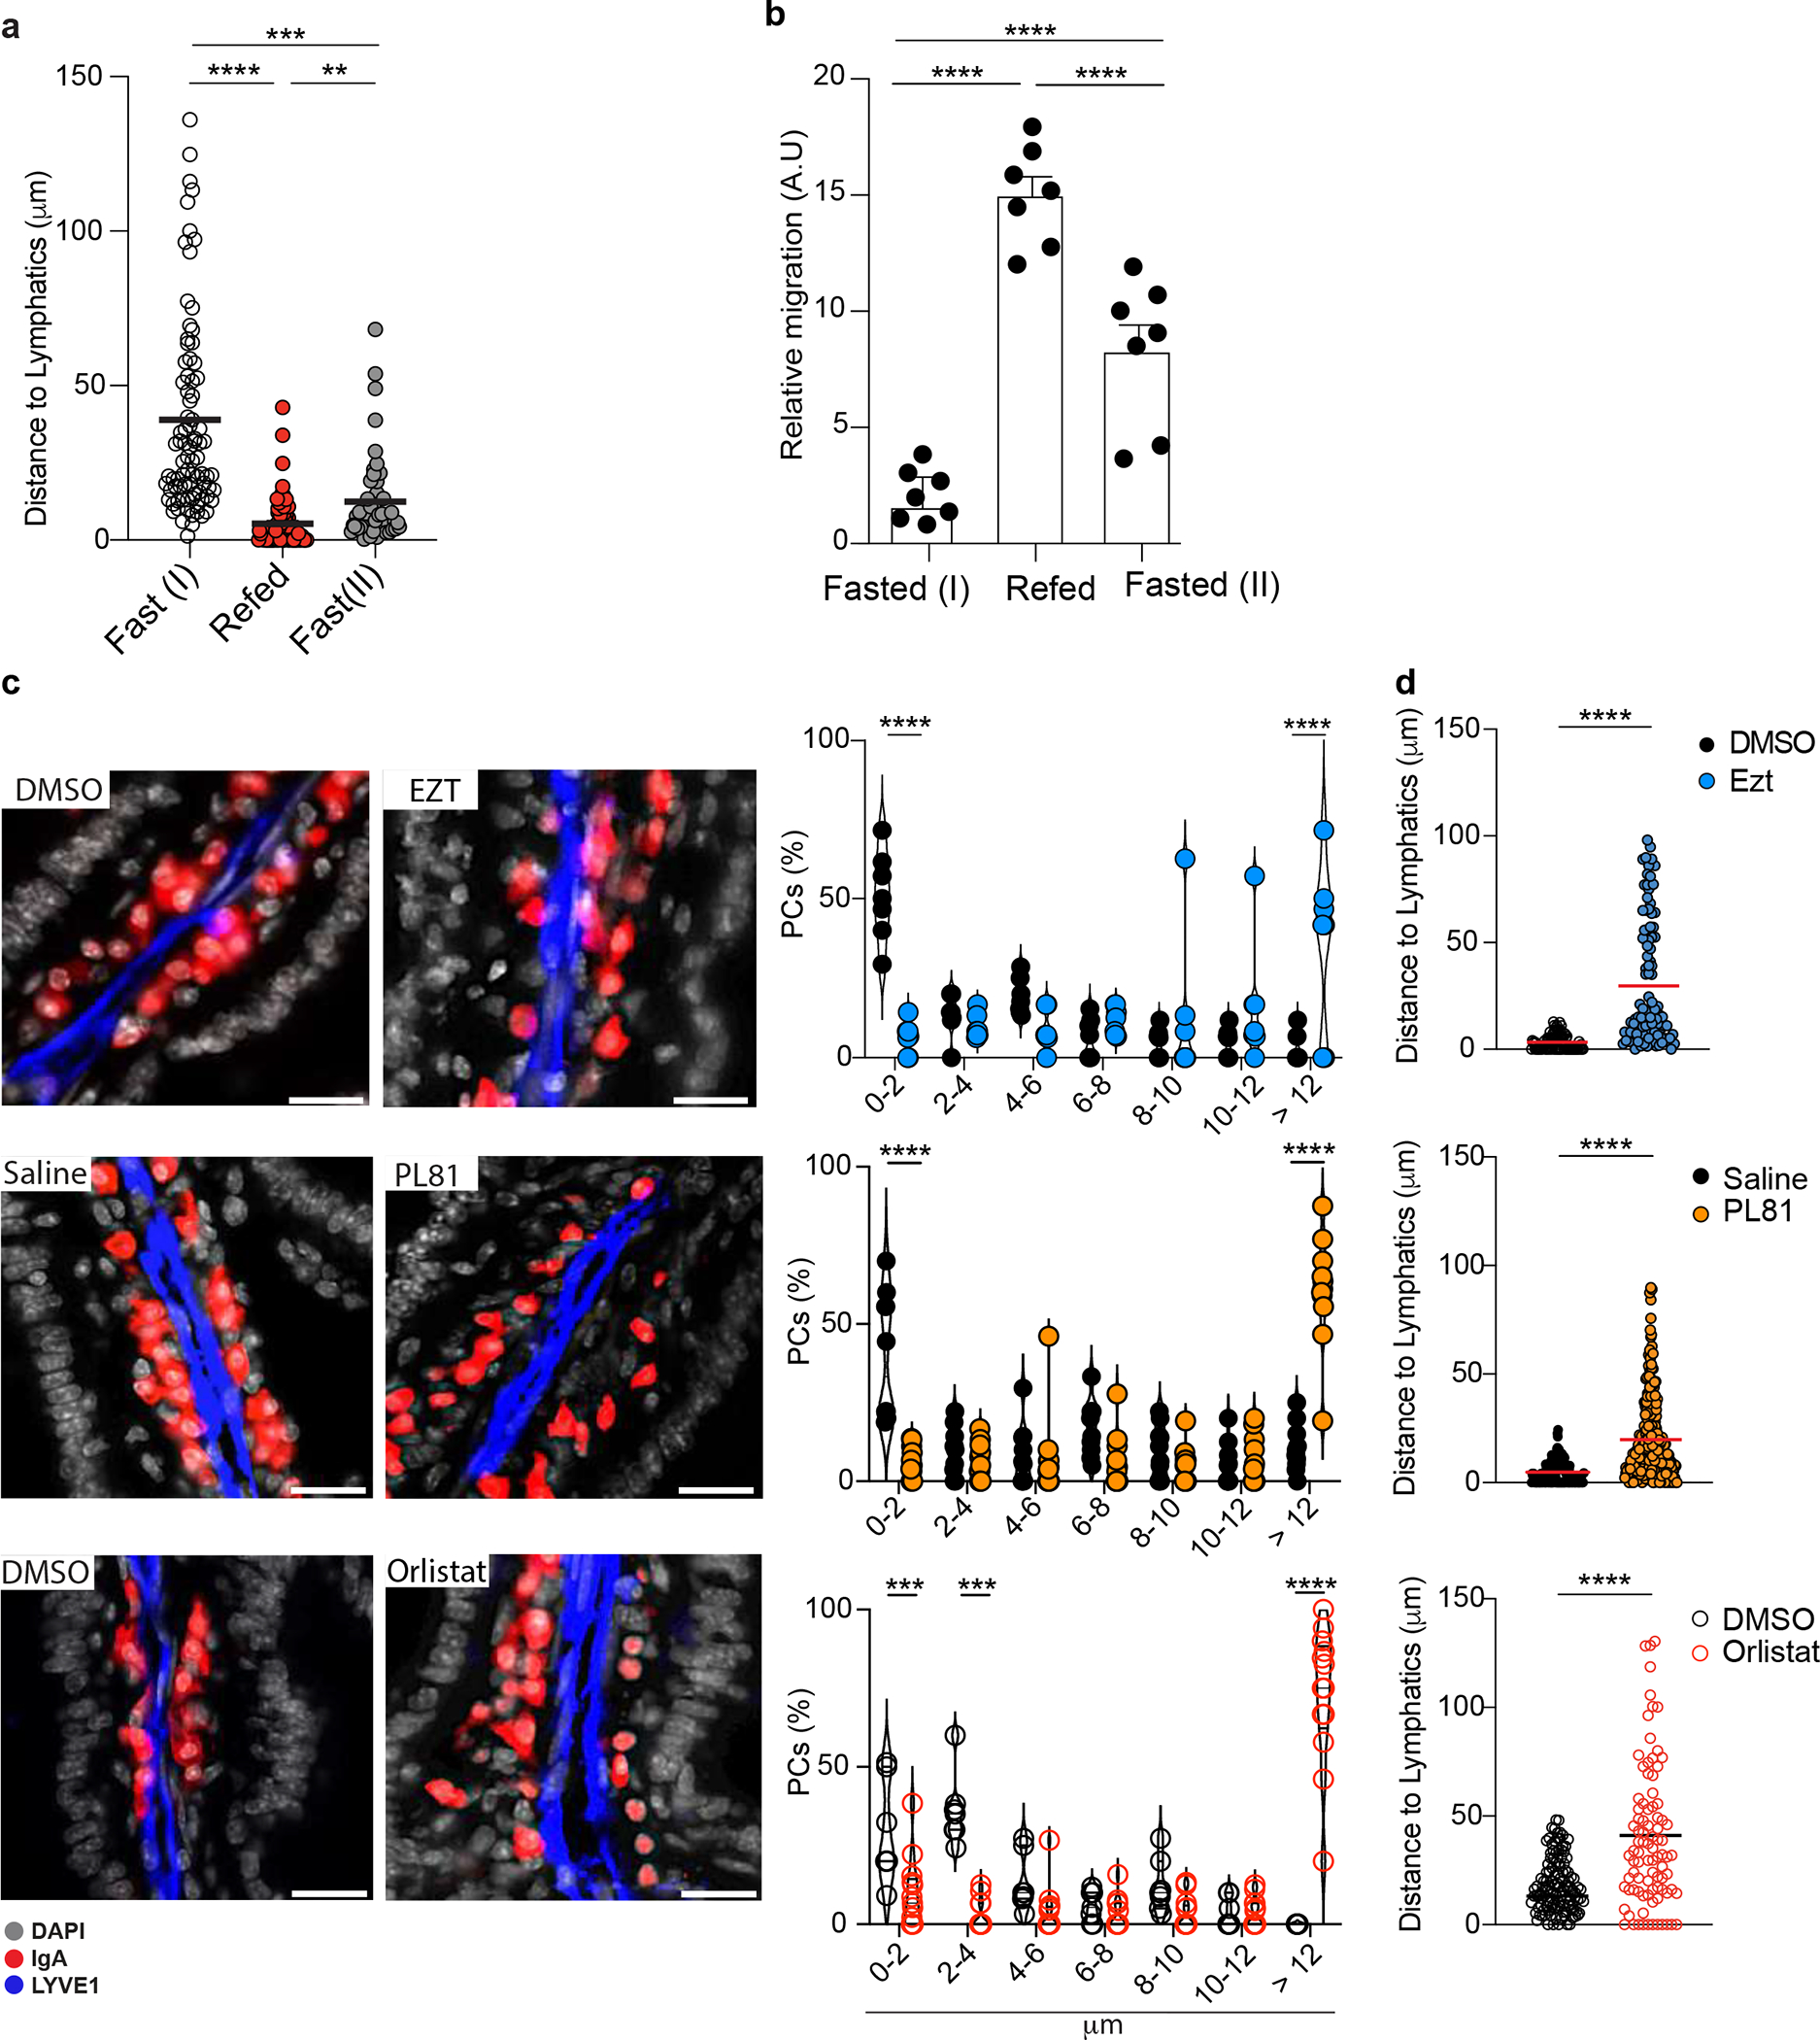
a, Quantification of PC distance from lymphatics in mice treated with the indicated food changes. Each dot represents a single PC. b, M12 migration assay with lipid extracts from IECs of mice fasted for 12hrs, refed once with HCF and harvested after 3 or 12 hrs. c, Representative immunofluorescence and frequency of IgA+ PCs at certain distance to lymphatics in duodenum of mice treated with 3% of Pluronic81 (PL81)(vol/vol), 10mg/kg (body weight) of Ezetimibe (Ezt), 50mg/kg (body weight) of Orlistat or vehicle (saline or DMSO). Each dot represents the average of PCs distance measured in a total of n=7 mice per each treatment or (d) single PCs. Scale bar is 50 μm. The results are pooled from three independent experiments (a)(n=49–85 cells per group); (b)(n=7 mice per group); (c and d)(n=7–11 mice per group). Statistics were measured by two-way ANOVA Bonferroni’s correction (*p<0.05, **p<0.01, ***p<0.001, ****p<0.0001) in (a and b) or two-sided unpaired Student’s t-test (**p<0.01, ***p<0.001) in (c and d). Exact P values and adjustments are provided in Source data. The error bars represent the mean ± s.e.m.
Extended data Fig. 10: GPR183 pharmacological inhibition shapes plasma cell dynamics and antigen-specific response.
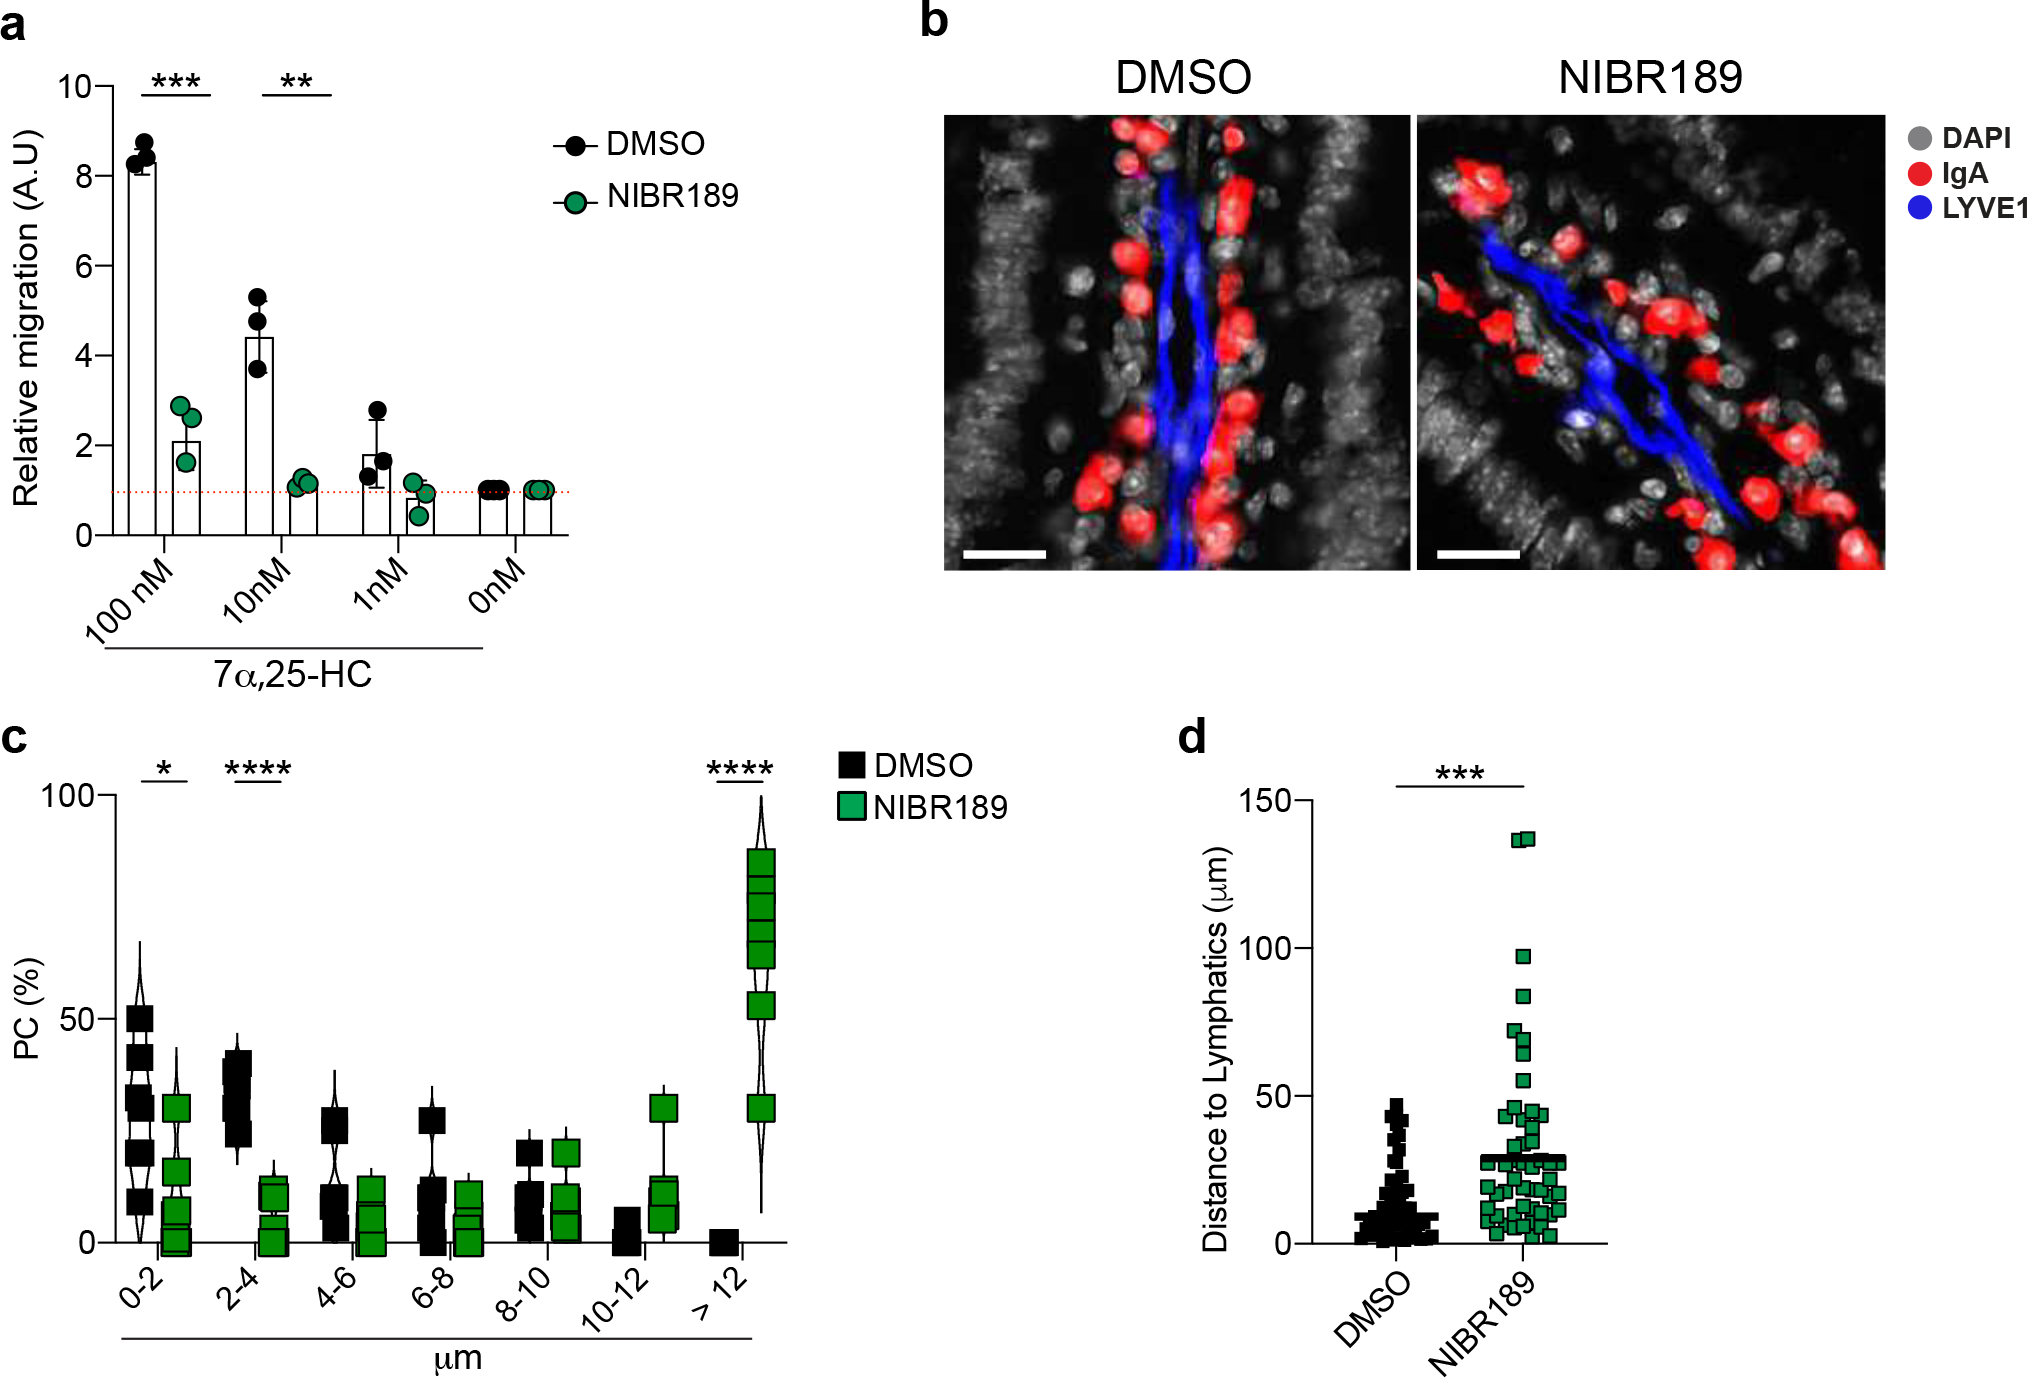
a, Relative migration of lamina propria PCs from NIBR189 or vehicle (DMSO) treated mice and with the indicated concentration of GPR183L. b, Representative immunofluorescence of duodenum sections from mice treated twice with GPR183 inhibitor, NIBR189, or vehicle (DMSO).Scale bar is 50μm. c, Quantification of IgA+PCs frequency at certain distance from lymphatics (LYVE1+) showed as violin plot. Each dot represents the average of PCs frequency at the indicated range of n=7 mice per each treatment. d, Quantification of PCs distance from lymphatics upon GPR183 inhibition. Each dot represents a single PC. The results were pooled from two independent experiments (a)(n=3 mice pre group) and three independent experiments (b,c and d) (n=7 mice per group or n=62 cells (d)). Statistics were measured as two-sided unpaired Student’s t-test (***p<0.001,****p<0.0001) in (a,c and d). Exact P values and adjustments are provided in Source data. The error bars represent the mean ± s.e.m.
Supplementary Material
Acknowledgments
This work was supported by the Kenneth Rainin Foundation, Innovator Award, Charles H. Hood Foundation Child Health Research Awards Program, The Leukemia and Lymphoma Society New Idea Award and the Multiple Myeloma Research Fellowship and NIH AI155727 (to A.R.). S.C. was supported through The American Association of Immunologists Careers in Immunology Fellowship Program and Charles A. King Trust Postdoctoral Research Fellowship Award. This work was also supported by the NIH AI40098 (to J.G.C.) and NIH DK070855 (to L.V.H). We acknowledge the University of Massachusetts Chan Flow Cytometry Core Facility for access to sorting services. We thank Jagan R. Muppidi and Eric V. Dang for the critical reading of the manuscript.
Footnotes
Competing interests
The authors declare no competing interests
Data and code availability
16S rRNA data has been deposited on the NCBI SRA (PRJEB58116) and code to reproduce analysis has been deposited on Zenodo (10.5281/zenodo.7406665).
References
- 1.Hand TW & Reboldi A Production and Function of Immunoglobulin A. Annual Review of Immunology 39, 695–718 (1AD). [DOI] [PubMed] [Google Scholar]
- 2.Martinoli C, Chiavelli A & Rescigno M Entry Route of Salmonella typhimurium Directs the Type of Induced Immune Response. Immunity 27, 975–984 (2007). [DOI] [PubMed] [Google Scholar]
- 3.Moor K et al. High-avidity IgA protects the intestine by enchaining growing bacteria. Nature 544, 498–502 (2017). [DOI] [PubMed] [Google Scholar]
- 4.Fagarasan S et al. Critical Roles of Activation-Induced Cytidine Deaminase in the Homeostasis of Gut Flora. Science 298, 1424–1427 (2002). [DOI] [PubMed] [Google Scholar]
- 5.Altmann SW et al. Niemann-Pick C1 Like 1 Protein Is Critical for Intestinal Cholesterol Absorption. Science 303, 1201–1204 (2004). [DOI] [PubMed] [Google Scholar]
- 6.Cyster JG, Dang EV, Reboldi A & Yi T 25-Hydroxycholesterols in innate and adaptive immunity. Nat Rev Immunol 14, 731–743 (2014). [DOI] [PubMed] [Google Scholar]
- 7.Hannedouche S et al. Oxysterols direct immune cell migration via EBI2. Nature 475, 524–527 (2011). [DOI] [PMC free article] [PubMed] [Google Scholar]
- 8.Kelly LM, Pereira JP, Yi T, Xu Y & Cyster JG EBI2 Guides Serial Movements of Activated B Cells and Ligand Activity Is Detectable in Lymphoid and Nonlymphoid Tissues. J Immunol 187, 3026–3032 (2011). [DOI] [PMC free article] [PubMed] [Google Scholar]
- 9.Trindade BC et al. Intracellular sterol sensing controls intestinal B cell differentiation. Immunity (2021). [Google Scholar]
- 10.Emgård J et al. Oxysterol Sensing through the Receptor GPR183 Promotes the Lymphoid-Tissue-Inducing Function of Innate Lymphoid Cells and Colonic Inflammation. Immunity 48, 120–132.e8 (2018). [DOI] [PMC free article] [PubMed] [Google Scholar]
- 11.Russell DW The enzymes,regulation, and genetics of bile acids synthesis. Annu Rev Biochem 72, 137–174 (2003). [DOI] [PubMed] [Google Scholar]
- 12.Griffiths WJ, Abdel-Khalik J, Crick PJ, Yutuc E & Wang Y New methods for analysis of oxysterols and related compounds by LC–MS. Elsevier Ltd 162, 4–26 (2016). [DOI] [PubMed] [Google Scholar]
- 13.Borah K et al. A quantitative LC-MS/MS method for analysis of mitochondrial -specific oxysterol metabolism. Redox Biol 36, 101595 (2020). [DOI] [PMC free article] [PubMed] [Google Scholar]
- 14.J. F, M. L & G.H.S. S A simple method for the isolation and purification of total lipides from animal tissues. Journal of Biological Chemistry 226, 497–550 (1957). [PubMed] [Google Scholar]
- 15.Baumana DR et al. 25-Hydroxycholesterol secreted by macrophages in response to Toll-like receptor activation suppresses immunoglobulin A production. PNAS 106, 16764–16769 (2009). [DOI] [PMC free article] [PubMed] [Google Scholar]
- 16.Reboldi A et al. 25-Hydroxycholesterol suppresses interleukin-1–driven inflammation downstream of type I interferon. Science 345, 679–684 (2014). [DOI] [PMC free article] [PubMed] [Google Scholar]
- 17.Vaishnava S et al. The Antibacterial Lectin RegIIIγ Promotes the Spatial Segregation of Microbiota and Host in the Intestine. Science 334, 255–258 (2011). [DOI] [PMC free article] [PubMed] [Google Scholar]
- 18.Davis HR et al. Niemann-Pick C1 Like 1 (NPC1L1) Is the Intestinal Phytosterol and Cholesterol Transporter and a Key Modulator of Whole-body Cholesterol Homeostasis. J Biol Chem 279, 33586–33592 (2004). [DOI] [PubMed] [Google Scholar]
- 19.Endo A, Kuroda M & Tsujita Y ML-236A, ML-236B, and ML-236C, new inhibitors of cholesterogenesis produced by Penicillium Citrinum. The journal of Antibiotics 29, 1346–1348 (1976). [DOI] [PubMed] [Google Scholar]
- 20.Wang DQ-H Regulation of Intestinal Cholesterol Absorption. Annu Rev Physiol 69, 221–248 (2007). [DOI] [PubMed] [Google Scholar]
- 21.Repa JJ et al. Disruption of the Sterol 27-Hydroxylase Gene in Mice Results in Hepatomegaly and Hypertriglyceridemia reversal by cholic acid feeding. J Biol Chem 275, 39685–39692 (2000). [DOI] [PubMed] [Google Scholar]
- 22.Joseph SB, Castrillo A, Laffitte BA, Mangelsdorf DJ & Tontonoz P Reciprocal regulation of inflammation and lipid metabolism by liver X receptors. Nat Med 9, 213–219 (2003). [DOI] [PubMed] [Google Scholar]
- 23.Randolph GJ & Miller NE Lymphatic transport of high-density lipoproteins and chylomicrons. J Clin Invest 124, 929–935 (2014). [DOI] [PMC free article] [PubMed] [Google Scholar]
- 24.Tso P & Gollamudi SR Pluronic L-81: a potent inhibitor of the transport of intestinal chylomicrons. America journal of physiology 247, G32–G36 (1984). [DOI] [PubMed] [Google Scholar]
- 25.Johnston TP & Palmers WK Mechanism of Poloxamer 407-induced Hyperglyceridemia in the rat. Biochemical Pharmacology 46, 1037–1042 (1993). [DOI] [PubMed] [Google Scholar]
- 26.Huang L-H et al. Postprandial Chylomicron Output and Transport Through Intestinal Lymphatics Are Not Impaired in Active Crohn’s Disease. Gastroenterology 159, 1955–1957.e2 (2020). [DOI] [PMC free article] [PubMed] [Google Scholar]
- 27.Schippers A et al. Mucosal Addressin Cell-Adhesion Molecule-1 Controls Plasma-Cell Migration and Function in the Small Intestine of Mice. Gastroenterology 137, 924–933 (2009). [DOI] [PubMed] [Google Scholar]
- 28.Palm NW et al. Immunoglobulin A Coating Identifies Colitogenic Bacteria in Inflammatory Bowel Disease. Cell 158, 1000–1010 (2014). [DOI] [PMC free article] [PubMed] [Google Scholar]
- 29.Tellier J et al. Blimp-1 controls plasma cell function through the regulation of immunoglobulin secretion and the unfolded protein response. Nat Immunol 17, 323–330 (2016). [DOI] [PMC free article] [PubMed] [Google Scholar]
- 30.Jiang H et al. Unfolded protein response inducers tunicamycin and dithiothreitol promote myeloma cell differentiation mediated by XBP-1. Clin Exp Med 15, 85–96 (2015). [DOI] [PubMed] [Google Scholar]
- 31.Lindner C et al. Age, microbiota, and T cells shape diverse individual IgA repertoires in the intestine. J Exp Med 209, 365–377 (2012). [DOI] [PMC free article] [PubMed] [Google Scholar]
- 32.Zhi J et al. Metabolic Profiles of Minimally Absorbed Orlistat in Obese/Overweight Volunteers. Journal of Clin Pharmacol 11, 1006–1011 (1996). [DOI] [PubMed] [Google Scholar]
- 33.Lopes N et al. Distinct metabolic programs established in the thymus control effector functions of γδ T cell subsets in tumor microenvironments. Nat Immunol 22, 179–192 (2021). [DOI] [PMC free article] [PubMed] [Google Scholar]
- 34.Gatto D, Bauer M, Martin SW & Bachmann MF Heterogeneous antibody repertoire of marginal zone B cells specific for virus-like particles. Microbes Infect 9, 391–399 (2007). [DOI] [PubMed] [Google Scholar]
- 35.Rojas OL et al. Recirculating Intestinal IgA-Producing Cells Regulate Neuroinflammation via IL-10. Cell 176, 610–624.e18 (2019). [DOI] [PMC free article] [PubMed] [Google Scholar]
- 36.Cyster JG, Dang EV, Reboldi A & Yi T 25-Hydroxycholesterols in innate and adaptive immunity. Nature Publishing Group 14, 731–743 (2014). [DOI] [PubMed] [Google Scholar]
- 37.Guzman M et al. An integrin αEβ7-dependent mechanism of IgA transcytosis requires direct plasma cell contact with intestinal epithelium. Mucosal Immunol 14, 1347–1357 (2021). [DOI] [PMC free article] [PubMed] [Google Scholar]
- 38.Lu E, Dang EV, McDonald JG & Cyster JG Distinct oxysterol requirements for positioning naïve and activated dendritic cells in the spleen. Sci Immunol 2, eaal5237 (2017). [DOI] [PMC free article] [PubMed] [Google Scholar]
- 39.Masopust D & Soerens AG Tissue-Resident T Cells and Other Resident Leukocytes. Annu Rev Immunol 37, 1–26 (2019). [DOI] [PMC free article] [PubMed] [Google Scholar]
- 40.Hayward SL et al. Environmental cues regulate epigenetic reprogramming of airway-resident memory CD8+ T cells. Nat Immunol 21, 309–320 (2020). [DOI] [PMC free article] [PubMed] [Google Scholar]
- 41.Pan Y et al. Survival of tissue-resident memory T cells requires exogenous lipid uptake and metabolism. Nature 543, 1–17 (2017). [DOI] [PMC free article] [PubMed] [Google Scholar]
- 42.Penny HA et al. Rhythmicity of intestinal IgA responses confers oscillatory commensal microbiota mutualism. Sci Immunol 7, eabk2541 (2022). [DOI] [PMC free article] [PubMed] [Google Scholar]
- 43.Weichhart T, Hengstschläger M & Linke M Regulation of innate immune cell function by mTOR. Nat Rev Immunol 15, 599–614 (2015). [DOI] [PMC free article] [PubMed] [Google Scholar]
- 44.Chiang JYL & Ferrell JM Bile Acids as Metabolic Regulators and Nutrient Sensors. Annu. Rev. Nutr. 39, 175–200 (2019). [DOI] [PMC free article] [PubMed] [Google Scholar]
- 45.Wahlström A, Sayin SI, Marschall H-U & Bäckhed F Intestinal Crosstalk between Bile Acids and Microbiota and Its Impact on Host Metabolism. Cell Metabolism 24, 41–50 (2016). [DOI] [PubMed] [Google Scholar]
- 46.Sayin SI et al. Gut Microbiota Regulates Bile Acid Metabolism by Reducing the Levels of Tauro-beta-muricholic Acid, a Naturally Occurring FXR Antagonist. Cell Metabolism 17, 225–235 (2013). [DOI] [PubMed] [Google Scholar]
- 47.Pabst O & Slack E IgA and the intestinal microbiota: the importance of being specific. Mucosal Immunol 13, 1–10 (2019). [DOI] [PMC free article] [PubMed] [Google Scholar]
- 48.Kotas ME & Locksley RM Why Innate Lymphoid Cells? Immunity 48, 1081–1090 (2018). [DOI] [PMC free article] [PubMed] [Google Scholar]
- 49.Kanneganti T-D & Dixit VD Immunological complications of obesity. Nat Immunol 13, 707–712 (2012). [DOI] [PubMed] [Google Scholar]
- 50.Frascoli M, Reboldi A & Kang J Dietary Cholesterol Metabolite Regulation of Tissue Immune Cell Development and Function. J Immunol 209, 645–653 (2022). [DOI] [PMC free article] [PubMed] [Google Scholar]
References
- 51.Gatto D et al. The chemotactic receptor EBI2 regulates the homeostasis, localization and immunological function of splenic dendritic cells. Nat Immunol 14, 446–453 (2013). [DOI] [PubMed] [Google Scholar]
- 52.Pereira JP, Kelly LM, Xu Y & Cyster JG EBI2 mediates B cell segregation between the outer and centre follicle. Nature 460, 1122–1126 (2009). [DOI] [PMC free article] [PubMed] [Google Scholar]
- 53.Chen S, Lee B, Lee AY-F, Modzelewski AJ & He L Highly Efficient Mouse Genome Editing by CRISPR Ribonucleoprotein Electroporation of Zygotes. J Biol Chem 291, 14457–14467 (2016). [DOI] [PMC free article] [PubMed] [Google Scholar]
- 54.Moor K et al. Analysis of bacterial-surface-specific antibodies in body fluids using bacterial flow cytometry. Nat Protoc 11, 1531–1553 (2016). [DOI] [PubMed] [Google Scholar]
- 55.Reboldi A et al. IgA production requires B cell interaction with subepithelial dendritic cells in Peyers patches. Science 352, aaf4822–aaf4822 (2016). [DOI] [PMC free article] [PubMed] [Google Scholar]
- 56.Miyoshi H & Stappenbeck TS In vitro expansion and genetic modification of gastrointestinal stem cells in spheroid culture. Nat Protoc 8, 2471–2482 (2013). [DOI] [PMC free article] [PubMed] [Google Scholar]
- 57.Callahan BJ et al. DADA2: High-resolution sample inference from Illumina amplicon data. Nat Methods 13, 581–583 (2016). [DOI] [PMC free article] [PubMed] [Google Scholar]
- 58.Love MI, Huber W & Anders S Moderated estimation of fold change and dispersion for RNA-seq data with DESeq2. Genome Biol 15, 550 (2014). [DOI] [PMC free article] [PubMed] [Google Scholar]
Associated Data
This section collects any data citations, data availability statements, or supplementary materials included in this article.


