

Keywords: brown adipose tissue, mitochondria, mitochondrial complex II, oxaloacetate, succinate dehydrogenase
Abstract
We previously found that skeletal muscle mitochondria incubated at low membrane potential (ΔΨ) or interscapular brown adipose tissue (IBAT) mitochondria, wherein ΔΨ is intrinsically low, accumulate oxaloacetate (OAA) in amounts sufficient to inhibit complex II respiration. We proposed a mechanism wherein low ΔΨ reduces reverse electron transport (RET) to complex I causing a low NADH/NAD+ ratio favoring malate conversion to OAA. To further assess the mechanism and its physiologic relevance, we carried out studies of mice with inherently different levels of IBAT mitochondrial inner membrane potential. Isolated complex II (succinate)-energized IBAT mitochondria from obesity-resistant 129SVE mice compared with obesity-prone C57BL/6J displayed greater UCP1 expression, similar O2 flux despite lower ΔΨ, similar OAA concentrations, and similar NADH/NAD+. When GDP was added to inhibit UCP1, 129SVE IBAT mitochondria, despite their lower ΔΨ, exhibited much lower respiration, twofold greater OAA concentrations, much lower RET (as marked by ROS), and much lower NADH and NADH/NAD+ ratios compared with the C57BL/6J IBAT mitochondria. UCP1 knock-out abolished OAA accumulation by succinate-energized mitochondria associated with markedly greater ΔΨ, ROS, and NADH, but equal or greater O2 flux compared with WT mitochondria. GDP addition, compared with no GDP, increased ΔΨ and complex II respiration in wild-type (WT) mice associated with much less OAA. Respiration on complex I substrates followed the more classical dynamics of greater respiration at lower ΔΨ. These findings support the abovementioned mechanism for OAA- and ΔΨ-dependent complex II respiration and support its physiological relevance.
NEW & NOTEWORTHY We examined mitochondrial respiration initiated at mitochondrial complex II in mice with varying degrees of brown adipose tissue UCP1 expression. We show that, by affecting inner membrane potential, UCP1 expression determines reverse electron transport from complex II to complex I and, consequently, the NADH/NAD+ ratio. Accordingly, this regulates the level of oxaloacetate accumulation and the extent of oxaloacetate inhibition of complex II
INTRODUCTION
Oxaloacetate (OAA) inhibition of succinate dehydrogenase (SDH or mitochondrial complex II) has been documented in studies dating back several decades. However, the physiological significance of this phenomenon has received little attention, likely for multiple reasons. First, OAA is unstable making it very difficult to detect by mass spectrometry or other means. Moreover, studies of complex II-energized respiration have classically been performed by energizing mitochondria with succinate along with rotenone to block reverse electron flow to complex I. But rotenone also blocks malate conversion to OAA, thus obscuring any feedback effect of OAA to inhibit complex II. Furthermore, as our past work has shown (see below), the effect of OAA to inhibit SDH in actively respiring mitochondria is dependent on inner membrane potential (ΔΨ). Therefore, to control the effect of ΔΨ on OAA production and O2 flux under phosphorylating conditions, it is necessary to maintain a steady level of potential. This is often not done in studies of isolated mitochondria. Rather, the usual procedure is to add a given amount of ADP which decreases ΔΨ, but then increases ΔΨ as ADP is continuously consumed by ATP synthase.
In our past work, we showed that the effect of OAA to inhibit complex II respiration in actively respiring mitochondria isolated from skeletal muscle and interscapular brown adipose tissue (IBAT) is highly dependent on ΔΨ (1–3). To demonstrate this, we performed studies of succinate-energized O2 flux under conditions wherein ADP concentrations, and consequently ΔΨ, are clamped, enabling measurement of respiration at given constant levels of membrane potential. In addition, we used a highly specific two-dimensional (2-D) NMR method that we developed (4, 5) using 13C-labeled TCA substrates to determine OAA concentrations.
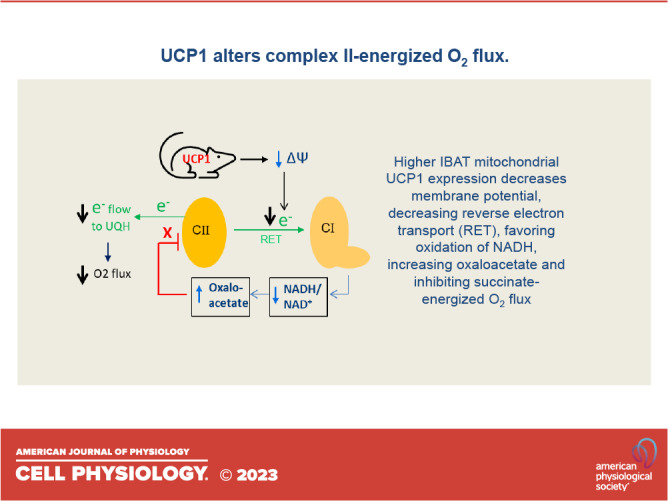
Our work provided evidence that the underlying mechanism involved the metabolic steps depicted in Fig. 1. Respiration energized at complex II has been shown to generate reverse electron transport (RET) to complex I (6) which, in turn, maintains the NADH/NAD+ redox couple in the reduced state (7, 8) impairing the malate dehydrogenase (MDH) reaction that generates OAA. Of note, RET is highly dependent on ΔΨ, being much greater at high than low potential (9, 10). In our past work (2–5), we energized complex II in skeletal muscle, heart, and IBAT mitochondria with succinate (in the absence of rotenone) under conditions wherein ΔΨ was clamped at different levels. At low ΔΨ, RET, as marked by reactive oxygen species (ROS), was very low allowing NADH/NAD+ recycling, OAA production by MDH, and OAA inhibition of O2 flux. However, at high ΔΨ, RET was high and NADH was maintained in the reduced state impairing MDH, resulting in less accumulation of OAA thereby enabling greater respiration. These findings supported the mechanism shown in Fig. 1.
Figure 1.

Mechanism explaining the regulation of OAA production and succinate dehydrogenase (SDH) activity by mitochondrial membrane potential (ΔΨ). SDH activity is depicted at high ΔΨ (A) and low ΔΨ (B). At high ΔΨ, reverse electron transport (RET) from complex II to complex I enhances ROS production as superoxide which is converted to H2O2 by superoxide dismutase. RET also directs electrons in reverse fashion to maintain NADH in the reduced state. Consequently, maintaining reduced NADH limits dinucleotide cycling, limiting malate dehydrogenase activity and OAA production, and prevents OAA inhibition of SDH. At low ΔΨ, RET is much reduced enabling oxidation of NADH, OAA production, and inhibition of SDH. Note that the malate dehydrogenase reaction is far to the left by equilibrium dynamics, but only small amounts of OAA are needed for inhibition of SDH. Also note that ROS when measured as H2O2 serves as a marker for RET activity. Letter sizes reflect the level of compound concentration. UQH = reduced form of coenzyme Q.
Our past work involved only mitochondria of a single strain of mice (C57BL/6J) wherein manipulation of membrane potential was performed ex vivo. The goals of this current work were to: 1) to assess the physiological relevance of OAA inhibition of complex II by determining whether mitochondria with intrinsically different levels of ΔΨ as programmed by mouse strain and/or genetic manipulation of UCP1 expression would display different degrees of OAA-inhibited respiration and 2) to determine whether these differences in complex II function occur in accord with and, thus, support the mechanism proposed in Fig. 1. To assess this, we examined IBAT mitochondrial function in organelles of C57BL/6J (C57) and 129SVE (129) mice. Several years ago, we found that IBAT mitochondria of 129 mice compared with C57 expressed greater molar amounts of UCP1 associated with greater proton conductance (11). In addition to further assess the effects of in vivo regulated UCP1, we examined OAA-regulated IBAT mitochondrial function in organelles of UCP1 knockout (KO) and wild-type (WT) mice.
Here, we report that UCP1 expression in mitochondria, of contrasting strain or genetically determined ΔΨ, determines OAA-dependent regulation of SDH. Our results support the physiologic relevance of ΔΨ-dependent OAA action and support the mechanism proposed in Fig. 1 and may have implications towards differential energy use by mice dependent on UCP1 expression.
MATERIALS AND METHODS
Reagents and Supplies
[U-13C]-succinate, and [U-13C]-malate were obtained from Millipore Sigma, Burlington, MA. Otherwise, reagents, kits, and supplies were as specified or purchased from standard sources.
Animal Procedures
Animals were maintained according to National Institute of Health guidelines and the protocol was approved by our Institutional Animal Care and Use Committee. Male C57BL/6J (C57) mice were ordered from Jackson Laboratories (Bar Harbor, ME). Male 129S6/SvEvTac (129) mice (Model No. 129SVE-M) were ordered from Taconic (Germantown, NY). We obtained a breeder pair of heterozygous UCP1 knockout and wild-type mice (B6.129-Ucp1tm1Kz/J, Strain No. 003124) from the Jackson Laboratory. The breeder mice were used to establish a colony of homozygous UCP1 knockout (UCP1KO) and sibling wild-type mice. All individual measurements comparing WT and KO mice used littermates of the same gender as indicated in the figure legends. All C57 and 129 mice and all WT and UCP1 KO mice were fed a normal rodent diet (diet 7001, Teklad, Envigo, Indianapolis, IN) until euthanize at age 6 to 10 wk. An exception was that measurements of body fat, lean, and fluid distribution in the UCP1 KO and WT mice were done at age 17–18 wk due to an unfortunate technical delay involving research equipment. Mice were euthanized by isoflurane overdose and cardiac puncture. For all experiments within the 6- to 10-wk group, all comparative measurements were done using age and gender matched mice.
Preparation of Mitochondria and Mitochondrial Yield
Mitochondria were prepared from IBAT by differential centrifugation and purified using a Percoll gradient as we have described in the past (12). Mitochondrial integrity was assessed by cytochrome C release using a commercial kit (Cytochrome C Oxidase Assay Kit, Millipore-Sigma, St. Louis), indicating a mean of 96% intact mitochondria, an acceptable range compared with mitochondrial preparations from several sources (13). Including all experiments, we prepared 32 mitochondrial extracts from each of the C57 and 129 mice. Respective mitochondrial yields (± SE) for the C57 and 129 mice were 1.86 ± 0.06 and 2.00 ± 0.08 mg (P = 0.16); wet tissue weights were 145 ± 3 and 170 ± 4 mg (P < 0.001) and yields per tissue weight were 12.9 ± 0.4 and 12.1 ± 0.6 µg/mg (P = 0.26). We prepared 11 mitochondrial extracts from each of the WT and KO mice. Respective mitochondrial yields (± SE) for the WT and KO mice were 1.77 ± 0.10 and 2.76 ± 0.15 mg (P < 0.001); wet tissue weights were 124 ± 5 and 240 ± 16 mg (P = 0.005) and yields per tissue weight were 14.3 ± 0.58 and 11.8 ± 0.69 µg/mg (P = 0.011). These KO and WT differences are consistent with the known greater lipid content of IBAT in UCP1KO versus WT mice (14).
Respiration and Membrane Potential
All studies of mitochondrial respiration and inner membrane potential used freshly isolated and purified mitochondria on the day of the experiments. O2 flux was determined using an Oxygraph-2k high-resolution respirometer (Oroboros Instruments, Innsbruck, Austria). When measured, ΔΨ was determined simultaneously with respiration using a potential sensitive tetraphenylphosphonium (TPP+) electrode fitted into the Oxygraph incubation chamber with a volume of 2 mL. A TPP+ standard curve was performed in each run by adding tetraphenylphosphonium chloride at concentrations of 0.5, 1, and 1.5 μM before the addition of mitochondria to the chamber. Mitochondria (175 μg protein/mL) were fueled by different substrates consisting of 5 mM pyruvate +1 mM malate or 10 mM succinate. Mitochondria were incubated at 37°C in 2 mL of ionic respiratory buffer (105 mM KCl, 10 mM NaCl, 5 mM Na2HPO4, 2 mM MgCl2, 10 mM HEPES pH 7.2, 1 mM EGTA, 0.2% defatted BSA).
Although the O2 tension in the Oxygraph drops with time, the rate of respiration is little affected until levels become very low. However, since incubations were carried out for 20 min, it was necessary to open the chamber at certain points to prevent marked deterioration in the oxygen content of the medium. A representative Oxygraph tracing is shown in Supplemental Fig. S1. There is a downward trend over time which is steady rather than fluctuating and likely represents a natural kinetic trend possibly affected by the accumulation of OAA over time. Loading less mitochondria per chamber would lessen the need to reopen. However, we had to balance this against the quantity of mitochondria needed not only for O2 flux and ΔΨ but also for metabolite concentrations determined on the chamber contents at the end of the incubation periods.
Metabolite Measurements by NMR
Metabolite measurements were performed as we previously described (3–5) on the contents of the Oxygraph chamber after mitochondrial incubation with 13C-labeled substrates for 20 min in the same media used for measuring respiration. Immediately after mitochondrial incubations, 1.5 mL of the chamber content was placed in tubes on ice and acidified with 91 µL of 70% perchloric acid. The solutions were then thoroughly mixed, sonicated on ice for 30 s at a power setting of 4 W, and stored at −80°C for up to 2 wk. The sample tubes were then thawed on ice and centrifuged at 50,000 g for 20 min at 4°C. Supernatants were removed and 10 N KOH was added to bring the pH to 7.4 followed by centrifugation at 16,000 g for 15 min at 4°C to remove precipitated salts. The cleared, neutralized supernatants were then stored at −80°C before NMR studies. For NMR sample preparations, 350 µL of the stored supernatant was added to 150 µL of 50 mM sodium phosphate, pH 7.4 in deuterium oxide for metabolite measurement. 13C and 1H NMR assignments of succinate, malate, fumarate, oxaloacetate (OAA), citrate, and pyruvate were obtained by using standard compounds. OAA was found to be unstable with a half-life ∼14 h when tested at pH 7.4 and temperature at 25°C. Therefore, after mitochondrial incubation, perchloric acid extraction was carried out as quickly as possible to destroy the mitochondrial enzymes and minimize the degradation of OAA. In addition, for determination of stability, known amounts of OAA were subjected to parallel incubation, perchloric acid extraction, neutralization, and storage.
In recently reported work (15), we examined the effect of sample storage under the acidified condition for oxaloacetate, malate, fumarate, and pyruvate. No loss of stability was found over 1- or 2-wk time periods. Succinate and citrate should be stable when acidified based on their structure. Moreover, even if there were some small effects of storage, that should be equal for samples comparing one condition to another (as samples from each condition for a given experiment were stored side by side over the same time period).
Both 13C/1H HSQC and HMQC spectra as well as 1-D 1H NMR spectra were collected at 25°C on a Bruker Avance II 800 MHz NMR spectrometer equipped with a sensitive cryoprobe for the perchloric acid-extracted samples for quantification of metabolites of the mitochondrial incubations. All NMR spectra were processed using NMRPipe package (16) and analyzed using NMRView (17). Peak heights were used for quantification.
Of note, the metabolite concentrations measured here were determined on the respiratory medium after disruption of mitochondria. For the added substrates, 13C-succinate and 13C-malate, these values largely reflect additions to the medium. All other 13C-metabolites could only have accumulated from mitochondrial metabolism. This is because the 2-D NMR technique measures only 13C-labeled metabolites generated from the added 13C-substrates and does not reflect the presence or metabolism of any unlabeled compounds that might have been present in our mitochondria after isolation. Pyruvate was quantified by 1-D 1H NMR spectra, while all other metabolites were quantified by 2-D 13C/1H HSQC and/or HMQC spectra.
NADH/NAD+ Assay
The redox state of mitochondrial nicotinamide adenine dinucleotide (NAD) was quantified by using a commercially available Promega NAD+/NADH Kit (Cat No. #G9071) and Fluostar Optima (Offenburg, Germany) plate reader system. All samples were processed and assayed as per the instructions of the manufacturer for separate measurements of NADH and NAD+.
H2O2 Production
Mitochondria were incubated in microplate wells with shaking for 20 min in ionic respiratory buffer, mimicking the conditions used for our Oxygraph incubations. H2O2 production was assessed at 37°C as we have previously described (18) using the fluorescent probe 10-acetyl-3,7-dihydroxyphenoxazine (Amplex Red; Thermo Fisher Scientific), a highly sensitive and stable substrate for horseradish peroxidase and a well-established probe for isolated mitochondria (7, 19). Fluorescence was measured, and quantification was carried out as we previously described (18).
ATP Production
ATP production was determined by 13C/1H 2-D NMR as we previously described (20). In brief, the incubation media included 32 µM ADP and saturating amounts of 13C-2-deoxyglucose (2DOG, 10 mM) and hexokinase (10 units/ml) which recycle ATP back to ADP by rapid and irreversible conversion of 2DOG to 2-deoxyglucose phosphate (2DOGP). ATP production rates are calculated based on the percent conversion of 2DOG to 2DOGP, incubation volume, and incubation time.
Immunoblot Analyses
Thirty micrograms of protein per lane were separated on a precast gel (Ready Gel, Stain-Free, TGX 4–20% 10-Well, BioRad, Hercules, CA) and electroblotted to nitrocellulose membranes (BioRad 0.45 µm). Blots were blocked with 5% milk in Tris-buffered saline with 0.1% Tween-20 (T-TBS) for 30 min and incubated overnight at 4°C with affinity-purified antibody to UCP1 (1/5000, Rabbit anti-mouse polyclonal UCP1, Alpha Diagnostic International, San Antonio, TX, #UCP12-A-100UL). The specificity of the UCP1 antibody was documented in our laboratory by lack of reactivity with mitochondrial extracts from liver, muscle, and brain, and by inhibition of signals by the peptide used to make the antibody. Blots were washed with T-TBS and exposed to anti-rabbit horseradish peroxidase (HRP)-conjugated secondary antibody (1/20,000, Anti-rabbit IgG, HRP-linked Antibody, Cell Signaling Technology, Danvers, MA, #7074S). Blots were washed again and developed by enhanced chemiluminescence using a standard kit (ECL prime, Amersham Pharmacia Biotech, Piscataway, NJ).
SDH Activity
Mitochondrial complex II activity was assessed using a MitoCheck Complex II Activity Assay Kit (#700940, Cayman Chemical, Ann Arbor, MI). Mitochondria preparations were stored at −80°C before the assay. 2.5 μg of mitochondrial protein was used in each assay well of 96-well half-area plates supplied with the kit. Complete reaction mixture was added at time zero, and included 2 μM rotenone, 10 μM antimycin A, and 1 mM KCN to inhibit complexes I, III, and IV, respectively. The absorbance at 600 nm was measured in a plate reader at room temperature for 25 min. The negative slope of the absorbance from 5 min to 25 min was used for determining complex II activity.
O2 Flux Normalized to SDH Activity
In this current study, we are interested in measuring succinate-energized O2 flux in respiring mitochondria which is far different from SDH activity as determined in extracts of mitochondrial protein. Nonetheless, our comparisons of succinate-energized respiration in the Oxygraph respirometer between conditions studied could be affected by any differences in the amount of SDH or by any possible post-translational modifications. Both of these factors would show up in the above-described assay for complex II activity in extracts. Therefore, for KO and WT mitochondria where we observed a difference in intrinsic activity (see results), we expressed succinate-energized respiration both as directly measured in the Oxygraph and as normalized to SDH activity in mitochondrial extracts. Normalization was determined as O2 flux divided by the mean intrinsic SDH activity for KO or WT mitochondria.
Body Composition
Total body, fat, lean, and fluid mass were determined by nuclear magnetic resonance (NMR) spectroscopy using a Bruker mini-spec LF 90II instrument. To analyze body composition, mice were placed into a restraint tube and inserted into the rodent-sized NMR apparatus adjusting the volume of the chamber based on the size of the animal.
Statistics
Data were analyzed by unpaired, two-tailed t test for data that passed normality tests or by the Mann–Whitney test for nonparametric data as indicated in the figure legends. Statistical analyses and normality testing were done using GraphPad Prism (GraphPad Software, Inc., La Jolla, CA). Significance was considered at P < 0.05. For all experiments, the “n” values reported in the figures represent determinations of mitochondria from individual mice. For NADH and NAD+, H2O2 production, and ATP production each individual “n” of 1 actually represents the mean of replicate values determined four times for each mitochondrial preparation (e.g., an n of 4 represents 16 total measurements).
RESULTS
Mouse Characteristics by Strain (C57 and 129)
As shown in Fig. 2, IBAT UCP1 expression is reduced by ∼40% in 6- to 10-wk-old C57 compared with 129 mitochondria. Although this was not associated with differences in body mass, 129 mice had more fat and less lean tissue versus C57. SDH activity in mitochondrial extracts did not differ by strain.
Figure 2.

Characteristics of 129SVE (129) and C57BL/6J mice (C57). Studies used male mice of age 6–10 wk and age matched within this range. A: representative immunoblot demonstrating UCP1 expression in extracts of IBAT mitochondria (30 µg/lane) isolated from C57 (lanes 1, 3, 5, and 7) or 129 (lanes 2, 4, 6, and 8) mice. B: quantitative UCP1 expression in C57 and 129 IBAT mitochondria (n = 7). C: succinate dehydrogenase activity in extracts of C57 and 129 IBAT mitochondria (n = 6). D: body mass, % whole body fat, lean mass, and fluid mass by mouse strain (n = 11). Data represent means ± SE and individual values, P values by unpaired, two-tailed t test. IBAT, interscapular brown adipose tissue; SDH, succinate dehydrogenase.
Complex II-Energized IBAT Mitochondrial Function and OAA by Mouse Strain
Figure 3A shows that succinate-energized respiration was initially higher in the 129 mitochondria but became equal to the C57 by 10 min despite lower potential (Fig. 3B), which should classically increase O2 flux. OAA accumulated equally in the mitochondria of both strains while the OAA/malate ratio (reflecting the malate dehydrogenase reaction), H2O2 production, ATP production, NADH, and the NADH/NAD+ ratio did not differ (Fig. 3, C–F). Note that H2O2 and ATP production are very low in the absence compared with the presence of GDP (compare Fig. 3, D and E with Fig. 3, J and K), which is not surprising given that potential is low unless GDP is present to inhibit UCP1.
Figure 3.
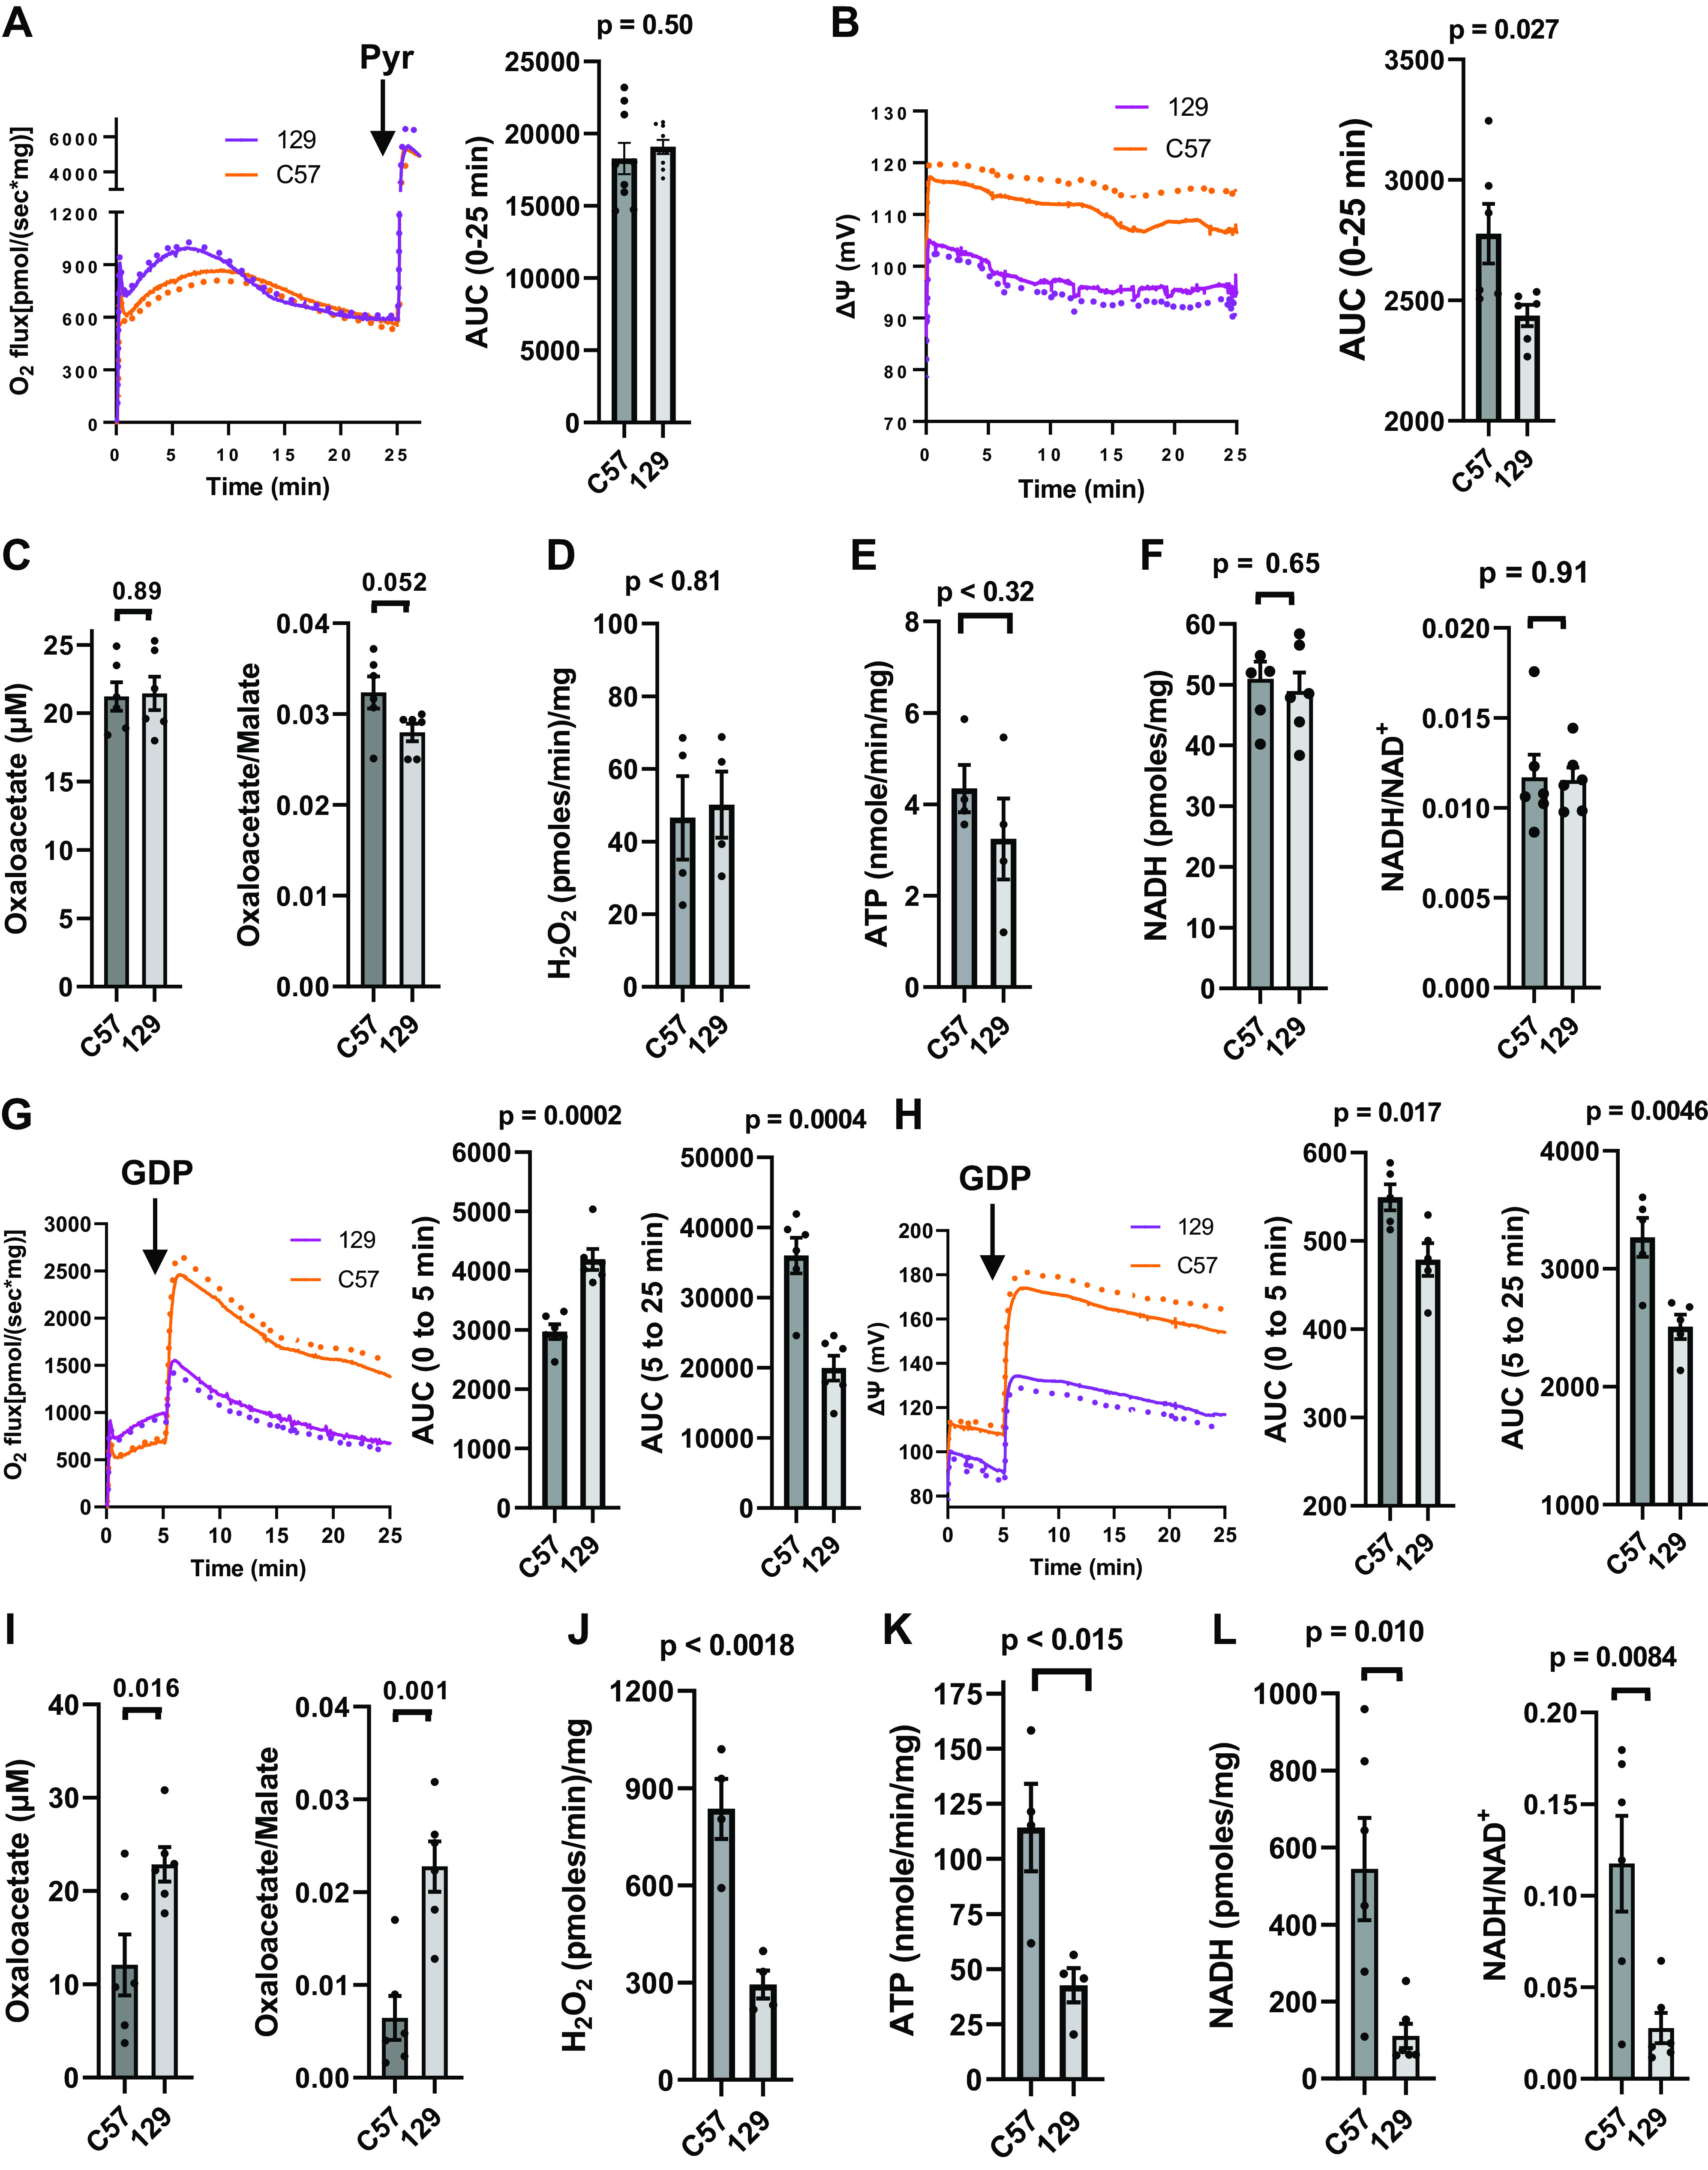
Functional parameters determined in IBAT mitochondria isolated from male C57 or 129 mice energized with [U-13C]-10 mM succinate. A: mean respiration (dotted lines indicate SE) and area under curves (AUC) (n = 9). Pyruvate (pyr, 0.5 mM) was added at the 25 min timepoint in three of the nine incubations. Pyruvate was not included in any studies shown in subsequent panels. B: mean inner membrane potential (ΔΨ, dotted lines indicate SE) and AUC (n = 7). C: oxaloacetate acid (OAA) and the OAA/malate ratio in the incubation chambers at 25 min (n = 6). D, E: H2O2 and ATP production monitored for 25 min (n = 4) in mitochondria subject to the same conditions used for our Oxygraph incubations. F: NADH and the NADH/NAD+ ratio measured in mitochondria harvested from the incubation chambers used in A and B at 25 min (n = 6). G–L: Analogous parameters to A–F, respectively, in mitochondria incubated with the addition of 1 mM GDP at the 5-min timepoint (n = 6 for respiration, n = 5 for ΔΨ, n = 6 for OAA and the OAA/malate ratio, n = 4 for H2O2 and ATP production, n = 6 for NADH and the NADH/NAD+ ratio). Data represent means ± SE and individual values, P values determined by unpaired, two-tailed t test.
When GDP, a potent inhibitor of UCP1 (21), was added at the 5-min timepoint (Fig. 3, G and H) under the same substrate conditions as Fig. 3, A and B, respiration and ΔΨ increased markedly but more so for the C57 mitochondria. OAA accumulation, which would have begun to accumulate while ΔΨ was low in the first 5 min, and the OAA/malate ratio were much reduced in the C57 mitochondria versus 129 (Fig. 3I). In contrast to the classical association of high ΔΨ with lower O2 flux, respiration (Fig. 3G) increased after GDP in both strains but to a lesser extent in the 129 mitochondria wherein OAA and the OAA/malate ratio were greater (Fig. 3I). The lower O2 flux in the 129 mitochondria was associated with far less H2O2, less ATP, less NADH, and a lower NADH/NAD+ ratio (Fig. 3, J, K, and L). These strain differences in the above parameters are in line with the mechanism shown in Fig. 1.
Regarding the gradual decrease in respiration seen for both strains in Fig. 3A, this likely represents gradual accumulation of OAA over time. This was not due to mitochondrial dysfunction or damage over time since the addition of a low (0.5 mM) concentration of pyruvate, enough to clear OAA to citrate (3), resulted in a rapid increase in O2 flux (Fig. 3A). We note that respiration gradually trended downward for both strains after GDP addition at the 5-min point (Fig. 3G). The reasons for this are not clear but possibly related to a time effect of OAA.
Complex I-Energized IBAT Mitochondrial Function and OAA by Mouse Strain
To show that the GDP induced rise in potential and consequent OAA inhibition of respiration is an effect of energy input at complex II and not a more general effect, we also examined OAA and respiration energized at complex I. Figure 4, A and B shows that 129 mitochondria energized at complex I displayed non-significantly lower ΔΨ than C57 mitochondria, while respiration was about equal. As expected, OAA did not accumulate in these mitochondria (Fig. 4C) since pyruvate, by generating acetyl-CoA, would rapidly clear OAA to citrate (3). When GDP was added at the 5 min timepoint to inhibit UCP1, O2 flux decreased and ΔΨ increased in both strains (Fig. 4, D and E). After GDP (5 to 25 min), ΔΨ was significantly greater in the C57 versus 129 mitochondria associated with a non-significant decrease in O2 flux. Again, OAA was not detected (Fig. 4F). The strain differences in O2 flux and ΔΨ (Fig. 4, D and E) are as expected based on the classical effect of low ΔΨ to increase respiration.
Figure 4.
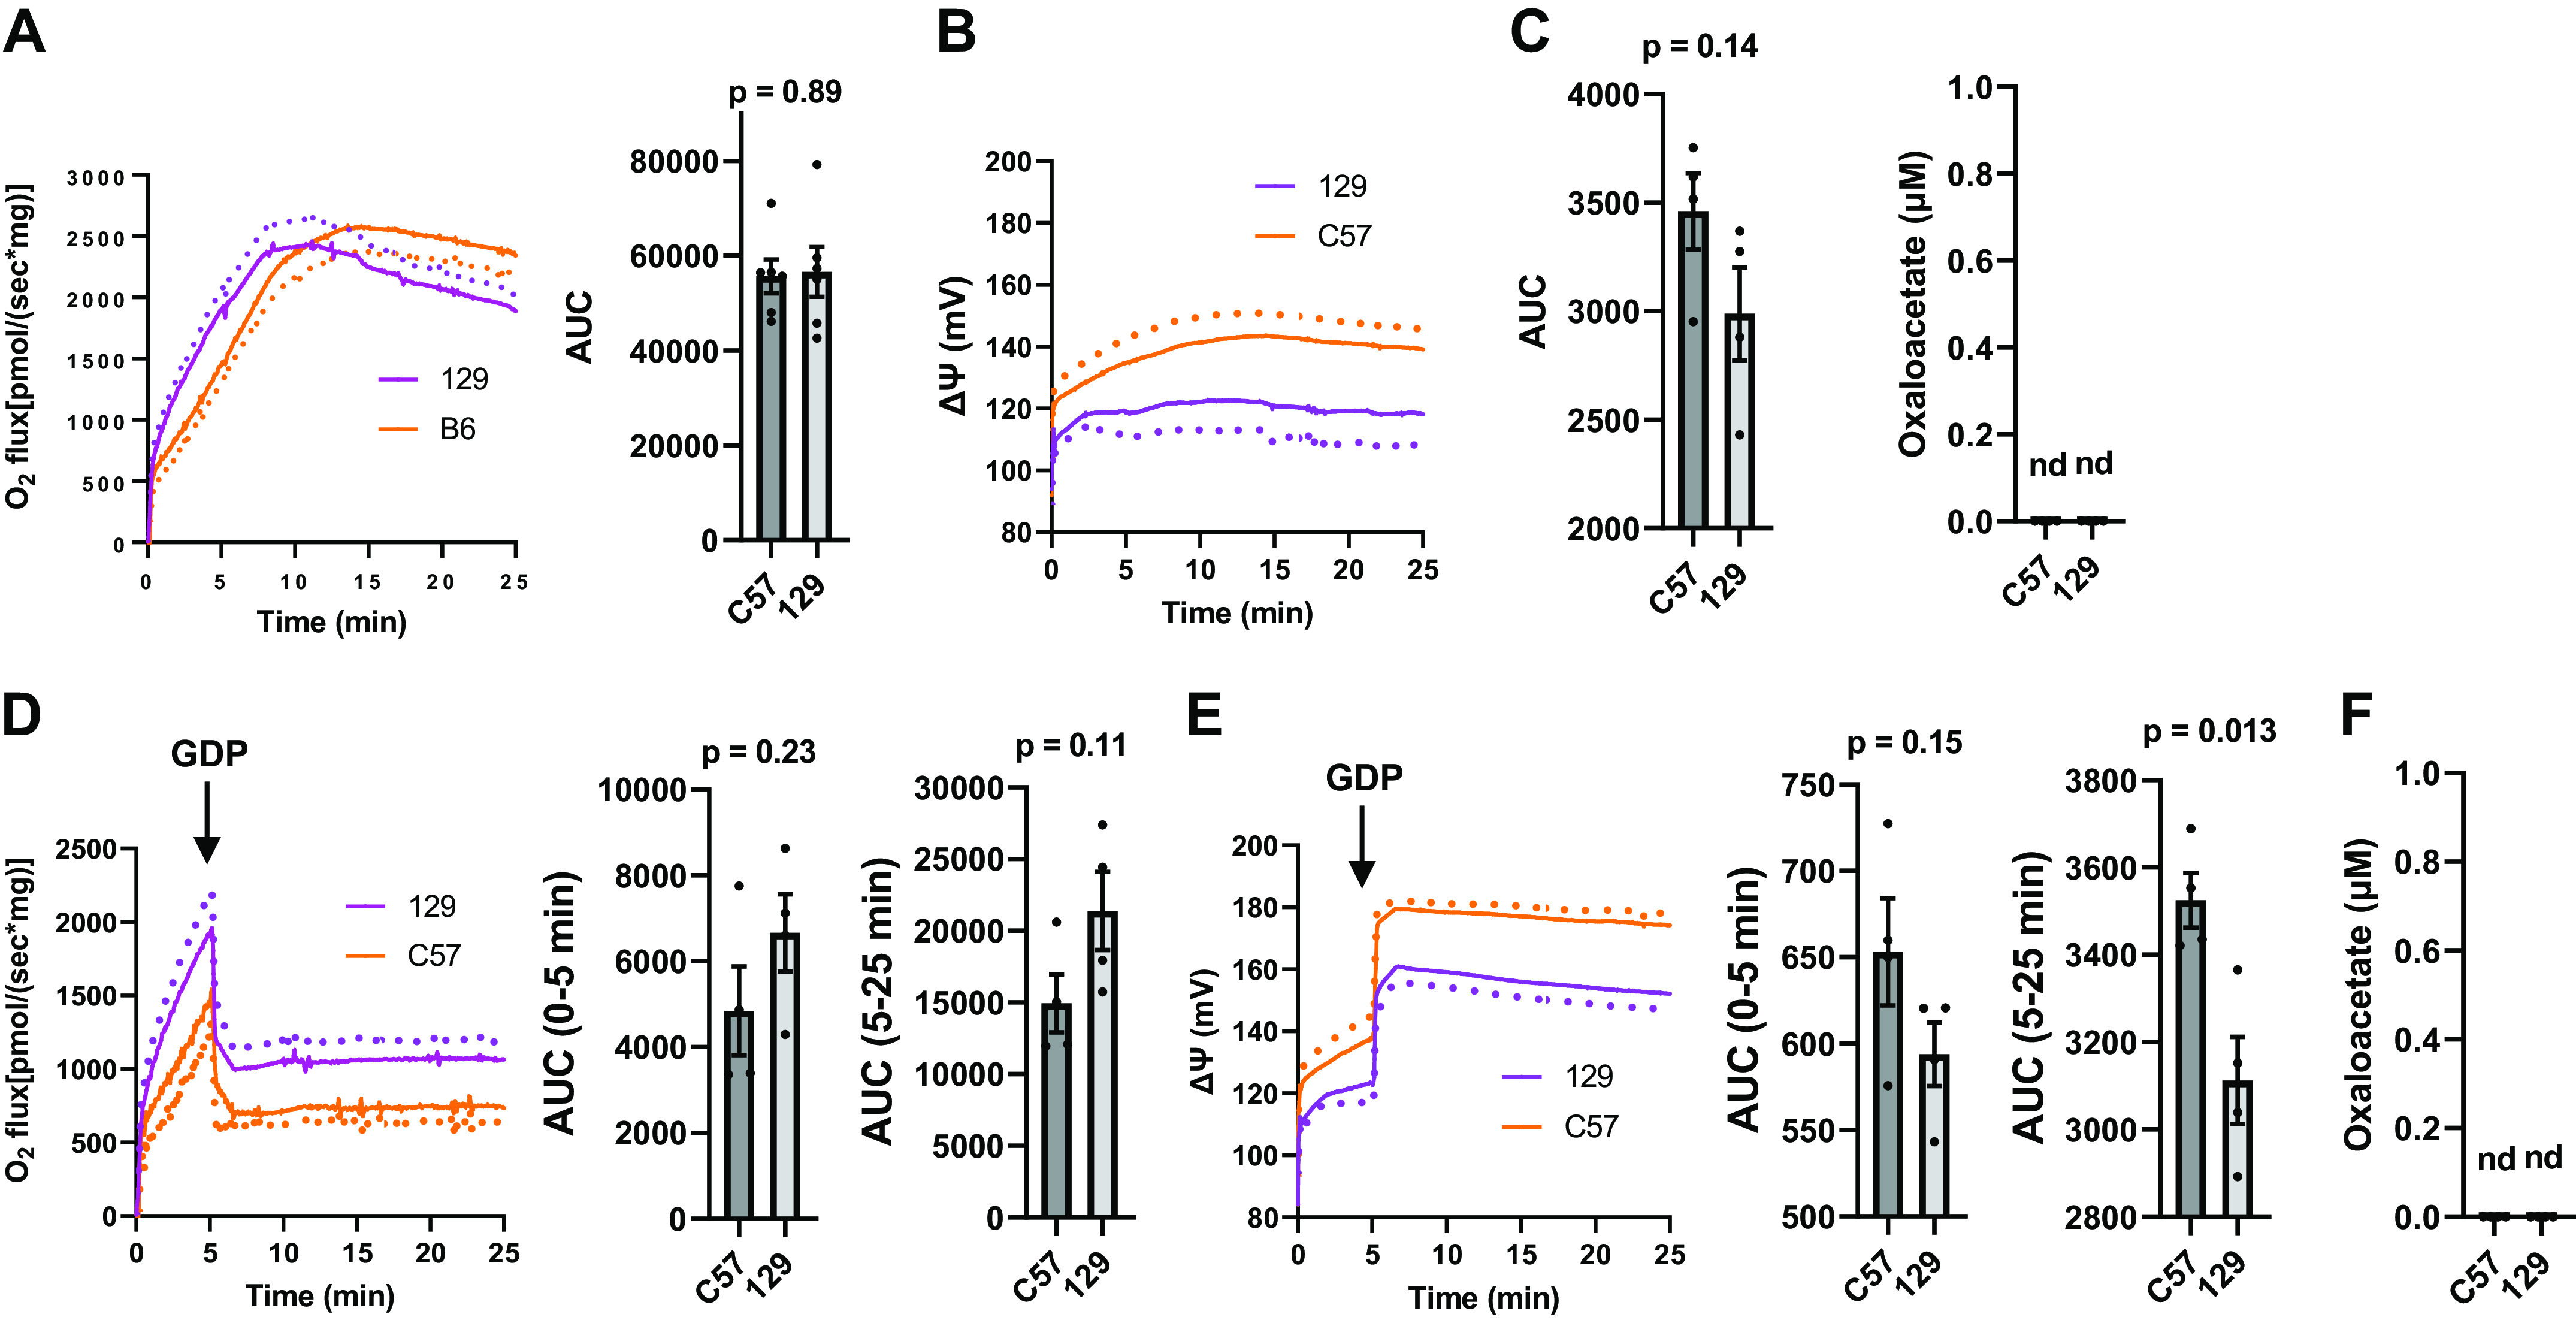
Functional parameters determined in IBAT mitochondria isolated from male C57 or 129 mice energized with 5 mM pyruvate + [U-13C]-1 mM malate. A: mean respiration (dotted lines indicate SE) and area under curves (AUC) (n = 6). B: mean inner membrane potential (ΔΨ, dotted lines indicate SE) and AUC (n = 4). C: oxaloacetate acid (OAA) (n = 4). D–F: analogous parameters to A–C, respectively, in mitochondria incubated as in A but with the addition of 1 mM GDP at the 5-min timepoint (n =4 for respiration, n = 4 for ΔΨ, n = 4 for OAA). Data represent means ± SE and individual values, P determined by unpaired, two-tailed t test. nd, not detected; IBAT, interscapular brown adipose tissue; KO, knockout; WT, wild type.
Characteristics of WT and UCP1KO Mice
As depicted in Fig. 5A, IBAT UCP1 expression was not detected in the KO mice. Figure 5B shows lower SDH activity in mitochondrial extracts of the KO compared to the WT mitochondria. Note that SDH activity in mitochondrial extracts, which could reflect the extent of SDH expression or regulation due to factors such as post-translational modification, is a measurement that is quite different from the determination of SDH activity in energized mitochondria. But this should be considered in comparing electron flux through SDH between physiologic conditions (see methods). There was no difference in body mass or in % fat, % lean, and % fluid mass (Fig. 5C). As indicated under “methods,” these body mass and distribution studies were done at 17–18 wk due to equipment problems. All other determinations described below and the above-mentioned UCP1 expression and SDH activity studies were done on mitochondria from WT and KO mice at 6–10 wk age.
Figure 5.

Characteristics of WT and UCP1KO (KO) mice. A: immunoblot demonstrating the absence of detectable UCP1 expression in extracts of IBAT mitochondria (30 µg/lane) isolated from KO (lanes 2, 4, 6, and 8) vs. WT (lanes 1, 3, 5, and 7) mice, age 6–10 wk. B: succinate dehydrogenase activity in extracts of WT and KO IBAT mitochondria (n = 6 per group, two male, four female) isolated from mice, age 6–10 wk. C: body mass, % whole body fat, % lean mass, and % fluid mass in WT and KO mice (n = 11 per group, age 17–18 wk, seven male and four female WT, eight male and three female KO). Data represent means ± SE and individual values, P values by unpaired, two-tailed t test except body mass in C where P value was determined by the Mann–Whitney method for nonparametric data. IBAT, interscapular brown adipose tissue; WT, wild type.
Complex II-Energized IBAT Mitochondrial Function and OAA in WT and UCP1KO Mice
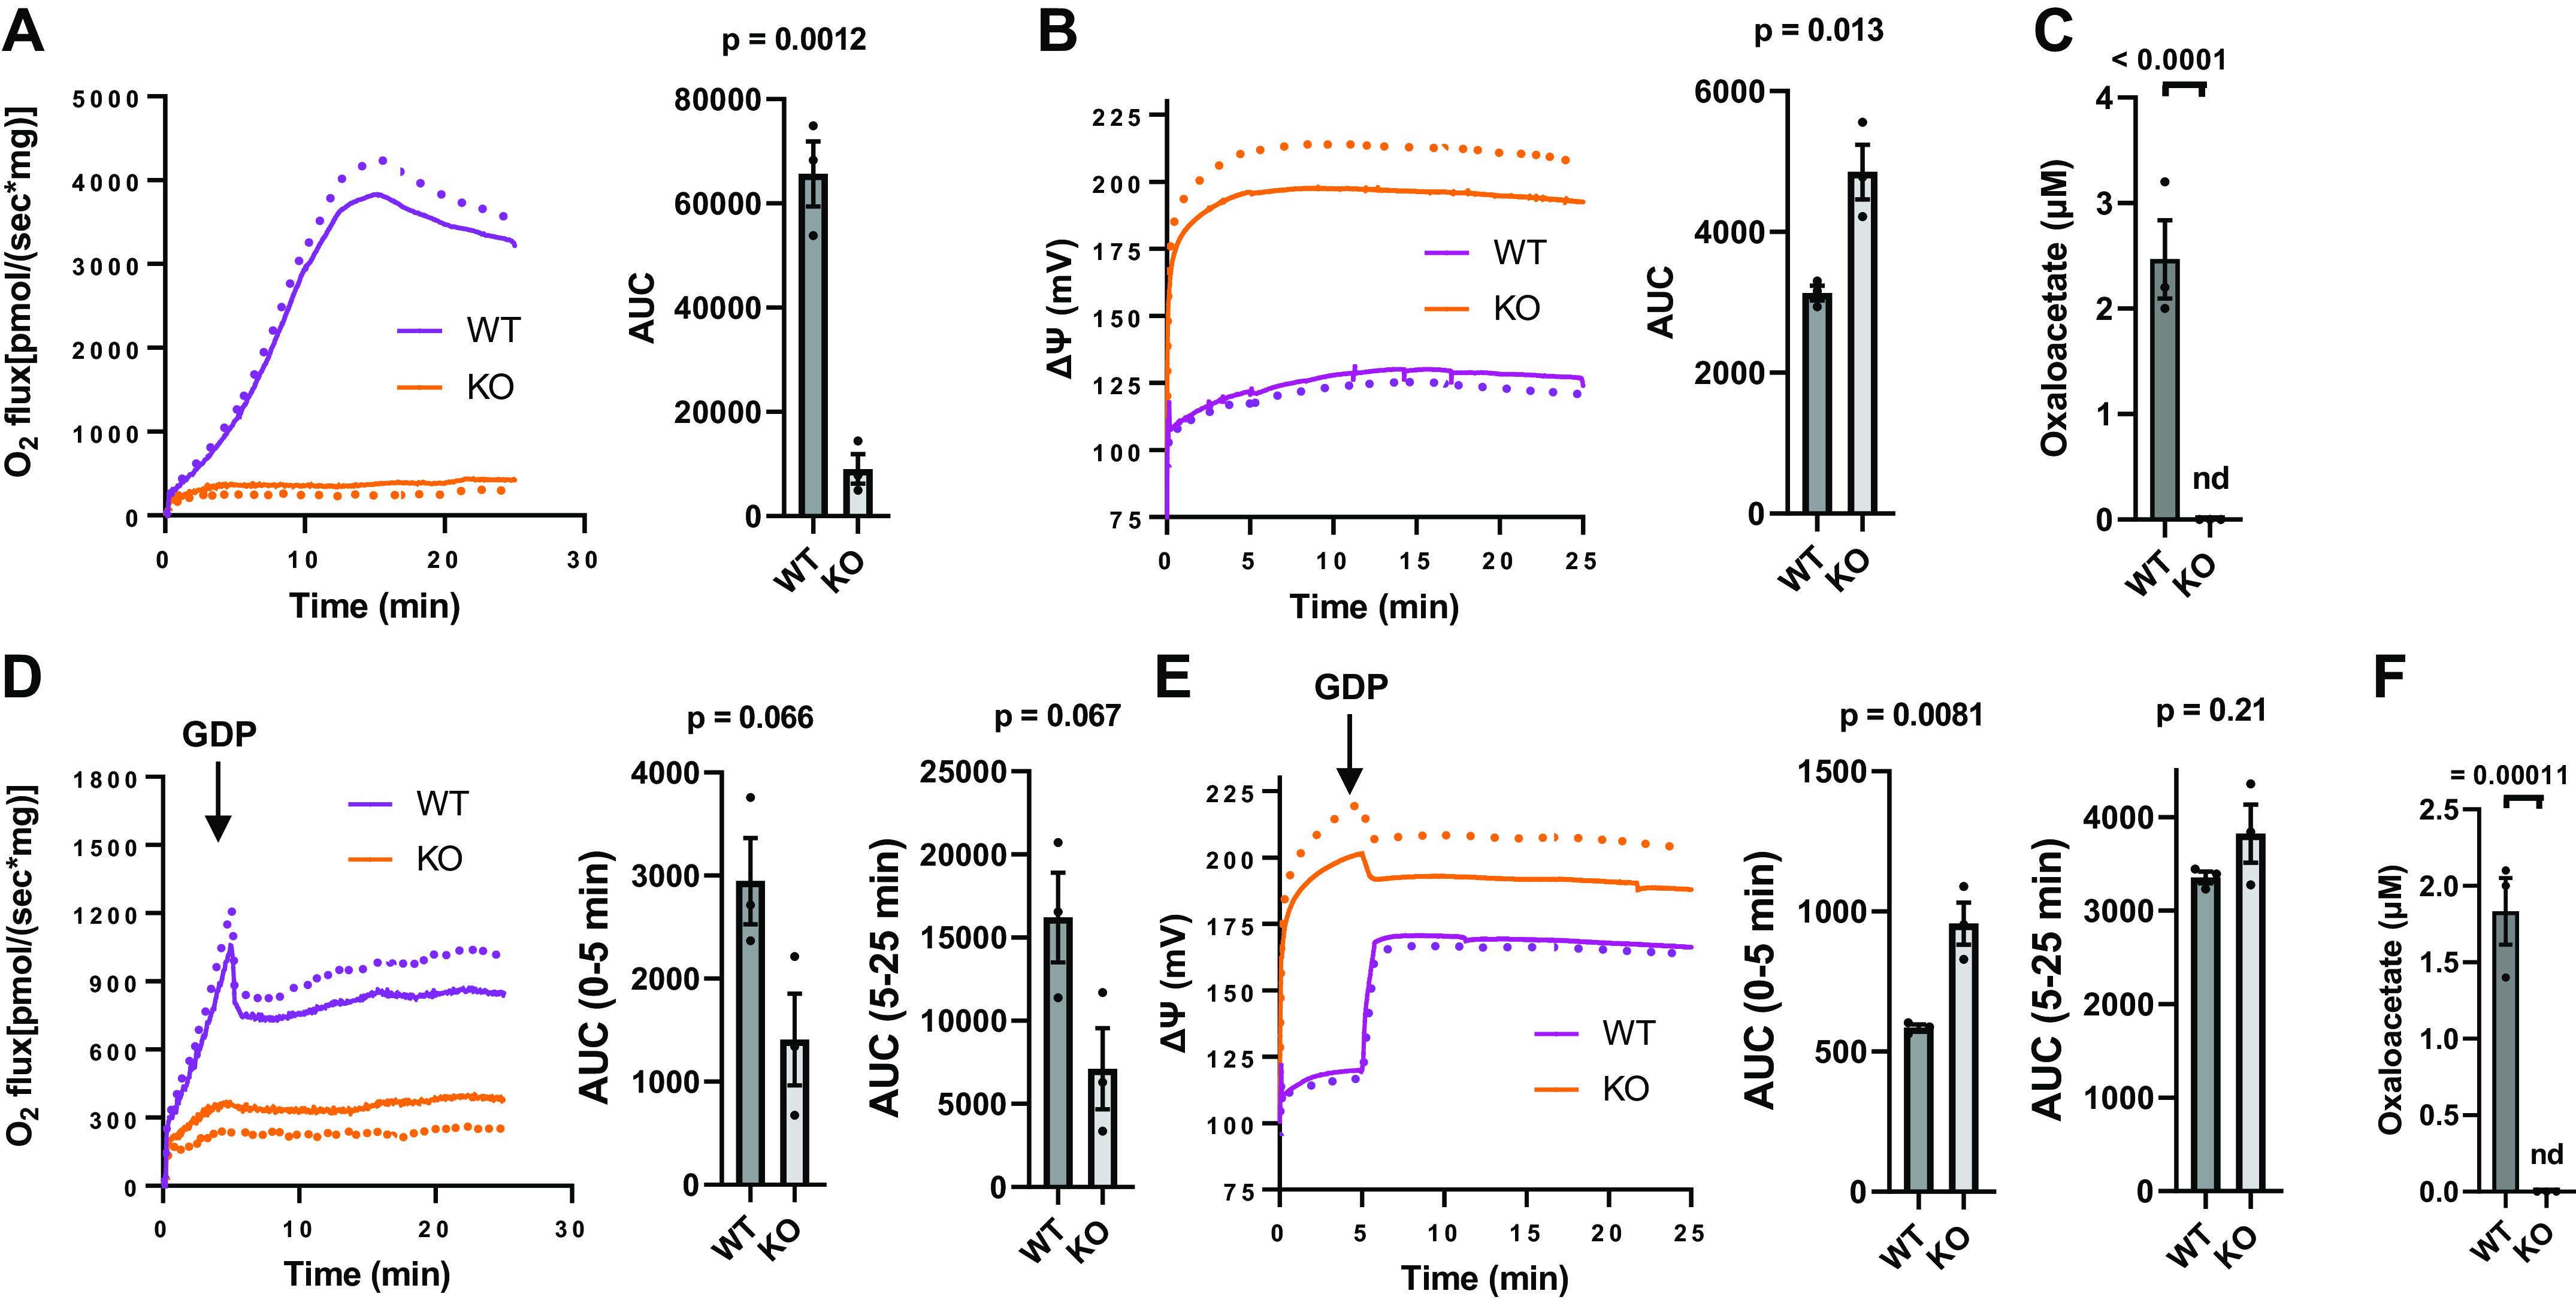
O2 flux was similar (Fig. 6A) or clearly reduced (Fig. 6B) when expressed relative to SDH activity in IBAT mitochondrial extracts of WT versus UCP1KO mice. This is despite the markedly lower ΔΨ in the WT mice compared with UCP1KO (Fig. 6C). The lower O2 flux per unit of SDH activity in the WT mice was associated with the presence of OAA (Fig. 6D) in amounts comparable to the 129 and C57 mitochondria of Fig. 3C, while OAA was not detectable in the KO mitochondria. In accord with the higher ΔΨ in the KO mice, H2O2 production was much higher and associated with much greater NADH and a far higher NADH/NAD+ ratio (factors that would limit OAA production according to the model of Fig. 1).
Figure 6.
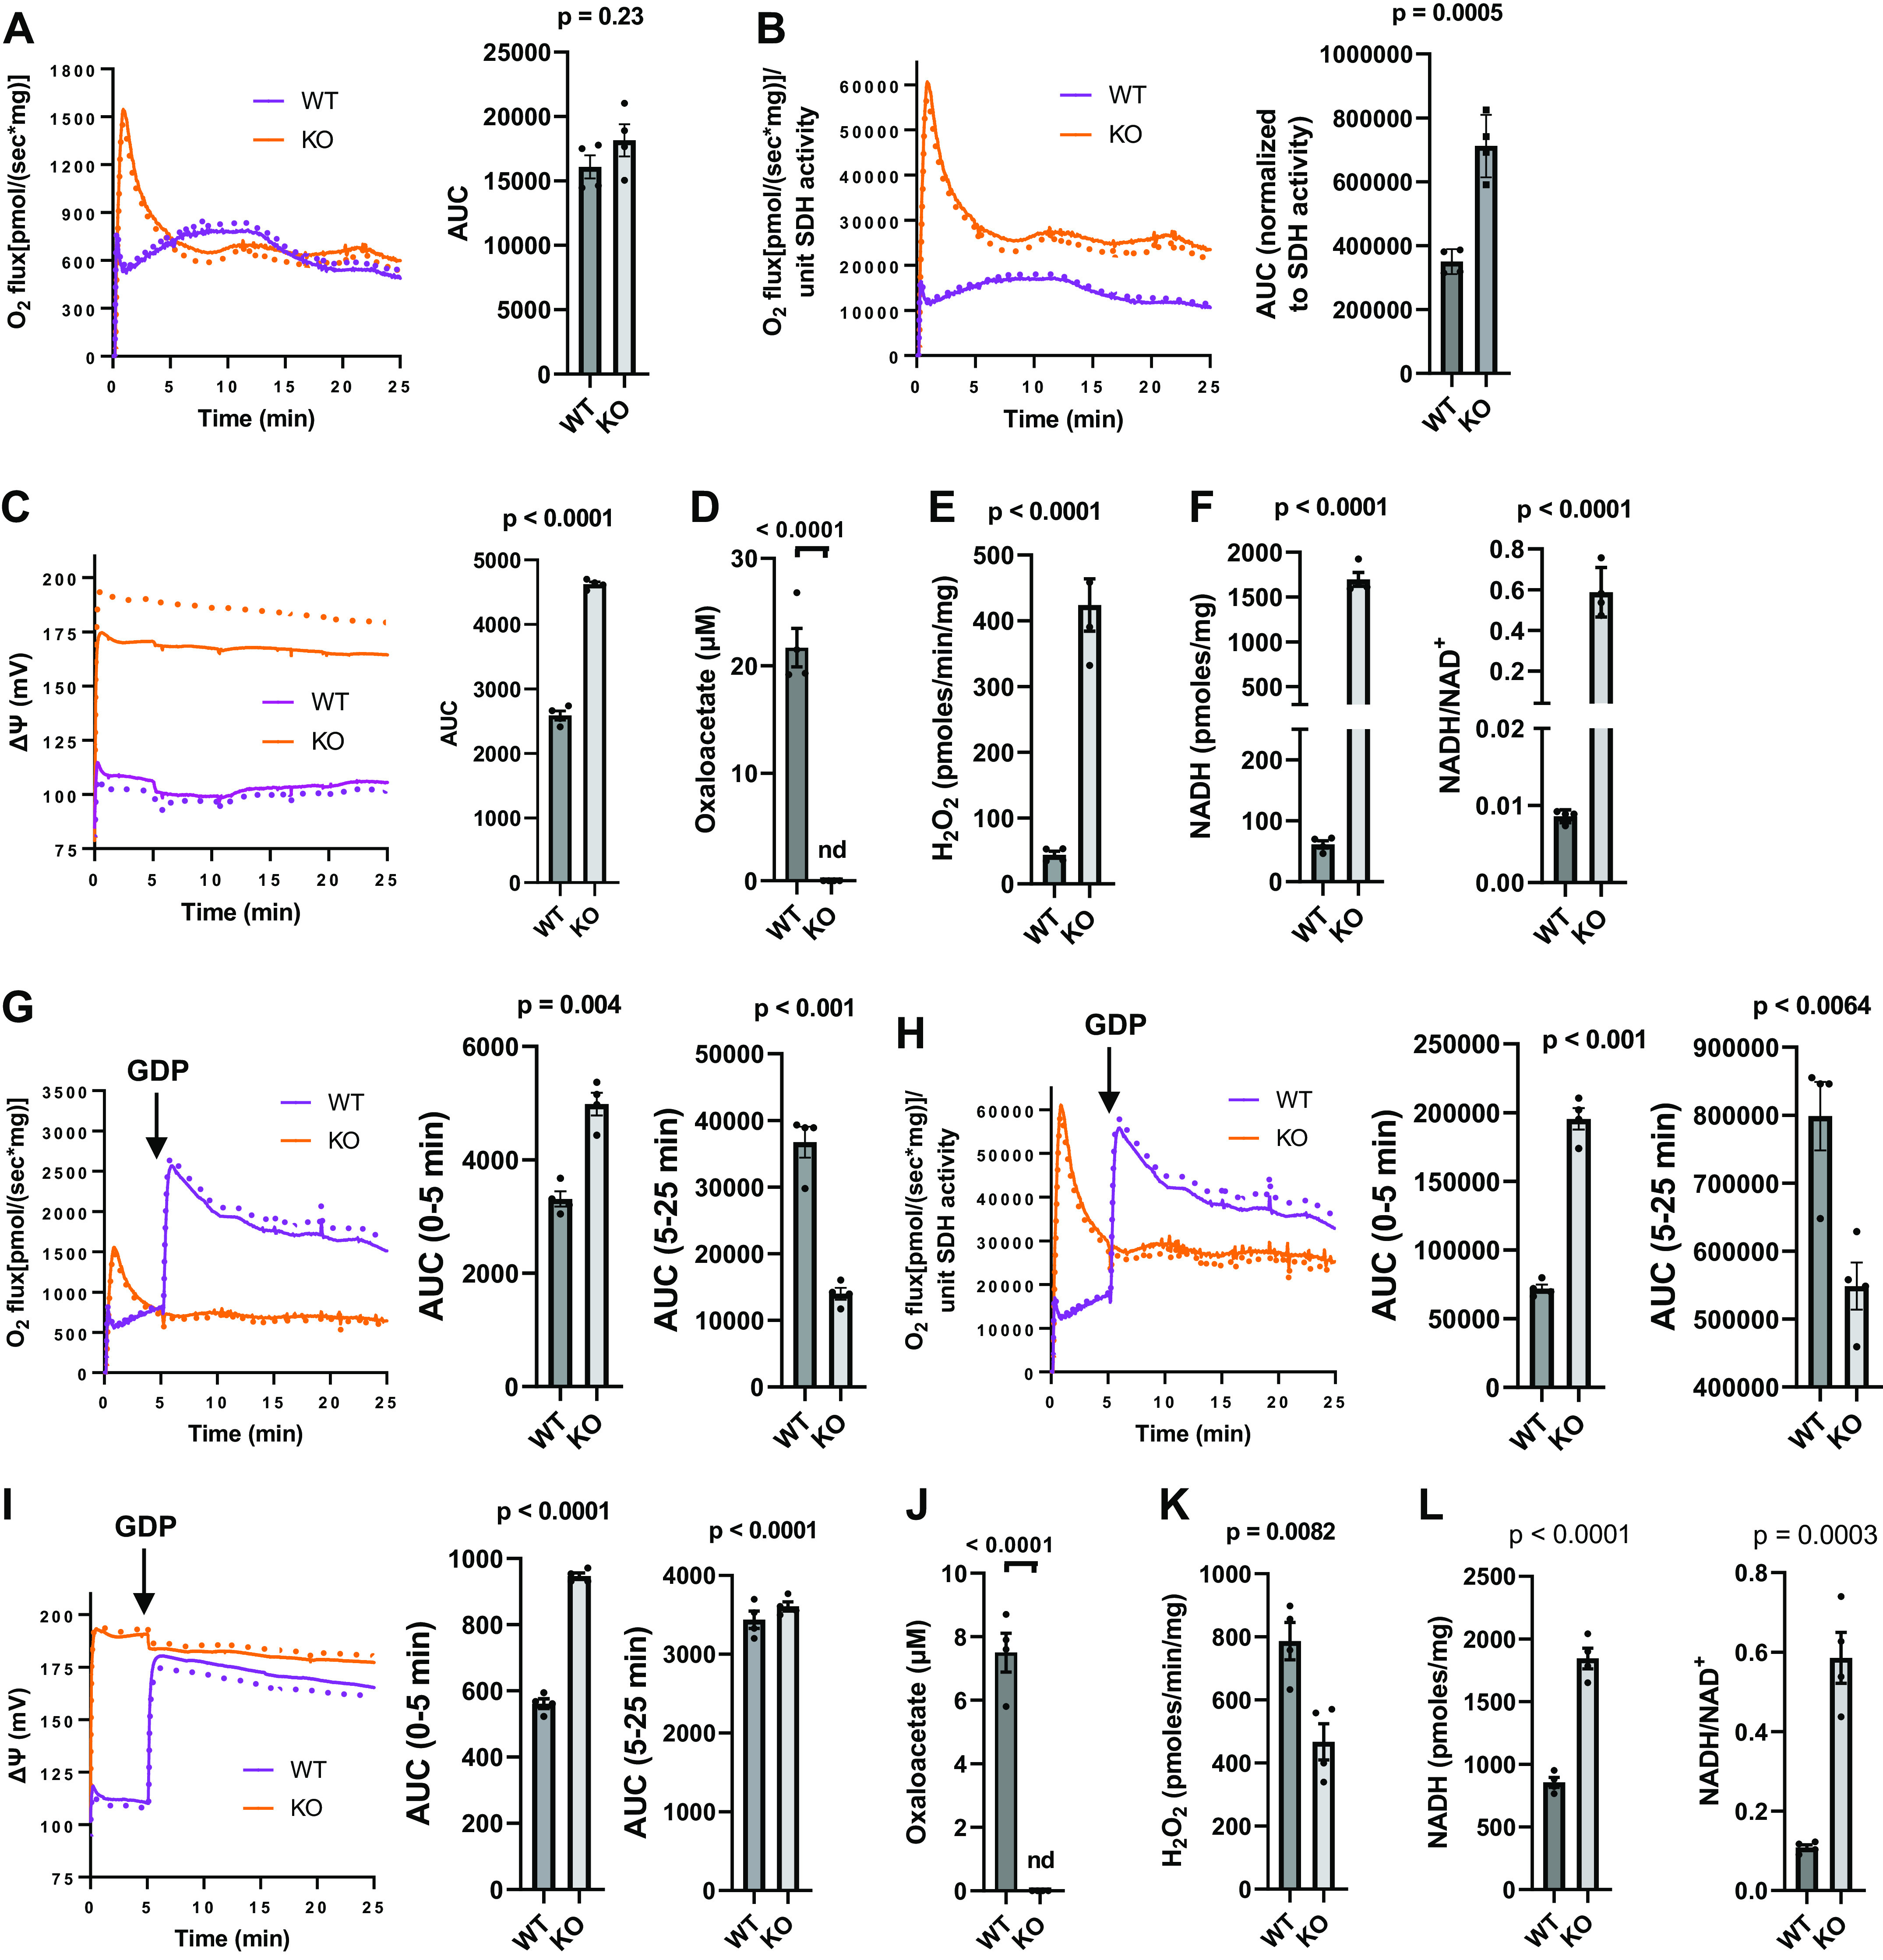
Functional parameters determined in IBAT mitochondria isolated from UCP1KO (KO) or wild-type (WT) mice energized with [U-13C]-10 mM succinate. A: mean respiration (dotted lines indicate SE) and area under curves (AUC). B: respiration normalized to SDH activity and AUC. C: mean inner membrane potential (ΔΨ, dotted lines indicate SE) and AUC. D: Oxaloacetate. E: H2O2 production. F: NADH and the NADH/NAD+ ratio (n = 4, one male, three female for all values in A–D and F; n = 4, two male, two female for E), G–L: Analogous parameters to A–F, respectively, in mitochondria incubated with the addition of 1 mM GDP at the 5-min timepoint (n = 4, one male, three female for all values in G–J and L; n = 4, two male, two female for K). Data represent means ± SE and individual values, P determined by unpaired, two-tailed t test. nd = not detected. IBAT, interscapular brown adipose tissue; KO, knockout.
When GDP was added at 5 min, OAA, H2O2 production, the NADH redox state, ΔΨ, and O2 flux were not altered in the UCP1KO mice as expected (compare Fig. 6, A–F to Fig. 6, G–L). GDP increased ΔΨ in the WT mitochondria to levels close to the KO (Fig. 6I). This increase in ΔΨ occurred along with an increase in O2 flux (Fig. 6, G and H), rather than the classically expected decrease in respiration with higher potential. OAA was detected only in the WT mice (Fig. 6J) but the amount of OAA was much less with the addition of GDP (compare Fig. 6, D and J) allowing the rise in respiration (Fig. 6, G and H). At the higher ΔΨ after adding GDP, H2O2 production increased in the WT mice (compare Fig. 6, E and K) along with increased NADH and a greater NADH/NAD+ ratio (compare Fig. 6, F and L). Note that O2 flux after GDP in the KO mitochondria was lower than in WT even though ΔΨ was about the same.
Complex I-Energized IBAT Mitochondrial Function and OAA in WT and UCP1KO Mice
In these pyruvate and malate (complex I)-energized mitochondria, ΔΨ was much lower and respiration was far greater in the WT mice (Fig. 7, A and B) consistent with the classical effect of ΔΨ to increase electron flow and O2 flux. As expected for these complex I energized mitochondria, OAA was very low (only ∼2 µM or barely detectable) in the WT mitochondria and undetectable in KO (Fig. 7C). When GDP was added at the 5-min timepoint, ΔΨ increased in the WT but not the KO mitochondria (Fig. 7E) associated with a decrease in O2 flux in the WT mitochondria (Fig. 7D), as classically expected, and OAA was again very low or undetectable in the WT and KO mice, respectively. We believe the slight downward movement in the curve for ΔΨ in the KO mitochondria after adding GDP (Fig. 7E) was an artifact due to the instability of the chamber electrode following the GDP volume injection.
Figure 7.
Functional parameters determined in IBAT mitochondria isolated from UCP1KO (KO) or wild-type (WT) mice energized with 5 mM pyruvate + [U-13C]-1 mM malate. A: mean respiration (dotted lines indicate SE) and area under curves (AUC). B: mean inner membrane potential (ΔΨ, dotted lines indicate SE) and AUC. C: Oxaloacetate acid. D–F: analogous parameters to A–C for mitochondria incubated with the addition of 1 mM GDP at the 5-min timepoint and AUC values. n = 3 (one male, two female) for all values. Data represent means ± SE (dotted lines) and individual values, P determined by unpaired, two-tailed t test, normality tests were not conclusive for an n of 3. nd, not detected; IBAT, interscapular brown adipose tissue; KO, knockout.
Additional Metabolite Measurements
Relevant metabolites, in addition to OAA, were assayed by NMR under the various conditions studied (Supplemental Figs. S2–S5). It is important to remember that assays analyzed by 2-D NMR used uniformly labeled 13C-succinate for incubations energized by 10 mM succinate or uniformly labeled 13C-malate for incubations energized by 1 mM malate and 5 mM pyruvate. Therefore, all measured metabolites reflect either consumption of the added substrates or downstream production from the added labeled substrates and do not reflect any metabolites that may have been present in the mitochondrial preparations before the incubations.
Supplemental Figure S2A shows slightly more succinate use (nonsignificant) by the 129 mitochondria versus C57 along with greater malate and fumarate in the complex II-energized incubations assayed on the same samples of Fig. 3, A–C. This is compatible with the early (0 to 10 min) apparently greater respiration by the 129 mitochondria (Fig. 3A). Supplemental Figure S2B shows that there was more succinate use (less in succinate at the end of incubation) by the C57 than 129 mitochondria and more malate and fumarate production (Supplemental Fig. S2B) compatible with substantially greater respiration by the C57 mitochondria after GDP (Fig. 3G).
For complex I-energized mitochondria in the absence of GDP, the metabolite data (Supplemental Fig. S3A) shows no significant differences in malate and pyruvate consumption in 129 versus C57 mitochondria, consistent with little difference in respiration (Fig. 4A). For the complex I-energized mitochondria in the presence of GDP (Supplemental Fig. S3B), there was a nonsignificant trend towards more pyruvate and malate use and a significant increase in citrate by the 129 mitochondria versus C57, consistent with greater (but nonsignificant) O2 flux in 129 mitochondria (Fig. 4D). We also noted a higher citrate concentration in the absence of GDP (Supplemental Fig. S3A) which is difficult to explain.
Supplemental Figure S4A shows that in the absence of GDP, succinate-energized KO mitochondria versus WT use slightly more succinate (nonsignificant) and produce more malate and fumarate consistent with greater early (first 4–5 min) respiration (Fig. 6A). With GDP (Supplemental Fig. S4B), we observed significantly more succinate use and more malate, fumarate, and citrate production by the WT versus KO mitochondria, consistent with greater O2 flux (Fig. 6G).
Supplemental Figure S5 shows that pyruvate + malate-energized WT mitochondria, as opposed to KO, with or without GDP, consume more pyruvate and malate and produce more citrate. These differences are consistent with greater respiration by the WT mitochondria (Fig. 7, A and D).
Finally, we note that mitochondria energized by pyruvate and malate produce far more citrate than mitochondria energized by succinate (compare Supplemental Figs. S3 and S5 to S2 and S4). This is as expected, consistent with the clearance of malate-driven OAA to citrate by acetyl-CoA generated by pyruvate.
DISCUSSION
We provide novel data regarding how mitochondrial O2 flux energized by complex II or complex I substrates vary according to mouse strains expressing differential IBAT UCP1. When incubated in the absence of GDP (Fig. 3, A–F), ΔΨ is low in both strains (as is typical for IBAT mitochondria compared to other tissues) although somewhat lower for the 129 organelles. At these low levels of ΔΨ, complex II respiration generates only barely detectable levels of ROS. Thus, RET (marked by ROS) and NADH are low for both C57 and 129 mitochondria with no detectable difference by strain. Under these conditions, OAA can accumulate and limit respiration, which differs little between strains. These findings are in accord with our model in Fig. 1. We did see a lower potential in the 129 mice (Fig. 3B) which is not explained by our model and may be an intrinsic difference in mouse strains. We speculate that this lower potential for the 129 mitochondria explains the apparent early (first 10 min) greater O2 flux in the 129 mitochondria with OAA accumulation eventually bringing O2 flux down to the level of the C57 mitochondria.
When mitochondria are energized at complex II in the presence of GDP (Fig. 3, G–L), the findings are different. When GDP is added at 5 min, ΔΨ increases to a higher level for the C57 mitochondria and remains substantially higher than that of the 129. As predicted by our proposed mechanism (Fig. 1), ROS production (and, thus, RET) is far greater in the C57 mitochondria associated with far greater NADH and, consequently, less OAA and a much lower OAA/malate ratio (reflecting the malate dehydrogenase reaction). Hence, the lower [OAA] explains the greater O2 flux in the C57 versus 129 mitochondria, despite greater ΔΨ in the C57. It could be asked why, for the 129 mitochondria, OAA in Fig. 3I is about the same (rather than lower) as OAA without GDP in Fig. 3C; which might appear inconsistent with the kinetics shown in Fig. 1. This could simply be due to variation in the data over different Oxygraph runs. Moreover, there were considerably smaller increases in O2 flux and ΔΨ after GDP in the 129 mitochondria compared to the large increase for C57 (Fig. 3G) consistent with a small (not clearly evident) reduction in OAA.
A question might also be raised as to whether H2O2 production could have contributed to our measures of O2 flux. Any such effect would be very minimal and not affect our comparative respiration data. This is because the amounts of H2O2 produced (Figs. 3, D and J, measured in pmoles/min) are very low compared to O2 consumed (Fig. 3, A and G, measured in pmoles/s). So, even if all the H2O2 were converted to O2, this would be only a negligible fraction of all the O2. This consideration also applies to our studies of WT and KO mice further discussed below. This pattern of H2O2 produced relative to much higher O2 flux in mitochondria incubated in respiratory chambers has been noted in other studies as well (22, 23).
For complex I-energized respiration in the absence of GDP (Fig. 4, A and B), O2 flux was approximately equal between the C57 and 129 mitochondria despite lower (but not significant) ΔΨ in the 129 mitochondria. OAA did not accumulate in either case. Why lower ΔΨ does not drive complex I-energized respiration higher in the 129 mice than C57 (Fig. 4, A and B) is not clear but does not appear related to OAA and may reflect a chance variation in the data or an undetermined strain difference beyond UCP1. The data for O2 flux energized at complex I with GDP added at 5 min (Fig. 4, D and E) show that, again, OAA does not accumulate to detectable levels. In this case, respiration trends are higher but with significantly lower ΔΨ in the 129 mitochondria when compared with C57, consistent with the classical effect of low potential to increase respiration. The absence of OAA in these complex I-energized mitochondria (Fig. 4, C and F) is as expected given the known effect of pyruvate to generate acetyl-CoA with rapid clearance of OAA to citrate (3).
We further examined complex II respiration in mitochondria of UCP1KO and WT mice. A caveat is that we must acknowledge that UCP1KO mice have been shown to manifest differences in protein expression that go beyond UCP1 itself (24). Although this limitation should be kept in mind, this does not change the strong relationship between UCP1 and ΔΨ within our isolated mitochondria (Fig. 6, C and I). UCP1 expression was absent in the KO mice (Fig. 5). In the absence of added GDP (Fig. 6, A–F), ΔΨ is markedly higher in the KO mitochondria (Fig. 6C) associated with far greater ROS, NADH, and the NADH/NAD+ ratio with no detectable OAA (Fig. 6, D–F). These findings are in accord with the mechanism in Fig. 1. Moreover, OAA did accumulate in the WT mitochondria (Fig. 6D) in line with the model of Fig. 1, and in amounts, by comparison to Fig. 3C, sufficient to suppress O2 flux. Note that, despite much lower ΔΨ (Fig. 6C), complex II-energized O2 flux in the WT mice is no greater than that of the KO (Fig. 6A) again compatible with the mechanism of Fig. 1. Moreover, O2 flux in the WT mice is much less than KO if normalized to SDH activity (Fig. 6B). Normalization to SDH activity does not tell us whether differences in activity were due to variations in the amount of SDH or its structure (i.e., any post-translational modification), but both should manifest in our assay of SDH activity in mitochondrial protein extracts.
GDP had no effect on the UCP1KO mitochondria as seen by comparing parameters in Fig. 6, A–F with Fig. 6, G–L (and noting differences in the y-axis scales). However, GDP markedly increased ΔΨ in the WT mitochondria (Fig. 6I) and reduced OAA (compare Fig. 6, J and D). This was associated with increased respiration despite the increase in ΔΨ (compare Figs. 6, G and H with ΔΨ in Fig. 6I). These findings are as predicted by our model in Fig. 1. Furthermore, this was not due to theoretical back pressure on SDH by NADH (see below) since NADH in the WT mitochondria was higher in the presence of GDP than in the absence of GDP (compare Figs. 6, F and L noting the difference in y-axis scaling).
Although the above findings are in line with our model in Fig. 1, a confounding issue is the extremely high NADH and NADH/NAD+ ratio (Fig. 6, F and L) in the KO mitochondria. This ratio is substantially greater than reports in mitochondria not genetically altered (25, 26). It is possible, although we can only speculate, that this level of redox ratio and its leftward effect on the malate dehydrogenase reaction may be enough to decrease SDH activity due to back pressure on the SDH-catalyzed reaction, despite the absence of OAA in the KO mitochondria. This would explain why the O2 flux in KO mitochondria (Fig. 6A) is not higher or only modestly higher (Fig. 6B) than that for the WT mitochondria, as would have been expected due to the lack of OAA. Moreover, the decrease in respiration in the KO mitochondria after an initial sharp rise (Fig. 6A), may be due to ROS production and consequent generation of NADH initially occurring over the first minute. Having said the above, we note that the issue of NADH effects on back pressure is very complicated, especially because malate can easily exit mitochondria greatly mitigating any back pressure toward the SDH reaction.
When KO and WT mitochondria were energized with complex I substrates (Fig. 7), OAA did not accumulate to detectable amounts in the KO mice and to only barely detectable levels in the WT mice. In this case, complex I-energized mitochondrial respiration differed between KO and WT mitochondria, as expected based on the differences in ΔΨ and in accord with the classical effect of low ΔΨ to increase O2 flux. Likewise, GDP increased ΔΨ and decreased respiration in the WT mice (Fig. 7, D and E) while GDP had no effect for the UCP1KO mice.
As indicated in results, metabolites other than OAA were also determined by 2-D-NMR (Supplemental Figs. S2–S5). Overall, these results show that the consumption of substrates, whether 10 mM succinate or 5 mM pyruvate + 1 mM malate, and downstream metabolites are in line with and serve to validate our respiratory data.
Our current data as well as our past results for muscle mitochondria (5) imply that control of complex II versus complex I-energized respiration differ with regard to the effect of membrane potential. Complex II respiration, dependent on potential, generates more or less OAA subjecting the complex to inhibition, whereas complex I respiration clears OAA independent of potential avoiding any such limitation of O2 flux.
We did not specifically address thermogenesis in this work, so we can only speculate as to the physiological role of ΔΨ-regulated OAA and SDH in regulating heat production in IBAT. In the intact brown fat cell, thermogenesis depends on uncoupled respiration driven by multiple substrates acting at different complexes to drive electron transport leading to the heat production. In this setting, OAA inhibition of complex II might act as a control factor, i.e., as a respiratory brake that might be needed to prevent excess thermogenesis. When this would be needed is not clear, but such braking seems logical and perhaps important during recovery from cold exposure. The role of GDP in thermogenesis is also of interest. By inhibiting UCP1, the nucleotide decreases respiration energized by complex I substrates (Fig. 4D) but increases respiration on the complex II substrate, succinate (Fig. 3G), suggesting that the net in vivo effect on thermogenesis could represent a balance dependent on substrate (and, hence, possibly on in vivo nutrient intake). It is also of interest that GDP in succinate-energized IBAT mitochondria increased ΔΨ and ATP (compare Fig. 3, B and E to Fig. 3, H and K). This would draw energy to ATP synthase and, therefore, away from thermogenesis.
In a recent study (27) using UCP1KO and WT mice, Mills et.al. reported that succinate accumulation increased UCP1-dependent thermogenesis and leak-dependent respiration. However, it is hard to know the meaning of that work in relation to what we report here. Although we perturbed UCP1 using GDP, we did not alter succinate availability. Moreover, that study examined leak-dependent respiration in intact brown adipose cells in a Seahorse respirometer wherein pyruvate was included in the respiration medium and other metabolites would be present within the intact cells. Another report (28) examined the respiration of permeabilized BAT cells. The investigators used oligomycin to block ATP production in succinate-energized mitochondria and reported an apparent increase in the proton leak. What this means is not clear since the proton leak is already very high in IBAT with very little ATP production to block, as we have previously shown (1). In the current report, we also saw very little ATP production from ADP unless we added GDP to raise potential (Fig. 3, E and K).
Limitations to our study are that, as mentioned above, there are intrinsic differences in mitochondria by strain or genetic manipulation that go beyond UCP1 expression. Differences in calcium dynamics, fatty acid content, and other factors have been reported for UCP1KO versus WT mice (24). Furthermore, although GDP is considered a valuable means of assessing IBAT mitochondrial function (29), it is difficult to relate this to the extent of mitochondrial GDP concentrations in vivo.
In summary, we report novel differences by mouse strain or genetic manipulation in mitochondrial function energized at complex II, dependent on UCP1 expression and, consequently, on inner membrane potential. These differences are largely explainable based on OAA inhibition of SDH and support our proposed mechanism for OAA- and ΔΨ-dependent respiration at complex II. Our findings also suggest that this mechanism is physiologically relevant, as evident in the differences between mouse strains. In contrast to complex II-energized respiration, differences in O2 flux energized at complex I, wherein OAA does not accumulate, conform to the classic effect of low ΔΨ to increase O2 flux.
DATA AVAILABILITY
Data will be made available upon reasonable request.
SUPPLEMENTAL DATA
Supplemental Figs. S1–S5: https://doi.org/10.6084/m9.figshare.22491748.
GRANTS
These studies were supported by the NIH award, 1 R01 DK123043-01A1 (to W.I.S.). The content is solely the responsibility of the authors and does not necessarily represent the official views of the National Institutes of Health. Also supported by Merit Review Award 2 I01 BX000285-06 (to W.I.S.) from the U.S. Department of Veterans Affairs, Biomedical Laboratory Research and Development Service, resources and the use of facilities at the Department of Veterans Affairs Health Care System, Iowa City, IA, and by the Iowa Fraternal Order of the Eagles (to W.I.S.).
DISCLOSURES
No conflicts of interest, financial or otherwise, are declared by the authors.
AUTHOR CONTRIBUTIONS
B.D.F., L.Y., and W.I.S. conceived and designed research; R.S., B.D.F., and L.Y. performed experiments; B.D.F., L.Y., and W.I.S. analyzed data; B.D.F., L.Y., and W.I.S. interpreted results of experiments; W.I.S. prepared figures; W.I.S. drafted manuscript; B.D.F., L.Y., and W.I.S. edited and revised manuscript; R.S., B.D.F., L.Y., and W.I.S. approved final version of manuscript.
ACKNOWLEDGMENTS
The authors thank the University of Iowa Carver College of Medicine Nuclear Magnetic Resonance Core Facility.
REFERENCES
- 1. Fink BD, Rauckhorst AJ, Taylor EB, Yu L, Sivitz WI. Membrane potential-dependent regulation of mitochondrial complex II by oxaloacetate in interscapular brown adipose tissue. FASEB Bioadv 4: 197–210, 2022. doi: 10.1096/fba.2021-00137. [DOI] [PMC free article] [PubMed] [Google Scholar]
- 2. Fink BD, Yu L, Sivitz WI. Modulation of complex II-energized respiration in muscle, heart, and brown adipose mitochondria by oxaloacetate and complex I electron flow. Faseb J 33: 11696–11705, 2019. doi: 10.1096/fj.201900690R. [DOI] [PMC free article] [PubMed] [Google Scholar]
- 3. Fink BD, Bai F, Yu L, Sheldon RD, Sharma A, Taylor EB, Sivitz WI. Oxaloacetic acid mediates ADP-dependent inhibition of mitochondrial complex II-driven respiration. J Biol Chem 293: 19932–19941, 2018. doi: 10.1074/jbc.RA118.005144. [DOI] [PMC free article] [PubMed] [Google Scholar]
- 4. Yu L, Sivitz WI. Oxaloacetate mediates mitochondrial metabolism and function. CMSB 7: 11–23, 2020. doi: 10.2174/2213235X07666191008103247. [DOI] [Google Scholar]
- 5. Bai F, Fink BD, Yu L, Sivitz WI. Voltage-dependent regulation of complex ii energized mitochondrial oxygen flux. PloS one 11: e0154982, 2016. doi: 10.1371/journal.pone.0154982. [DOI] [PMC free article] [PubMed] [Google Scholar]
- 6. Lambert AJ, Brand MD. Superoxide production by NADH:ubiquinone oxidoreductase (complex I) depends on the pH gradient across the mitochondrial inner membrane. Biochem J 382: 511–517, 2004. doi: 10.1042/BJ20040485. [DOI] [PMC free article] [PubMed] [Google Scholar]
- 7. Lambert AJ, Brand MD. Inhibitors of the quinone-binding site allow rapid superoxide production from mitochondrial NADH:ubiquinone oxidoreductase (complex I). J Biol Chem 279: 39414–39420, 2004. doi: 10.1074/jbc.M406576200. [DOI] [PubMed] [Google Scholar]
- 8. Scialo F, Fernandez-Ayala DJ, Sanz A. Role of mitochondrial reverse electron transport in ROS signaling: potential roles in health and disease. Front Physiol 8: 428, 2017. doi: 10.3389/fphys.2017.00428. [DOI] [PMC free article] [PubMed] [Google Scholar]
- 9. Brand MD, Buckingham JA, Esteves TC, Green K, Lambert AJ, Miwa S, Murphy MP, Pakay JL, Talbot DA, Echtay KS. Mitochondrial superoxide and aging: uncoupling-protein activity and superoxide production. Biochemical Society Symposia 71: 203–213, 2004. doi: 10.1042/bss0710203. [DOI] [PubMed] [Google Scholar]
- 10. Skulachev VP. Uncoupling: new approaches to an old problem of bioenergetics. Biochim Biophys Acta 1363: 100–124, 1998. doi: 10.1016/s0005-2728(97)00091-1. [DOI] [PubMed] [Google Scholar]
- 11. Fink BD, Herlein JA, Almind K, Cinti S, Kahn CR, Sivitz WI. The mitochondrial proton leak in obesity-resistant and obesity-prone mice. Am J Physiol Regul Integr Comp Physiol 293: R1773–1780, 2007. doi: 10.1152/ajpregu.00478.2007. [DOI] [PubMed] [Google Scholar]
- 12. Yu L, Fink BD, Sivitz WI. Simultaneous quantification of mitochondrial ATP and ROS production. Methods Mol Biol 1264: 149–159, 2015. doi: 10.1007/978-1-4939-2257-4_14. [DOI] [PubMed] [Google Scholar]
- 13. Wojtczak L, Zaluska H, Wroniszewska A, Wojtczak AB. Assay for the intactness of the outer membrane in isolated mitochondria. Acta Biochim Pol 19: 227–234, 1972. [PubMed] [Google Scholar]
- 14. Enerbäck S, Jacobsson A, Simpson EM, Guerra C, Yamashita H, Harper ME, Kozak LP. Mice lacking mitochondrial uncoupling protein are cold-sensitive but not obese. Nature 387: 90–94, 1997. doi: 10.1038/387090a0. [DOI] [PubMed] [Google Scholar]
- 15. Yu L, Fink BD, Som R, Rauckhorst AJ, Taylor EB, Sivitz WI. Metabolic clearance of oxaloacetate and mitochondrial complex II respiration: divergent control in skeletal muscle and brown adipose tissue. Biochim Biophys Acta Bioenerg 1864: 148930, 2023. doi: 10.1016/j.bbabio.2022.148930. [DOI] [PMC free article] [PubMed] [Google Scholar]
- 16. Delaglio F, Grzesiek S, Vuister GW, Zhu G, Pfeifer J, Bax A. NMRPipe: a multidimensional spectral processing system based on UNIX pipes. J Biomol NMR 6: 277–293, 1995. doi: 10.1007/BF00197809. [DOI] [PubMed] [Google Scholar]
- 17. Johnson BA, Blevins RA. NMR View: A computer program for the visualization and analysis of NMR data. J Biomol NMR 4: 603–614, 1994. doi: 10.1007/BF00404272. [DOI] [PubMed] [Google Scholar]
- 18. O'Malley Y, Fink BD, Ross NC, Prisinzano TE, Sivitz WI. Reactive oxygen and targeted antioxidant administration in endothelial cell mitochondria. J Biol Chem 281: 39766–39775, 2006. doi: 10.1074/jbc.M608268200. [DOI] [PubMed] [Google Scholar]
- 19. Rhee SG, Chang TS, Jeong W, Kang D. Methods for detection and measurement of hydrogen peroxide inside and outside of cells. Mol Cells 29: 539–549, 2010. doi: 10.1007/s10059-010-0082-3. [DOI] [PubMed] [Google Scholar]
- 20. Yu L, Fink BD, Herlein JA, Sivitz WI. Mitochondrial function in diabetes: novel methodology and new insight. Diabetes 62: 1833–1842, 2013. doi: 10.2337/db12-1152. [DOI] [PMC free article] [PubMed] [Google Scholar]
- 21. Nicholls DG. Mitochondrial proton leaks and uncoupling proteins. Biochim Biophys Acta Bioenerg 1862: 148428, 2021. doi: 10.1016/j.bbabio.2021.148428. [DOI] [PubMed] [Google Scholar]
- 22. Tahara EB, Navarete FD, Kowaltowski AJ. Tissue-, substrate-, and site-specific characteristics of mitochondrial reactive oxygen species generation. Free Radic Biol Med 46: 1283–1297, 2009. doi: 10.1016/j.freeradbiomed.2009.02.008. [DOI] [PubMed] [Google Scholar]
- 23. Quinlan CL, Orr AL, Perevoshchikova IV, Treberg JR, Ackrell BA, Brand MD. Mitochondrial complex II can generate reactive oxygen species at high rates in both the forward and reverse reactions. J Biol Chem 287: 27255–27264, 2012. doi: 10.1074/jbc.M112.374629. [DOI] [PMC free article] [PubMed] [Google Scholar]
- 24. Kazak L, Chouchani ET, Stavrovskaya IG, Lu GZ, Jedrychowski MP, Egan DF, Kumari M, Kong X, Erickson BK, Szpyt J, Rosen ED, Murphy MP, Kristal BS, Gygi SP, Spiegelman BM. UCP1 deficiency causes brown fat respiratory chain depletion and sensitizes mitochondria to calcium overload-induced dysfunction. Proc Natl Acad Sci USA 114: 7981–7986, 2017. doi: 10.1073/pnas.1705406114. [DOI] [PMC free article] [PubMed] [Google Scholar]
- 25. Williamson DH, Lund P, Krebs HA. The redox state of free nicotinamide-adenine dinucleotide in the cytoplasm and mitochondria of rat liver. Biochem J 103: 514–527, 1967. doi: 10.1042/bj1030514. [DOI] [PMC free article] [PubMed] [Google Scholar]
- 26. Borst P. The malate-aspartate shuttle (Borst cycle): How it started and developed into a major metabolic pathway. IUBMB Life 72: 2241–2259, 2020. doi: 10.1002/iub.2367. [DOI] [PMC free article] [PubMed] [Google Scholar]
- 27. Mills EL, Pierce KA, Jedrychowski MP, Garrity R, Winther S, Vidoni S, Yoneshiro T, Spinelli JB, Lu GZ, Kazak L, Banks AS, Haigis MC, Kajimura S, Murphy MP, Gygi SP, Clish CB, Chouchani ET. Accumulation of succinate controls activation of adipose tissue thermogenesis. Nature 560: 102–106, 2018. doi: 10.1038/s41586-018-0353-2. [DOI] [PMC free article] [PubMed] [Google Scholar]
- 28. Liao FH, Yao CN, Chen SP, Wu TH, Lin SY. Transdermal delivery of succinate accelerates energy dissipation of brown adipocytes to reduce remote fat accumulation. Mol Pharm 19: 4299–4310, 2022. doi: 10.1021/acs.molpharmaceut.2c00628. [DOI] [PMC free article] [PubMed] [Google Scholar]
- 29. Porter C. Quantification of UCP1 function in human brown adipose tissue. Adipocyte 6: 167–174, 2017. doi: 10.1080/21623945.2017.1319535. [DOI] [PMC free article] [PubMed] [Google Scholar]
Associated Data
This section collects any data citations, data availability statements, or supplementary materials included in this article.
Supplementary Materials
Supplemental Figs. S1–S5: https://doi.org/10.6084/m9.figshare.22491748.
Data Availability Statement
Data will be made available upon reasonable request.