

Abstract
The ProtoMap site offers an exhaustive classification of all proteins in the SWISS-PROT database, into groups of related proteins. The classification is based on analysis of all pairwise similarities among protein sequences. The analysis makes essential use of transitivity to identify homologies among proteins. Within each group of the classification, every two members are either directly or transitively related. However, transitivity is applied restrictively in order to prevent unrelated proteins from clustering together. The classification is done at different levels of confidence, and yields a hierarchical organization of all proteins. The resulting classification splits the protein space into well-defined groups of proteins, which are closely correlated with natural biological families and superfamilies. Many clusters contain protein sequences that are not classified by other databases. The hierarchical organization suggested by our analysis may help in detecting finer subfamilies in families of known proteins. In addition it brings forth interesting relationships between protein families, upon which local maps for the neighborhood of protein families can be sketched. The ProtoMap web server can be accessed at http://www.protomap.cs.huji.ac.il
INTRODUCTION
In the last few years large-scale sequencing projects throughout the world have turned out new sequences at an ever-increasing rate. Many of the discovered sequences have an unknown function. Consequently, there is a growing need for automatic tools to analyze and organize these data. Given a new protein sequence, the common approach to predicting its function and analyzing its properties hinges on pairwise comparisons with the sequences of other proteins whose properties are already known. However, in many cases sequences have diverged to the extent that their common origin is untraceable by a direct sequence comparison. In such cases this method fails to provide clues about the functionality of the protein in question.
During the last decade, much effort was directed into the large-scale analysis of protein sequences. These analyses yielded excellent databases of protein families, motifs and domains which can be used to search for significant patterns in new sequences. Different methodologies were tested, various representations of motifs and domains were employed and consequently different classifications were obtained. Most of these studies focused on identifying short motifs [e.g. PROSITE (1), PRINTS (2), Blocks (3), IDENTIFY (4)], whereas others tried to detect whole domains and infer domain boundaries [e.g. Pfam (5), ProDom (6), Domo (7), SMART (8)]. Several other studies focused on the analysis of complete protein sequences [e.g. COGs (9), PIR (10), Systers (11)]. Many of these studies start by building a multiple alignment of a pre-defined group of related sequences (some databases start by using the groups defined by other databases). All these databases have become an important tool in the analysis of newly discovered protein sequences. The biological knowledge accumulated in these databases helps to identify the biological function of many protein sequences, and enhances the ability to detect relationships between distantly related proteins.
ProtoMap was developed as a fully automatic method for classification of protein sequences based on sequence similarities, through the detection of groups of homologous proteins (clusters), and high level structures (groups of related clusters) within the sequence space. The analysis is done without the prerequisite of multiple alignments or pre-defined groups. Our goal is to provide a broader semi-global view of the sequence space. Such a view may reveal relationships among protein families and yield deeper insights into the nature of newly discovered sequences.
METHODS
In our analysis, the protein space is represented as a weighted graph whose vertices are the sequences. The weight of an edge between two sequences corresponds to their degree of similarity. To build this graph we combine the common measures of similarity between protein sequences [Smith-Waterman (12), FASTA (13), BLAST (14)], with two different scoring matrices [Blosum 50 and Blosum 62 (15)] and create an exhaustive list of neighboring sequences, per each sequence in the SWISS-PROT database (16). The weight of an edge connecting two sequences is defined as the expectation value of the similarity between the corresponding sequences.
Clusters of related proteins correspond to strongly connected sets of vertices in this graph. The analysis aims to automatically detect these sets, and thus obtain a classification of all protein sequences, as well as a better view of the geometry of the protein space. Our analysis starts from a high-resolution classification, based on the transitive closure of highly significant similarities (with expectation value below 1e–100). This conservative classification consists of many smallish classes. The resulting classes are then merged to form bigger and more diverse clusters, by considering weaker, less significant similarities. Merging is performed via a two-phase algorithm. First, the algorithm identifies groups of possibly related clusters. A statistical test is applied in order to identify and eliminate false connections between unrelated proteins, and only if there is a strong statistical evidence for a connection between clusters do they enter the same group. Clusters within the same group are considered as candidates for merging. Then, a ‘global’ test is applied to identify nuclei of strong relationships within these groups of clusters. Some of the clusters are merged, given that their connection is statistically significant, whereas others stay apart.
This process takes place at varying thresholds of statistical significance (confidence levels). At each step the algorithm is applied to the classes of the previous classification, to obtain the next classification, at the next more permissive threshold. The analysis starts at the 1e–100 threshold. Subsequent runs are carried out at levels 1e–95, 1e–90, 1e–85, ... 1e–0 ( = 1). Consequently, a hierarchical organization of all proteins is obtained (for more details see 17,18).
PROTOMAP RELEASES
ProtoMap releases are associated with major releases of the SWISS-PROT database. Release 1.0 of ProtoMap was based on the analysis of SWISS-PROT 33 and the current release (2.0) is associated with a preliminary version of SWISS-PROT 36 (release 35 with updates till May 1998). This release of ProtoMap contains the results of our analysis as applied to the 72 623 proteins in that release of SWISS-PROT. The procedure resulted in 13 354 clusters, 5869 of which contain at least two proteins. 1403 clusters are of size 10 and above (these numbers refer to level 1e–0). Clusters correspond to protein families and superfamilies (see ref. 18 for performance evaluation tests and mutual correlation of ProtoMap releases).
We are currently working on release 3.0 of ProtoMap based on the sequences of SWISS-PROT 38 (August 1999). The core clusters which are provided by this analysis will be used to classify all sequences in the current TrEMBL database, thus extending our classification to almost all protein sequences known today. This is done by comparing the TrEMBL sequences with the SWISS-PROT sequences and utilizing the information about ProtoMap clusters, much in the same way that new sequences are classified by ProtoMap (see section ‘Analysis of New Sequences’).
The current releases are based on all-against-all comparisons, and require intensive computations. However, the next updates will be more frequent as a framework for efficient incremental update of ProtoMap is currently being constructed. This is done by saving the distribution of the original raw scores from a database search for each protein sequence, as well as the scores of all hits with e-value <1. To reduce the amount of memory space needed to store these distributions, only a concise representation of the distribution is kept. Given the new entries in a new release of SWISS-PROT, the existing entries are updated by performing a search only with respect to these new entries, and the distributions are recalculated. The new e-values are computed in seconds from these new distributions and the size of the current database. The new entries are queried against the updated database and are added in the same way entries in the first two releases were processed.
THE PROTOMAP WEBSITE
The results of our analysis are accessible on the WWW at http://www.protomap.cs.huji.ac.il . A mirror site of ProtoMap will be available soon at Stanford University at http://protomap.stanford.edu . The analysis of the SWISS-PROT database can be accessed by a variety of methods, and user friendly graphic tools were developed to facilitate the presentation of this huge body of information.
Entering the analyzed database. The analysis was carried out at varying thresholds, or confidence levels, in the range 1e–100 (very high confidence level) to 1e–0 = 1 (almost pure chance similarities). At each level, the universe of all proteins splits into clusters, which get larger and coarser as the confidence levels decrease. Each cluster is given a number. Clusters are numbered in decreasing order of size.
Selecting the entrance level. The default entrance level is 1e–0, but many interesting relations are revealed at higher levels as well. In any case, the selection of the entrance level does not limit the search as the user advances in his analysis. It is possible to move among levels, thus tracing the fusion of sub-families into larger families and identifying links between protein families.
Searching
A search is always performed at a specific level. Five different access modes are available. For example, one can search by a general keyword (e.g. toxin, coiled coil) as in Figure 1. If one is interested in a specific protein then one can search by SWISS-PROT accession number (or ID) as in Figure 2. If the keyword option is too general and the SWISS-PROT ID is too specific, then it is possible to search by protein name (e.g. synaptotagmin, ras).
Figure 1.
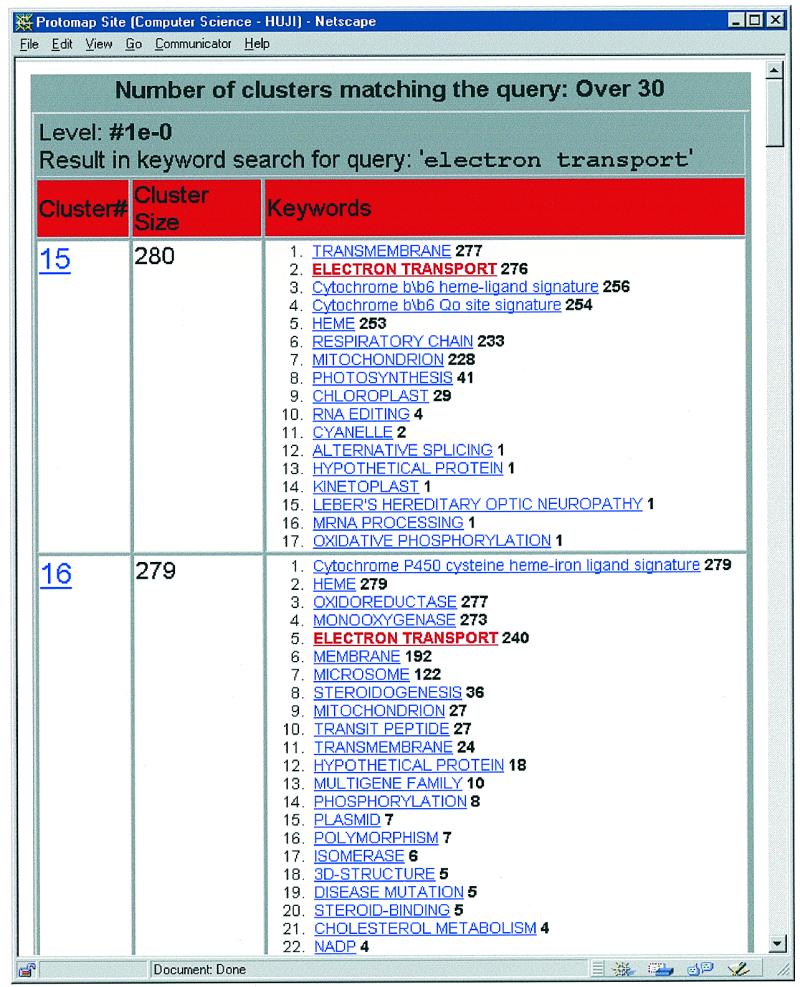
Searching the ProtoMap clusters I. Results of a search on the keyword ‘electron transport’. A keyword search may use a simple query such as ‘ATP-binding’. More complex queries are made possible, using the logical connectives AND, OR, NOT, XOR and parentheses, to define precedence. For example: (DNA-binding OR RNA-binding) AND 3D-structure. The search outputs a table with all clusters matching your query. Each cluster is given with its number (clusters are sorted by size), its size, and the keywords associated with the cluster. A click on one of the keywords, activates a new search with the clicked word as the new keyword.
Figure 2.
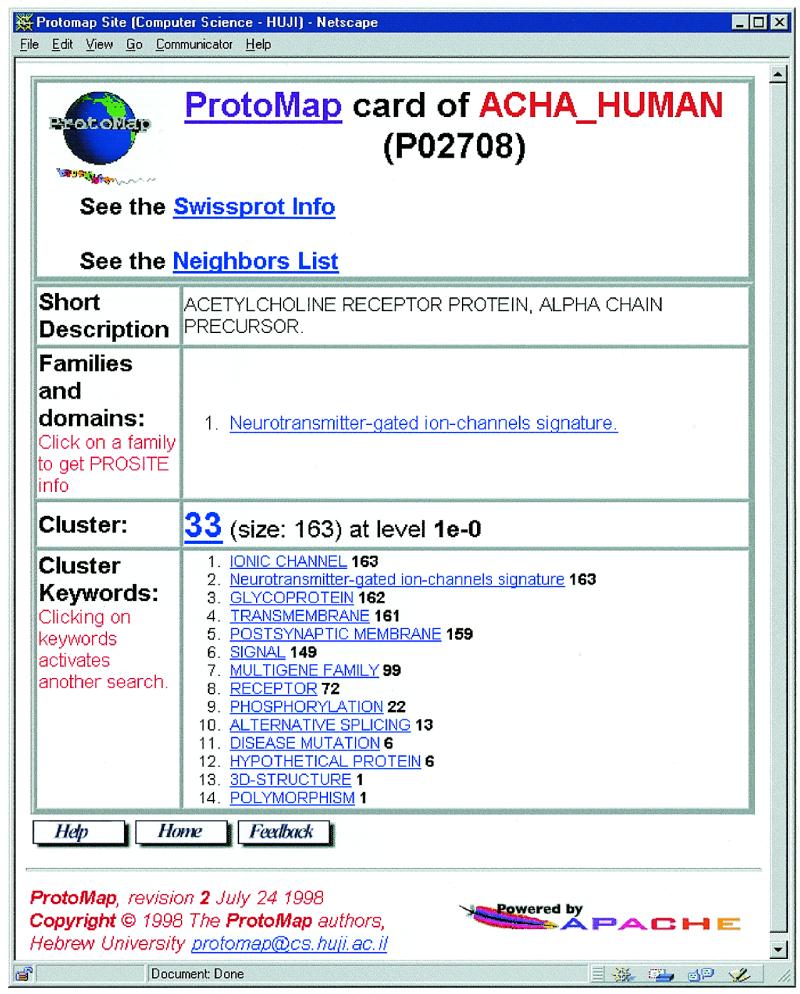
Searching the ProtoMap clusters II. Results of a search on SWISS-PROT ID ‘acha_human’. Search by SWISS-PROT ID (or AC) yields a card with information about the protein and the specific cluster which contains the selected protein, as well as the full list of neighbors, combined from all three methods for sequence comparison (SW, BLAST and FASTA), and the alignments.
Browsing a cluster
When a search (in any of the methods described above) yields a cluster that is of interest, one may proceed by clicking on the cluster number. Subsequently, a list of all proteins in the cluster is generated. Each protein is accompanied by a short description (the full information is available as well), and a list of known domains and motifs (from PROSITE database; 1) which appear in the protein.
Two java applets can help visualize different aspects of this cluster. The tree-like presentation of the cluster (Fig. 3) places each protein at a leaf of a tree (on the left side). This is not a phylogenetic tree but rather a similarity based dendogram, where the similarity of each two proteins is defined based on the correlation of their similarity relationships with all other members in the cluster. The root of the tree is the rightmost vertex. The x-coordinate of internal nodes in the tree indicates the similarity among the proteins at the leaves of the corresponding subtree. The higher the similarity, the further left on the screen the node is located. This tool can help in detecting the existence of subgroups within the cluster, and in obtaining a hierarchical organization within the cluster.
Figure 3.

Tree-like presentation of a family of glycosyl hydrolases (cluster 100 at level 1e–0). The different parts of the tree correspond to different subfamilies within this family. One can zoom in on any part of the tree at various levels of magnification. By standing on a vertex (without pressing) one can get a summary line of all proteins descendent from this vertex. When pressing on a vertex, a detailed list of all proteins descendent from the vertex is generated.
The applet named higher level constituents allows one to move between levels and trace the formation of clusters. Isolated clusters in a given level may unite when the threshold is lowered. This tool graphically shows the clusters which were isolated at higher confidence levels, and which form the cluster under observation at the current lower threshold, as well as the connections between these clusters (Fig. 4). This way it is possible to trace the formation of families out of sub-families, and detect inter-media sequences (18). By clicking on a vertex, a new window appears, with detailed information about the corresponding cluster. Besides the list of members and the summary, the tree-like presentation of the specific cluster, as well as its own higher-level constituents are also available. By clicking on an edge, a new window appears, with the list of pairs connecting the corresponding vertices (clusters), and a schematic representation that illustrates the pairwise alignments and the sequences. All PROSITE motifs and domains are shown as well (Fig. 5). By this it is possible to immediately recognize proteins that are composed of several domains and to check if the alignment extends throughout the two sequences, or is limited to the motif region, etc. The detailed alignment in text format, and the SWISS-PROT information about the corresponding proteins are also available.
Figure 4.
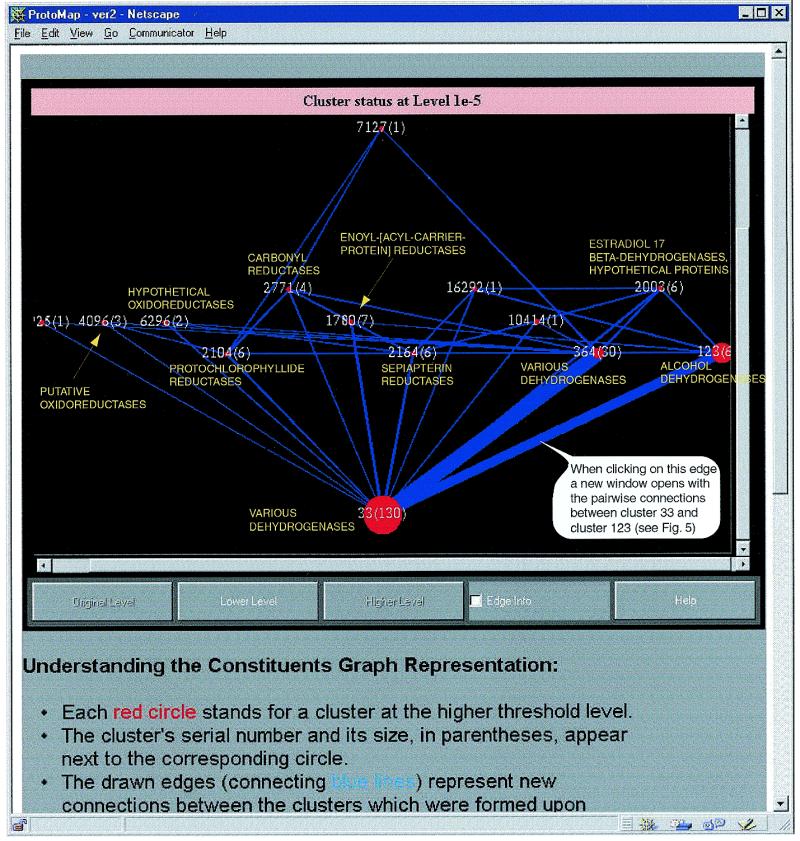
Higher level constituents of the extended ‘short-chain’ alcohol dehydrogenases family (cluster 19 at level 1e–0). Each circle stands for a cluster at the higher threshold level. Each such cluster includes members of a specific subfamily of the alcohol dehydrogenases family. For clusters with at least two members, the name of the subfamily appears next to the corresponding circle. Edges represent new connections between the clusters that were formed upon lowering the threshold. The size of the circles and the width of the edges are proportionate to the number of proteins and the number of connections, respectively.
Figure 5.
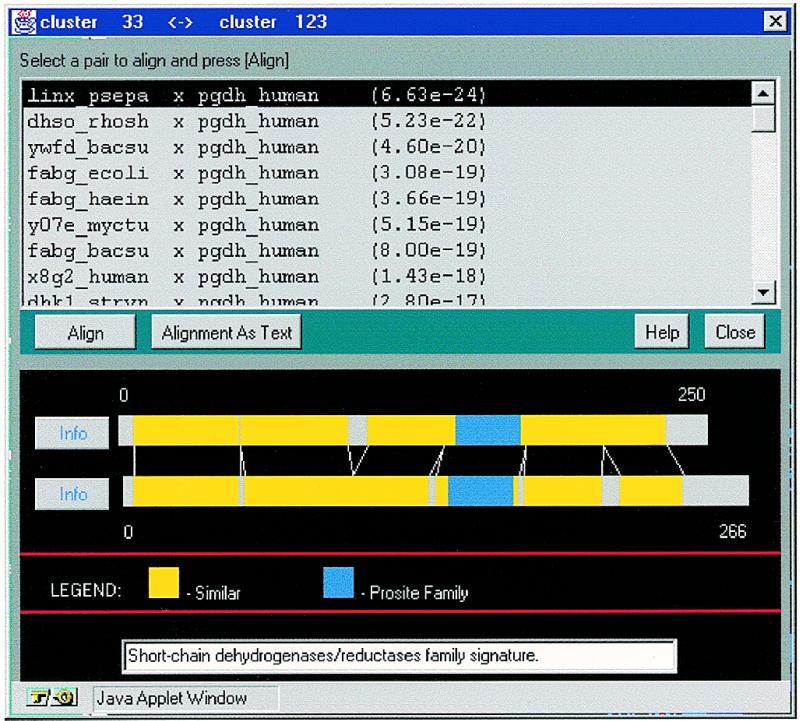
Connections between subcluster of alcohol dehydrogenases and subcluster of various oxidoreductases and dehydrogenases, all belong to the extended family of ‘short chain’ alcohol dehydrogenases (see Fig. 4). One can select a pair in the list and press ‘Align’ to get the pairwise alignment (displayed is the pairwise alignment of SP:linx_psepa and SP:pgdh_human).
LOCAL MAPS
Another interesting feature of ProtoMap is the list of possibly related clusters. These are clusters whose connection with the cluster under study was automatically rejected by the clustering algorithm. This happens whenever the quality associated with a connection falls below a certain threshold. Even though some of these connections are justifiably rejected, many others are nevertheless meaningful and reflect genuine though distant homologies. In examining a given cluster, much insight can be gained by observing its possibly related clusters. To evaluate the relations, and distinguish true relationships from insignificant connections, the pairwise alignments of protein pairs, one from the cluster under study and one from a possibly related cluster are given. Based on the connections with possibly related clusters one can get a broader view of the neighborhood of protein families and draw local schematic maps of the protein space (18). A sample local map of the small GTP-binding proteins superfamily is given in Figure 6.
Figure 6.

A local map of the Ras superfamily. Each circle stands for a cluster. Circles’ radii are proportionate to the clusters’ sizes. Cluster 9 (ProtoMap release 2.0, level 1e–0) contains members of the Ras superfamily. The cluster is related to other clusters of small GTP-binding proteins. Edges represent relatedness between clusters and edge widths are proportionate to the quality of connection between the corresponding clusters. Cluster numbers that are underlined indicate no additional neighbors. Some of the clusters (169 and 499) are connected to additional local maps that are not related to the GTP binding proteins (not shown).
ANALYSIS OF NEW SEQUENCES
The ProtoMap site also offers online classification of (new) protein sequences submitted by the user. The sequence is compared with the sequences in the database and the protein is classified to the existing clusters based on its distribution of connections with each cluster. Specifically, the quality of the connection of a new sequence with a cluster is defined as the geometric mean of pairwise similarities with all members of that cluster. Members that are unrelated to the new sequence according to the search results are assigned the default (insignificant) e-value of 1. The geometric mean considers the distribution of all pairwise connections between the new sequence and the cluster, so that random or unusual connections have little effect.
The sequence can be classified to more than one cluster, and the clusters are ranked based on the quality of the connection with the new sequence, to help in predicting its nature.
CONCLUSION
The ProtoMap database automatically classifies all protein sequences in the SWISS-PROT database into clusters, based on pairwise similarities. It differs from other classifications in several means. (i) No pre-defined groups or other classifications are being employed in our analysis, and no multiple alignments of the proteins are needed. (ii) We chart the space of all protein sequences in SWISS-PROT, not just particular families. (iii) We offer a global organization of all protein sequences. Such organization can lead to the discovery of ordered structures (clusters and super-clusters) and high-level features of the protein space (such as ‘geometry’), and is expected to add insight about the function of a protein from its relative position in the space, and from its overall connections within its close neighborhood. As such, the ProtoMap database can serve as a complementary tool for sequence analysis, helping to elucidate new relationships that might not be discovered by other methods.
Acknowledgments
ACKNOWLEDGEMENTS
This study was partially supported by the Israeli Academy of Sciences and the Horowitz Fund. G.Y. is supported by a Burroughs-Welcome Fellowship from the Program in Mathematics and Molecular Biology (PMMB).
REFERENCES
- 1.Hofmann K., Bucher,P., Falquet,L. and Bairoch,A. (1999) Nucleic Acids Res., 27, 215–219. [DOI] [PMC free article] [PubMed] [Google Scholar]
- 2.Attwood T.K., Flower,D.R., Lewis,A.P., Mabey,J.E., Morgan,S.R., Scordis,P., Selley,J. and Wright,W. (1999) Nucleic Acids Res., 27, 220–225. Updated article in this issue: Nucleic Acids Res. (2000), 28, 225–227. [DOI] [PMC free article] [PubMed] [Google Scholar]
- 3.Henikoff J.G., Henikoff,S. and Pietrokovski,S. (1999) Nucleic Acids Res., 27, 226–228. Updated article in this issue: Nucleic Acids Res. (2000), 28, 228–230. [DOI] [PMC free article] [PubMed] [Google Scholar]
- 4.Nevill-Manning C.G., Wu,T.D. and Brutlag,D.L. (1998) Proc. Natl Acad. Sci. USA, 95, 5865–5871. [DOI] [PMC free article] [PubMed] [Google Scholar]
- 5.Bateman A., Birney,E., Durbin,R., Eddy,S.R., Finn,R.D. and Sonnhammer,E.L. (1999) Nucleic Acids Res., 27, 260–262. Updated article in this issue: Nucleic Acids Res. (2000), 28, 263–266. [DOI] [PMC free article] [PubMed] [Google Scholar]
- 6.Corpet F., Gouzy,J. and Kahn,D. (1999) Nucleic Acids Res., 27, 263–267. Updated article in this issue: Nucleic Acids Res. (2000), 28, 267–269. [DOI] [PMC free article] [PubMed] [Google Scholar]
- 7.Gracy J. and Argos,P. (1998) Bioinformatics, 14, 164–187. [DOI] [PubMed] [Google Scholar]
- 8.Ponting C.P., Schultz,J., Milpetz,F. and Bork,P. (1999) Nucleic Acids Res., 27, 229–232. [DOI] [PMC free article] [PubMed] [Google Scholar]
- 9.Tatusov R.L., Eugene,V.K. and David,J.L. (1997) Science, 278, 631–637. [DOI] [PubMed] [Google Scholar]
- 10.Barker W.C., Pfeiffer,F. and George,D.G. (1996) Methods Enzymol., 266, 59–71. [DOI] [PubMed] [Google Scholar]
- 11.Krause A. and Vingron,M. (1998) Bioinformatics, 14, 430–438. [DOI] [PubMed] [Google Scholar]
- 12.Smith T.F. and Waterman,M.S. (1981) Adv. App. Math., 2, 482–489. [Google Scholar]
- 13.Pearson W.R. and Lipman,D.J. (1988) Proc. Natl Acad. Sci. USA, 85, 2444–2448. [DOI] [PMC free article] [PubMed] [Google Scholar]
- 14.Altschul S.F., Carrol,R.J. and Lipman,D.J. (1990) J. Mol. Biol., 215, 403–410. [DOI] [PubMed] [Google Scholar]
- 15.Henikoff S. and Henikoff,J.G. (1992) Proc. Natl Acad. Sci. USA, 89, 10915–10919. [DOI] [PMC free article] [PubMed] [Google Scholar]
- 16.Bairoch A. and Apweiler,R. (1999) Nucleic Acids Res., 27, 49–54. [DOI] [PMC free article] [PubMed] [Google Scholar]
- 17.Yona G., Linial,N., Tishby,N. and Linial,M. (1998) Proceedings of ISMB 98, 212–221. [Google Scholar]
- 18.Yona G., Linial,N. and Linial,M. (1999) Proteins, 37, 360–378. [PubMed] [Google Scholar]