

Abstract
We propose a novel framework to passively monitor pulse rate during the time spent by users on their personal mobile devices. Our framework is based on passively capturing the user’s pulse signal using the front-facing camera. Signal capture is performed in the background, while the user is interacting with the device as he/she normally would, e.g., watch movies, read emails, text, and play games. The framework does not require subject participation with the monitoring procedure, thereby addressing the well-known problem of low adherence with such procedures. We investigate various techniques to suppress the impact of spontaneous user motion and fluctuations in ambient light conditions expected in non-participatory environments. Techniques include traditional signal processing, machine learning classifiers, and deep learning methods. Our performance evaluation is based on a clinical study encompassing 113 patients with a history of atrial fibrillation (Afib) who are passively monitored at home using a tablet for a period of two weeks. Our results show that the proposed framework accurately monitors pulse rate, thereby providing a gateway for long-term monitoring without relying on subject participation or the use of a dedicated wearable device.
Keywords: Passive Monitoring, Pulse Rate, Videoplethysmography, Photoplethysmography, Mobile Health
I. INTRODUCTION
Measuring Heart Rate (HR) using an Electrocardiogram (ECG) and Pulse Rate (PR) using an Oximeter are routinely performed for assessment of cardiac condition of patients in healthcare facilities and at home.
Atrial Fibrillation (Afib) is a prevalent and spreading heart rhythm disorder, characterized by rapid and irregular atrial activation [1], [2]. Afib can cause systemic embolism, hemodynamic disorder, tachycardia-related myopathy as well as symptoms such as heart palpitations, lightheadedness, extreme fatigue, shortness of breath, and chest pain [3], [4]. The Global Burden of Disease Study 2017 showed that 37.57 million prevalent cases and 3.05 million incident cases were caused by Afib globally followed by 287,241 death cases in 2017 [5].
Treatment of Afib patients would benefit tremendously from persistent monitoring of Heart Rate (HR), Afib episodes, Afib symptoms and Afib burden. In the work, we focus on detecting PR. According to the American Heart Association, long-term monitoring of HR is a crucial vital sign in assessing overall health and cardiac status [6], especially at rest [7]. Patients diagnosed with Afib often suffer from elevated resting HR and are prescribed medication to lower and stabilize it. Long term monitoring of HR of Afib patients is important to evaluate drug efficiency and support drug titration.
With the miniaturization and proliferation of PhotoPlethysmoGraphy (PPG) sensors, PR monitoring has been integrated into everyday objects such as smartwatches, bracelets, rings, and other wearables. These can track long-term PR trends for wellness purposes. A PPG sensor is commonly placed on the fingertip or the earlobe and captures changes in blood volumes in capillaries, arterioles, or even in the deeper tissues hosting arteries depending on the wavelength of its light source [8]. PPG sensors are typically cheaper and less burdening than other cardiac monitoring devices such as the electrodes of an electrocardiogram (ECG). Yet, they require contact with the skin as well as users’ compliance to ensure they are placed properly, charged, and used regularly. These constraints emphasized the need for alternative solutions such as non-contact and opportunistic monitoring approaches which are true passive monitoring methods. These include radar microwave [9], thermal cameras [10], RGB webcams [11], [12], [13], and near-infrared cameras [9]. Methods utilizing RGB cameras are exceptionally advantageous as good-quality cameras are embedded into personal smart devices such as smartphones, tablets, and laptops. Leveraging the camera from smart devices to enable passive pulse monitoring eliminates the need to adopt a dedicated device or wearable sensor.
Various methods for measuring PR using RGB cameras were proposed in the past. These methods typically rely on ambient light reflected off the skin of the face and captured by the camera in a stream of RGB frames [10], [11], [13], [12]. They then detect the location of the face, and calculate the average value for the R, G, and B colors separately per frame over the facial area, aka the Region of Interest (RoI). This reduces the video stream to a set of three RGB traces that are then subjected to basic signal processing such as band-pass filtering and detrending. The processed RGB traces are then subjected to the specific method for extracting PR. The underlying assumption of all methods is that as the pulsating heart pumps blood in and out of the face, it modulates the average RGB intensities captured by the camera as well as the overall color composition. Since these methods essentially capture a PPG signal using a camera, we collectively address them as Videoplethysmography (VPG) methods. It should be noted that the use of cameras for extracting PPG has various names in the literature. For examples, Remote PPG (rPPG), Image PPG (iPPG) and PPG Imaging (PPGi). Since VPG was used before in conjunction with the generating of a Hue signal [14], [13], [15], [16], we use VPG in this work as well.
VPG methods evolved over the past decade in tandem with the advancements in compact RGB cameras hardware and algorithms. In 2008, Verkruysse et al. placed a camera in front of the subject and recorded video at 30 FPS while the subject sitting with no movement. After recording they manually select the subject face. The RGB of the selected RoI is then used in processing to estimate the HR via Fast Fourier Transform (FFT) [17]. They showed that the pulsating heart is presented best in the green trace and reasoned that the blood observes green more than blue and red.
Many VPG methods and corresponding trials were proposed and conducted thereafter. A few representative examples include [11], [18], where the authors employ blind source separation using Independent Component Analysis (ICA) and its derivative Constrained-ICA. More recently, Rouast et al. developed a smartphone application that estimates heart rate from the front camera [13]. Their algorithm uses the Viola-Jones face detector and uses only the Green and Red channel information in their estimation. After removing noise and dimensionality reduction, they estimated PR from spectral power. Benedetto et al. [18] assessed a commercially available remote-PPG device. They compared the non-contact method with ECG. In their experiment, twenty-four subjects were enrolled and their PR was monitored for 20 minutes with both methods simultaneously. Trumpp et al. [19] recorded 41 patients during surgery using an RGB camera that pointed to the patient’s forehead. Their results show that the green channel provides more accurate PR estimation and their VPG method estimates HR with 95.6% accuracy. In 2013, Haan and Jeanne [20] proposed a new chrominance-based method capable of recovering from motion artifacts. In 2015, Papon et al. [21] presented an evaluation of performance of smartphone applications that use the embedded camera to estimate PR. In 2018 and 2020, Roast et al. [22] and Deng and Kumar [23] respectively provided a survey that focused on PR estimation using RGB cameras. In 2019, Huynh et al. [24] presented the VitaMon algorithm that uses the smartphone facing camera to estimate PR. More recently, Molinaro et al. [25] presented work on contactless vital sign monitoring using digital cameras. Guzman et al. [15] conducted a measurement campaign to collect synchronized signals from ECG, PPG, a high-speed camera, and a common webcam, that included 50 healthy subjects in a hospital setting. Their results demonstrated that the combination of a Hue-based method proposed in [14] with the low-cost webcam provides comparative accuracy to ECG and PPG signals.
In all the aforementioned methods and corresponding studies, the measurements were taken either in a controlled environment (the subject was being still, lighting was set a-prior, the camera was positioned stationary to the subject’s face, etc.), or while the subject was participating in the measurement itself (the subject was asked to position face within a rectangle on the screen during measurement). The reliance on a controlled environment and/or active user participation pose major limitations on the widespread adoption and use of VPG methods. It is widely recognized that self-monitoring by subjects is unsuccessful over long periods of time due to the low adherence of subjects with monitoring protocols. For example, [26] the authors assessed the participation of users in a self-monitoring experiment. They showed that subjects tend to have lower participation when required to perform tasks over a long period of time. It follows that to truly fulfill the potential of VPG for long-term PR monitoring, a framework is needed to allow them to operate accurately in non-controlled environments and ideally without requiring active participation by the subject being monitored. Operating in such a non-controlled environment would result in some measurements being taken in poor ambient lighting conditions and while the subject is spontaneously moving. It follows that a passive monitoring framework has to provide a solution for identifying preferable conditions for capturing accurate PR.
As a result of the immense body of work cited above, there are many methods currently available for extracting PR using cameras. For the purpose of our work, we decided to use the method based on Hue as presented in [14], [15], where it was shown to perform very well compared to other prominent methods including ICA and Chrominance-based approaches. See [15] for more details. It is of course possible to implement monitoring in the background using other methods for extracting PR.
In this contribution, we propose, implement and evaluate the performance of a novel framework for passively monitoring PR using VPG. Our framework is based on capturing a VPG signal from front-facing cameras embedded in smart devices, while the subject being monitored uses the device as he/she normally would. It follows that while the subject uses a personal device to read emails, watch movies, interact on social media, etc., the front-facing camera is used to seamlessly monitor PR without requiring subject participation in the monitoring process. In essence, our framework leverages passive screen time to perform monitoring of PR over potentially unlimited time (weeks, months, and years). As long as the subject uses a personal device, PR is collected effortlessly. This allows for tracking trends in PR over long periods of time without the need to purchase, deploy and service a dedicated device such as an ECG holter and with zero adherence requirement from the subject. Due to the ubiquitous use of smart devices and the consistently increasing screen time, the proposed framework also affords the opportunity to easily deploy a PR monitoring technology to remote subjects with limited access to health services in the form of an easily downloadable APP.
The rest of the paper is organized as follows. Section II presents the proposed framework for VPG passive monitoring. Section III describes a large clinical study we conducted to support the development and validation of the proposed framework. Section V presents and interprets results. Section VI provides a discussion and section VII concludes the work.
II. PASSIVE MONITORING ON A PERSONAL DEVICE
Fig. 1 shows the data acquisition process where the subject uses the provided mobile device (Tab S3 by Samsung) that has a front facing 5 MP camera. To capture average RGB values from the facial RoI, a custom app was implemented. The APP uses the tablet’s front camera to periodically capture a cardiac signal in the background, while the participant is engaging with the tablet. The recorded data are sent via the APP to a secure server for offline processing via a Wi-Fi connection in the subject’s home.
Fig. 1:

Data collection architecture
In the clinical validation study presented in a later section, an FDA-approved ECG patch (Zio XT, iRhythm Technologies, San Francisco, CA, USA) is used to provide a reference measurement of HR [27]. The patch stores continuous ECG data on its internal memory. Data is extracted after the two weeks experiment is over, processed, and added to the secure server.
A. System Requirements
In what follows, we describe the system requirements of operating the camera, contending with varying ambient light, protecting patient’s privacy, and addressing motion artifacts.
Camera operation:
by default, mobile device cameras are operated to ensure a visually appealing image or video by dynamically changing the camera’s functions. While this is beneficial for video and image capture, it is detrimental to extracting the subtle changes in color modulated by the pulsating heart. Therefore, camera functions need to be converged and locked before extracting the cardiac signal.
Privacy and Identification:
Patient’s privacy is critical, especially considering Health Insurance Portability and Accountability Act (HIPAA) requirements [28]. Another important issue is making sure the subject using the device is the intended subject to be monitored. During the clinical study described in the following section, a single image from each recorded signal was encrypted and stored on the device to be later validated by an authorized professional who had access to the images via secure login. In the future deployment of this monitoring framework, manual subject validation can be replaced with widely available face recognition algorithms to automate the process [29]. In addition, note that the APP captures and processes frames from the camera in real-time without recording videos or images, thereby generating non-identifiable data to be sent to the remote server.
Motion:
Motion artifacts are inevitable in an uncontrolled environment where the subject is being monitored in the background. The APP tracks and records the subject’s face drift and presence during the recording. These data are then used offline to generate features to help automatically filter out recordings that are corrupted by motion.
User experience:
It is important to ensure that user experience is not diminished due to the APPs background operation. For example, the app should not slow down the device, interfere with subjects’ use of the camera or drain the battery. We managed to have the APP drain marginal power and observed no slowdown in device operation even while the subject is watching videos.
B. APP for Capturing Data
The Android APP is designed to run as a service in the background. Frames from the camera are captured in the YCbCr color format using the camera2 pipeline with minimal compression to obtain images that are closest to the raw output from the camera sensor. The YCbCr images are converted to RGB where each pixel is stored in 8bits. To support real-time processing, we used the opencv library [30].
The capture of average RGB traces is performed on the mobile tablet using the following steps:
-
Step 1. Periodic attempt to detect a face:
The app periodically (every 30 secs) captures a single frame using the front camera and uses the device’s native face detection algorithm (provided by Android) to detect a face in the image. If a face is detected, the location of the face in the frame is stored in memory using 4 coordinates of a rectangle (first RoI) and Step 2 is executed. In the case of multiple face detection, the app would select the face that is closer to the tablet by comparing the area of detected faces and selecting the largest one.
-
Step 2. Camera convergence and lock:
The APP locks camera auto-adjust functions to stabilize the image.
-
Step 3. Real time signal capture:
Frames from the camera are captured at a rate of 30 frames per second for 25 seconds (750 frames). The average RGB values of the pixels within the first RoI are extracted. This results in three numbers per frame and the actual time of arrival of the frame being stored in memory. In addition, coordinates of the face RoI in each frame are recorded for assessing motion.
-
Step 4. Data transfer to cloud server:
A file containing the captured data is generated and sent to the server over a secure connection.
The use of the first RoI instead of frame RoI in Step 3 is inspired by the work in [16], where it was shown that using an unchanging RoI for VPG signal capture provides a more reliable measure.
To support synchronization of data from the APP and the ECG patch, the APP prompts the user to press a button on the ECG patch twice a day. These synchronization event are then used offline to compensate for clock drift. In a controlled setting where the subject is keeping still and the lighting conditions are stable, a longer measurement would result in higher estimation accuracy of PR. This is because more heart beats help identify their underlying frequency. However, in our case we are monitoring in the background, while the subject is using the device for other purposes and is not even aware of the measurement taking place (uncontrolled setting). It is therefore expected that the subject would be moving occasionally, cover the face, cough, etc. Using the training dataset, we found that a 25 sec measurement provides ample opportunities to capture a high enough PR estimation accuracy.
III. CLINICAL STUDY
The data presented in this study were collected during an ongoing clinical study (NCT04267133) with Atrial Fibrillation (Afib) patients. The Afib patients were enrolled at the Strong Memorial Hospital in Rochester (NY) under a protocol approved by the local Institutional Review Board.
The patients were approached at the time of treatment to stop their arrhythmia. After being consented, the patients were given the tablet loaded with the monitoring APP. A single photo was taken by a trained person using the APP. This photo was encrypted and saved on the device to support subject identification.
The ECG patch (Zio XT, iRhythm Technologies, San Francisco, CA, USA) samples at a rate of 180Hz and was placed on the subject’s torso following a standard hookup procedure. All ECG data were manually adjudicated by trained experts to remove periods of artifacts and corrupted signal.
To motivate the subjects to use the tablet, we provide a paid video streaming service and customize other APPs based on the subject’s interests.
Ultimately, the study cohort consisted of 113 subjects. Amongst them, 28 subjects were excluded because they had no recordings where their face was being detected in all frames. The data from the remaining 85 subjects (62 males and 23 females) with an average age of 64 were used for the analysis.
A. Data Synchronization
Unlike the tablet with internet connectivity, the ECG Zio XT Patch is not connected to the outside world and therefore its time is not synchronized with that of the tablet. In addition, its local oscillator drifts over time due to manufacturing variability between its actual and nominal frequency. Lack of synchronization coupled with clock drift over a two-week period can result in a significant discrepancy between sampling times at the tablet and patch. Hence, before any major data processing takes place, it is crucial to synchronize the two data sources per subject. To this end, the subjects were prompted by the APP to press a button on the ECG patch two times a day. This creates synchronization events that can be used to realign ECG time with Tablet time. The process of synchronization is partially automated and requires a human’s input. It starts by associating every timestamp of a prompted button press as recorded on the tablet with a timestamp of the closest actual button press on the patch. Then, a graph similar to the one in Figure 2 is generated. Figure 2 shows when a button press was prompted on the tablet’s time on the x-axis and the time difference between the actual patch button press on the y-axis. Note that time on the tablet is reported as posix time defined as the number of seconds elapsed since January 1, 1970. Since the frequency drift in oscillators is typically linear, the responsible party provides an approximation line of the best fit described by equation 1. Note that this equation expresses the expected linear growing discrepancy between the tablet and the patch due to the expected frequency deviation of the patch from its nominal frequency. Fitting the linear curve to the synchronization events is achieved by visual inspection. Due to data patterns being complex and containing many outliers, we found it to be more reliable to use human input in this step. Primarily, outliers are due to participants pushing the button accidentally as well as forgetting to push it when asked. Once parameters of the line and are extracted from the manually drawn line, equation 2 can be used to associate any VPG recording with an ECG signal.
Fig. 2:

Typical use case in the data synchronization process
| (1) |
| (2) |
B. Signal Processing
The average RGB values captures during Step 3 in the data capture algorithm described above are processed to obtain a pulsatile signal similar to the signal obtained by a contact-based PPG sensor. Various successful methods of doing so were proposed in the past - see [20] and references therein for examples. In this work, we decided to implement the method described in [14], [15], where the average raw RGB traces are used to extract the Hue channel in Hue Saturation Value (HSV) color space. Conversion from RGB to Hue is given by the following set of equations:
| (3) |
where , and .
The Hue signal is further processed in the steps outlined below:
Polynomial detrending – eliminates linear and non-linear trends originated from head and tablet movements, changes in lighting conditions, and other factors. For detrending, We used the Matlab “Polyfit” function with a polynomial order of 6, based on past successful implementations [11], [15], [14], [16].
Normalization – supports more convenient data interpretation and is based on a standard z-score.
Bandpass filtering – allows removing undesired frequency components which fall outside of the expected PR range. Since video durations are relatively short, we employ Infinite Impulse Response (IIR) elliptic filters to preserve HRs between 50 bpm (0.83 Hz) and 150 bpm (2.5 Hz). Elliptic filters require fewer taps and offer the sharpest transition between stopband and passband. Minimum attenuation at stopband and acceptable ripple at passband was set to 20 dB and 0.1 dB respectively. MATLAB’s filter design tool was used to obtain the desired specifications. Note that the HR is expected to be well within this range because it is measured at rest.
Moving average – helps further reduce unwanted high-frequency noise and enhances the visual appearance of the signal for improved time or frequency domain analysis. The filter length is chosen to be 5 samples.
IV. PULSE RATE DETECTION IN A NON-PARTICIPATORY ENVIRONMENT
In this work, we extracted a single PR/HR measurement from each 25 seconds measurement.
A. Pulse Rate Detection
In general, there are two approaches to extract PR. the first relies on time-domain peak detection to extract inter beat intervals. The other relies on spectral estimation to extract the underlying frequency of the beating heart. The latter is expected to provide a more accurate result since it takes averages over the entire signal per frequency. Since passive VPG is prone to noise, we adopt the latter approach to PR estimation. To this end, 1024-point Power Spectral Density (PSD) is computed using MATLAB’s periodogram function. PR is estimated by identifying the frequency of the tallest peak in the PSD.
The corresponding Zio XT Patch recording from the clinical study is used as ground truth. ECG is processed using the renowned Pan-Tompkins algorithm [31] to identify the location of QRS complexes. The reference HR is then computed as the mean values of the RR intervals from the ECG signal.
Since we are detecting PR based on signals captured in a non-participatory environment, we expect many of the the passive measurement to be corrupted by motion, changes in ambient light, etc. To ensure high accuracy of PR detection, corrupted signals need to be filtered and removed. In what follows, we apply binary classifiers as a filtering mechanism to ensure that PR is only extracted from non-corrupted data.
B. Feature Extraction and Initial Filtering
Using a training dataset, we investigated various heuristic features in the time and frequency domains for identifying good quality measurements that result in accurate PR estimation. In addition, we investigated auto-encoders for automated feature extraction. Following our analysis, the features described below were found to be efficient in doing filtering high quality recordings. Note that these features are calculated for every 25 sec recording arriving at the server:
The metrics in Tab. I are calculated for every recording arriving at the server:
TABLE I:
Feature extracted from the VPG signal.
| Features | Definition |
|---|---|
|
| |
| Peak1 | Power outside spectral peak divided by average power. |
| Peak2 | The ratio between power within the spectral peak and power outside the spectral peak. |
| Peak3 | The ratio between the first peak and the second peak. |
| Face misdetection ratio | Ratio of frames with a face in them. |
| Face motion indicator | Average motion of the ROI. |
| Average PR from PSD | Peak frequency in the PSD |
Face misdetection ratio - number of frames with a detected face divided by the total number of frames in the recording.
Face motion indicator – standard deviation of the absolute difference between the center of the First RoI and the center of the RoI detected across the frames divided by the number of pixels in RoI. In case a frame had no detected face in it, the previous frame’s RoI was used. This indicator is in fact, the average change in relative pixels between the aforementioned RoI centers. As a rough initial filter, we discarded recordings with a face misdetection ratio about 0.1, since there is no point in processing a signal from a recording where over 10% of the frames had no face in them. This is the equivalent of discarding a contact-based sensor recording if it is not touching the skin. Similarly, we discarded recordings with a face motion indication above 0.01.
The measurements that were not discarded were labeled based on 2 classes: acceptable PR estimation accuracy and unacceptable accuracy. According to the Association for the Advancement of Medical Instrumentation (AAMI) guidelines [32], a PR monitor is expected to have an estimation error that is the maximum between a 10% and a 5 BPM difference compared to an ECG HR measure. In this study, we adopted a stricter requirement by labeling a measurement as acceptable only if the PR estimation error is within 5 BPM for any value of HR.
The aforementioned two metrics were used as features for the classifiers described next. In addition, features were extracted from the spectral estimation of the processed Hue signal. The benefits of utilizing spectral features were demonstrated in [14]. A high-quality measurement is expected to result in a Hue signal with strong spectral prominence, i.e., a dominant single spectral peak across the entire frequency range in its power spectral density. Following estimation of the PSD, three spectral metrics were extracted to help quantify spectral prominence. A summary of all extracted features is provided in Tab. 1.
C. Classifiers as Quality Filters
Binary labeling of the data (acceptable/unacceptable error) allows us to train a classifier to effectively act as a filter for high-quality data. Namely, we can use the training data to train a classifier to predict an acceptable error. Thus, classifying a measurement as having an unacceptable error would allow us to discard that measurement. We expect this approach to remove measurements where a noisy signal resulting from motion and other factors generates a peak frequency in the PSD that is higher than the average underlying pulse.
In what follows, we use this approach to train and validate classical machine learning (ML) classifiers as well as deep learning classifiers with the purpose of automatically identifying measurements that are expected to result in an acceptable PR estimation error compared to ECG. For all methods and classifiers we followed a subject-independent approach.
The dataset was divided into two sets of 80% (2373 samples with 41% acceptable and 59% unacceptable measurements) for training and 20% (594 samples with 43% acceptable and 57% unacceptable measurements) for testing. The test dataset was never used during training. Specifically, we explored the use of Support Vector Machine (SVM), Random Forest (RF), Gradient Boosting Tree (XGBoost), and Quadratic Discriminant Analysis (QDA) [33]. In addition, we explored the use of a Convolution Neural Network (CNN) classifier, where the processed Hue signal was directly used to train the CNN. The potential benefit of a CNN classifier trained by the Hue signal is that performance is not constrained by specific hand-crafted features.
The SVM, RF, and QDA classifiers were trained using the Scikit learning library [34]. In order to find the best hyperparameter grid search with 5-fold cross validation was used. The scoring function for the grid search was selected to optimize the area under the curve. After hyperparameter tuning, the classifier has the following parameters as shown in Tab. II. For the CNN network, the “relu” activation function was used for an intermediate layer and “softmax” was used at the last layer. During the training phase, “adam” optimizer with “squared hinge” and 100 epochs with batch size = 16 were used.
TABLE II:
ML models hyperparameter that learned after training.
| ML Models | Parameters |
|---|---|
| SVM | C=10, probability=True, tol=0.01 |
| RF | max_depth=6, maxj features=5, n_estimators=112, oob_score=True |
| QDA | None |
| CNN | Conv1D(128, 3) => BatchNorm() => Conv1D(128, 3) => MaxPool1D(2) => BatchNorm() => Conv1D(64, 5) => MaxPool1D(2) => BatchNorm() => Dropout(0.2) => Conv1D(32, 5) => MaxPool1D(2) => BatchNorm() => Dropout(0.2) => Flatten() => Dense(128) => Dropout(0.2) => Dense(16) => Dropout(0.2) => Dense(2) |
| BTC | threshold = 0.72 |
For the aforementioned classifiers, filtering based on spectral prominence was performed by comparing their respective probabilistic output for acceptable error to a predefined threshold. Namely, if the output is below the threshold, the measurement is discarded as unacceptable.
To provide a simple traditional approach to compare performance with, we also defined a Binary Threshold Classifier (BTC), where Peak1 was directly compared against a threshold. Namely, if Peak1 is above a predefined value (implying low spectral prominence) the measurement is discarded as unacceptable.
To evaluate and compare the performance of the different classifiers, the False Positive Rate (FPR) and the True Positive Rate (TPR) were evaluated in a Receiver Operating Characteristic (ROC) curve. Namely, for each classifier, the threshold was scanned from 0 to 1 and the FPR and TPR pair was computed per threshold
In addition, we evaluate the classifiers with respect to False Discovery Rate (FDR) and Yield. The FDR is a more robust procedure for controlling incorrect classification. We used FDR to set the desired threshold for ML algorithms. The ROC curve allows us to compare the accuracy of the multiple classifiers, however, it does not tell too much about the yield. Since we use the classifier as a filter, it is crucial to know the amount of the measurement that passes the filter (yield). As a result, we use both FDR and yield together to find the best ML algorithm that satisfies FDR rate and yield.
V. RESULTS
Fig. 3 displays a histogram of the number of recordings per hour across all subjects. We can see that there is uniform coverage across most of the day between 8:00 AM and 9:00 PM, as expected people are asleep at night. In addition, there is a dip in usability during 12:00 to 1:00 PM and 6:00 to 7:00 PM, this could be explained by lunchtime and dinner time respectively.
Fig. 3:

Histogram of the number of recordings per hour of the day across all subjects.
Fig. 4 displays a histogram of the number of recordings per HR as measured by the ECG across all subjects. We find that our ground truth measurement spans the range of [40,120] BPM non-sparingly with over 50 measurements per HR within [55,95] BPM.
Fig. 4:

Histogram of HR measured by ECG across all subjects.
Fig. 5 shows the histogram of the number of recordings per subject during the experiment. As shown in the histogram, some of the subjects (i.e., 33, 41, 68) have few background recordings (samples). On the contrary, some of the other subjects (i.e., 31, 53, 99) have many recordings. This situation causes an imbalance in the dataset. During the training phase, some of the subject’s data may dominate the classification and create bias. To handle this imbalance, two different approaches were investigated: under-sampling and oversampling [35].
Fig. 5:

Histogram of the number of recordings per subject. The threshold is used for under and oversampling methods.
Under-sampling is a method that randomly reduces the number of samples of a subject that has a larger sample size in the dataset. In this case, a fixed number of sample was randomly selected from the subjects whose number of samples exceeded the selected threshold. This threshold is crucial since we want to minimize data loss. We tested two thresholds of 100 and 150 samples. We observed that results did not change significantly when applying these under-sampling thresholds.
Over-sampling is a method that increases the number of samples that belong to a subject by randomly repeating with replacement. For example, using an over-sampling threshold of 150, Subject 33’s data is randomly replicated from 7 to 150 samples. Subjects who do not have any recordings were not over-sampled. We tested two over-sampling thresholds of 150 and 100. After oversampling, the algorithms were re-trained with the new datasets. Similar to under-sampling, results did not change significantly. Ultimately, we did not apply over or under sampling.
Fig. 6 presents examples of a high-quality signal and a low-quality signal capture along with the corresponding synchronized ECG signal. As shown in Fig. 6a, the VPG and ECG signals are accurately synchronized and their peaks align well. Thus, the calculation of the PR is expected to match the reference HR extracted from the ECG signal. The second panel in 6a shows spectrum of processed Hue signal. The PSD exhibits a dominant spectral peak as expected when considering the periodicity of a pulsating heart. Fig. 6b depicts an example where the VPG signal’s quality is low due to motion and/or poor ambient lighting conditions. In this case, we expect PR estimation to fail. As shown in the second panel in 6b there are two equivalent peaks in PSD, making it difficult to determine the true underlying periodicity of the pulsating heart and accurately estimate the PR. The classifiers are designed and trained to automatically identify and discard low-quality signals that are expected to result in an inaccurate PR estimation.
Fig. 6:

Examples of a VPG signal passively captured in the background with the synchronized ECG signal. (a) High-quality signal and its PSD response (b) Low-quality signal and its PSD.
Fig. 7 presents the ROC curve of SVM, RF, XGBoost, QDA, CNN, and BTC classifiers, where the x-axis is the FPR and the y-axis is the TPR. Note that CNN provides the poorest performance since its ROC curve is below all others. The BTC classifier provides better performance than CNN despite its simplicity. The best performing classifiers are SVM, RF, and XGBoost offers similar performance. A binary classifier can be set to operate at a predetermined FPR, to make sure that only a few HR measurements have an expected estimation error higher than 10%. For example, setting an FPR of 0.1 would result in an average of one such measurement out of 10. Assuming this FPR, a TPR of 0.54 and 0.47 are obtained for XGBoost and BTC respectively. In other words, 54% of the low-error HR measurements were identified as such by the XGBoost classifier, versus only 47% for the BTC. Note that unlike classical classifiers (SVM, RF, XGBoost, BTC), CNN is trained with raw HUE signals. The model learns all the features from the raw data and predicts it [36], [37], [38]. CNN might fail due to a lack of data since it is known that Deep learning approaches are extremely data-hungry.
Fig. 7:
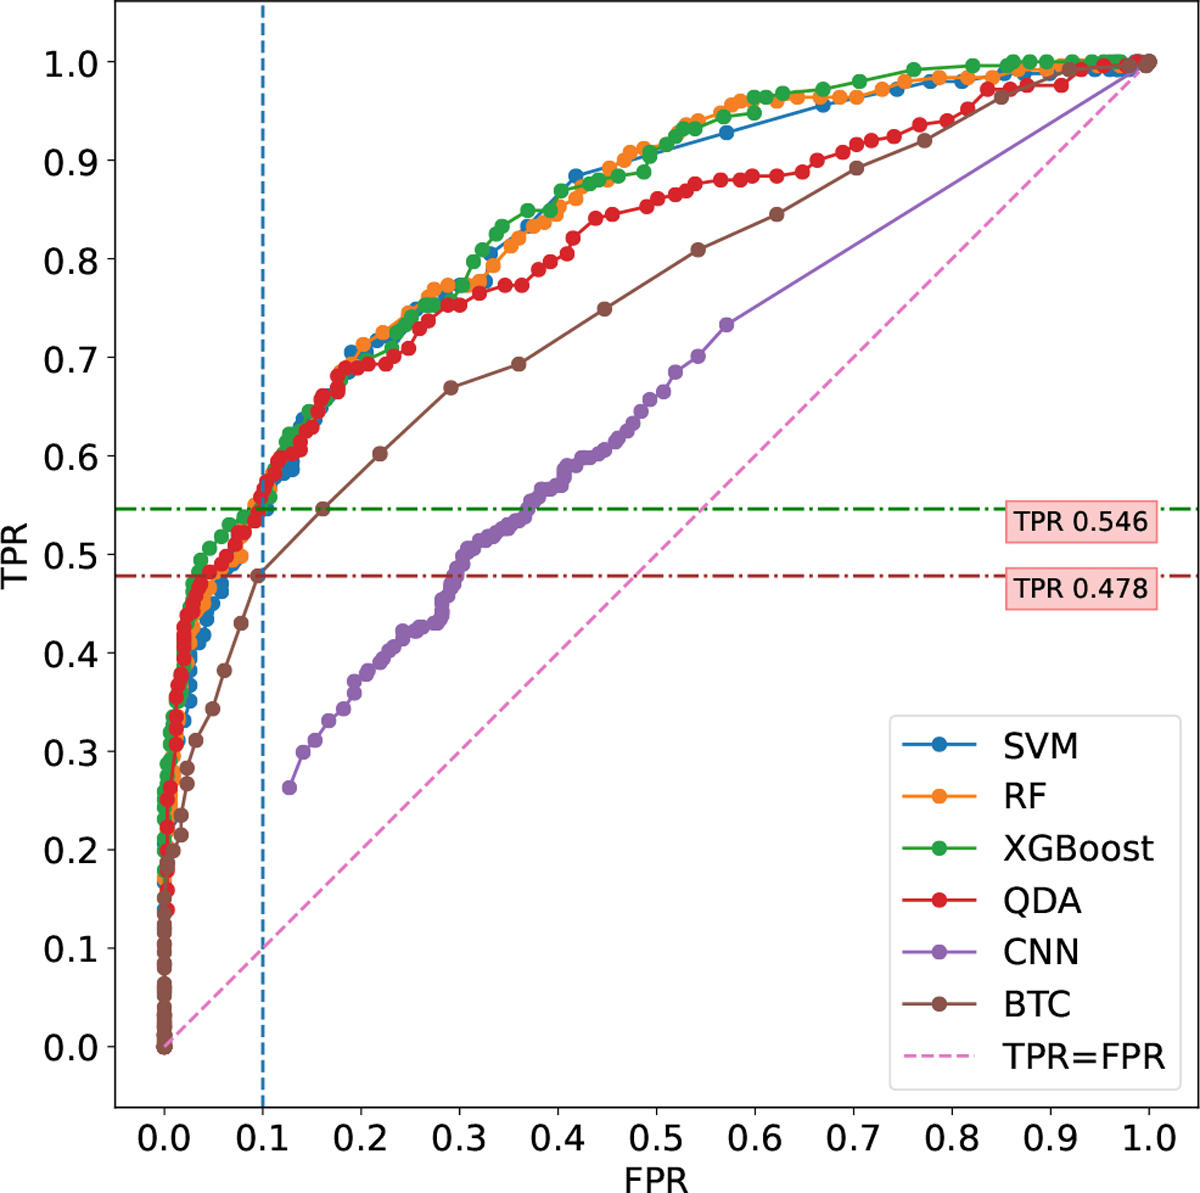
ROC plots show the performance of the SVM, RF, XGBoost, QDA, CNN, and BTC models.
Fig. 8 presents the FDR and Yield curves for the classifiers as a function of the configurable threshold, where the threshold (th) varies within [0, 1]. As th increases, the FDR and the Yield decrease from 0.58 and 1, respectively, down to 0. Note that for any value of FDR, the XGBoost, SVM and RF classifiers provide a similar and higher yield. This means that for any predefined performance level (FDR value), these classifiers would provide more data given the same screen time exposure. For example, setting an FDR of 0.1 would result in an average 10% of the measurements that are erroneously classified as an acceptable accurate measurement. For this performance level, BTC would have a yield of 0.10. This means that 10% of all measurements captured in the background would pass the filtering of the classifier. However, the XGBoost, SVM and RF classifiers would have a yield of 0.20 approximately. This means that 20% of the measurements would pass the classifier; 2 times higher than for BTC. Assuming that two measurements are taken in the background for every one minute of screen time, XGBoost, SVM and RF would provide 22 measurements per hour in total, where approximately 2 of them would have an error above 10%. On the other hand, BTC would provide only 11 such measurements per hour in total. Note that the QDA classifier performs better than BTC but not as good as XGBoost, SVM, and RF.
Fig. 8:

False Discovery Rate and Yield as a function of threshold for the classifiers.
Fig. 9 shows Bland Altman (BA) plots for the selected FDR rate of 0.1 for SVM (a), RF (b), XGBoost (c), QDA (d), and BTC (f) to assess the agreement between ECG and VPG measurements. The CNN (e) plot was generated using an FDR of 0.45 since it was the lowest available given its performance. The x-axis shows the mean of the PR and HR extracted from VPG and ECG respectively, and the y-axis shows the difference between the two measurements. The dashed red line indicates the performance level of ±5 BPM difference used for classifying high quality vs low-quality measurements. Note that this performance requirement is stricter than the AAMI guidelines for HR meters [32] that recommend a max deviation of 10% from the true HR when the true HR is higher than 50 BPM. Note that the different classifiers have varying numbers of data points in their corresponding BA plots. This is because each classifier performs a different amount of filtering, the effect of which is also expressed in the varying yields in Fig. 8
Fig. 9:

Bland-Altman plots for various classifiers and a +-5BPM error range indication. (a) SVM, (b) RF, (c) XGBoost, (d) QDA, (e) CNN, and (f) BTC.
All the classifiers perform well within the +-5BPM error range when the HR is elevated above 75 BPM except for CNN. This implies that all classifiers provide a good estimation of tachycardia. However, the performance of each classifier is reduced for lower HR. This implies that detecting bradycardia would be more challenging. This observation is agreeable with past work [6] where the same error trend was detected. Note that the measurement in the BA plot covers the entire range of 50 to 90 BPM, indicating that our validation set provides a good representation of expected HRs when subjects are stationary.
All classifiers were set to operate with an FDR of 0.1, corresponding to the same proportion of outlying measurements in the BA plots. It follows that all classifiers provide the same overall accuracy. However, the yield is clearly different across the classifiers. For example, while BTC (f) has 78 high and 11 low-quality estimations, the XGBoost classifier has 127 high and 16 low estimations. Hence, the total number of measurements provided by XGBoost is double that of BTC. This means that XGBoost provides a better filter. Note that the SVM (a) and RF (b) classifiers provide similar filtering results to XGBoost. On the other hand, the CNN (f) classifier performance is the worst since its lowest FDR rate is 0.45, resulting in many more outliers in its BA plot compared to all other classifiers. Recall, that this could be the result of not having enough training data to support the CNN approach.
VI. DISCUSSION AND LIMITATIONS
The clinical study encompassed two weeks of passive monitoring in the subject’s home. During this time we encountered many of the problems associated with long-term monitoring of subjects while relying on subject’s compliance. There were multiple cases of ECG patches coming off and subjects requesting to abort due to skin irritation. It is reasonable to expect such problems would be exacerbated over longer periods of time. From this usability perspective, our passive monitoring approach is preferable.
On the other hand, we also encountered cases where subjects did not use the tablet as much as we expected them to, resulting in less data being captured by APP. We attribute this to the fact that the tablet was a new device introduced to the subject that required some getting used to. This is especially true for subjects who haven’t used Android devices before. To improve acceptance and to fully capture the benefits of passive video monitoring, it is preferable to allow subjects to download the APP directly to their personal devices that are already in use.
Since the ECG patch used in the study was not equipped with an internet connection, we had to perform synchronization between the patch and the tablet-based synchronization events relying on the subject pressing a button on the patch following an instruction by the tablet. While we managed to achieve adequate synchronization for the purpose of estimating average PR, in future work, it would be preferable to perform synchronization based on common access to a network clock. Especially if arrhythmia is to be monitored where beat to beat activity is important.
Resting PR is an important auxiliary measure in assessing patient’s health. However, measuring true resting PR is very challenging. PR is typically measured at a healthcare facility by a trained person or by the subject at home. The problem with the former is the so-called white-coat effect, where the PR could be elevated due to the excitement and stress of being monitored. The problem with the latter is that many intermediary factors can affect PR, such as recent activity prior to measurement. The proposed passive video monitoring approach is much more likely to capture true resting PR, since people typically use a tablet while sitting down and being relaxed. In addition, since the monitoring is occurring in the background, the white-coat effect is not a concern. In future implementation, the motion of the tablet can also be monitored to ensure the subject is not active while a measurement is being taken. Note that performance can be further improved by combining video with ballistocardiographic monitoring, where the motion of the device is tracked to detect pulse.
A potential caveat of the proposed framework is the possibility of monitoring the wrong person. For example, in case a relative of the subject is using the tablet. To avoid this problem in the clinical study, we validated the subject being monitored is truly the intended subject by manually comparing a photo of the subject taken during enrollment with a single frame saved from each 25 seconds signal capture. This was done daily by a trained person. A reasonable alternative would be to make use of readily available face recognition algorithms. This approach would eliminate the need to save any identifying information. Since signal capture by the APP is performed without saving an intermediate video, complete patient privacy would be obtained.
A logical next step would be to implement the APP on the iOS platform, thereby expanding accessibility to a wider population. However, implementing persistent passive video monitoring in the background is more challenging due to restrictions placed by the iOS operating system. One possibility would be to perform passive monitoring while the subject is interacting with a custom APP embedding the proposed framework.
As mentioned, the proposed passive video monitoring framework doesn’t require a dedicated device, doesn’t require subject participation, and can be directly installed via a downloadable APP on a personal device. With the proliferation of smartphones and tablets, the proposed framework offers an easily distributed solution for remote monitoring of populations with limited access to healthcare services.
VII. CONCLUSION
In this work, we proposed, implemented, and evaluated the performance of a novel framework of passive PR monitoring using VPG. The framework enables seamless PR monitoring without requiring subject participation in the monitoring process. As long as the subject uses a personal device with a front-facing camera, PR is collected effortlessly. This allows for tracking trends in PR over long periods of time without the need to purchase, deploy and service a dedicated device such as an ECG holter and without relying on adherence of the subject. We implemented the proposed framework on the Android platform and evaluated its performance in a large clinical study involving 113 AF patients at their homes. Data collected in the clinical study was used to train and validate various classifiers designed to identify high-quality PR measurements. We found that ML classifiers are characterized by a three-fold increase in yield when compared to BTC while achieving the same FDR. Our results show that the proposed framework accurately monitors PR, thereby providing a gateway for VPG methods to play a significant role in the long-term monitoring of cardiac patients and healthy people in their homes. Future work includes expanding the proposed VPG passive monitoring framework to monitor arrhythmia as well as respiration rate.
ACKNOWLEDGMENT
This work has been supported by the USA National Institute of Health (NIH) under Research Grant NIH 5R01HL137617-04. The authors would like to thank Betty J. Mykins and John DeCamilla for their dedicated effort in subject enrollment and ECG annotation.
Biographies

Celal Savur is a Ph.D. candidate in the Electrical and Microelectronic Engineering Department at Rochester Institute of Technology (RIT). He received his B.S. in Computer Engineering from the Harran University in Turkey in 2010. In 2012, he was awarded a scholarship from the Turkish Government to pursue his master’s degree. He received his M.S in Electrical Engineering in the field of Control and Robotics from RIT. His research interests are Physiological Computing, Human-Robot Collaboration, Machine Learning, and Deep Learning.

Ruslan Dautov received the M.Sc. degree in Electrical Engineering and the Ph.D. degree in Computing and Information Sciences from Rochester Institute of Technology, Rochester, NY in 2011 and 2019, respectively. Since then he has been an R&D engineer with the Diabetes Operating Unit at Medtronic Inc, Northridge, CA, where he works on the development and implementation of advanced insulin delivery algorithms. His current research interests include biomedical signal processing, machine learning methods and wireless security.

Kamil Bukum is a M.Sc. student in the Electrical and Microelectronic Engineering Department at Rochester Institute of Technology (RIT). He received his B.S. in Computer Engineering from the Harran University in Turkey in 2010. He is a senior software developer. Currently, he is working on NIH funded project. His thesis topic is about the detection of atrial fibrillation estimation from a camera.

Xiaojuan Xia received the M.S. (1996) in Biophysics and Ph.D. (2016) in Electrical Engineering from University of Rochester. Since 2001, she has been working as a biomedical engineer at Clinical Cardiovascular Research Center at University of Rochester. Her research involves ECG signal processing and analysis that facilitate clinical research.

Jean-Philippe Couderc is a Professor of Medicine at the University of Rochester Medical Center (Rochester, NY), and a Professor of Electrical & Computer Engineering at the Hajim School of Engineering and Applied Sciences (Rochester, NY). He is a scientist and an entrepreneur with experience in the development of groundbreaking technologies with multiple examples of successful commercialization in the field of cardiac safety. Internationally recognized authority in the development of computerized technologies related to cardiology. Founder and Director of the Telemetric and Holter ECG warehouse, an initiative developed with the US FDA under a private-public partnership and funded by the National Institute of Health. Characterized by a creative mind leading to translational scientific discoveries, his work has been highlighted by major media including the Wall Street Journal.

Gill R Tsouri Gill R. Tsouri is a Professor of Electrical Engineering at the Kate Gleason College of Engineering - Rochester Institute of Technology (Rochester, NY). He is the Founder and Director of the Communications Research Laboratory, where he is leading research in the areas of biomedical signal processing, wireless body area networks, and wireless physical layer security. Outcomes from his research have been successfully commercialized by industrial partners.
Contributor Information
Celal Savur, Department of Electrical and Microelectronic Engineering, Rochester Institute of Technology, Rochester, NY, 14623 USA.
Ruslan Dautov, Department of Electrical and Microelectronic Engineering, Rochester Institute of Technology, Rochester, NY, 14623 USA.
Kamil Bukum, Department of Electrical and Microelectronic Engineering, Rochester Institute of Technology, Rochester, NY, 14623 USA.
Xiaojuan Xia, Department of Medicine, Clinical Cardiovascular Research Center at University of Rochester (NY), Rochester, NY 14620, USA.
Jean-Philippe Couderc, Department of Medicine, Clinical Cardiovascular Research Center at University of Rochester (NY), Rochester, NY 14620, USA.
Gill R. Tsouri, Department of Electrical and Microelectronic Engineering, Rochester Institute of Technology, Rochester, NY, 14623 USA
REFERENCES
- [1].Dai H, Zhang Q, Much AA, Maor E, Segev A, Beinart R, Adawi S, Lu Y, Bragazzi NL, and Wu J, “Global, regional, and national prevalence, incidence, mortality, and risk factors for atrial fibrillation, 1990–2017: results from the Global Burden of Disease Study 2017,” European Heart Journal - Quality of Care and Clinical Outcomes, vol. 7, no. 6, pp. 574–582, oct 2021. [DOI] [PMC free article] [PubMed] [Google Scholar]
- [2].Go AS, Hylek EM, Phillips KA, Chang Y, Henault LE, Selby JV, and Singer DE, “Prevalence of Diagnosed Atrial Fibrillation in Adults,” JAMA, vol. 285, no. 18, p. 2370, may 2001. [DOI] [PubMed] [Google Scholar]
- [3].Zoni-Berisso M, Lercari F, Carazza T, and Domenicucci S, “Epidemiology of atrial fibrillation: European perspective,” Clinical Epidemiology, p. 213, jun 2014. [DOI] [PMC free article] [PubMed] [Google Scholar]
- [4].Aronow WS and Banach M, “Atrial fibrillation: The new epidemic of the ageing world,” Journal of Atrial Fibrillation, vol. 1, no. 6, pp. 337–361, 2009. [DOI] [PMC free article] [PubMed] [Google Scholar]
- [5].Chugh SS, Roth GA, Gillum RF, and Mensah GA, “Global Burden of Atrial Fibrillation in Developed and Developing Nations,” Global Heart, vol. 9, no. 1, p. 113, mar 2014. [DOI] [PubMed] [Google Scholar]
- [6].Association AH, “All About Heart Rate,” 2015. [Online]. Available: https://tinyurl.com/y3x99e4a [Google Scholar]
- [7].Jensen MT, Suadicani P, Hein HO, and Gyntelberg F, “Elevated resting heart rate, physical fitness and all-cause mortality: A 16-year follow-up in the Copenhagen Male Study,” Heart, vol. 99, no. 12, pp. 882–887, 2013. [DOI] [PMC free article] [PubMed] [Google Scholar]
- [8].Ghamari M, “A review on wearable photoplethysmography sensors and their potential future applications in health care,” International Journal of Biosensors and Bioelectronics, vol. 4, no. 4, pp. 100–106, 2018. [DOI] [PMC free article] [PubMed] [Google Scholar]
- [9].Lee Y, Park JY, Choi YW, Park HK, Cho SH, Cho SH, and Lim YH, “A Novel Non-contact Heart Rate Monitor Using Impulse-Radio Ultra-Wideband (IR-UWB) Radar Technology,” Scientific Reports, vol. 8, no. 1, pp. 1–10, 2018. [DOI] [PMC free article] [PubMed] [Google Scholar]
- [10].Barbosa Pereira C, Czaplik M, Blazek V, Leonhardt S, and Teichmann D, “Monitoring of Cardiorespiratory Signals Using Thermal Imaging: A Pilot Study on Healthy Human Subjects,” Sensors, vol. 18, no. 5, p. 1541, may 2018. [DOI] [PMC free article] [PubMed] [Google Scholar]
- [11].Tsouri GR, Kyal S, Dianat S, and Mestha LK, “Constrained independent component analysis approach to nonobtrusive pulse rate measurements,” Journal of Biomedical Optics, vol. 17, no. 7, p. 0770111, jul 2012. [DOI] [PubMed] [Google Scholar]
- [12].Balakrishnan G, Durand F, and Guttag J, “Detecting Pulse from Head Motions in Video,” in 2013 IEEE Conference on Computer Vision and Pattern Recognition. IEEE, jun 2013, pp. 3430–3437. [Google Scholar]
- [13].Rouast PV, Adam MTP, Chiong R, Cornforth D, and Lux E, “Remote heart rate measurement using low-cost RGB face video: a technical literature review,” Frontiers of Computer Science, vol. 12, no. 5, pp. 858–872, 2018. [Google Scholar]
- [14].Tsouri GR and Li Z, “On the benefits of alternative color spaces for noncontact heart rate measurements using standard red-green-blue cameras,” Journal of Biomedical Optics, vol. 20, no. 4, p. 048002, apr 2015. [DOI] [PubMed] [Google Scholar]
- [15].Guzman JH, Couderc J-P, and Tsouri GR, “Accurate Hemodynamic Sensing using Video Plethysmography with High Quality Cameras,” in 2019 13th International Symposium on Medical Information and Communication Technology (ISMICT), vol. 2019-May. IEEE, may 2019, pp. 1–6. [Google Scholar]
- [16].Dautov R, Savur C, and Tsouri G, “On the Effect of Face Detection on Heart Rate Estimation in Videoplethysmography,” in 2018 IEEE Western New York Image and Signal Processing Workshop (WNYISPW). IEEE, oct 2018, pp. 1–5. [Google Scholar]
- [17].Verkruysse W, Svaasand LO, and Nelson JS, “Remote plethysmographic imaging using ambient light,” Optics Express, vol. 16, no. 26, p. 21434, dec 2008. [DOI] [PMC free article] [PubMed] [Google Scholar]
- [18].Benedetto S, Caldato C, Greenwood DC, Bartoli N, Pensabene V, and Actis P, “Remote heart rate monitoring - Assessment of the Facereader rPPg by Noldus,” PLOS ONE, vol. 14, no. 11, p. e0225592, nov 2019. [DOI] [PMC free article] [PubMed] [Google Scholar]
- [19].Trumpp A, Lohr J, Wedekind D, Schmidt M, Burghardt M, Heller AR, Malberg H, and Zaunseder S, “Camera-based photoplethysmography in an intraoperative setting,” BioMedical Engineering OnLine, vol. 17, no. 1, p. 33, dec 2018. [DOI] [PMC free article] [PubMed] [Google Scholar]
- [20].de Haan G and Jeanne V, “Robust Pulse Rate From Chrominance-Based rPPG,” IEEE Transactions on Biomedical Engineering, vol. 60, no. 10, pp. 2878–2886, oct 2013. [DOI] [PubMed] [Google Scholar]
- [21].Papon MTI, Ahmad I, Saquib N, and Rahman A, “Non-invasive heart rate measuring smartphone applications using on-board cameras: A short survey,” Proceedings of 2015 International Conference on Networking Systems and Security, NSysS 2015, 2015. [Google Scholar]
- [22].Rouast PV, Adam MT, Chiong R, Cornforth D, and Lux E, “Remote heart rate measurement using low-cost RGB face video: a technical literature review,” Frontiers of Computer Science, vol. 12, no. 5, pp. 858–872, 2018. [Google Scholar]
- [23].Deng Y and Kumar A, “Standoff heart rate estimation from video – a review,” in Mobile Multimedia/Image Processing, Security, and Applications 2020, Agaian SS, DelMarco SP, and Asari VK, Eds., no. April. SPIE, apr 2020, p. 6. [Google Scholar]
- [24].Huynh S, Balan RK, Ko JG, and Lee Y, “VitaMon: Measuring heart rate variability using smartphone front camera,” SenSys 2019 - Proceedings of the 17th Conference on Embedded Networked Sensor Systems, pp. 1–14, 2019. [Google Scholar]
- [25].Molinaro N, Schena E, Silvestri S, Bonotti F, Aguzzi D, Viola E, Buccolini F, and Massaroni C, “Contactless Vital Signs Monitoring From Videos Recorded With Digital Cameras: An Overview,” Frontiers in Physiology, vol. 13, no. February, 2022. [DOI] [PMC free article] [PubMed] [Google Scholar]
- [26].Vermeulen J, Neyens J, Spreeuwenberg, van Rossum E, Sipers Habets, Hewson D, and de Witte, “User-centered development and testing of a monitoring system that provides feedback regarding physical functioning to elderly people,” Patient Preference and Adherence, vol. 7, p. 843, aug 2013. [DOI] [PMC free article] [PubMed] [Google Scholar]
- [27].IRhythm Technologies, “ECG Holter Specification,” 2020. [Online]. Available: https://investors.irhythmtech.com/sec-filings/sec-filing/10-k/0001388658-20-000034
- [28].U. D. o. H. Services and Human, “HIPAA,” 2003. [Online]. Available: https://www.hhs.gov/hipaa/for-professionals/index.html
- [29].Schroff F, Kalenichenko D, and Philbin J, “FaceNet: A unified embedding for face recognition and clustering,” Proceedings of the IEEE Computer Society Conference on Computer Vision and Pattern Recognition, vol. 07–12-June, pp. 815–823, 2015. [Google Scholar]
- [30].Gary B, “The OpenCV Library,” Dr. Dobb’s Journal of Software Tools, vol. 25, no. 2236121, pp. 120–123, 2008. [Google Scholar]
- [31].Pan J and Tompkins WJ, “A Real-Time QRS Detection Algorithm,” IEEE Transactions on Biomedical Engineering, vol. BME-32, no. 3, pp. 230–236, mar 1985. [DOI] [PubMed] [Google Scholar]
- [32].Standard AN, “American National Standard,” SMPTE Journal, vol. 95, no. 5, pp. 601–602, may 1986. [Google Scholar]
- [33].Ethem A, Introduction to Machine Learning, 3rd ed. MIT, 2014. [Google Scholar]
- [34].Pedregosa F, Varoquaux G, Gramfort A, Michel V, Thirion B, Grisel O, Blondel M, Müller A, Nothman J, Louppe G, Prettenhofer P, Weiss R, Dubourg V, Vanderplas J, Passos A, Cournapeau D, Brucher M, Perrot M, and Duchesnay É, “Scikit-learn: Machine Learning in Python,” Journal of Machine Learning Research, vol. 12, pp. 2825–2830, jan 2012. [Google Scholar]
- [35].Fernández A, García S, Galar M, and Prati RC, Learning from Imbalanced Data Sets (2018, Springer International Publishing).pdf, 2019.
- [36].Rajpurkar P, Hannun AY, Haghpanahi M, Bourn C, and Ng AY, “Cardiologist-Level Arrhythmia Detection with Convolutional Neural Networks,” arXiv, jul 2017. [Google Scholar]
- [37].Ribeiro AH, Ribeiro MH, Paixão GMM, Oliveira DM, Gomes PR, Canazart JA, Ferreira MPS, Andersson CR, Macfarlane PW, Meira W, Schön TB, and Ribeiro ALP, “Automatic diagnosis of the 12-lead ECG using a deep neural network,” Nature Communications, vol. 11, no. 1, p. 1760, dec 2020. [DOI] [PMC free article] [PubMed] [Google Scholar]
- [38].Tran L, Li Y, Nocera L, Shahabi C, and Xiong L, “MultiFusionNet: Atrial Fibrillation Detection With Deep Neural Networks.” AMIA Joint Summits on Translational Science proceedings. AMIA Joint Summits on Translational Science, vol. 2020, pp. 654–663, 2020. [PMC free article] [PubMed] [Google Scholar]