

Abstract
Pancreatic ductal adenocarcinoma (PDAC) presents with condensed stroma that contributes to its high invasive capability. Although metformin adjuvant treatment has been suggested to improve the survival times of patients with PDAC, the mechanism responsible for that benefit has been investigated only in two-dimensional cell lines. We assessed the anti-cancer effect of metformin in a three-dimensional (3D) co-culture model to quantify the migration behavior of patient-derived PDAC organoids and primary pancreatic stellate cells (PSCs). At a concentration of 10 μM, metformin reduced the migratory ability of the PSCs by downregulating the expression of matrix metalloproteinase-2 (MMP2). In the 3D direct co-cultivation of PDAC organoids and PSCs, metformin attenuated the transcription of cancer stemness-related genes. The reduced stromal migratory ability of PSCs was associated with the downregulation of MMP2, and MMP2 knockdown in PSCs reproduced their attenuated migratory ability. The anti-migration effect of a clinically relevant concentration of metformin was demonstrable in a 3D indirect co-culture model of PDAC consisting of patient-derived PDAC organoids and primary human PSCs. The metformin suppressed PSC migration via MMP2 downregulation and attenuated cancer stemness factors. Furthermore, oral administration of metformin (30 mg/kg) strikingly suppressed the growth of PDAC organoids xenograft in immunosuppressed mice. These results indicate metformin could offer the potential approach as an effective therapeutic drug for PDAC.
Keywords: Pancreatic cancer, organoids, pancreatic stellate cells, metformin, 3D co-culture model
Introduction
Early detection of pancreatic ductal adenocarcinoma (PDAC) has not been feasible due to its rapid progression and early metastasis to distant organs while in the asymptomatic phase. Because of the small proportion of patients eligible for curative surgery and strong resistance to current chemotherapeutic regimens, PDAC ranks among the worst solid malignancies in terms of outcomes and survival time [1]. Identifying more effective methods to decrease its migration and invasive ability is essential to improving the prognosis of PDAC patients.
One of the main characteristics of PDAC responsible for its poor prognosis is desmoplasia, in the form of dense stroma with excessive extracellular matrix (ECM). Abundant ECM is associated with PDAC’s strong resistance to chemotherapy [2] and invasive ability [3,4]. In the ECM, matrix metalloproteinases (MMPs) are secreted by pancreatic stellate cells (PSCs) and cancer cells [3]. Among the several subtypes of MMPs, MMP2 is primarily related to the promotion of cell growth and invasion [3,4].
Recent studies have revealed that metformin, a first-line anti-diabetes medication with an excellent safety profile, could play a role in reducing the number of cancer stem cells (CSCs) and the migration ability of various cancer cells. For example, in pancreatic [5], breast [6], and ovarian cancers [7] and melanoma [8], metformin has been shown to inhibit and suppress tumor states, both in vitro and in vivo. Several meta-analyses have concluded that the risk of patients taking metformin to treat diabetes was lower than the average risk of developing cancers such as lung cancer [9], colorectal cancer [10], and PDAC [11,12]. Meta-analyses have also revealed a significant association between metformin adjuvant treatment and a survival benefit, particularly for those with a resection or local invasion [12,13]. Given its safety profile and low cost, metformin adjuvant treatment could be an attractive option for improving the prognosis of PDAC. However, investigations of the mechanism responsible for its benefit have been largely limited to cell lines [14,15], which fail to reproduce the pancreatic tumor microenvironment.
Tumor microenvironments include not only the tumor core itself but also stromal cells, macrophages, blood vessels, fibroblasts, the ECM, and immune cells. Those factors tend to interact tightly and boost tumorigenesis [16,17]. In the pancreas, PSCs are the central cells facilitating desmoplastic reactions in the tumor microenvironment. Previous studies have reported that PSCs modulation can offer therapeutic improvements in PDAC [18,19]. We therefore approached PSCs, which have abundant stroma that contributes to chemoresistance and high invasive capacity, as an important therapeutic target in PDAC.
In this study, we set out to determine whether the anti-cancer effect of metformin at a clinically relevant concentration would be demonstrable in a three-dimensional (3D) co-culture model of PDAC made from patient-derived PDAC organoids and primary human PSCs obtained from post-surgical tissues. We used this model to investigate whether the key mechanism of the anti-migration effect of metformin on PSCs is MMP2 downregulation. Finally, we investigated whether oral administration of metformin (30 mg/kg) could inhibit the growth of PDAC organoid xenograft in immunosuppressed mice.
Materials and methods
Human pancreatic cancer tissue samples
Human pancreatic cancer tissue samples were obtained from Samsung Medical Center. This study was approved by the Samsung Medical Center Institutional Review Board (IRB) and conducted according to the protocols of the Helsinki Declaration. The IRB file number is SMC-2018-08-148. All tissue samples were obtained with informed consent. Pancreatic cancer tissues were obtained from PDAC patients who underwent surgical resections for pylorus preserving pancreatoduodectomy but did not undergo neoadjuvant chemotherapy. The clinical characteristics of the included patients are listed in Supplementary Table 1.
PDAC organoid generation and maintenance
The obtained tissues were minced to produce adult stem cells within duct clusters, following a method described previously [20]. Tissues were washed thoroughly with ice-cold Dulbecco’s phosphate-buffered saline (DPBS) containing 1% penicillin/streptomycin to remove adipose tissue and blood vessels. After several washing procedures, the tissues were digested in 5 mg/mL collagenase II (gibco) and TrypLE (gibco) at 37°C for up to 1 h to detach duct clusters. The isolated duct clusters were embedded in Growth Factor Reduced (GFR) Matrigel (Corning) at a ratio of 1:1 and cultured with organoid growth medium (OGM) containing B-27 serum-free supplement (Invitrogen, Carlsbad, CA, USA), N-2 supplement (Invitrogen), 50 ng/mL animal-free recombinant murine epidermal growth factor (PeproTech, Inc., NJ, USA), 10 ng/mL recombinant human Noggin (PeproTech), 50 ng/mL fibroblast growth factor 10 (PeproTech), 0.5 μM A83-01 (Tocris Bioscience, Bristol, UK), 10 mM nicotinamide (Sigma-Aldrich, Louis, MO, USA), R-spondin-1 conditioned medium (Trivigen, MD, USA), 50% Wnt-3a conditioned medium (ATCC) in advanced Dulbecco’s modified Eagle medium (DMEM; Thermo Fisher Scientific, MA, USA) supplemented with GlutaMAX (Thermo Fisher Scientific), HEPES buffer (Thermo Fisher Scientific), penicillin-streptomycin solution (Thermo Fisher Scientific), N-acetyl-L-cysteine (Sigma-Aldrich) and 10 μM Y-27632. The medium was refreshed every 3 days omitting Y-27632. Organoids were routinely passaged by dissociation with TrypLE for 5 min at 37°C. Metformin (STEMCELL Technologies, Vancouver, British Columbia, Canada) was dissolved in phosphate-buffered saline (PBS) as a stock solution, and working dilutions were prepared in culture medium. Recombinant TGF-β1 (PeproTech) was dissolved in 0.1% bovine serum albumin (BSA) diluted in PBS as a stock solution.
Isolation and cultivation of human pancreatic stellate cells
PSCs and PDAC organoids were isolated from 7 PDAC patients with different stages of regional lymph node involvement (N stages 0 to 2). The post-surgical PDAC tissues were washed in DPBS. The tissues then were minced into 2 mm pieces and digested for 10 minutes at 37°C in Hank’s balanced salt solution containing collagenase and 12.5% FBS. Dissociated cells were cultured in DMEM supplemented with 10% fetal bovine serum (FBS), 100 µg/mL kanamycin, and 100 mg/dl glucose at 37°C with 5% CO2 supply. The cells from passage number 4-5 were used for all experiments.
Immunofluorescence
The culture medium was removed, and the PDAC organoids and PSCs were washed three times with DPBS. Fixation was carried out with 4% paraformaldehyde at room temperature. Permeabilization was performed with 0.1% Tween-20 and 0.2% Triton-X100 in DPBS. To reduce non-specific binding, blocking was performed with 5% BSA in DPBS. Samples were covered with primary antibodies at 4°C overnight. The next day, the samples were incubated with secondary antibodies at room temperature for 2 h. Primary and secondary antibodies used for the staining were anti-collagen I (Abcam, Cambridge, UK), anti-laminin (Abcam), Ki67 (Santa Cruz Biotechnology, Dallas, Texas, USA), LGR5 (Abgent, San Diego, CA, USA), desmin (Invitrogen), vimentin (Abcam), β-catenin (Abcam), lysozyme (Diagnostic Biosystems, Fremont, CA, USA), α-SMA (Abcam), ZO-1 (Abcam), E-cadherin (Cell Signaling, Danvers, MA, USA), anti-cytokeratin 7 (Abcam), anti-cytokeratin 19 (Abcam), CA19-9 (Invitrogen), Alexa Fluor 488-conjugated anti-rabbit immunoglobin G (IgG; Life Technologies, Gaithersburg, MD, USA), and Alexa Fluor 594-conjugated anti-mouse IgG (Life Technologies). In order to ensure nuclear staining, samples were mounted with Mounting Medium with 4’,6-diamidino-2-phenylindole (DAPI) (Vector Laboratories). Pictures were taken by using Laser Scanning Confocal (ZEISS).
Quantitative reverse transcriptase polymerase chain reaction
The PDAC organoids and PSCs were treated with TRizol (Invitrogen) and chloroform (Sigma-Aldrich), and the colorless upper supernatant was collected after centrifugation at 12,000 × g for 15 min at 4°C. Isopropyl alcohol was then added to induce RNA precipitation. After centrifugation, the RNA pellets were washed with 75% ethanol and dried at room temperature until all leftover ethanol had evaporated. The air-dried RNA pellets were dissolved in diethyl pyrocarbonate-treated water for elution. cDNA was then synthesized using PrimeScript RT Master Mix (Takara, Kusatsu, Shiga, Japan). qRT-PCR amplification was performed by adding cDNA to TB Green Premix Ex Taq (Tli RNaseH Plus, Takara). The level of mRNA expression was measured using a QuantStudio 6 Flex Real-Time PCR system (Applied Biosystems, Waltham, Massachusetts, USA). The primer pairs used for qRT-PCR analysis are listed in Supplementary Table 2.
Migration assays
PSC migration assay was performed using a Radius Cell Migration Assay kit (Cell Biolabs, San Diego, CA, USA). The cell migration procedures followed the manufacturer’s guidelines. Briefly, when 1 × 10⁴ cells were seeded in the well, the PSCs attached everywhere except on the RadiousTM gel overnight. After removal of RadiusTM Gel, cells migrated into the cell-free zone for 48 h, as revealed by microscope observations. To confirm that PSCs have their migratory capacity in the presence of ECM component, we used a 3D indirect co-culture model with PDAC organoids and PSCs. The PSCs were seeded at the upper insert coated with Matrigel diluted with serum-free medium, and the PDAC organoids were seeded at the bottom, embedded with OGM in Matrigel. After 48 h, the migrated PSCs were stained with crystal violet dye, and the assay was analyzed. Each experiment was repeated at least three times.
Cell proliferation assay
Cell Counting Kit-8 (CCK-8) was used to analyze cell proliferation. Buffer was added at 1/10th the total medium volume and analyzed after 4 h. Data were measured with a 450-490 nm filter and a microplate reader.
Western blot analysis
The expression of MMP2, CD10, CD24, CD44, CD133, EpCAM, LGR5, p-Smad2/3, AMPK, and α-SMA was evaluated after metformin treatment in PSCs. For AMPK inhibition experiments, the AMPK inhibitor Compound C (Calbiochem, San Diego, CA, USA) was treated at a concentration of 5 μM for 48 h in PSCs. The prepared cells were lysed using PRO-PREP Protein Extraction Solution (iNtRON Biotechnology, Gyeonggi, Korea). After protein extraction, 10% sodium dodecyl sulfate polyacrylamide gel electrophoresis (SDS-PAGE) and a nitrocellulose membrane (Bio-Rad, Hercules, CA, USA) were used for the experiment. Blocking was done with 5% skim milk, and the membrane was incubated overnight at 4°C with anti-MMP2 (Abcam), anti-CD10 (Abcam), CD24 (Abcam), CD44 (Santa Cruz), CD133 (Abcam), EpCAM (Cell Signaling), LGR5 (Abgent), anti-p-Smad2/3 (Cell Signaling), anti-Smad2/3 (Cell Signaling), anti-α-SMA (Cell Signaling), MMP2 (Sigma-Aldrich) and anti-β-actin (Sigma) antibodies. The next day, the membrane was probed with secondary antibodies conjugated to horseradish peroxidase for 2 h at room temperature. After washing, membranes were detected by enhanced chemiluminescence solution in the dark room.
Transfection with siRNA and MMP2 stimulation
To knock down MMP2 expression, MMP2-targeted siRNA was used. The siRNA for MMP2 (AccuTarget™ genome-wide predesigned siRNA No. 4313-3) and the negative control siRNA (AccuTarget™ Negative Control siRNA No. SN-1002) were purchased from Bioneer (Daejeon, Korea). Transfection was performed with Lipofectamine 3000 (Invitrogen, Carlsbad, CA) based on OptiMEM (Gibco, Carlsbad, CA, USA) according to the manufacturer’s instructions. The PSCs were used for further experiments 24~96 h after transfection. To stimulate MMP2 expression in PSCs, recombinant human MMP2 was purchased from Sigma (MO, USA).
Measurement of secreted TGF-β with ELISA
To detect TGF-β secretion from PSCs, PDAC organoids, and co-cultivation with PSCs and PDAC organoids, they were cultured with serum-free DMEM/F12 for 48 h, and the supernatant was collected and filtered to remove cell debris. The procedures for measurement of TGF-β followed the manufacturer’s guidelines. Briefly, the samples were incubated with 1N hydrochloric (HCL) and 1.2N NaOH/0.5M HEPES for 10 minutes to activate TGF-β. Then enzyme-linked immunosorbent assay (R&D Systems, Minneapolis, MN, USA) was performed after the activation of TGF-β in each sample. Samples were measured with a 450-490 nm filter and a microplate reader.
Analysis of MMP-2 activity by gelatin zymography
The gelatinase activity of MMP2 in human PSCs was examined by gelatin zymography. The culture medium was concentrated using an Amicon Ultra-15 Centrifugal Filter Unit (Merck, Kenilworth, NJ, USA), and the protein concentration was measured by Bradford assay. Conditioned medium from untreated and metformin-treated human PSCs for 48 h was separated by electrophoresis in 10% Zymogram Plus (Gelatin) Protein Gels (1.0 mm) (Invitrogen). After electrophoresis, the gels were incubated for 30 min at room temperature in Zymogram renaturing buffer (Invitrogen) with gentle agitation. The gels then were equilibrated in Zymogram developing buffer (Invitrogen) for 30 min, incubated with fresh Zymogram developing buffer for 18 h at 37°C and stained with SimplyBlue™ SafeStain (Invitrogen). Gelatinase activities were visualized as white bands on the blue background of the gels. The Bio-Rad Gel-Doc system (Bio-Rad) was utilized to quantify zymography band intensities. The relative activity of MMP2 was expressed as the sum of the pro-enzyme and the active form since the active form was faintly visible.
Hematoxylin and eosin (H&E) staining
Organoids were fixed in 4% paraformaldehyde for one hour at room temperature and then embedded in 2% agarose in water. The organoids were centrifuged, incubated on ice, and embedded in paraffin, after which the sections were subjected to H&E staining.
Xenograft experiment
BALB/c-nude mice were obtained from the Orient Bio (Gyeonggi-do, Korea). 1 × 10⁶ PDAC organoids were mixed with Matrigel (100 μl). Mixed Matrigel was injected subcutaneously into the right flank of each mouse. One week after PDAC organoids transplantation, mice were randomized into vehicle (18 mice per group) and metformin-treated groups (20 mice per group). For metformin groups, 30 mg/kg metformin was diluted freshly in sterile water and administered by oral injection using zonde needles every day for 28 days. The tumor volume (V) was calculated according to the standard formula V = (length × width2)/2. The tumor volumes were measured every 3-4 day for 28 days. Following sacrifice, the tumors were dissected and weighted. All animal studies were approved by the Institutional Animal Care and Use Committee of Samsung Biomedical Research Institute.
Statistical analysis
Differences between the two groups were assessed by student’s t-test. Three or more groups were compared with a one-way analysis of variance followed by Student-Newman-Keuls post hoc testing. Differences were considered statistically significant at P < 0.05. Statistical analyses were performed using GraphPad Prism version 8 (GraphPad, San Diego, CA, USA).
Results
PSCs and PDAC organoids derived from post-surgical human PDAC specimens mimic a pancreatic tumor state
To explore the phenotype of human PDAC in vitro, we isolated PSCs and PDAC organoids from duct clusters of human PDAC tissue. The morphology of PSCs and PDAC organoids was tracked with microscopy on days 1, 2, and 6 (Figure 1A, 1B). Both the PSCs and PDAC organoids were examined using confocal microscopy after being immunostained with specific markers. The PSCs were characterized by desmin, vimentin, and alpha-smooth muscle actin (Figure 1C). The PSCs also expressed laminin and collagen type IV, which contribute to some ECM components and help produce massive fibrosis and desmoplasia when they are in an inflammatory disease state (Figure 1C). The human PDAC organoids were immunostained for lysozyme, Ki67, β-catenin, collagen IV, and laminin as markers for secretory cells, proliferating cells, epithelial tumor cells, and basement membrane, respectively (Figure 1D). These markers were expressed in human PDAC organoids, regardless of the regional lymph node (N) stage of the PDAC patients (Supplementary Figure 1A, 1B). Furthermore, to ensure that isolated PSCs and PDAC organoids have a high purity of their characteristics, we performed a couple of negative immunofluorescences (IF) staining of each cell type. As a result, both cell types showed negative IF data of their opposite markers. We confirmed that the expression of epithelial markers such as zonula occludens-1 (ZO-1) and E-cadherin was negative in PSCs (Figure 1E). Also, representative mesenchymal markers such as vimentin and α-SMA were not positive in PDAC organoids (Figure 1F). As with other CSCs, which are a small subpopulation within tumor cells [17], a small proportion of cells in the PDAC organoids expressed leucine-rich repeat-containing G protein-coupled receptor 5 (LGR5) (Supplementary Figure 1C).
Figure 1.

Characterization of PSCs and PDAC organoids derived from human post-surgical tissue. A, B. Phase morphology of the PSCs and PDAC organoids on days 1, 2, and 6. Scale bars, 100 µm. C. Representative confocal images of immunofluorescence of laminin, collagen IV, desmin, vimentin, and alpha-SMA (α-SMA) in human PSCs. Scale bars: 50 µm. D. Representative confocal images of immunofluorescence of Ki67 (proliferation marker), β-catenin (epithelial tumor cell marker), lysozyme (secretory cell marker), collagen IV, and laminin (ECM component marker) in human PDAC organoids. E. Representative confocal images of immunofluorescence of ZO-1 and E-cadherin as negative markers for PSCs. Scale bars: 50 µm. F. Representative confocal images of immunofluorescence of vimentin and α-SMA as negative markers for PDAC organoids. Scale bars: 50 µm. The lower panel indicates magnification of the area in the red line rectangle of the upper panel. Scale bars, 50 µm.
Metformin attenuates the expression of migration and invasion-related factors in human PSCs
Previous studies suggested that metformin targets cancer cells and inhibits migration and invasion [21-24]. To examine whether metformin can affect the mRNA transcription levels of genes related to migration and invasion in human PSCs, we added metformin at concentrations of 1 μM, 10 μM, and 100 μM to PSC growth medium one day after seeding the cells and treated them for 48 h, after which the PSCs were harvested. The metformin-treated PSCs exhibited attenuated expression levels of vimentin, MMP2, and tissue inhibitors of metalloproteinases 2 (TIMP2), which are critical factors for migration and invasion (Figure 2A). Metformin dose-dependently reduced the transcription levels of CD10, CD24, and CD44, which are stromal prognostic markers in various tumors (Figure 2B). Based on quantitative PCR analysis, we considered 10 μM, which is close to previously reported human blood trough levels for type 2 diabetes mellitus (T2DM) [25,26], as an optimum concentration. Therefore, we examined the morphological changes and cell viability of PSCs at a concentration of 10 μM metformin and found no significant differences between the control group and the metformin-treated group for 48 h (Figure 2C, 2D).
Figure 2.

Effect of metformin on the expression of migration and invasion marker genes and cell viability in isolated primary human PSCs. A, B. Quantitative PCR data were analyzed after 48 h of metformin treatment. The relative mRNA expression levels of vimentin, MMP2, TIMP2, CD10, CD24, and CD44 were compared in control and metformin-treated PSCs. Data are represented as mean ± SEM. *P < 0.05, **P < 0.01, ***P < 0.001, statistically significant differentiation compared with the control. C. Representative bright-field microscopy images of PSCs. Microscopy was performed at 0 h and 48 h. Scale bars, 200 μm. D. Measurement of cell viability after 48 h of metformin treatment. No significant difference was seen between the control and metformin groups. CTL, control; ns, non-significant.
Metformin inhibits the migration capacity of human PSCs
To investigate whether metformin can inhibit the migration capacity of human PSCs, we conducted cell migration assay. PSCs seeded in pre-coated wells were cultured for up to 48 h. Compared with the control and 1 µM metformin, the 10 µM metformin significantly inhibited the closure of a circle cell-free zone by migrated cells (Figure 3A, 3B; PSCs from a patient with stage N0 PDAC). These results were reproducible in PSCs from patients with different N stages of PDAC (Figure 3C, 3D). Next, we investigated the protein expression and enzyme activity of MMP2 using Western blotting and gelatin zymography. The protein levels and enzyme activities of MMP2 showed significant differences between control and metformin groups regardless of PSCs derived from different N stages of PDAC (Figure 3E, 3G). Also, metformin showed an inhibitory effect on protein expression of CD10, which is a stromal stem cell marker that promotes the progression of cancer cells (Figure 3F). These data suggest that metformin could inhibit the migration capacity of human PSCs and expression levels of MMP2 and CD10.
Figure 3.

Metformin inhibits the migration capacity of PSCs and their expression of MMP2 and CD10. A. Migration assay with stage N0 PSCs treated with metformin (10 μM). Bright-field microscopy images of PSCs were taken at 0 h and 48 h. Scale bars, 100 µm. B. The migration areas were analyzed by measuring the areas of the migrated cells after 48 h of metformin treatment. C, D. Migration assay of N-stage 1 and 2 PSCs treated with metformin. Bright-field microscopy images of PSCs were obtained at 0 h and 48 h, and the migration areas were measured. Scale bars, 100 µm. E, F. Western blots of PSCs treated for 48 h with metformin. The relative levels of MMP2 and CD10 normalized to β-actin are depicted in the bar graph (n = 3 independent isolations). G. Gelatin zymography of MMP2-activated protein in PSCs. Media conditioned for 48 h in metformin or metformin-free conditions were assessed for MMP2 activation by zymography. Data are represented as mean ± SEM. **P < 0.01, ***P < 0.001, statistically significant differentiation compared with the control.
Metformin attenuates the migration ability of PSCs through a signaling pathway of TGF-β but not AMPK
We explored the role played by the transforming growth factor-beta (TGF-β) signaling pathway, one of the primary signaling pathways in cancer migration, in metformin’s ability to attenuate MMP2 expression in PSCs. First, to confirm that PSCs, PDAC organoids, and co-culture of PSCs and PDAC organoids secrete TGF-β, we cultured them for 48 h and collected the culture supernatant to detect the secretion of TGF-β. We found that each group treated with metformin secreted less TGF-β than the control groups (Figure 4A). Next, to determine whether metformin affects TGF-β signaling molecules, we administered recombinant TGF-β to PSCs in the presence of metformin. Metformin reduced the expression of MMP2, phosphorylated Smad 2/3, and alpha-smooth muscle actin (α-SMA), which are known to be related to TGF-β signaling in metastasis. Administering recombinant TGF-β reversed attenuation of pSmad2/3, α-SMA, and MMP2 in metformin-treated PSCs (Figure 4B).
Figure 4.

Roles of TGF-β- and AMPK-related signaling pathways in metformin’s attenuation of MMP2 expression and cancer migration ability. A. Detection of TGF-β secreted from PSCs, PDAC organoids, and co-culture of PSCs and PDAC organoids using ELISA. The supernatant was obtained after 48 h and activated TGF-β before the analysis. The samples were measured at 450 nm using a microplate reader. B. The expression of TGF-β downstream signaling and MMP2 according to treatment with metformin and/or recombinant TGF-β (2 ng/ml), as assessed by Western blotting. The right panel is quantitative analysis of band intensity. C. The inhibition effect of AMPK on PSCs was confirmed by Western blotting after 48 h of treatment with Compound C. The right panel is quantitative analysis of band intensity. D. The expression of TGF-β downstream signaling, AMPK, and MMP2 according to treatment with metformin and/or Compound C. The data on bar graphs were normalized to β-actin (n = 3 independent isolations). E. Representative images of migrated cells. Migration assay was performed to evaluate whether the effect of metformin depends on an AMPK pathway. 5 μM Compound C was used as an AMPK inhibitor. F. Quantitative analysis of cell migration. Data are depicted as mean ± SEM. *P < 0.05, **P < 0.01, ***P < 0.001. Scale bars, 100 μm.
To determine whether the anti-migration ability of metformin is also mediated by AMP-activated protein kinase (AMPK) activation, we added the AMPK inhibitor, Compound C to the PSCs. We found that Compound C treatment effectively decreased AMPK expression in PSCs (Figure 4C). Metformin treatment increased AMPK expression while decreasing TGF-β-related signaling. Treatment with Compound C reversed the metformin-induced activation of AMPK. However, it did not affect the expression of downstream TGF-β signaling (Figure 4D). In addition, we performed a migration assay to determine whether the anti-migration effect of metformin is independent of AMPK pathways (Figure 4E, 4F). Those results suggest that the anti-migration effect of metformin is independent of AMPK-dependent pathways (Supplementary Figure 2A). These findings were consistent in various TGF-β downstream signaling molecules in PSCs derived from stage N0-2 PDAC surgical samples (Supplementary Figure 2B, 2C).
Metformin attenuates the expression of cancer stem cell markers in human PDAC organoids
To investigate how metformin affects human PDAC organoids, we isolated and cultured organoids from dissected post-surgical tissue of patients diagnosed with pancreatic cancer. We cultured and observed PDAC organoids in Matrigel for 48 h (Figure 5A). When the PDAC organoids were stained with EhtD-1 and Calcein AM to assess cell viability, the control and metformin groups did not differ significantly (Figure 5B). Cytotoxicity and cell proliferation assays also showed no differences (Figure 5C).
Figure 5.

Metformin inhibits the expression of cancer stemness markers on PDAC organoids. A. Representative bright-field images of stage N0 PDAC organoids exposed to metformin treatment for 48 h. Scale bars: 100 µm. B. Representative fluorescence images of live and dead organoids after 48 h (Calcein AM for live organoids; ethidium homodimer-1 for dead cells). No significant difference was seen between the control and metformin-treated groups. Scale bars, 100 µm. C. Cell viability of PDAC organoids after 48 h of metformin treatment. No significant difference is evident between the control and metformin groups. D. Gene expression of CSC markers. LGR5, CD24, CD44, CD133, and EpCAM were assessed in stage N0 PDAC organoids. E, F. Bright-field microscopy images and qRT-PCR of stage N1 and N2 PDAC organoids exposed to metformin treatment. G. The expression of CSC markers of PDAC organoids. First lane; stage N0, second lane; stage N1, third lane; stage N2 of each group, respectively. Metformin reduces the expression of cancer stemness markers on cancer organoids derived from PDACs. Data are depicted as mean ± SEM. *P < 0.05, **P < 0.01. Scale bars, 100 µm.
To investigate whether metformin decreases cancer stem cell (CSC) markers involved in cancer aggressiveness, the transcription of LGR5 and clusters of differentiation (CD) markers were determined by quantitative reverse transcriptase polymerase chain reaction (qRT-PCR). The mRNA transcripts of cancer stemness markers LGR5, CD24, CD44, CD133, and EpCAM [27] were significantly decreased in stage N0 PDAC organoids (Figure 5D). In stages N1 and N2 PDAC organoids, LGR5 was significantly decreased (Figure 5E and 5F). In stages N0 to N2 PDAC organoids, CD24, CD44, and EpCAM were reduced (Figure 5D-F). Also, the level of protein expression of CSC markers was significantly reduced by metformin treatment (Figure 5G). These results suggest that metformin induces the downregulation of cancer stemness markers in PDAC organoids without affecting cell viability or proliferation.
Metformin treatment downregulates cancer stemness factors in a 3D direct co-culture model using PDAC organoids and PSCs
Next, to recapitulate the tumor microenvironment of human PDAC stroma, we established a 3D direct co-culture model in vitro using PDAC organoids and PSCs that produced a conglomerate. We cultured the stage N0 organoids and PSCs separately until both cell types were embedded in Matrigel to mimic a tumor microenvironment (Figure 6A, Supplementary Figure 3B). When the PDAC organoids were directly embedded with PSCs in Matrigel, the PSCs surrounded the PDAC organoids without their disturbing ductal structures (Figure 6B). We then compared the mRNA transcription levels of cancer stemness factors with and without metformin treatment. Metformin attenuated the gene and protein expression levels of CD24, CD44, CD133, and LGR5 in the 3D direct co-culture model (Figure 6C and 6D) and these findings were consistent in stage N1 and N2 PDAC organoids and PSCs (Supplementary Figure 3B), suggesting that the co-cultivation of PDAC organoids and PSCs can mimic human PDAC stroma without disrupting the ductal structures and that metformin can serve as an adjuvant treatment to reduce cancer stemness factors (Supplementary Figure 3A).
Figure 6.

An in vitro 3D direct co-cultivation of PDAC organoids and PSCs in Matrigel. A. Scheme for a direct co-culture system to produce the in vitro 3D tumor microenvironment. Pink represents PDAC organoids in Matrigel, and green represents PSCs. B. Representative microscopy images of PDAC organoids and PSCs in Matrigel. Upper panel: PDAC organoids, middle panel: PSCs, lower panel: co-culture of PDAC organoids with PSCs. C, D. Relative mRNA transcription and the protein expression of representative cancer stem cell markers in the direct co-culture system. The expression levels of CD24, CD44, CD133, and LGR5 all decreased significantly. Scale bars, 100 μm. Data represent as mean ± SEM. *P < 0.05, **P < 0.01, ***P < 0.001.
MMP2 knockdown in PSCs attenuated the migration capacity of PSCs in indirect 3D co-culture system with PDAC organoids
First, we examined the effect of metformin on the gene expression of cancer aggressiveness and migration markers in both PDAC of organoids and PSCs using indirect co-culture system. Metformin treatment reduced the gene expression of MMP2 and TIMP2 in PSCs of upper insert wells and CD24, CD44, CD133, and LGR5, cancer stemness markers in PDAC organoids of bottom wells (Supplementary Figure 4). We then investigated the role of MMP2 in the anti-migration effect that metformin had on PSCs. We cultured PSCs on an insert well pre-coated with Matrigel and PDAC organoids on the bottom embedded in Matrigel using an indirect co-culture system and assessed the number of PSCs that migrated toward the bottom well (Figure 7A). To explore the role of MMP2 downregulation in the anti-migration effect of metformin, the PSCs were transfected with siRNA for MMP2 or control siRNA, and the migration assays using indirect 3D co-culture system were performed. We confirmed that transfection with the MMP2 siRNA significantly decreased the mRNA expression of MMP2 in PSCs (Figure 7B). To investigate the migration capacity of MMP2-silenced PSCs, we seeded control siRNA or MMP2-knockdown PSCs on a Matrigel-coated insert and cultured PDAC organoids at the bottom. The number of PSCs that migrated toward the bottom of the well was significantly smaller in the MMP2-silenced groups than in the control-siRNA groups (Figure 7C, 7D). In the control siRNA and MMP2 silenced groups, metformin treatment showed the same results as the MMP2-silenced alone (Figure 7C, 7D). Next, to explore whether MMP2 could promote the migration and invasion ability of PSCs, we added rhMMP2 to the culture medium. Treatment with rhMMP2 in control siRNA-transfected group led to more enhanced migration compared with the control siRNA groups. Metformin treatment in rhMMP2 treatment groups reduced the increased migration as much as the control siRNA groups (Figure 7C, 7D). These results suggest that metformin exerts an anti-migratory effect on PSCs by targeting MMP2.
Figure 7.
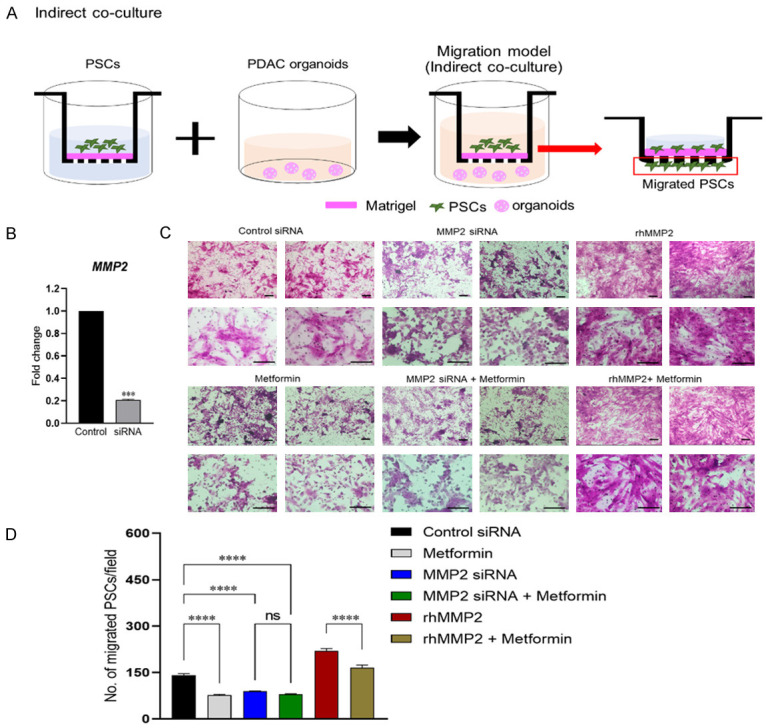
Effect of MMP2 knockdown on migratory ability of PSC using an in vitro 3D migration model. A. Scheme for an in vitro indirect co-cultivation 3D migration model. The PSCs that migrated to the bottom of the Matrigel-coated insert were counted. B. Gene levels of MMP2 in PSCs 24 h after transfection with MMP2-targeting siRNA. C. Representative microscopy images of PSCs that migrated to the bottom well of the insert after 48 h. Upper left panel: control siRNA-transfected PSCs; lower left panel: metformin-treated PSCs; upper middle panel: MMP2-silenced PSCs; lower middle panel: MMP2-silenced PSCs treated with metformin; upper right panel: control siRNA-transfected PSCs treated with 2 ng/ml rhMMP2; lower right panel: control siRNA-transfected PSCs treated with 10 μM metformin and 2 ng/ml rhMMP2. D. The number of migrated PSCs after indirect co-culturing with PDAC organoids. Scale bars, 100 μm. Data represent as mean ± SEM. ***P < 0.001, ****P < 0.0001. ns, non-significant.
Oral administration of metformin inhibited tumor growth in xenograft mice
We investigated whether metformin with a clinically relevant dose for anti-hyperglycemic medication could affect the tumor growth of PDAC organoids implanted subcutaneously in nude mice. As metformin is given orally to patients with T2DM, we orally administered metformin at 30 mg/kg daily for 28 days in xenografted mice. Mice in the control group were injected with sterile water as the same amount as the metformin group. Mice were randomly divided into two groups, and the initial tumor volume (mm3) between the two groups showed no significant difference (Figure 8A). As shown in Figure 8B and 8C, administration of metformin distinctly reduced the volume of the tumors, compared with the vehicle group. Also, the average tumor weight (g) in the metformin group was significantly lower than that of the vehicle group (Figure 8D). The size of xenograft tumors was visually smaller in the metformin groups than in the vehicle groups (Figure 8E). Furthermore, mRNA levels of cancer stemness and proliferation markers, such as CD24, CD44, CD133, and Ki67 were significantly decreased after 28 days of metformin administration (Figure 8F). These data indicate that metformin inhibits the growth of PDAC tumor xenografts in vivo.
Figure 8.

Orally administered metformin inhibits the growth of PDAC organoid xenografts in nude mice. A. The initial volume of tumor at day 0 after injected PDAC organoids into right flank of each mouse. B, C. Tumor volume (mm3) was measured every 3-4 day for 28 days and tumor volume (V) was calculated according to standard formula, V = (length width2)/2. The area under the curve was calculated from tumor volume at day 0 to day 28. D. After the experiment, xenograft tumor weight was measured from each mouse. E. The size of tumor after mice sacrifice. The results indicated that metformin significantly inhibited xenograft growth by oral administration of metformin. F. Gene expression analysis by quantitative PCR from tumor tissues. Data represent as mean ± SEM. *P < 0.05, **P < 0.01, ***P < 0.001.
Discussion
Metformin is an established first-line therapy for T2DM with an excellent safety profile, and it is a promising adjuvant therapy for improving the survival of patients with PDAC. To the best of our knowledge, this is the first study to assess the mechanism responsible for metformin’s anti-cancer effect using a clinically relevant concentration for T2DM in a 3D direct and indirect co-culture model containing PDAC organoids and primary PSCs obtained from post-surgical PDAC tissues. The results indicate that metformin attenuates the migration capacity of PSCs and downregulates the expression of cancer stemness factors in PDAC organoids generated from various stages of PDAC. Silencing MMP2 in PSCs with siRNA reproduced the benefit of metformin in terms of reductions in PSC migration, indicating that the effect of metformin on PSCs can be attributed to the downregulation of MMP2. In addition, we observed that oral administration of metformin (30 mg/kg) could inhibit the growth of PDAC organoid xenograft in immunosuppressed mice.
A plausible explanation for the aggressiveness of PDAC is its formation of dense stroma [28]. The tumor microenvironment in human PDAC is composed of many ECM factors, and PSCs interact with cancer cells and facilitate tumor progression [29]. These findings suggest that PSCs are important targets for anti-tumor strategies in pancreatic cancer. In previous studies, immortalized pancreatic cancer cell lines and PSCs were used to study pancreatic cancer. However, those cell lines lack cell-cell and cell-matrix interactions that recapitulate the tumor microenvironment [3]. Organoids, which are 3D complexes of tissue-specific cells and cells derived from adult stem cells, have emerged as novel tools for studying stem cell and cancer biology because they maintain patient-specific phenotypes and reflect physiological changes in heterogeneous tumor microenvironments [30]. In this study, we established human PDAC organoids from post-surgical PDAC tissues and co-cultured them with primary PSCs to mimic a human PDAC microenvironment. In such a microenvironment, MMPs, including MMP2, MMP9, and MT1MMP, are involved in invasion and tumor progression [4]. High levels of MMP2 expression in PSCs can lead to invasive states in PDAC organoids through TIMP2, whereas PDAC organoids rarely exhibit MMP2 expression [31]. In the indirect co-culture model used in this study, the anti-migration effect of metformin on PSCs is attributable to MMP2 downregulation.
In this study, the MMP2 downregulation in PSCs caused by metformin treatment was attributable to a reduction in TGF-β-related downstream signaling molecules (Supplementary Figure 2A). Previous studies revealed that metformin suppresses migration and invasive ability via the epithelial-mesenchymal transition (EMT) in cancer cells by reducing TGF-β [5,32,33]. Another study showed that metformin inhibited TGF-β production in desmoplastic PDAC by triggering AMPK. Although we also found that metformin treatment triggered AMPK activation, the ability of metformin to downregulate TGF-β-related signaling pathway molecules and MMP2 was AMPK-independent in our study and a previous study [34]. TGF-β has potent tumor-promoting functionalities, inducing the EMT and ECM production and enhancing tumor cell invasion and metastasis [32,35-38]. In particular, TGF-β strongly upregulates its own expression in an autocrine manner to maintain metastasis, resulting in a significant upregulation of MMP2 and TGF-β/Smad signaling [36,39]. In another study, a significant correlation was found between TGF-β/Smad signaling and MMP2 expression under metformin treatment [5]. In our study, treatment with recombinant TGF-β reversed the metformin-induced EMT changes and the anti-migration effect caused by MMP2 downregulation. Notably, metformin inhibited migration ability and decreased the transcription of Snail, Twist, and Zeb in pancreatic cancer PSCs.
In our study, the anti-cancer effect of metformin in a human PDAC direct and indirect co-culture model built using patient-derived organoids and PSCs was demonstrated using a clinically relevant concentration (10 μM) of metformin. Trough blood levels of metformin range from 4.5 μM to 8.88 μM in people with T2DM, depending on their kidney function [25,26]. Metformin is related to the expression of anti-invasive factors in various cell lines. However, previous studies investigated the effect of metformin at levels much higher than those in clinical use [40,41]. The results of this study are consistent with those of a previous study that found that a relatively low concentration of metformin inhibited CSCs in PDAC without inducing cytotoxicity [15].
Targeting CSCs has been proposed to be superior to targeting only MMPs in pancreatic cancer [3,29]. In this study, the PDAC organoids included a small proportion of CSCs expressing LGR5 (Supplementary Figure 1C), which is a representative marker for CSCs. The development of agents that target MMPs not only in ECM but also in PSCs to reduce cancer stemness is an unmet clinical need. Using a 3D direct co-culture model, we found that metformin can not only reduce MMPs in ECM but also reduce the markers of cancer stemness in PDAC organoids, such as CD24, CD44, CD133, and LGR5 [27]. LGR5 is a representative marker of self-renewing stem cells and has been studied as a potential CSC population marker, indicating tumor progression and metastasis [42]. Our data show that LGR5 expression in PDAC organoids was significantly reduced in a direct co-cultured model of PDAC organoids and PSCs (Figure 6C), suggesting that metformin could effectively alleviate cancer stemness in human PDAC microenvironments.
Several studies have suggested that metformin protects against apoptosis in non-cancer cell lines [43,44]. In one study, metformin did not enhance but instead inhibited gemcitabine-induced apoptosis in pancreatic cancer cell lines, in contrast to clinical observations supporting an anti-tumor adjuvant effect [45]. We found no difference in the viability of PDAC organoids when they were cultured with or without metformin. However, metformin did exhibit an apoptosis-independent anti-tumor mechanism, namely the reduction of local-invasive capacity through the downregulation of MMP2 in PSCs.
Several studies have shown that metformin administration suppressed tumor growth from various cancer cell lines in xenografted mice [46-49]. However, in previous xenograft studies of pancreatic cancer, most studies were confirmed using cancer stem cell lines [15,48]. In our study, orally administered low concentrations of metformin to PDAC organoids injected Balb/c-nude mice for 28 days suppressed tumor growth in vivo and reduced cancer stemness. The results of the xenograft study are consistent with those studies that injected cancer stem cell lines using a clinically safe dose of metformin [47], suggesting that an anti-hyperglycemic dose of metformin could suppress PDAC tumor growth in vivo.
Several limitations of this study should be considered. First, we did not use metformin in conjunction with cytotoxic anti-cancer chemotherapeutic agents, and our results should not be extrapolated to cytotoxic cancer chemotherapy. Second, the benefits of metformin adjuvant therapy have not been shown in PDAC patients with distant metastases who are on chemotherapy. Third, organoid culture cannot perfectly mimic human physiology; organoids have characteristics derived primarily from epithelial cells that lack immune and nervous systems [50], and the culture medium for organoids requires various growth factors that could affect the drug responses of the organoids. Fourth, our 3D local-invasion model is unsuitable for directly demonstrating tumor cell motility or invasiveness. It would require longer-term observation because the organoids maintain their ductal structure shapes when growing and expanding. A detailed mechanistic investigation of the interaction between tumor cells and stromal cells is also not feasible with this model. However, we also confirmed the anti-cancer effect of metformin in a xenograft model using a clinically relevant concentration for T2DM.
Conclusions
The anti-cancer effect of metformin was demonstrable in a 3D direct and indirect co-culture model of PDAC made with patient-derived PDAC organoids and human primary PSCs. In addition, we observed the anti-cancer effect of metformin in a xenograft model. The findings of this study indicate that the key mechanism of the anti-migratory effect of metformin on PSCs occurs via MMP2 downregulation, which was associated with the downregulation of TGF-β-signaling. Treatment with metformin also attenuates the cancer stemness of PDAC organoids cultured alone or with PSCs. This anti-cancer effect was achievable with a clinically relevant metformin concentration comparable to the doses used in people with T2DM.
Acknowledgements
This work was supported by a National Research Foundation of Korea grant funded by the Korean government (NRF-2019-Global Ph.D. Fellowship Program, grant number NRF-2019H1A2A1076751 to S.H.).
Disclosure of conflict of interest
None.
Supporting Information
References
- 1.Siegel RL, Miller KD, Jemal A. Cancer statistics, 2016. CA Cancer J Clin. 2016;66:7–30. doi: 10.3322/caac.21332. [DOI] [PubMed] [Google Scholar]
- 2.Swayden M, Iovanna J, Soubeyran P. Pancreatic cancer chemo-resistance is driven by tumor phenotype rather than tumor genotype. Heliyon. 2018;4:e01055. doi: 10.1016/j.heliyon.2018.e01055. [DOI] [PMC free article] [PubMed] [Google Scholar]
- 3.Schneiderhan W, Diaz F, Fundel M, Zhou S, Siech M, Hasel C, Moller P, Gschwend JE, Seufferlein T, Gress T, Adler G, Bachem MG. Pancreatic stellate cells are an important source of MMP-2 in human pancreatic cancer and accelerate tumor progression in a murine xenograft model and CAM assay. J Cell Sci. 2007;120:512–519. doi: 10.1242/jcs.03347. [DOI] [PubMed] [Google Scholar]
- 4.Dong W, Li H, Zhang Y, Yang H, Guo M, Li L, Liu T. Matrix metalloproteinase 2 promotes cell growth and invasion in colorectal cancer. Acta Biochim Biophys Sin (Shanghai) 2011;43:840–848. doi: 10.1093/abbs/gmr085. [DOI] [PubMed] [Google Scholar]
- 5.Duan W, Qian W, Zhou C, Cao J, Qin T, Xiao Y, Cheng L, Li J, Chen K, Li X, Ma J, Ma Q. Metformin suppresses the invasive ability of pancreatic cancer cells by blocking autocrine TGFbeta1 signaling. Oncol Rep. 2018;40:1495–1502. doi: 10.3892/or.2018.6518. [DOI] [PubMed] [Google Scholar]
- 6.Wang JC, Li GY, Wang B, Han SX, Sun X, Jiang YN, Shen YW, Zhou C, Feng J, Lu SY, Liu JL, Wang MD, Liu PJ. Metformin inhibits metastatic breast cancer progression and improves chemosensitivity by inducing vessel normalization via PDGF-B downregulation. J Exp Clin Cancer Res. 2019;38:235. doi: 10.1186/s13046-019-1211-2. [DOI] [PMC free article] [PubMed] [Google Scholar]
- 7.Rattan R, Graham RP, Maguire JL, Giri S, Shridhar V. Metformin suppresses ovarian cancer growth and metastasis with enhancement of cisplatin cytotoxicity in vivo. Neoplasia. 2011;13:483–491. doi: 10.1593/neo.11148. [DOI] [PMC free article] [PubMed] [Google Scholar]
- 8.Tseng HW, Li SC, Tsai KW. Metformin treatment suppresses melanoma cell growth and motility through modulation of microRNA expression. Cancers (Basel) 2019;11:209. doi: 10.3390/cancers11020209. [DOI] [PMC free article] [PubMed] [Google Scholar]
- 9.Yao L, Liu M, Huang Y, Wu K, Huang X, Zhao Y, He W, Zhang R. Metformin use and lung cancer risk in diabetic patients: a systematic review and meta-analysis. Dis Markers. 2019;2019:6230162. doi: 10.1155/2019/6230162. [DOI] [PMC free article] [PubMed] [Google Scholar]
- 10.Tian S, Lei HB, Liu YL, Chen Y, Dong WG. The association between metformin use and colorectal cancer survival among patients with diabetes mellitus: an updated meta-analysis. Chronic Dis Transl Med. 2017;3:169–175. doi: 10.1016/j.cdtm.2017.06.001. [DOI] [PMC free article] [PubMed] [Google Scholar]
- 11.Ma S, Zheng Y, Xiao Y, Zhou P, Tan H. Meta-analysis of studies using metformin as a reducer for liver cancer risk in diabetic patients. Medicine (Baltimore) 2017;96:e6888. doi: 10.1097/MD.0000000000006888. [DOI] [PMC free article] [PubMed] [Google Scholar]
- 12.Wan G, Sun X, Li F, Wang X, Li C, Li H, Yu X, Cao F. Survival benefit of metformin adjuvant treatment for pancreatic cancer patients: a systematic review and meta-analysis. Cell Physiol Biochem. 2018;49:837–847. doi: 10.1159/000493214. [DOI] [PubMed] [Google Scholar]
- 13.Li X, Li T, Liu Z, Gou S, Wang C. The effect of metformin on survival of patients with pancreatic cancer: a meta-analysis. Sci Rep. 2017;7:5825. doi: 10.1038/s41598-017-06207-x. [DOI] [PMC free article] [PubMed] [Google Scholar]
- 14.Karnevi E, Said K, Andersson R, Rosendahl AH. Metformin-mediated growth inhibition involves suppression of the IGF-I receptor signalling pathway in human pancreatic cancer cells. BMC Cancer. 2013;13:235. doi: 10.1186/1471-2407-13-235. [DOI] [PMC free article] [PubMed] [Google Scholar]
- 15.Gou S, Cui P, Li X, Shi P, Liu T, Wang C. Low concentrations of metformin selectively inhibit CD133(+) cell proliferation in pancreatic cancer and have anticancer action. PLoS One. 2013;8:e63969. doi: 10.1371/journal.pone.0063969. [DOI] [PMC free article] [PubMed] [Google Scholar]
- 16.Whiteside TL. The tumor microenvironment and its role in promoting tumor growth. Oncogene. 2008;27:5904–5912. doi: 10.1038/onc.2008.271. [DOI] [PMC free article] [PubMed] [Google Scholar]
- 17.Bao B, Ahmad A, Azmi AS, Ali S, Sarkar FH. Overview of cancer stem cells (CSCs) and mechanisms of their regulation: implications for cancer therapy. Curr Protoc Pharmacol. 2013 doi: 10.1002/0471141755.ph1425s61. Chapter 14: Unit 14 25. [DOI] [PMC free article] [PubMed] [Google Scholar]
- 18.Balarajah V, Neuzillet C, Kocher HM. Targeting pancreatic stellate cells to improve pancreatic cancer radiosensitivity. Translational Cancer Research. 2016;5:S730–S737. [Google Scholar]
- 19.McCarroll JA, Naim S, Sharbeen G, Russia N, Lee J, Kavallaris M, Goldstein D, Phillips PA. Role of pancreatic stellate cells in chemoresistance in pancreatic cancer. Front Physiol. 2014;5:141. doi: 10.3389/fphys.2014.00141. [DOI] [PMC free article] [PubMed] [Google Scholar]
- 20.Boj SF, Hwang CI, Baker LA, Chio II, Engle DD, Corbo V, Jager M, Ponz-Sarvise M, Tiriac H, Spector MS, Gracanin A, Oni T, Yu KH, van Boxtel R, Huch M, Rivera KD, Wilson JP, Feigin ME, Ohlund D, Handly-Santana A, Ardito-Abraham CM, Ludwig M, Elyada E, Alagesan B, Biffi G, Yordanov GN, Delcuze B, Creighton B, Wright K, Park Y, Morsink FH, Molenaar IQ, Borel Rinkes IH, Cuppen E, Hao Y, Jin Y, Nijman IJ, Iacobuzio-Donahue C, Leach SD, Pappin DJ, Hammell M, Klimstra DS, Basturk O, Hruban RH, Offerhaus GJ, Vries RG, Clevers H, Tuveson DA. Organoid models of human and mouse ductal pancreatic cancer. Cell. 2015;160:324–338. doi: 10.1016/j.cell.2014.12.021. [DOI] [PMC free article] [PubMed] [Google Scholar]
- 21.Saini N, Yang X. Metformin as an anti-cancer agent: actions and mechanisms targeting cancer stem cells. Acta Biochim Biophys Sin (Shanghai) 2018;50:133–143. doi: 10.1093/abbs/gmx106. [DOI] [PubMed] [Google Scholar]
- 22.Brown JR, Chan DK, Shank JJ, Griffith KA, Fan H, Szulawski R, Yang K, Reynolds RK, Johnston C, McLean K, Uppal S, Liu JR, Cabrera L, Taylor SE, Orr BC, Modugno F, Mehta P, Bregenzer M, Mehta G, Shen H, Coffman LG, Buckanovich RJ. Phase II clinical trial of metformin as a cancer stem cell-targeting agent in ovarian cancer. JCI Insight. 2020;5:e133247. doi: 10.1172/jci.insight.133247. [DOI] [PMC free article] [PubMed] [Google Scholar]
- 23.Liang F, Wang YG, Wang C. Metformin inhibited growth, invasion and metastasis of esophageal squamous cell carcinoma in vitro and in vivo. Cell Physiol Biochem. 2018;51:1276–1286. doi: 10.1159/000495539. [DOI] [PubMed] [Google Scholar]
- 24.Bao B, Wang Z, Ali S, Ahmad A, Azmi AS, Sarkar SH, Banerjee S, Kong D, Li Y, Thakur S, Sarkar FH. Metformin inhibits cell proliferation, migration and invasion by attenuating CSC function mediated by deregulating miRNAs in pancreatic cancer cells. Cancer Prev Res (Phila) 2012;5:355–364. doi: 10.1158/1940-6207.CAPR-11-0299. [DOI] [PMC free article] [PubMed] [Google Scholar]
- 25.Frid A, Sterner GN, Londahl M, Wiklander C, Cato A, Vinge E, Andersson A. Novel assay of metformin levels in patients with type 2 diabetes and varying levels of renal function: clinical recommendations. Diabetes Care. 2010;33:1291–1293. doi: 10.2337/dc09-1284. [DOI] [PMC free article] [PubMed] [Google Scholar]
- 26.Inzucchi SE, Lipska KJ, Mayo H, Bailey CJ, McGuire DK. Metformin in patients with type 2 diabetes and kidney disease: a systematic review. JAMA. 2014;312:2668–2675. doi: 10.1001/jama.2014.15298. [DOI] [PMC free article] [PubMed] [Google Scholar]
- 27.Ishiwata T, Matsuda Y, Yoshimura H, Sasaki N, Ishiwata S, Ishikawa N, Takubo K, Arai T, Aida J. Pancreatic cancer stem cells: features and detection methods. Pathol Oncol Res. 2018;24:797–805. doi: 10.1007/s12253-018-0420-x. [DOI] [PubMed] [Google Scholar]
- 28.Thomas D, Radhakrishnan P. Tumor-stromal crosstalk in pancreatic cancer and tissue fibrosis. Mol Cancer. 2019;18:14. doi: 10.1186/s12943-018-0927-5. [DOI] [PMC free article] [PubMed] [Google Scholar]
- 29.Schnittert J, Bansal R, Prakash J. Targeting pancreatic stellate cells in cancer. Trends Cancer. 2019;5:128–142. doi: 10.1016/j.trecan.2019.01.001. [DOI] [PubMed] [Google Scholar]
- 30.Yan HHN, Siu HC, Law S, Ho SL, Yue SSK, Tsui WY, Chan D, Chan AS, Ma S, Lam KO, Bartfeld S, Man AHY, Lee BCH, Chan ASY, Wong JWH, Cheng PSW, Chan AKW, Zhang J, Shi J, Fan X, Kwong DLW, Mak TW, Yuen ST, Clevers H, Leung SY. A comprehensive human gastric cancer organoid biobank captures tumor subtype heterogeneity and enables therapeutic screening. Cell Stem Cell. 2018;23:882–897. e811. doi: 10.1016/j.stem.2018.09.016. [DOI] [PubMed] [Google Scholar]
- 31.Koikawa K, Ohuchida K, Ando Y, Kibe S, Nakayama H, Takesue S, Endo S, Abe T, Okumura T, Iwamoto C, Moriyama T, Nakata K, Miyasaka Y, Ohtsuka T, Nagai E, Mizumoto K, Hashizume M, Nakamura M. Basement membrane destruction by pancreatic stellate cells leads to local invasion in pancreatic ductal adenocarcinoma. Cancer Lett. 2018;425:65–77. doi: 10.1016/j.canlet.2018.03.031. [DOI] [PubMed] [Google Scholar]
- 32.Lamouille S, Connolly E, Smyth JW, Akhurst RJ, Derynck R. TGF-beta-induced activation of mTOR complex 2 drives epithelial-mesenchymal transition and cell invasion. J Cell Sci. 2012;125:1259–1273. doi: 10.1242/jcs.095299. [DOI] [PMC free article] [PubMed] [Google Scholar]
- 33.Duan W, Chen K, Jiang Z, Chen X, Sun L, Li J, Lei J, Xu Q, Ma J, Li X, Han L, Wang Z, Wu Z, Wang F, Wu E, Ma Q, Ma Z. Desmoplasia suppression by metformin-mediated AMPK activation inhibits pancreatic cancer progression. Cancer Lett. 2017;385:225–233. doi: 10.1016/j.canlet.2016.10.019. [DOI] [PubMed] [Google Scholar]
- 34.Xiao H, Zhang J, Xu Z, Feng Y, Zhang M, Liu J, Chen R, Shen J, Wu J, Lu Z, Fang X, Li J, Zhang Y. Metformin is a novel suppressor for transforming growth factor (TGF)-beta1. Sci Rep. 2016;6:28597. doi: 10.1038/srep28597. [DOI] [PMC free article] [PubMed] [Google Scholar]
- 35.Tian M, Neil JR, Schiemann WP. Transforming growth factor-beta and the hallmarks of cancer. Cell Signal. 2011;23:951–962. doi: 10.1016/j.cellsig.2010.10.015. [DOI] [PMC free article] [PubMed] [Google Scholar]
- 36.<Intl Journal of Cancer - 2001 - Ellenrieder - TGF- induced invasiveness of pancreatic cancer cells is mediated by matrix (Resubmit 4).pdf>. doi: 10.1002/ijc.1330. [DOI] [PubMed] [Google Scholar]
- 37.Massague J. TGFbeta in cancer. Cell. 2008;134:215–230. doi: 10.1016/j.cell.2008.07.001. [DOI] [PMC free article] [PubMed] [Google Scholar]
- 38.Inman GJ. Switching TGFbeta from a tumor suppressor to a tumor promoter. Curr Opin Genet Dev. 2011;21:93–99. doi: 10.1016/j.gde.2010.12.004. [DOI] [PubMed] [Google Scholar]
- 39.Lian GY, Wang QM, Mak TS, Huang XR, Yu XQ, Lan HY. Inhibition of tumor invasion and metastasis by targeting TGF-beta-Smad-MMP2 pathway with Asiatic acid and Naringenin. Mol Ther Oncolytics. 2021;20:277–289. doi: 10.1016/j.omto.2021.01.006. [DOI] [PMC free article] [PubMed] [Google Scholar]
- 40.Hwang YP, Jeong HG. Metformin blocks migration and invasion of tumour cells by inhibition of matrix metalloproteinase-9 activation through a calcium and protein kinase Cα-dependent pathway: phorbol-12-myristate-13-acetate-induced/extracellular signal-regulated kinase/activat. Br J Pharmacol. 2010;160:1195–1211. doi: 10.1111/j.1476-5381.2010.00762.x. [DOI] [PMC free article] [PubMed] [Google Scholar]
- 41.Li L, Han R, Xiao H, Lin C, Wang Y, Liu H, Li K, Chen H, Sun F, Yang Z, Jiang J, He Y. Metformin sensitizes EGFR-TKI-resistant human lung cancer cells in vitro and in vivo through inhibition of IL-6 signaling and EMT reversal. Clin Cancer Res. 2014;20:2714–2726. doi: 10.1158/1078-0432.CCR-13-2613. [DOI] [PubMed] [Google Scholar]
- 42.Xu L, Lin W, Wen L, Li G. Lgr5 in cancer biology: functional identification of Lgr5 in cancer progression and potential opportunities for novel therapy. Stem Cell Res Ther. 2019;10:219. doi: 10.1186/s13287-019-1288-8. [DOI] [PMC free article] [PubMed] [Google Scholar]
- 43.Ota K, Nakamura J, Li W, Kozakae M, Watarai A, Nakamura N, Yasuda Y, Nakashima E, Naruse K, Watabe K, Kato K, Oiso Y, Hamada Y. Metformin prevents methylglyoxal-induced apoptosis of mouse Schwann cells. Biochem Biophys Res Commun. 2007;357:270–275. doi: 10.1016/j.bbrc.2007.03.140. [DOI] [PubMed] [Google Scholar]
- 44.Adeshara K, Tupe R. Antiglycation and cell protective actions of metformin and glipizide in erythrocytes and monocytes. Mol Biol Rep. 2016;43:195–205. doi: 10.1007/s11033-016-3947-5. [DOI] [PubMed] [Google Scholar]
- 45.Harada K, Ferdous T, Harada T, Ueyama Y. Metformin in combination with 5-fluorouracil suppresses tumor growth by inhibiting the Warburg effect in human oral squamous cell carcinoma. Int J Oncol. 2016;49:276–284. doi: 10.3892/ijo.2016.3523. [DOI] [PubMed] [Google Scholar]
- 46.Xia C, Liu C, He Z, Cai Y, Chen J. Metformin inhibits cervical cancer cell proliferation by modulating PI3K/Akt-induced major histocompatibility complex class I-related chain A gene expression. J Exp Clin Cancer Res. 2020;39:127. doi: 10.1186/s13046-020-01627-6. [DOI] [PMC free article] [PubMed] [Google Scholar]
- 47.Li Q, Xu K, Tian J, Lu Z, Pu J. Metformin mitigates PLCepsilon gene expression and modulates the Notch1/Hes and androgen receptor signaling pathways in castration-resistant prostate cancer xenograft models. Oncol Lett. 2021;22:715. doi: 10.3892/ol.2021.12976. [DOI] [PMC free article] [PubMed] [Google Scholar] [Retracted]
- 48.Kisfalvi K, Moro A, Sinnett-Smith J, Eibl G, Rozengurt E. Metformin inhibits the growth of human pancreatic cancer xenografts. Pancreas. 2013;42:781–785. doi: 10.1097/MPA.0b013e31827aec40. [DOI] [PMC free article] [PubMed] [Google Scholar]
- 49.Guo Y, Yu T, Yang J, Zhang T, Zhou Y, He F, Kurago Z, Myssiorek D, Wu Y, Lee P, Li X. Metformin inhibits salivary adenocarcinoma growth through cell cycle arrest and apoptosis. Am J Cancer Res. 2015;5:3600–3611. [PMC free article] [PubMed] [Google Scholar]
- 50.Jabs J, Zickgraf FM, Park J, Wagner S, Jiang X, Jechow K, Kleinheinz K, Toprak UH, Schneider MA, Meister M, Spaich S, Sutterlin M, Schlesner M, Trumpp A, Sprick M, Eils R, Conrad C. Screening drug effects in patient-derived cancer cells links organoid responses to genome alterations. Mol Syst Biol. 2017;13:955. doi: 10.15252/msb.20177697. [DOI] [PMC free article] [PubMed] [Google Scholar]
Associated Data
This section collects any data citations, data availability statements, or supplementary materials included in this article.