

Summary
In natural long days, the florigen gene FLOWERING LOCUS T (FT) shows a bimodal expression pattern with morning and dusk peaks in Arabidopsis. This pattern differs from the one observed in the lab, and little is known about underlying mechanisms. A red/far-red (R/FR) ratio difference between sunlight and fluorescent light causes this FT pattern mismatch.
We showed that bimodal FT expression patterns were induced in a day longer than 14 h with sunlight R/FR (= c. 1) conditions. By circadian gating experiments, we found that cumulative exposure of R/FR adjusted light (R/FR ratio was adjusted to 1 with FR supplement) spanning from the afternoon to the next morning required full induction of FT in the morning. Conversely, only two h of R/FR adjustment in the late afternoon was sufficient for FT induction at dusk.
We identified that phytochrome A (phyA) is required for the morning FT expression in response to the R/FR adjustment on the previous day. As a part of this mechanism, we showed that PHYTOCHROME-INTERACTING FACTOR 7 (PIF7) contributes to FT regulation.
Our results suggest that phyA-mediated High-Irradiance Response (HIR) and the external coincidence mechanism contribute to morning FT induction under natural long-day conditions.
Keywords: Arabidopsis, Circadian rhythm, External coincidence mechanisms, Far-red light, Florigen, Long-day plants, Photoperiodic flowering, Phytochrome
Introduction
Since the 1910s, day-length (=photoperiod) changes have been shown to be the major seasonal environmental parameter determining flowering time for many angiosperms (Vince-Prue, 1975; Thomas & Vince-Prue, 1997). Based on their responses to different photoperiods, flowering plants were classified into three major groups: long-day plants (LDP), short-day plants (SDP), and day-neutral plants (Garner, 1933; Vince-Prue, 1975; Thomas & Vince-Prue, 1997).
To investigate the mechanism of measuring the day-length differences, various SDP have been used primarily due to their high sensitivity to brief light exposure (a few min) during night break experiments (Vince-Prue, 1975; Cockshull, 1984; Thomas & Vince-Prue, 1997). SDP require a certain period of uninterrupted darkness to induce flowering. A light pulse applied during the night inhibits flowering. The inhibitory light is absorbed by the R/FR photoreceptor phytochrome (phy), and its action shows R/FR reversibility (Vince-Prue, 1975; Cockshull, 1984). Although in the 1960s, phytochrome thermal reversion kinetics were hypothesized to function as an hourglass during the night to measure the duration of the night period (Hendricks, 1960), the model was unable to account for many observations satisfactorily. Another model called the external coincidence model, proposed in 1964 based on Bünning’s hypothesis (Pittendrigh & Minis, 1964), has been experimentally supported and conceptually utilized to study photoperiodic flowering. In this model, the circadian clock sets the timing of the light-sensitive phase to the afternoon, and only when the presence of light coincides with the light-sensitive phase, was the light-induced reaction (=inhibition of flowering in SDP) induced (Song et al., 2015).
Compared to SDP, the mechanisms in LDP have been thought to be more complex and elusive. Similar to SDP, phytochrome remains a major photoreceptor for flowering regulation in LDP, with the circadian clock timing the light-sensitive phase within a day (Deitzer, 1984). Unlike SDP however, most LDP require longer exposure (over one h) to induce flowering in night break experiments, as the flowering responses are not saturated until a higher amount and a longer exposure of light is provided. In night break experiments, R/FR reversibility was not observed in many LDP. Instead, FR light, together with white light or R light (but not FR alone) generally strongly induces flowering (Deitzer, 1984). Moreover, action spectra of flower induction in various LDP show action maxima at wavelengths over 700 nm of light (Deitzer, 1984; Jackson & Thomas, 1997). It has been thought that the FR-enriched condition-induced flowering is controlled by phytochrome High Irradiance Response (HIR), although the mechanism of the HIR-induced flowering remains largely unknown.
Regardless of the day-length preferences, all angiosperms likely utilize a conserved systemic molecule referred to as florigen to induce flowering (Zeevaart, 2006; Turck et al., 2008). The concept of florigen, in which a leaf generates a systemic molecule to induce a floral transition at the shoot tip, was proposed in the 1930s. Subsequent series of grafting experiments revealed its conserved functionality across plants with different day-length requirements (Zeevaart, 2006). With the advent of molecular genetics utilizing Arabidopsis and rice (Oryza sativa), florigen was finally revealed to be a small mobile protein encoded by FLOWERING LOCUS T (FT) gene in Arabidopsis and its homolog, Heading day 3a (Hd3a) gene in rice (Corbesier et al., 2007; Tamaki et al., 2007). FT belongs to a gene family found in all angiosperms (Bennett & Dixon, 2021; Jin et al., 2021). This family contains FT orthologs and paralogs with inhibitory roles in flowering. In addition to flowering, FT homologs control various seasonal developmental changes, such as germination, tuber/bulb/nodule formation, the onset of dormancy, control of side branching patterns, etc. (Jin et al., 2021; Wang et al., 2021; Zhu et al., 2021).
Besides the identification of florigen, molecular genetics has facilitated our understanding of molecular mechanisms for day-length measurement in both LDP and SDP (Thomas & Vince-Prue, 1997). In LDP Arabidopsis, the various circadian clock components coordinate transcriptional patterns and protein stability of CONSTANS (CO), the major transcriptional activator of FT (de Montaigu et al., 2010; Song et al., 2015). CO protein is accumulated primarily at the late afternoon in long days (LD) by actions of multiple photoreceptors, such as phyA, phyB, cryptochrome 1(cry1), cry2, and FLAVIN-BINDING, KELCH REPEAT, F-BOX 1(FKF1) (Valverde et al., 2004; Song et al., 2012), resulting in FT induction at dusk. As this mechanism fits the concept of the external coincidence model (Song et al., 2015), molecular genetic approaches revealed the similarities and differences in the underlying mechanisms of photoperiodic flowering in SDP and LDP. One unsolved question regarding the flowering mechanism is how the LDP-specific HIR mechanisms proposed by various physiological studies can be incorporated into our current mechanistic model of photoperiodic flowering. PhyA is a primary photoreceptor for HIR (Nagatani et al., 1993). The phyA mutants showed a delayed flowering phenotype only in low-intensity FR extension experiments, not under the regular LD conditions in the lab (Johnson et al., 1994). The light condition-limited flowering phenotype of the phyA mutants made it difficult to incorporate phyA into the mechanism of photoperiodic flowering under white light. Therefore, how the HIR mechanism contributes to Arabidopsis photoperiodic flowering in regular LD remains unclear.
Recently, transcriptional analyses using Arabidopsis plants grown outdoors in LD revealed that FT peaked twice, once in the morning and again at dusk, instead of expressing just once at dusk (Song et al., 2018). This difference in FT patterns was caused by the difference in the R/FR ratios between sunlight (R/FR=1) and artificial fluorescent light (R/FR>2). In addition, FT was not induced in short days (SD) even when the R/FR ratio was adjusted in the same way (Song et al., 2018). These results indicated that the morning FT peak is induced by LD-specific mechanisms similar to those seen in dusk FT expression. However, our current molecular model based on the external coincidence model explains only the induction of FT around dusk in LD and is unable to predict how bimodal FT expression patterns are induced in natural LD. Here we analyzed how bimodal FT expression patterns were generated by day-length changes and whether there was a specific light-sensitive phase within a day important for the induction of FT in the natural LD morning. We found different requirements of light exposure timing for morning and evening induction of FT in LD. In addition, FT expression levels in the morning, regulated by phyA, showed a dosage-dependent increase in FR-supplemented light (R/FR=1) conditions, indicating that the HIR is involved in this regulation. In addition, we showed that PIF7, currently known as a regulator of shade-induced flowering (Galvão et al., 2019), plays a role in FT induction under natural LD conditions.
Materials and Methods
Plant materials and growth conditions
All experiments were performed with the Col-0 accession of Arabidopsis thaliana (L.) Heynh. The pif7–1, pif4pif5, pif4pif5pif7, and PIF7–3HA were previously described (Leivar et al., 2008) (Galvão et al., 2019) and kindly provided by Dr. Christian Fankhauser (University of Lausanne, Switzerland). To generate PIF7 overexpressors with the C-terminal 6xHis 3xFLAG (6H3F) tag, PIF7 cDNA with the 6H3F tag sequence was cloned into the pH7WG2 binary vector (Karimi et al., 2002). Homozygote T3 and T4 lines with a single T-DNA insertion were used for all assays. For gene expression analyses, seeds were sown on 1xLinsmaier and Skoog (LS) agar media (PhytoTech Labs, Lenexa, KS, USA) without sucrose. Plants were either grown in the LD conditions (R/FR ratio of 2.0–2.5) or transferred to the LD+FR conditions (R/FR ratio =1) on the day indicated in the figs. The emission spectra of light used in LD and FR-supplemented LD+FR conditions were described previously (Song et al., 2018). Light intensity in plant chambers was adjusted to 90–110 μmol m−2 s−1. For monochromatic FR and FR+B light under LD conditions, the FR LED (30 μmol m−2 s−1) and B LED (30 μmol m−2 s−1, emission range 430–460 nm, 24 Watt Advance Spectrum Grow Light, All Blue, Yield Lab, USA) were used. The light intensity was measured by the full spectrum Quantum sensors (PQ-500, Apogee Instruments, Logan, UT, USA) and the red/far-red sensor (S2-131-SS, Apogee Instruments). For monochromatic FR treatment, plants were grown on 1xLS media containing 1% sucrose to provide sugar sources.
RNA isolation and gene expression analyses
RNA isolation, cDNA synthesis, and qRT-PCR method were described previously (Song et al., 2018). The relative gene expression levels were computed using geometric means of two reference genes, ISOPENTENYL PYROPHOSPHATE/DIMETHYLALLYL PYROPHOSPHATE ISOMERASE (IPP2) and SERINE/THREONINE PROTEIN PHOSPHATASE 2A (PP2A). The expression levels were determined using at least three biological replicates. Primers used in the qRT-PCR analysis are listed in Table S1.
Protein extraction and immunoblot analysis
For PIF7 protein analyses, two-wk-old seedlings grown in either LD or LD+FR were harvested at the indicated time points. Total proteins were extracted from frozen ground tissues in the extraction buffer [50 mM sodium phosphate (pH 7.4), 150 mM KCl, 10% glycerol, 5 mM EGTA, 0.1% Triton X-100, 0.1% SDS, 0.5% sodium deoxycholate, 50 μM MG-132, 2 mM Na3VO4, 2 mM NaF, EDTA-free protease inhibitor (Thermo Fisher Scientific, Waltham, MA, USA), 1 mM DTT, and phosphatase inhibitor (Roche, Basel, Switzerland)]. Nuclear proteins were prepared using CelLytic Plant Nuclei Isolation/Extraction Kit (Sigma-Aldrich, St. Louis, MO, USA) according to the manufacturer’s protocol. HA-PIF7 proteins were detected using a monoclonal anti-HA (3F10, Roche) antibody. Actin or histone H3 proteins were detected by anti-actin (10-B3, Sigma-Aldrich) or anti-histone H3 (MABI0301, MBL, Nagoya, Aichi, Japan) antibodies, respectively, followed by an HRP-conjugated goat anti-mouse antibody (MBL330, MBL). For protein quantification, Image Studio Lite (LI-COR, Lincoln, LE, USA) was used. Relative protein abundance was normalized against actin or histone H3. Relative PIF7 protein levels were further normalized against a geometric mean of the LD condition, and data from three biological replicates were presented.
Flowering time measurement
Flowering time experiments were described previously (Song et al., 2018). To show the flowering time results, box plots were created using Prism software (GraphPad, San Diego, CA, USA) with Tukey method for the whiskers.
Chromatin immunoprecipitation (ChIP) assay
ChIP assay was performed with two-wk-old 35S:PIF7-6H3F #5 seedlings (about 600 mg) as described in Yamaguchi et al. (2014) with minor modifications. Briefly, after pulverizing samples, the extraction buffer containing formaldehyde [0.4 M sucrose, 10 mM HEPES (pH 8.0), 2 mM EDTA, 5 mM ß-mercaptoethanol, EDTA-free protease inhibitor tablet (Thermo Fisher Scientific), 1% formaldehyde] was added and incubated for 10 min at 4 °C followed by quenching with a total concentration of 200 mM glycine for five min. Crosslinked samples were filtered twice through Miracloth. Chromatin was isolated and sonicated with Bioruptor Pico (Diagenode, Denville, NJ, USA) eight times (30 sec on/30 sec off cycles and high-power output). The sonicated chromatin was precipitated with anti-FLAG antibody (A8592, Sigma-Aldrich). The immunoprecipitated DNA after reverse-crosslinking was purified using DNA purification kit (Qiagen, QIAquick PCR Purification Kit). Primer sequences of each amplicon of FT, PHYTOCHROME INTERACTOR 3-LIKE 1 (PIL1), YUCCA8 (YUC8), and PP2A loci are listed in Table S1.
Statistical analysis
Normality of the residuals and homoscedasticity were verified by quantile-quantile plots and boxplots, respectively. Statistical analysis of gene expression analyses was performed using analysis of variance (ANOVA) followed by Duncan’s new multiple range test (MRT) using R software and statistically significant differences (P <0.05) are represented as different letters. Statistical analysis of multiple comparisons was performed using two-way ANOVA test followed by post hoc Tukey’s honestly significant difference (HSD) test using Graphpad prism software and significantly different groups (P <0.05) are presented as different letters. For the comparisons between two light conditions, the unpaired two-tailed t-test was performed, and statistically significant differences are indicated by an asterisk (*, P <0.05).
Results
Longer day-length conditions induce higher levels of FT in the morning and the evening.
The expression levels of evening FT increased as the day lengthened (Salazar et al., 2009; Krzymuski et al., 2015). We wondered whether the morning expression of FT also occurred in a similar day-length-dependent fashion. To ascertain which day-length conditions induced FT in the morning, we studied daily FT expression profiles under a range of long day-length conditions (12 to 16 h light) with the R/FR adjusted to 1 (Fig. 1).
Fig. 1.
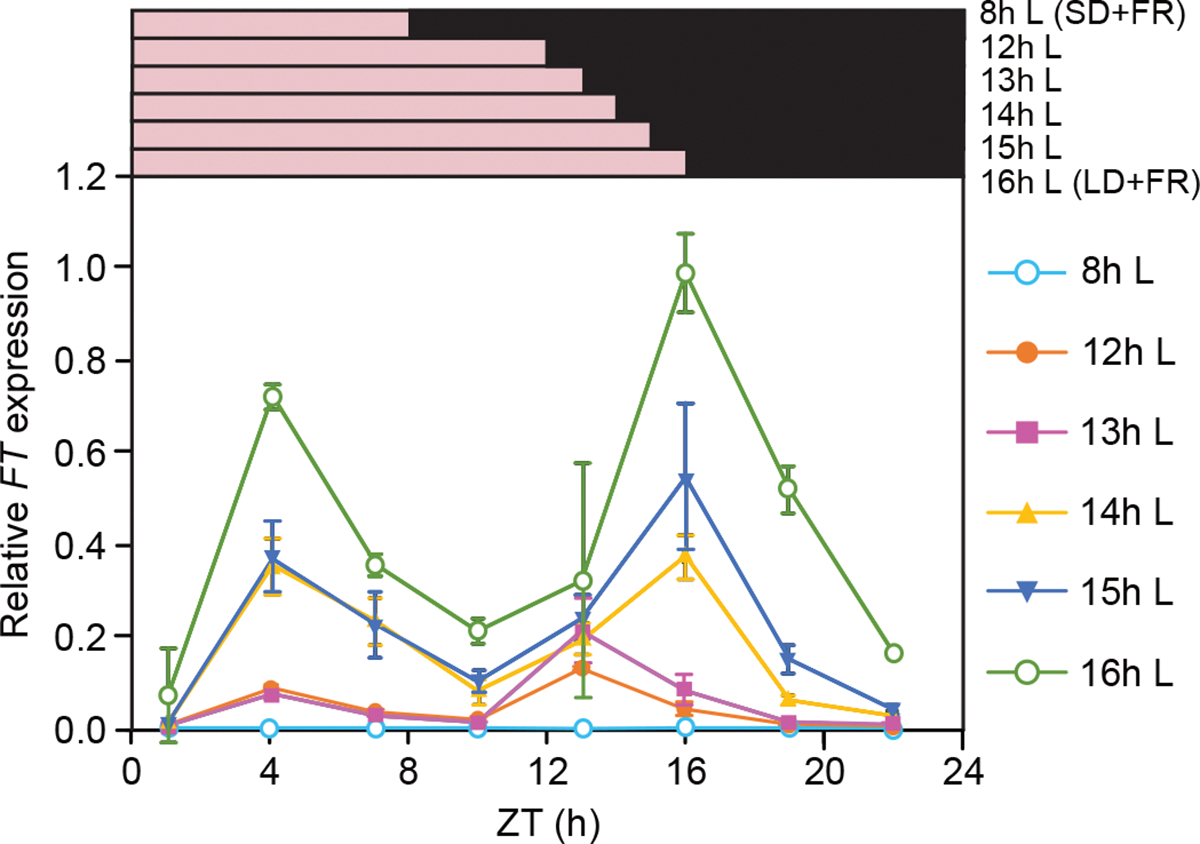
Overall FT levels increased when day length became longer, and bimodal FT expression patterns were noticeable under longer (>14 h) day-length conditions. Daily FT expression patterns under different day-length conditions with white light of R/FR ratio adjusted to 1 are shown. Plants were grown for 14 d under different day-length conditions. The pink and black bars on top of the graph depict white light (R/FR=1) and dark periods of each day-length condition, respectively. Samples were harvested every three h throughout the day from Zeitgeber time 1 (ZT1). Data represent means ± SEM from three biological replicates. Individual data values and stats are shown in Fig. S1. SD+FR: short days with R/FR adjusted to 1 by supplying dim FR with white fluorescence light. LD+FR: long days with R/FR adjusted to 1.
When day-length conditions were set to either 12 or 13 h (Figs 1, S1), FT peaked around the end of the days [Zeitgeber time (ZT)12/13], while FT expression levels in the morning (at ZT4) were not statistically different from those in SD+FR (Fig. S1). When day-length conditions were set to either 14 or 15 h, clear bimodal expression patterns of FT emerged (Fig. 1). These results show that, under simulated sunlight, the morning FT peak is induced only when the day length extends beyond 14 h while a day length of 12 h is sufficient to generate noticeable dusk FT peaks. The FT peak levels in both morning and evening increased with day length. The timing of the morning FT peak remained consistent (ZT4), while the evening peaks of FT occurred around the end of light periods under different LD conditions.
We found that 4 d of the R/FR adjustment (LD+FR 4d in Fig. S2) fully mimicked the two-wk treatment of the supplementary FR (LD+FR 14d) in terms of FT expression. Therefore, we conducted most of the R/FR adjustment treatments discussed below for treating plants with three full R/FR adjusted days, and on day four, we harvested samples at different time points. We hereafter referred to the LD conditions with four-d-long-FR treatment as “LD+FR” in this manuscript unless otherwise specified.
The duration and the timing of R/FR adjustment influenced FT levels differently in the morning and the evening.
As the morning induction of FT was day-length specific, this implied that a light-sensitive phase might encompass a specific range of time within a day to induce FT in the morning. To test this, we first examined the effects of sliding two-h windows of supplementary FR light (indicated as “LD+FR X-Y,” in which X and Y denote a beginning and an end of the treatment period in ZT time) on the FT expression levels in the morning (ZT4) and at the end of the day (ZT16) (Fig. 2a).
Fig. 2.

The induction of FT in the morning and at dusk required different durations and timing of the R/FR=1 adjustment. The effects of different durations and timings of the R/FR ratio adjustment (R/FR=1) of white light on the levels of FT expression in the morning (ZT4) and at dusk (ZT16) in LD are shown. The durations and timings of the R/FR adjustment are depicted by pink areas of the bars (a, d, g). The white and black bars indicate the white light without R/FR adjustment (R/FR =2.0–2.5) and dark periods in LD, respectively. Plants were grown for 10 d in LD (LD without R/FR adjustment) and then transferred to different conditions. After three full-day treatments of different light conditions, plants were harvested on day 14 at ZT4 and ZT16. (b, e, h) Relative expression levels of FT at ZT4 under the conditions shown in Figs 2a, d, and g. (c, f, i) Relative expression levels of FT at ZT16 under the conditions shown in Figs 2a, d, and g. Data of all panels represent means ± SEM from at least three biological replicates. Different letters indicate statistically significantly different determined by one-way ANOVA test followed by Duncan’s MRT.
In LD+FR, FT was expressed approximately five times and twice higher than those in LD at ZT4 and ZT16, respectively (Figs 2b, c). We observed that all the two-h-window LD+FR conditions failed to induce FT expression at ZT4 to the levels observed in the LD+FR grown plants (Fig. 2b). In contrast, the FT expression levels at ZT16 in the LD+FR 12–14 conditions were comparable with those in LD+FR (Fig. 2c). These results indicate that two h-long R/FR light adjustment window is sufficient to induce FT expression at ZT16 when it is applied around ZT12–14, but that a longer exposure of adjusted R/FR ratio may be required to fully induce FT at ZT4.
We therefore tested the effects of four h- and eight h-windows of FR supplement on FT levels (Figs 2d, g). Compared with the effects of any two h-long treatments, the four h- and eight h-long treatments elevated the morning FT levels. However, none of these conditions were sufficient to mimic the effect of the LD+FR conditions (Figs 2e, h). The effects of four h-long FR supplements on the FT levels differed among the time windows; the LD+FR 4–8 treatment showed the least induction of FT (Fig. 2e). The difference in FT levels at ZT4 also exists between two eight h-long treatments (Fig. 2h). These results imply two rules for FT induction in the morning: 1) longer supplementary FR treatments tend to be more effective, and 2) among the treatments with the same length of the supplementary FR, the morning-to-midday treatment (ZT4–8) is the least effective. In contrast to the morning FT induction mechanisms, four h- and eight h-long treatments induced the evening FT levels to the levels observed in LD+FR, when the FR supplement windows include at least two h-long exposure time around ZT12–14 (Figs 2f, i).
We wondered whether the difference in FT induction in the morning and the evening described above was due to common characteristics of the R/FR signaling pathway. To test this possibility, we analyzed the expression levels of a well-known FR (or shade)-inducible gene PIL1 (Salter et al., 2003) in the same samples (Fig. S3). Although our LD+FR conditions were not considered canopy shade conditions, PIL1 levels were higher in LD+FR than in LD. At both ZT4 and ZT16, PIL1 levels were increased only when R/FR adjustment overlapped with the timing of sample harvesting (Fig. S3). This suggests that the conditions necessary to induce FT in LD+FR are not generally shared among FR-inducible genes.
Both morning and afternoon supplementary FR light treatments are necessary for the full morning FT induction
Results of the four-h-long R/FR adjustments revealed that the R/FR ratios in both early morning (ZT0–4) and afternoon to evening (ZT8–16) equally affected the morning FT levels, although neither of them was sufficient to recreate the same FT levels in LD+FR (Fig. 2). This observation lets us infer that full morning FT induction might require two separate supplementary FR light treatments. To test this possibility, we examined the R/FR adjustment effects of applying two separate time windows (morning and afternoon) on the FT levels (Fig. 3a). Both LD+FR 0–4/8–16 and LD+FR 0–4/8–12 conditions (total exposure time of 12 and 8 h, respectively) showed similar FT expression levels at ZT4 to the LD+FR conditions (Fig. 3b). Even though plants in the LD+FR 0–4/12–16 conditions received the same amount of daily FR light as those in the LD+FR 0–4/8–12 conditions, morning FT levels in the LD+FR 0–4/12–16 were lower than those in the LD+FR 0–4/8–12 treatment. These results indicate that R/FR ratios adjusted to 1 in both the morning (ZT0–4) and afternoon (ZT8–12) are essential to fully induce morning FT expression (Figs 3a, b). Conversely, FT expression at ZT16 was significantly increased by afternoon FR light regardless of exposure time with the somehow lesser extent in LD+FR 0–4/12–16 (Fig. 3c).
Fig. 3.
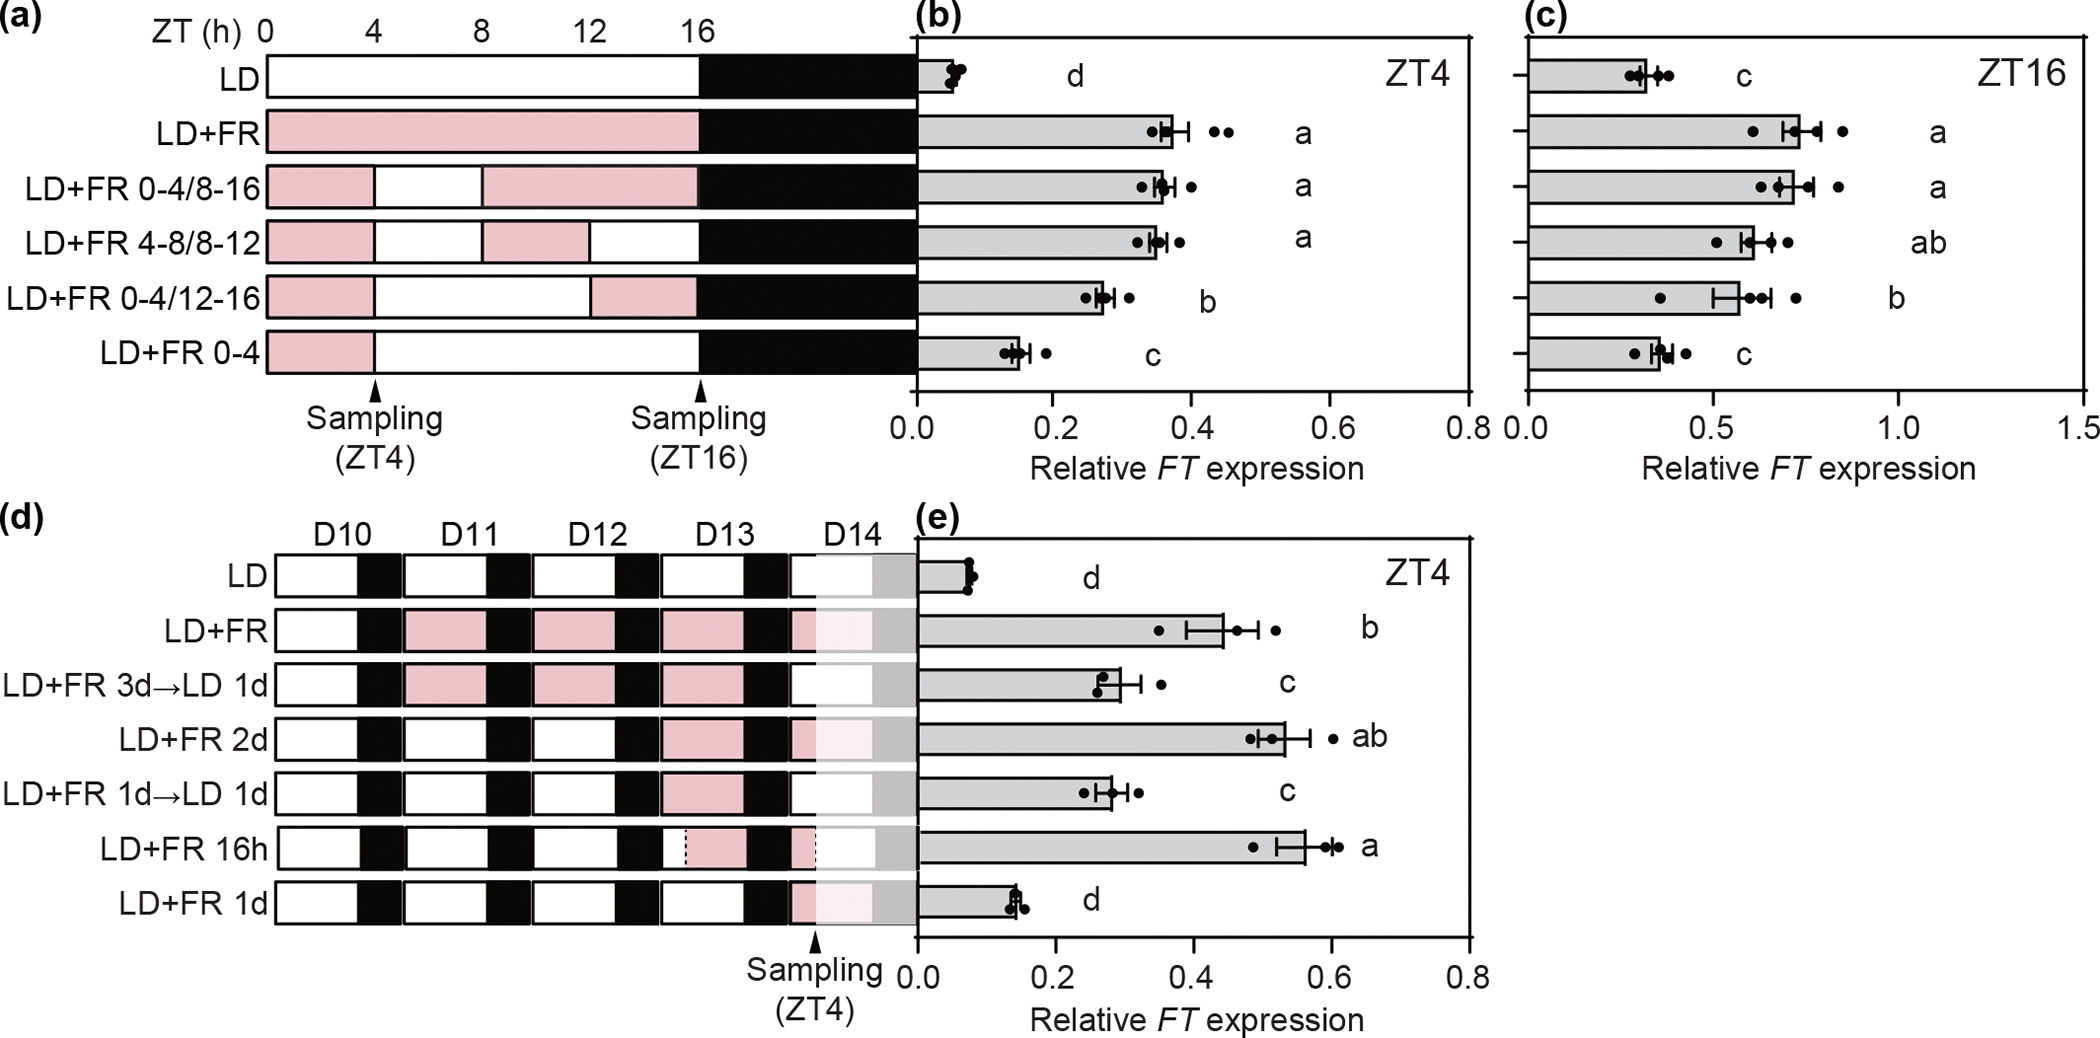
The FT levels in the morning were regulated by the R/FR information accumulated from the afternoon to the following day. The durations and timings of the R/FR adjustment are depicted by pink areas of the bars (a, d). “D” in the panel d indicates day numbers (ex. D10 = day 10). The white and black bars indicate the white light without R/FR adjustment (R/FR =2.0–2.5) and dark periods in LD, respectively. Plants were harvested on day 14 at ZT4 and ZT16. (b, e) Relative expression levels of FT at ZT4 under the conditions shown in Figs 3a and d. (c) Relative expression levels of FT at ZT16 under the conditions shown in Fig. 3a. Data of all panels represent means ± SEM from at least three biological replicates. Different letters indicate statistically significantly different determined by one-way ANOVA test followed by Duncan’s MRT.
Because the R/FR ratios in both afternoon and morning contribute in determining the morning FT levels, we predicted that the R/FR information may start accumulating from the afternoon of the previous day, be stored during night, and contribute FT expression in the following morning. To test this, we examined if the morning FT expression was induced in response to the supplementary FR light treated on the previous day. The 10-d-old LD-grown plants were transferred to the LD+FR condition for three d, and then on day 14, re-transferred to LD (LD+FR 3d→LD 1d) or kept in LD+FR (Fig. 3d). Without supplementary FR light on harvesting day 14 in the LD+FR 3d→LD 1d condition, FT levels at ZT4 were lower than those in LD+FR but higher than those in LD (Fig. 3e). In addition, we found that in LD+FR 1d→LD 1d, where plants were irradiated with the supplementary FR light only on the previous day, induced FT expression similar to the levels measured in LD+FR 3d→LD 1d, suggesting that one day’s supplementary FR light signal is sufficient for the induction of FT the following morning at ZT4. Furthermore, 16 h of the supplementary FR light treatment starting from ZT4 on day 13 (LD+FR 16h) showed fully induced morning FT expression similar to the levels in the LD+FR and LD+FR 2d conditions on day 14 (Figs 3d, e). These results indicate that the R/FR information will accumulate from the afternoon of the previous day to the next morning to induce FT in the morning.
In order to test how long the R/FR effect continued to influence FT levels, we analyzed the FT expression patterns after we transferred plants back to LD from LD+FR conditions. The LD+FR conditions only increased the next morning FT peak on day 15 in LD (Fig. S4), indicating the R/FR information for FT induction cannot be kept more than one d after the last R/FR changes.
FT levels in the morning positively correlate with the duration of FR-adjusted periods.
Our results imply that the R/FR=1 conditions activate at least two signaling cascades for FT induction: 1) a short exposure in the evening is sufficient to increase the FT levels at dusk, and 2) a longer exposure initiated from the afternoon to the following morning which spans the night induces FT expression in the morning. Although phy-mediated HIR contributes in floral induction of LDP, the effect of phyA mutation is limited to the specific light condition (Johnson et al., 1994). This is likely due to the usage of fluorescent light, which lacks FR emission almost entirely, as a white light source (Smith & Holmes, 1975). Additionally, we previously reported that phyA contributes to morning FT induction (Song et al., 2018). We, therefore, hypothesized that the morning FT induction mechanism could be the mechanism underlying the HIR-induced flowering described previously. To more quantitatively analyze the effects of FR-adjusted periods, we plotted the durations of LD+FR periods and the expression levels of FT at both ZT4 and ZT16 based on the results shown in Fig. 2 (Figs 4a, b). FT levels at ZT4 were highly correlated with the duration of R/FR adjusted periods (R2=0.7784), while there is little correlation between the duration of the R/FR periods and FT levels in ZT16 (R2=0.2119). Given that FT levels correlate with flowering time in Arabidopsis (Salazar et al., 2009; Kinmonth-Schultz et al., 2016), this result suggested that morning FT levels could be a mechanism of FR-duration-dependent earlier flowering.
Fig. 4.

The FT levels in the morning but not at dusk correlated with the durations of the R/FR adjusted white light exposure. A combination of monochromatic FR and monochromatic B (FR+B) observed by phyA was sufficient to induce a bimodal expression pattern of FT in LD. phyA is important for sensing R/FR of LD afternoon for flowering. (a, b) Individual FT values shown in Fig. 2 were plotted with durations of the R/FR adjustments. The colors of each dot depict the starting time of the R/FR adjusted light exposure. Bars in the graphs are fitted linear regression lines. R2 values are shown in each graph. (c) Relative expression levels of FT in Col-0, phyA, and phyB mutants under LD conditions with FR+B light. FR and B were obtained from LEDs. Data represent means ± SEM from three biological replicates. Individual data values and stats are shown in Fig. S5. (d, e) Flowering time of Col-0, phyA, and phyB grown in FR+B were shown in both total leaf numbers (d) and days to bolting (e). All seeds were grown in regular LD for the first two days to induce germination before they were transferred to FR+B conditions. The center lines represent the medians. Box limits represent upper and lower quartiles. Whiskers indicate either the 1.5-times interquartile limit or the largest data point within the 1.5-times interquartile range, created by Tukey method using Graphpad prism software. Dots indicate outliers. n represents the number of plants analyzed. Different letters indicate statistically significantly different determined by one-way ANOVA test followed by Duncan’s MRT. (f) Relative expression levels of FT at ZT4 in Col-0 and phyA under LD, LD+FR, and eight-h-long R/FR adjustment treatment conditions. Data represent means ± SEM from five biological replicates. Different letters indicate statistically significantly different determined by one-way ANOVA test followed by Duncan’s MRT. The inset graph shows the enlarged view of the same FT values in phyA in the same order. (g) Flowering time of Col-0 and phyA grown in the conditions used in Fig. 4f. Plants were grown under these conditions from the beginning, and the results are total leaf numbers. Different letters indicate statistically significantly different determined by two-way ANOVA test followed by Tukey HSD.
To investigate the contribution of the HIR in FT induction, we grew plants in LD where 16 h of monochromatic FR were provided. In this condition, FT levels exhibited a small peak at ZT16, and this peak was reduced in phyA, but not in the phyB mutants (Figs S5a, b). This indicates that phyA induces FT expression in response to long FR irradiation. However, compared to LD+FR, very low FT levels in wild-type (WT) plants indicate that FT induction cannot be controlled only by long exposure of FR, consistent with the previous results showing the insufficient effect of FR by itself to induce flowering (Thomas & Vince-Prue, 1997). B light was very effective in inducing flowering (Brown & Klein, 1971). Also, the action spectra of HIR-induced inhibition of hypocotyl elongation of various etiolated seedlings have conserved spectrum maxima in both B and FR regions (Mancinelli, 1994). In addition, phyA can also absorb B light (Shinomura et al., 2000). We tested whether the combination of monochromatic FR and monochromatic B (FR+B) could induce similar FT expression profiles. FT expression patterns in LD with FR+B showed bimodal expression patterns resembling those in LD+FR. In addition, FT levels in phyA, but not in phyB, were reduced in both morning and evening (Figs 4c, S5c). The reduction of FT levels in phyA was more pronounced in the morning peak than in the evening. Consistent with the FT level differences, the phyA mutant showed a later flowering phenotype than both WT and phyB plants under the FR+B conditions (Figs 4d, e).
We next tested the effect of phyA on the morning FT expression when the supplementary FR light was given in the morning (LD+FR 0–8) or in the afternoon (LD+FR 8–16) (Fig. 4f). FT levels in phyA were lower than in WT in both conditions, indicating that phyA contributes in R/FR ratio sensing for morning FT induction throughout the day. However, FT levels in phyA in LD+FR 8–16, but not in LD+FR 0–8, were comparable with those in phyA in LD (Fig. 4f inset), suggesting that the R/FR information (R/FR=1) to induce morning FT is mainly perceived by phyA during the LD afternoon (ZT8–16). Flowering time experiments under these conditions revealed that WT plants grown in LD+FR 8–16 flowered at a similar time with the ones in LD+FR, while the ones grown in LD+FR 0–8 flowered slightly but significantly later than LD+FR (Figs 4g, S6). In addition, phyA mutants flowered almost at the same time as WT in LD, but later than WT in three LD+FR conditions examined, although leaf numbers of phyA were slightly larger than those of WT under these conditions (Figs 4g, S6). Taken all together, these results indicate that the morning peak of FT is controlled in part by an FR response controlled by phyA and FT level differences in both morning and afternoon likely contribute to the timing of flowering.
PIF7 is involved in the morning FT induction even under the R/FR conditions of an open field.
Recent reports showed that PIF7, with minor contributions of PIF4 and PIF5, was involved in the shade avoidance responses including flowering through the induction of FT in shade conditions (R/FR: ~0.2) (Li et al., 2012; Mizuno et al., 2015; Galvão et al., 2019; Zhang et al., 2019). Given that the morning FT levels showed an almost linear response to changes in R/FR ratios (Song et al., 2018), we hypothesized PIF7 may be involved in FT induction even under conditions where the R/FR ratio is c. 1. To test whether PIF7 and related PIFs are involved in the FT regulation through the HIR response, we analyzed the expression of FT in LD conditions with monochromatic FR and FR+B light. The FT levels in the pif7 and pif4pif5pif7 mutants were significantly lower than those in the WT plants grown in LD with FR+B in both ZT4 and ZT16 (Figs 5a, b). These results indicate that PIF7, likely together with PIF4 and PIF5, function as transcriptional activators of FT under the conditions where phyA induces FT transcription.
Fig. 5.

PIF7 was directly involved in FT induction in LD+FR. (a-d) Relative expression levels of FT in Col-0, pif7, pif4pif5, and pif4pif5pif7 at ZT4 and ZT16 under LD conditions with either FR alone or FR+B light (a, b) and under LD and LD+FR (c, d). Data represent means ± SEM from at least three biological replicates. Different letters indicate statistically significantly different determined by two-way ANOVA test followed by Tukey HSD. (e) Representative western blot images of PIF7–3HA protein present in nuclear enriched fractions in LD and LD+FR. Histone H3 signal is shown as a loading control. The non-phosphorylated PIF7 band is pointed by an arrowhead. The positions of marker proteins are indicated. (f) Quantification of non-phosphorylated PIF7–3HA protein amounts. Data are relative values of non-phosphorylated PIF7–3HA protein (pointed by the arrowhead) relative to those of Histone H3. Data represent means ± SEM from three biological replicates. *P <0.05 Student’s t-test. (g) A schematic diagram of FT locus. Positions of PIF7 binding cis-elements (G-box and PBE-box) and the regions amplified in PIF7 ChIP are indicated. (h, i) PIF7 ChIP results at ZT4 and ZT16 in LD and LD+FR. (h) Enrichment (%IP) of PIF7 on well-known PIF7 regulated genes (PIL1 and YUC8) comparing with the non-PIF7 target (PP2A). (i) Enrichment (%IP) of PIF7 on FT locus. The bars represent means superimposed with actual values from two biological replicates.
As PIF7 is likely involved in the morning induction of FT, we analyzed FT expression levels in pif7, pif4pif5, and pif4pif5pif7 mutants under LD and LD+FR conditions. FT levels in all the genotypes examined were roughly comparable at both ZT4 and ZT16 in LD (Figs 5c, d), consistent with the published result (Galvão et al., 2019). In LD+FR at ZT4, FT levels in pif7 but not in pif4pif5 were reduced, and was comparable those in pif4pif5pif7 mutant (Fig. 5c), suggesting that PIF7 contributes in the induction of morning FT in LD+FR. At ZT16, pif7 mutant showed reduced FT levels compared to Col-0 and pif4pif5, and mutations on PIF4 and PIF5 in pif7 mutant further reduced FT levels (Fig. 5d), indicating that PIF7 is a major activator, but PIF4 and PIF5 also contribute to FT regulation in the evening.
We next analyzed the flowering time of these mutants in LD and LD+FR. The pif7 mutants flowered later than the pif4pif5 mutants and the pif4pif5pif7mutants flowered latest in LD+FR (Fig. S7). These flowering phenotypes might correlate with FT levels in those plants. It must be noted however, that all pif mutants examined showed slightly delayed flowering in both LD and LD+FR, indicating that these PIFs may also regulate flowering time through other mechanisms than FT transcriptional regulation. Taken together, our results indicate that PIF7 is involved in FT induction even under natural (non-shade) LD conditions.
FR light enhances PIF7-binding to the FT genomic locus.
To explore a mechanism of PIF7-mediated FT induction in natural LD conditions, we examined whether PIF7 mRNA profiles changed between LD and LD+FR conditions. PIF7 mRNA levels peaked at ZT4 in LD as reported (Galvão et al., 2019), and no significant changes in PIF7 profiles were observed in LD+FR (Fig. S8a). As shade conditions affect the PIF7 protein function, we next analyzed PIF7 protein patterns using the pPIF7::PIF7–3HA/pif7 lines (Galvão et al., 2019). PIF7 protein started to accumulate after lights-on, peaked at ZT4, and then gradually reduced toward the end of the day in LD and there were no statistical differences in PIF7 protein profiles between LD and LD+FR (Figs S8b, c). The shade conditions de-phosphorylate PIF7, and dephosphorylated PIF7 accumulates in the nucleus (Huang et al., 2018). Therefore, we tested whether our LD+FR conditions affected the amount of nuclear localized PIF7. In nuclear-enriched samples, we still observed light-induced phosphorylation of PIF7 as observed in the total cell extract (Figs 5e, S8b). The amount of the faster PIF7 migrating band, likely an unphosphorylated form (Huang et al., 2018), was slightly higher at ZT4 in LD+FR conditions than in LD (Fig 5f).
We also analyzed whether the PIF7 binding affinity to the FT locus changes depending on the amount of FR by ChIP assay using PIF7 overexpression lines (35S:PIF7–6H3F). These PIF7 overexpression lines showed higher expression of FT and earlier flowering in both LD and LD+FR conditions (Fig. S9), indicating that the PIF7–6H3F protein is functional. We observed that PIF7 was significantly enriched at promoter regions of two well-characterized PIF7 target genes, PIL1 and YUC8 (Li et al., 2012) at ZT4 and ZT16 in LD+FR when compared to LD (Fig. 5h), indicating that the difference in the FR amounts between the two conditions was sufficient to change the DNA binding activity of PIF7 to target genes. PIF7 binds to G-boxes, CACGTG, and PBE-boxes, CA(TG/CA)TG, in vitro, and those motifs are enriched around 1.5 kb downstream of the FT gene (Galvão et al., 2019) (Fig. 5g). In addition, the FT downstream region is where PIF4 binds (Pedmale et al., 2016; Galvão et al., 2019). This region overlaps with the 3’ FT enhancer region known as Block E (Adrian et al., 2010). PIF4 also localizes near the FT transcriptional start site (TSS), although the TSS region does not contain either G-box or PBE-box sequences (Kumar et al., 2012). We observed that PIF7 was enriched more in LD+FR than in LD around the FT_C and FT_D regions where G-boxes and PBE-boxes exist, while it almost did not exist near the TSS regions (FT_A and FT_B) (Figs 5g, i). This result demonstrates that more PIF7 binds within the 3’ FT enhancer region in LD+FR. Taken all together, our results demonstrate that PIF7 directly induces FT under the R/FR conditions prevailing in natural light.
Discussion
The bimodal FT patterns are induced in longer day-length conditions, and morning and dusk peaks of FT are controlled by different light requirements.
Induction of both morning and dusk peaks of FT occurs under longer day-length conditions (>14 h) (Fig. 1). Although the expression levels of both peaks are affected by R/FR ratio changes (Song et al., 2018), they require different durations and time windows of the light conditions to be fully induced to the levels observed in the 16-h-LD+FR conditions (Fig. 6).
Fig. 6.

The morning and dusk expression of FT is controlled by two different light-dependent mechanisms. A model for the morning and dusk FT expression, which is induced by sunlight (R/FR=1) in LD, is shown. (a) To regulate FT levels around dusk, plants measure the R/FR ratio specifically in the late afternoon (around ZT12–14). Duration of light exposure does not affect the FT levels as long as it is longer than two h. This FT regulation fits the concept of the external coincidence model. (b) To induce FT in the morning, the cumulative exposure of R/FR light (started in the afternoon and continued to the next morning) determines the final levels of FT in the morning. PhyA plays an important role in this regulation, and the R/FR light conditions that plants experience by the end of the day may possibly be kept during the night by a slow thermal reversion of phyA Pfr until the next morning. This regulation has characteristics of phyA-mediated High Irradiance Response (HIR). PIF7 is directly involved in FT expression induction under natural light (R/FR=1) conditions.
Arabidopsis plants flower between March and July in natural environments and summer annuals usually flower later in the season than winter annuals (Thompson, 1994; Donohue, 2002; Wilczek et al., 2009; Pico, 2012; Song et al., 2018). In the latitudes ranging from 45 to 55 degrees north (where most Arabidopsis accessions originate), day length is 12 h in the middle of March and reaches 14 h in the middle of April. At the beginning of June, day length reaches 15.5 (45° N) – 17 (55° N) h. Based on these annually recurring day-length changes, Arabidopsis plants likely induce bimodal expression patterns of FT after the middle of April (Song et al., 2018). Diurnal temperature oscillations (or colder nighttime temperatures) repressed FT more strongly during the evening than in the morning (Song et al., 2018), resulting in morning expression of FT becoming the primary source of FT expression during spring. Florigen (i.e. FT) is thought to move through the phloem streaming (Friend, 1984). Phloem loading rates were estimated to strongly increase during the daytime due to active photosynthesis, while decrease during the night (Sellier & Mammeri, 2019). In addition, a recent report revealed that lower temperatures delayed flowering by hindering FT protein movement from the leaf companion cells where FT binds to membrane phospholipids (Susila et al., 2021). Ambient temperatures around morning and evening peaks of FT (ZT4 and ZT16) were similar during spring examined at least in Seattle, Zurich, and Edinburgh, although the trajectories of daily temperature changes after the time points were opposite (Song et al., 2018). Considering the presence of these diurnal and temperature-dependent mechanisms, initiating FT synthesis during the morning – in anticipation of the warming day – rather than around dusk to colder night, might prove more effective to transport FT to the shoot.
If expressing FT in the earlier part of the day might be more effective, what would be the role of FT expressed at dusk in Arabidopsis? The evening expression of FT may function as a booster of flowering particularly late in the season. Phloem loading is maintained throughout the night, albeit at a slower pace than during the day due to the controlled degradation of starch (Sellier & Mammeri, 2019). High-temperature stresses affect crucial reproductive processes (decreasing male fertility and increasing seed dormancy, etc. – interestingly, maternal FT is involved in controlling seed dormancy) (Yang et al., 2009; Chen, M et al., 2014). Therefore, to avoid unfavorable hot summer environments, having a boost of extra FT molecules in the late afternoon might provide the mechanism for Arabidopsis plants to hasten flowering.
The FT bimodal expression patterns are regulated by the external coincidence mechanisms and phyA-mediated HIR.
Both FT peaks are induced in response to the R/FR adjustment to 1 mainly when the change happens from afternoon to evening (Fig. 2); however, morning FT induction requires longer exposure than evening FT induction. The classical physiological studies showed that FR light treatment was more effective to induce flowering when it was given in the latter half of the long day (ZT8–16) than in the morning in LDP (Vince-Prue & Hall, 1975). We observed a similar tendency on our flowering time result of WT plants (Figs 4g, S6). The FT regulation we reported here could be the mechanism responsible for these observations. To increase FT levels around the dusk of LD, only two h of the R/FR adjustment treatment around late afternoon was sufficient (Fig. 2). This clearly shows that FR sensitivity is time-of-day dependent, and is likely regulated by the circadian clock, and this mechanism seems to be explained by the external coincidence model. Conversely, to fully induce the FT expression in the morning, a longer duration of the R/FR adjustment spanning from the afternoon to the next morning is required (Figs 2, 3). Although a strong correlation between FR exposure time and morning FT levels is observed (Fig. 4), there is still the least effective time window (ZT4–8) to induce FT in the morning (Fig. 2), indicating that the circadian clock also gates the light sensitivity for morning FT induction and that the FR-sensitive time windows differ between morning and evening FT expression.
Because both morning and evening FT peaks require the functional CO protein (Song et al., 2018), we predicted that the presence of CO might be a prerequisite for day-length-specific induction of FT in longer days. Although adjusting the R/FR ratio to 1 increased the CO stability in the morning, overall daily CO accumulation patterns in LD with or without the R/FR adjustments did not change drastically (Song et al., 2018). This indicates that another mechanism, in addition to changes in CO stability, must contribute to FT levels controlled by R/FR ratios. We proposed that the mechanism is phyA-dependent HIR (Fig. 6). PhyA is involved in the induction of the morning FT peak (Song et al., 2018). In addition, the expression levels of morning FT correlate with the durations of supplemental FR exposure (Fig. 4). Among the phyA-controlled responses, HIR has a unique characteristic that shows clear correlations between the durations/intensities of FR light and the strength of the responses. In addition, the FT levels in mornings became higher under lower R/FR ratios (Song et al., 2018). Thus, the morning FT induction mechanisms nicely fit the characteristics of the HIR. Our results indicate that phyA-dependent HIR contributes in FT regulation under various R/FR ratios existing in natural environments.
We also showed that PIF7, together with PIF4 and PIF5, is involved in the induction of both morning and evening peaks of FT in LD+FR. PhyA cannot physically bind to these PIFs (Castillon et al., 2007; Leivar et al., 2008); therefore, these PIFs likely do not work for FT induction downstream of phyA. We previously demonstrated that ELF3 negatively regulates the morning peak of FT (Song et al., 2018). ELF3 directly binds to both PIF7 and PIF4 and interferes with their DNA binding abilities (Nieto et al., 2015; Jiang et al., 2019), suggesting that PIF7 may regulate FT downstream of ELF3 under LD+FR conditions. The pif4pif5pif7 triple mutant flowered later than WT even under LD conditions where there is almost no FT expression difference in-between WT and pif4pif5pif7 (Figs 5, S7). This flowering phenotype may be caused by other PIF7-dependent regulation, such as controlling pri-MIR156E/F levels and/or TSF induction (Galvão et al., 2019; Zhang et al., 2019) or through uncharacterized function.
Although the contribution of the HIR to flowering in LDP has long been recognized, it also has been shown that irradiation of FR alone was less effective than FR+R or FR+white-light for inducing flowering (Vince-Prue, 1975). Brassicaceae plants, including Arabidopsis, have unique specificity to B to induce flowering in addition to FR (Brown & Klein, 1971). Our results showed that LD conditions with monochromatic FR+B showed robust bimodal FT expression patterns similar to the ones in LD+FR and that phyA is involved in its induction (Fig. 4). Unlike the other HIR observed in anthocyanin production and inhibition of hypocotyl growth (Mancinelli, 1994), FT expression and flowering induction require more than just FR light signals. B light photoreceptors, cry1, cry2, and FKF1, are involved in the induction of FT (Song et al., 2015). However, for the morning FT induction, these photoreceptors were not essential (Song et al., 2018). We speculated that the effects of B in the FR+B conditions could be through the activities of photosynthesis based on the following observations. The application of potent photosynthesis inhibitor DCMU or depriving CO2 during daytime inhibits LD induced flowering in LDP (Friend, 1984). In addition, Trehalose-6-phosphate (T6P), a signaling sugar molecule that mirrors the amount of photosynthate, is required for FT induction and flowering in LD in Arabidopsis (Wahl et al., 2013). Taken together, to fully understand the daily expression mechanism of FT and flowering, we might need to study more holistic mechanistic relationships of light signaling (such as the HIR), circadian clock, and possibly photosynthesis-related metabolic signaling.
Mechanisms inducing LD-specific bimodal gene expression patterns are likely conserved in angiosperms.
The contribution of the circadian clock and the HIR on seasonal reproductive responses in LDP is not limited to angiosperms. The bryophyte Marchantia polymorpha is an LDP that requires both LD and FR to generate sexual organs (Inoue et al., 2019). The seasonal sexual organ formation is regulated by HIR through phytochrome Mpphy and its downstream MpPIF transcription factor (Inoue et al., 2019). Although the underlying mechanisms are still largely unknown, these findings indicate that LDP angiosperms may have maintained the circadian clock-HIR combinatorial day-length sensing mechanisms developed at the basal lineage of the land plants, and serving to incorporate LD information into the equivalent processes of reproductive transitions.
If the circadian clock-HIR day-length sensing mechanisms were derived from bryophytes, can we observe similar LD bimodal expression patterns in FT homologs other than in Arabidopsis? Although the diurnal expression patterns of FT homologs were not always described, at least FT1 from wheat (LDP) (Chen, A et al., 2014), FT2 from hybrid aspen (LDP) (Ding et al., 2021), MtFTb1 and MtFTb2 from Medicago (LDP) (Laurie et al., 2011), FvFT1 from LD flowering strawberry (Kurokura et al., 2017), and SlSP5G2 from tomato (day-neutral plant) (Cao et al., 2015), all showed LD specific induction with ZT4 and ZT16 (or dusk) peaks. Interestingly, other important flowering regulators also showed similar bimodal expression patterns. In soybean (SDP), the most important maturity (=i.e. flowering and seed set) locus among domesticated cultivars is called E1 (Bernard, 1971), which encodes a direct transcriptional repressor of GmFT2a and GmFT5a (Xia et al., 2012). The expression patterns of E1 and its two homologs, E1-Like a (E1La) and E1Lb showed LD specific bimodal expression patterns (Xu et al., 2015), similar to that of Arabidopsis FT. In addition, the other two major maturity loci E3 and E4 turned out to be the mutations in GmPHYA (GmPHYA3 and GmPHYA2) genes, and they are important for induction of the E1 gene in LD (Abe et al., 2003). These results indicate that soybean plants utilize the same long-day specific phyA-dependent regulatory mechanisms to express the repressors of florigen in LD, and flower in SD. These results indicate that the circadian clock-HIR day-length sensing modules were originally developed early in a land plant lineage and have been utilized by angiosperms to differentiate reproductive developmental programs in LD. Thus, studying the regulatory mechanisms of a bimodal expression of FT in Arabidopsis will likely provide a molecular framework for understanding LD-specific events in plants.
Supplementary Material
Fig. S1 Individual FT values and stats for Fig. 1.
Fig. S2 Plants completely adjust FT expression profiles after full 3d of exposure with R/FR ratio adjusted light.
Fig. S3 PIL1 expression at ZT4 and ZT16 under various R/FR ratio adjusted conditions.
Fig. S4 The morning FT expression level was affected by the R/FR ratio of the previous day.
Fig. S5 FT expression patterns, individual FT values, and stats in plants grown in long days with monochromatic FR or FR+B.
Fig. S6 Flowering time of Col-0 and phyA in LD, LD+FR 0–8, LD+FR 8–16, and LD+FR conditions measured by days to bolting.
Fig. S7 Flowering time of Col-0, pif4pif5, pif7, and pif4pif5pif7 in LD and LD+FR conditions measured by total leaf number and days to bolting.
Fig. S8 PIF7 mRNA and PIF7 protein expression profiles in LD and LD+FR conditions.
Fig. S9 The 35S: PIF7–6H3F transgenic lines are functional.
Table S1 Primers used in this study.
Acknowledgements
This work is supported by grants from NRF-2021R1A4A1032888 to Y.H.S., MEXT KAKENHI (19H05674 and 19H05670) to M.E., JSPS KAKENHI (19K16170) and Mitsubishi Foundation Research Grants to A.K., and National Institute of Health (R01GM079712) and MEXT KAKENHI (20H05910 and 22H04978) to T.I.
Footnotes
Competing interests: None declared.
Data availability:
The data supporting this work’s findings are available within the manuscript and its Supporting Information files.
References
- Abe J, Xu DH, Miyano A, Komatsu K, Kanazawa A, Shimamoto Y. 2003. Photoperiod-insensitive Japanese soybean landraces differ at two maturity loci. Crop Science 43(4): 1300–1304. [Google Scholar]
- Adrian J, Farrona S, Reimer JJ, Albani MC, Coupland G, Turck F. 2010. cis-Regulatory elements and chromatin state coordinately control temporal and spatial expression of FLOWERING LOCUS T in Arabidopsis. Plant Cell 22(5): 1425–1440. [DOI] [PMC free article] [PubMed] [Google Scholar]
- Bennett T, Dixon LE. 2021. Asymmetric expansions of FT and TFL1 lineages characterize differential evolution of the EuPEBP family in the major angiosperm lineages. BMC Biol 19(1): 181. [DOI] [PMC free article] [PubMed] [Google Scholar]
- Bernard RL. 1971. Two major genes for time of flowering and maturity in soybeans. Crop Science 11(2): 242–244. [Google Scholar]
- Brown JA, Klein WH. 1971. Photomorphogenesis in Arabidopsis thaliana (L.) Heynh: threshold intensities and blue-far-red synergism in floral induction. Plant Physiology 47(3): 393–399. [DOI] [PMC free article] [PubMed] [Google Scholar]
- Cao K, Cui L, Zhou X, Ye L, Zou Z, Deng S. 2015. Four tomato FLOWERING LOCUS T-like proteins act antagonistically to regulate floral initiation. Front Plant Sci 6: 1213. [DOI] [PMC free article] [PubMed] [Google Scholar]
- Castillon A, Shen H, Huq E. 2007. Phytochrome Interacting Factors: central players in phytochrome-mediated light signaling networks. Trends Plant Sci 12(11): 514–521. [DOI] [PubMed] [Google Scholar]
- Chen A, Li C, Hu W, Lau MY, Lin H, Rockwell NC, Martin SS, Jernstedt JA, Lagarias JC, Dubcovsky J. 2014. PHYTOCHROME C plays a major role in the acceleration of wheat flowering under long-day photoperiod. Proc Natl Acad Sci U S A 111(28): 10037–10044. [DOI] [PMC free article] [PubMed] [Google Scholar]
- Chen M, MacGregor DR, Dave A, Florance H, Moore K, Paszkiewicz K, Smirnoff N, Graham IA, Penfield S. 2014. Maternal temperature history activates Flowering Locus T in fruits to control progeny dormancy according to time of year. Proc Natl Acad Sci U S A 111(52): 18787–18792. [DOI] [PMC free article] [PubMed] [Google Scholar]
- Cockshull KE 1984. The photoperiodic induction of flowering in short-day plants. In: Vince-Prue D, Thomas B, Cockshull KE eds. Light and the flowering process. London: Academic press, 33–49. [Google Scholar]
- Corbesier L, Vincent C, Jang S, Fornara F, Fan Q, Searle I, Giakountis A, Farrona S, Gissot L, Turnbull C, et al. 2007. FT protein movement contributes to long-distance signaling in floral induction of Arabidopsis. Science 316(5827): 1030–1033. [DOI] [PubMed] [Google Scholar]
- de Montaigu A, Toth R, Coupland G. 2010. Plant development goes like clockwork. Trends Genet 26(7): 296–306. [DOI] [PubMed] [Google Scholar]
- Deitzer GF 1984. Photoperiodic induction in long-day plants. In: Vince-Prue D, Thomas B, Cockshull KE eds. Light and the flowering process. London: Academic press, 51–63. [Google Scholar]
- Ding J, Zhang B, Li Y, Andre D, Nilsson O. 2021. Phytochrome B and PHYTOCHROME INTERACTING FACTOR8 modulate seasonal growth in trees. New Phytol 232(6): 2339–2352. [DOI] [PubMed] [Google Scholar]
- Donohue K 2002. Germination timing influences natural selection on life-history characters in Arabidopsis thaliana. Ecology 83(4): 1006–1016. [Google Scholar]
- Friend DJC 1984. The interaction of photosynthesis and photoperiodism in induction. In: Vince-Prue D, Thomas B, Cockshull KE eds. Light and the flowering process. London: Academic press, 257–275. [Google Scholar]
- Galvão VC, Fiorucci AS, Trevisan M, Franco-Zorilla JM, Goyal A, Schmid-Siegert E, Solano R, Fankhauser C. 2019. PIF transcription factors link a neighbor threat cue to accelerated reproduction in Arabidopsis. Nat Commun 10(1): 4005. [DOI] [PMC free article] [PubMed] [Google Scholar]
- Garner WW. 1933. Comparative responses of long-day and short-day plants to relative length of day and night. Plant Physiology 8: 347–356. [DOI] [PMC free article] [PubMed] [Google Scholar]
- Hendricks SB. 1960. Rates of change of phytochrome as an essential factor determining photoperiodism in plants. Cold Spring Harb Symp Quant Biol 25: 245–248. [DOI] [PubMed] [Google Scholar]
- Huang X, Zhang Q, Jiang Y, Yang C, Wang Q, Li L. 2018. Shade-induced nuclear localization of PIF7 is regulated by phosphorylation and 14–3-3 proteins in Arabidopsis. Elife 7. [DOI] [PMC free article] [PubMed] [Google Scholar]
- Inoue K, Nishihama R, Araki T, Kohchi T. 2019. Reproductive induction is a far-red high irradiance response that is mediated by phytochrome and PHYTOCHROME INTERACTING FACTOR in Marchantia polymorpha. Plant Cell Physiol 60(5): 1136–1145. [DOI] [PubMed] [Google Scholar]
- Jackson S, Thomas B. 1997. Photoreceptors and signals in the photoperiodic control of development. Plant Cell Environ 20: 790–795. [Google Scholar]
- Jiang Y, Yang C, Huang S, Xie F, Xu Y, Liu C, Li L. 2019. The ELF3-PIF7 interaction mediates the circadian gating of the shade response in Arabidopsis. iScience 22: 288–298. [DOI] [PMC free article] [PubMed] [Google Scholar]
- Jin S, Nasim Z, Susila H, Ahn JH. 2021. Evolution and functional diversification of FLOWERING LOCUS T/TERMINAL FLOWER 1 family genes in plants. Semin Cell Dev Biol 109: 20–30. [DOI] [PubMed] [Google Scholar]
- Johnson E, Bradley M, Harberd NP, Whitelam GC. 1994. Photoresponses of light-grown phyA mutants of Arabidopsis (Phytochrome A is required for the perception of daylength extensions). Plant Physiology 105(1): 141–149. [DOI] [PMC free article] [PubMed] [Google Scholar]
- Karimi M, Inze D, Depicker A. 2002. GATEWAY vectors for Agrobacterium-mediated plant transformation. Trends Plant Sci 7(5): 193–195. [DOI] [PubMed] [Google Scholar]
- Kinmonth-Schultz HA, Tong X, Lee J, Song YH, Ito S, Kim SH, Imaizumi T. 2016. Cool night-time temperatures induce the expression of CONSTANS and FLOWERING LOCUS T to regulate flowering in Arabidopsis. New Phytol 211(1): 208–224. [DOI] [PMC free article] [PubMed] [Google Scholar]
- Krzymuski M, Andres F, Cagnola JI, Jang S, Yanovsky MJ, Coupland G, Casal JJ. 2015. The dynamics of FLOWERING LOCUS T expression encodes long-day information. Plant J 83(6): 952–961. [DOI] [PubMed] [Google Scholar]
- Kumar SV, Lucyshyn D, Jaeger KE, Alos E, Alvey E, Harberd NP, Wigge PA. 2012. Transcription factor PIF4 controls the thermosensory activation of flowering. Nature 484(7393): 242–245. [DOI] [PMC free article] [PubMed] [Google Scholar]
- Kurokura T, Samad S, Koskela E, Mouhu K, Hytonen T. 2017. Fragaria vesca CONSTANS controls photoperiodic flowering and vegetative development. J Exp Bot 68(17): 4839–4850. [DOI] [PMC free article] [PubMed] [Google Scholar]
- Laurie RE, Diwadkar P, Jaudal M, Zhang L, Hecht V, Wen J, Tadege M, Mysore KS, Putterill J, Weller JL, et al. 2011. The medicago FLOWERING LOCUS T homolog, MtFTa1, is a key regulator of flowering time. Plant Physiology 156(4): 2207–2224. [DOI] [PMC free article] [PubMed] [Google Scholar]
- Leivar P, Monte E, Al-Sady B, Carle C, Storer A, Alonso JM, Ecker JR, Quail PH. 2008. The Arabidopsis phytochrome-interacting factor PIF7, together with PIF3 and PIF4, regulates responses to prolonged red light by modulating phyB levels. Plant Cell 20(2): 337–352. [DOI] [PMC free article] [PubMed] [Google Scholar]
- Li L, Ljung K, Breton G, Schmitz RJ, Pruneda-Paz J, Cowing-Zitron C, Cole BJ, Ivans LJ, Pedmale UV, Jung HS, et al. 2012. Linking photoreceptor excitation to changes in plant architecture. Genes Dev 26(8): 785–790. [DOI] [PMC free article] [PubMed] [Google Scholar]
- Mancinelli AL 1994. The physiology of phytochrome action. In: Kendrick RE, Kronenberg GHM eds. Photomorphogenesis in plants. Dordrecht: Kluwer academic publishers, 211–269. [Google Scholar]
- Mizuno T, Oka H, Yoshimura F, Ishida K, Yamashino T. 2015. Insight into the mechanism of end-of-day far-red light (EODFR)-induced shade avoidance responses in Arabidopsis thaliana. Biosci Biotechnol Biochem 79(12): 1987–1994. [DOI] [PubMed] [Google Scholar]
- Nagatani A, Reed JW, Chory J. 1993. Isolation and initial characterization of Arabidopsis mutants that are deficient in phytochrome A. Plant Physiology 102(1): 269–277. [DOI] [PMC free article] [PubMed] [Google Scholar]
- Nieto C, Lopez-Salmeron V, Daviere JM, Prat S. 2015. ELF3-PIF4 interaction regulates plant growth independently of the Evening Complex. Curr Biol 25(2): 187–193. [DOI] [PubMed] [Google Scholar]
- Pedmale UV, Huang SC, Zander M, Cole BJ, Hetzel J, Ljung K, Reis PAB, Sridevi P, Nito K, Nery JR, et al. 2016. Cryptochromes interact directly with PIFs to control plant growth in limiting blue light. Cell 164(1–2): 233–245. [DOI] [PMC free article] [PubMed] [Google Scholar]
- Pico FX. 2012. Demographic fate of Arabidopsis thaliana cohorts of autumn- and spring-germinated plants along an altitudinal gradient. Journal of Ecology 100(4): 1009–1018. [Google Scholar]
- Pittendrigh CS, Minis DH. 1964. The entrainment of circadian oscillations by light and their role as photoperiodic clocks. Am Nat(98): 261–294. [Google Scholar]
- Salazar JD, Saithong T, Brown PE, Foreman J, Locke JC, Halliday KJ, Carre IA, Rand DA, Millar AJ. 2009. Prediction of photoperiodic regulators from quantitative gene circuit models. Cell 139(6): 1170–1179. [DOI] [PubMed] [Google Scholar]
- Salter MG, Franklin KA, Whitelam GC. 2003. Gating of the rapid shade-avoidance response by the circadian clock in plants. Nature 426(6967): 680–683. [DOI] [PubMed] [Google Scholar]
- Sellier D, Mammeri Y. 2019. Diurnal dynamics of phloem loading: theoretical consequences for transport efficiency and flow characteristics. Tree Physiol 39(2): 300–311. [DOI] [PubMed] [Google Scholar]
- Shinomura T, Uchida K, Furuya M. 2000. Elementary processes of photoperception by phytochrome A for high-irradiance response of hypocotyl elongation in Arabidopsis. Plant Physiology 122(1): 147–156. [DOI] [PMC free article] [PubMed] [Google Scholar]
- Smith H, Holmes MG. 1975. The function of phytochrome in plants growing in the natural environment. Nature 254: 512–514. [Google Scholar]
- Song YH, Kubota A, Kwon MS, Covington MF, Lee N, Taagen ER, Laboy Cintron D, Hwang DY, Akiyama R, Hodge SK, et al. 2018. Molecular basis of flowering under natural long-day conditions in Arabidopsis. Nat Plants 4(10): 824–835. [DOI] [PMC free article] [PubMed] [Google Scholar]
- Song YH, Shim JS, Kinmonth-Schultz HA, Imaizumi T. 2015. Photoperiodic flowering: time measurement mechanisms in leaves. Annu Rev Plant Biol 66: 441–464. [DOI] [PMC free article] [PubMed] [Google Scholar]
- Song YH, Smith RW, To BJ, Millar AJ, Imaizumi T. 2012. FKF1 conveys timing information for CONSTANS stabilization in photoperiodic flowering. Science 336(6084): 1045–1049. [DOI] [PMC free article] [PubMed] [Google Scholar]
- Susila H, Juric S, Liu L, Gawarecka K, Chung KS, Jin S, Kim SJ, Nasim Z, Youn G, Suh MC, et al. 2021. Florigen sequestration in cellular membranes modulates temperature-responsive flowering. Science 373(6559): 1137–1142. [DOI] [PubMed] [Google Scholar]
- Tamaki S, Matsuo S, Wong HL, Yokoi S, Shimamoto K. 2007. Hd3a protein is a mobile flowering signal in rice. Science 316(5827): 1033–1036. [DOI] [PubMed] [Google Scholar]
- Thomas B, Vince-Prue D. 1997. Photoperiodism in plants. London: Academic press. [Google Scholar]
- Thompson L 1994. The spatiotemporal effects of nitrogen and litter on the population-dynamics of Arabidopsis thaliana. Journal of Ecology 82(1): 63–68. [Google Scholar]
- Turck F, Fornara F, Coupland G. 2008. Regulation and identity of florigen: FLOWERING LOCUS T moves center stage. Annu Rev Plant Biol 59: 573–594. [DOI] [PubMed] [Google Scholar]
- Valverde F, Mouradov A, Soppe W, Ravenscroft D, Samach A, Coupland G. 2004. Photoreceptor regulation of CONSTANS protein in photoperiodic flowering. Science 303(5660): 1003–1006. [DOI] [PubMed] [Google Scholar]
- Vince-Prue D 1975. Photoperiodism in plants. Maidenhead: McGraw-Hill Book Company. [Google Scholar]
- Vince-Prue D, Hall DO. 1975. International co-operation in photobiology. Photochem Photobiol 22(1–2): 77–82. [DOI] [PubMed] [Google Scholar]
- Wahl V, Ponnu J, Schlereth A, Arrivault S, Langenecker T, Franke A, Feil R, Lunn JE, Stitt M, Schmid M. 2013. Regulation of flowering by trehalose-6-phosphate signaling in Arabidopsis thaliana. Science 339(6120): 704–707. [DOI] [PubMed] [Google Scholar]
- Wang T, Guo J, Peng Y, Lyu X, Liu B, Sun S, Wang X. 2021. Light-induced mobile factors from shoots regulate rhizobium-triggered soybean root nodulation. Science 374(6563): 65–71. [DOI] [PubMed] [Google Scholar]
- Wilczek AM, Roe JL, Knapp MC, Cooper MD, Lopez-Gallego C, Martin LJ, Muir CD, Sim S, Walker A, Anderson J, et al. 2009. Effects of genetic perturbation on seasonal life history plasticity. Science 323(5916): 930–934. [DOI] [PubMed] [Google Scholar]
- Xia Z, Watanabe S, Yamada T, Tsubokura Y, Nakashima H, Zhai H, Anai T, Sato S, Yamazaki T, Lu S, et al. 2012. Positional cloning and characterization reveal the molecular basis for soybean maturity locus E1 that regulates photoperiodic flowering. Proc Natl Acad Sci U S A 109(32): E2155–2164. [DOI] [PMC free article] [PubMed] [Google Scholar]
- Xu ML, Yamagishi N, Zhao C, Takeshima R, Kasai M, Watanabe S, Kanazawa A, Yoshikawa N, Liu BH, Yamada T, et al. 2015. The soybean-specific maturity gene E1 family of floral repressors controls night-break responses through down-regulation of FLOWERING LOCUS T orthologs. Plant Physiology 168(4): 1735–U1080. [DOI] [PMC free article] [PubMed] [Google Scholar]
- Yang KZ, Xia C, Liu XL, Dou XY, Wang W, Chen LQ, Zhang XQ, Xie LF, He L, Ma X, et al. 2009. A mutation in THERMOSENSITIVE MALE STERILE 1, encoding a heat shock protein with DnaJ and PDI domains, leads to thermosensitive gametophytic male sterility in Arabidopsis. Plant J 57(5): 870–882. [DOI] [PubMed] [Google Scholar]
- Zeevaart JA. 2006. Florigen coming of age after 70 years. Plant Cell 18(8): 1783–1789. [DOI] [PMC free article] [PubMed] [Google Scholar]
- Zhang R, Yang C, Jiang Y, Li L. 2019. A PIF7-CONSTANS-centered molecular regulatory network underlying shade-accelerated flowering. Mol Plant 12(12): 1587–1597. [DOI] [PubMed] [Google Scholar]
- Zhu Y, Klasfeld S, Wagner D. 2021. Molecular regulation of plant developmental transitions and plant architecture via PEPB family proteins: an update on mechanism of action. J Exp Bot 72(7): 2301–2311. [DOI] [PubMed] [Google Scholar]
Associated Data
This section collects any data citations, data availability statements, or supplementary materials included in this article.
Supplementary Materials
Fig. S1 Individual FT values and stats for Fig. 1.
Fig. S2 Plants completely adjust FT expression profiles after full 3d of exposure with R/FR ratio adjusted light.
Fig. S3 PIL1 expression at ZT4 and ZT16 under various R/FR ratio adjusted conditions.
Fig. S4 The morning FT expression level was affected by the R/FR ratio of the previous day.
Fig. S5 FT expression patterns, individual FT values, and stats in plants grown in long days with monochromatic FR or FR+B.
Fig. S6 Flowering time of Col-0 and phyA in LD, LD+FR 0–8, LD+FR 8–16, and LD+FR conditions measured by days to bolting.
Fig. S7 Flowering time of Col-0, pif4pif5, pif7, and pif4pif5pif7 in LD and LD+FR conditions measured by total leaf number and days to bolting.
Fig. S8 PIF7 mRNA and PIF7 protein expression profiles in LD and LD+FR conditions.
Fig. S9 The 35S: PIF7–6H3F transgenic lines are functional.
Table S1 Primers used in this study.
Data Availability Statement
The data supporting this work’s findings are available within the manuscript and its Supporting Information files.