Abstract
Purpose
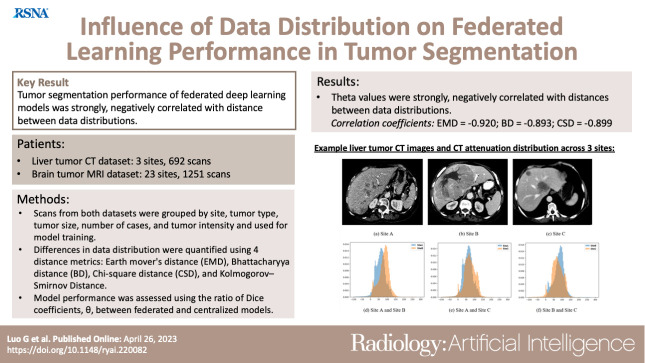
To investigate the correlation between differences in data distributions and federated deep learning (Fed-DL) algorithm performance in tumor segmentation on CT and MR images.
Materials and Methods
Two Fed-DL datasets were retrospectively collected (from November 2020 to December 2021): one dataset of liver tumor CT images (Federated Imaging in Liver Tumor Segmentation [or, FILTS]; three sites, 692 scans) and one publicly available dataset of brain tumor MR images (Federated Tumor Segmentation [or, FeTS]; 23 sites, 1251 scans). Scans from both datasets were grouped according to site, tumor type, tumor size, dataset size, and tumor intensity. To quantify differences in data distributions, the following four distance metrics were calculated: earth mover’s distance (EMD), Bhattacharyya distance (BD), χ2 distance (CSD), and Kolmogorov-Smirnov distance (KSD). Both federated and centralized nnU-Net models were trained by using the same grouped datasets. Fed-DL model performance was evaluated by using the ratio of Dice coefficients, θ, between federated and centralized models trained and tested on the same 80:20 split datasets.
Results
The Dice coefficient ratio (θ) between federated and centralized models was strongly negatively correlated with the distances between data distributions, with correlation coefficients of −0.920 for EMD, −0.893 for BD, and −0.899 for CSD. However, KSD was weakly correlated with θ, with a correlation coefficient of −0.479.
Conclusion
Performance of Fed-DL models in tumor segmentation on CT and MRI datasets was strongly negatively correlated with the distances between data distributions.
Keywords: CT, Abdomen/GI, Liver, Comparative Studies, MR Imaging, Brain/Brain Stem, Convolutional Neural Network (CNN), Federated Deep Learning, Tumor Segmentation, Data Distribution
Supplemental material is available for this article.
© RSNA, 2023
See also the commentary by Kwak and Bai in this issue.
Keywords: CT, Abdomen/GI, Liver, Comparative Studies, MR Imaging, Brain/Brain Stem, Convolutional Neural Network (CNN), Federated Deep Learning, Tumor Segmentation, Data Distribution
Summary
Federated deep learning model performance in tumor segmentation on CT and MR images was affected by differences in data distributions, being strongly negatively correlated with the distance between data distributions.
Key Points
■ The Dice coefficient ratio between federated and centralized models (θ) was strongly negatively correlated to earth mover’s distance (EMD) (r = −0.920), Bhattacharyya distance (BD) (r = −0.893), and χ2 distance (CSD) (r = −0.899) values between data distributions, indicating that federated deep learning model performance in tumor segmentation on CT and MR images decreases as distance between datasets increases.
■ Data distributions of federated models with significantly different performances (P < .05) from centralized models had significantly higher distances (EMD, BD, and CSD) than those of federated models showing no difference in performance.
Introduction
Over the past decade, deep learning (DL) has been successfully applied in various medical imaging applications, such as tumor segmentation (1). However, state-of-the-art performance of DL models depends largely on the use of diverse training data. The establishment of a centralized, large-scale, multi-institutional labeled medical imaging dataset is not only challenging and costly, but compliance with General Data Protection Regulation and Health Insurance Portability and Accountability Act guidelines is often associated with various legal, privacy, security, and data ownership obstacles (2).
One way to overcome these obstacles is through federated deep learning (Fed-DL) (3,4), in which model training is distributed among multiple sites by exchanging model data instead of raw patient data via the network, decoupling the need for a centralized dataset. Several recent works (5–7) have demonstrated that Fed-DL provides a promising solution to training DL models while protecting patient privacy. Current Fed-DL research focuses mainly on algorithm performance evaluation between centralized and federated trained models. For instance, Sheller et al (8) demonstrated that Fed-DL could achieve similar performance to centralized models when data were split and distributed among 10 sites. Lee and Shin (9) showed similar findings using an imbalanced number of scans among sites. However, little is known regarding the impact of data differences on Fed-DL model performance in tumor segmentation.
In general, Fed-DL requires that data distributions among sites are independent and identically distributed (IID) to achieve comparable performance to that of a centralized model. However, real-world datasets are often non-IID because of differences in factors such as disease manifestation, imaging protocols, or patient populations, leading to potential degradation of model performance. Zhao et al (10) reported that the accuracy of federated models decreased when the earth mover’s distance (EMD) of non-IID natural image datasets increased, but the authors did not compare federated and centralized models. To provide a benchmark for the evaluation of Fed-DL models to differences in data distribution, the Radiological Society of North America (RSNA) launched the first Federated Tumor Segmentation (FeTS) challenge in 2021 focusing on segmentation of brain tumors by using MRI (11).
The purpose of our study was to investigate the correlation between the distance of data distributions and the performance of Fed-DL models in tumor segmentation on CT and MR images. To the best of our knowledge, this is the first systematic study focusing on the impact of data difference on Fed-DL performance in tumor segmentation. Our specific aims were as follows: (a) build a large multi-institutional hepatic CT dataset for benchmarking Fed-DL performance in liver tumor segmentation, (b) calculate quantitative metrics for measuring the distance (difference) between data distributions, and (c) investigate the correlation between the distances of data distributions and the performances of Fed-DL in tumor segmentation.
Materials and Methods
This retrospective, Health Insurance Portability and Accountability Act–compliant study was approved by the institutional review board for data analysis of internal and external datasets collected at the involved sites, and the need for patient informed consent was waived. All Digital Imaging and Communications in Medicine images were de-identified at the original institutions before being transferred to our study.
Liver Tumor CT Dataset
We established a hepatic CT dataset for the training and validation of Fed-DL models of liver tumor segmentation, which we named Federated Imaging of Liver Tumor Segmentation (FILTS).
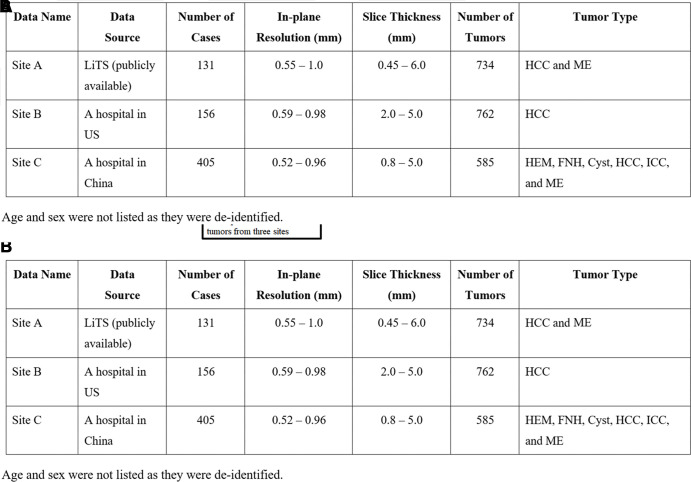
For the construction of FILTS, we retrospectively collected 692 hepatic contrast-enhanced CT scans from three sites, including 131 scans from the Liver Tumor Segmentation (LiTS) challenge (site A, Europe) (12), 156 scans from Massachusetts General Hospital (site B, the United States), and 405 scans from the Second Affiliated Hospital at Zhejiang University School of Medicine (site C, China). All scans at site B and site C were collected for liver tumor segmentation. The inclusion criteria were as follows: (a) at least one focal liver lesion diagnosed using CT, (b) confirmation of malignant tumors with corresponding pathology reports, and (c) diagnosis of benign lesions through pathologic analyses or a combination of typical image performance and clinical data. As a result, 15 scans that did not contain any focal liver lesions were excluded (Fig 1A). The collected scans were acquired by using different imaging protocols with CT scanners by various manufacturers (GE, Siemens, and Philips), with a largely varying in-plane resolution from 0.52 mm to 1.0 mm and section thickness from 0.45 mm to 6.0 mm (Fig 1B).
Figure 1:
(A) Selection criteria and (B) characteristics for the Federated Imaging in Liver Tumor Segmentation (FILTS) dataset. FNH = focal nodular hyperplasia, HCC = hepatocellular carcinoma, HEM = hemangioma, ICC = intrahepatic cholangiocarcinoma, LiTS = Liver Tumor Segmentation, ME = metastases.
LiTS is a publicly available liver CT dataset (https://competitions.codalab.org/competitions/17094), which was collected from seven hospitals and research institutions in Europe. As the institute information of each scan was removed, we treated LiTS as site A with heterogeneous scans. LiTS only provides portal venous phase liver CT images, which were acquired with different CT scanners and acquisition protocols. The primary and secondary tumor types in LiTS are hepatocellular carcinoma (HCC) and metastases. The segmentations provided by LiTS were reviewed by a senior radiologist (with >10 years of experience in abdominal CT reading). In total, 734 tumors with an average size of 13.6 cm3 were annotated, and 75% of these tumors were smaller than 5 cm3.
Site B data were mainly HCC scans collected from September 2005 to August 2015 at Massachusetts General Hospital, acquired with CT scanners by two manufacturers (Siemens and GE). Three hepatic phases of CT images were collected: arterial, portal venous, and delayed phase. Tumors were contoured in portal venous phase with reference to arterial phase on open software, 3D Quantitative Imaging (3DQI, version 1.0; https://3dqi.mgh.harvard.edu) by one junior radiologist (with 3 years of experience) and confirmed by the senior radiologist. In total, 762 tumors with an average size of 61.4 cm3 were contoured.
Site C data were hepatic CT scans collected from January 2016 to December 2018 at the Second Affiliated Hospital at Zhejiang University School of Medicine, including three types of benign liver tumors (focal nodular hyperplasia [FNH], hemangioma, and cysts) and three types of malignant liver tumors (HCC, metastases, and intrahepatic cholangiocarcinoma). Precontrast, arterial, and portal venous phase images, acquired with CT scanners by three manufacturers (Siemens, GE, and Philips), were collected. Tumors were contoured by one junior radiologist (with 5 years of experience) using open-source software (ITK-SNAP) (13) and confirmed by the senior radiologist. In total, 585 tumors with an average size of 38.2 cm3 were contoured.
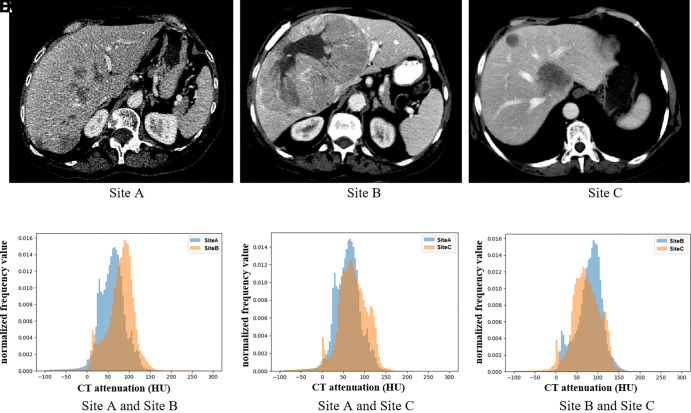
Figure 2 compares three examples of CT scans from each of the three sites and CT attenuation distributions (histograms) of tumors among the three sites.
Figure 2:
(A–C) Example axial CT images of liver tumors at different sites, and (D–F) histograms show differences in CT attenuation distribution across the three sites.
Brain Tumor MRI Dataset
The FeTS 2021 dataset (11) is the first Fed-DL medical image dataset (http://www.synapse.org/brats), which was collected from multiple sites with different clinical protocols and contains 1251 total scans (with both images and segmentations). FeTS consists of a subset of glioblastoma scans from the Brain Tumor Segmentation dataset (14) containing institutional information and an additional collection of glioblastoma scans from other independent institutions. Each scan in FeTS includes four sequences (pre- and postcontrast T1 weighted, T2 weighted, and T2 fluid-attenuated inversion recovery). These scans have been preprocessed using the same steps, including coregistration, resampling (1 × 1 × 1 mm), and skull stripping. Tumors were contoured by one to four readers sharing the same contouring standard and were then confirmed by experienced neuroradiologists. For our study, we performed segmentation of glioblastoma on postcontrast T1 images, which includes the nonenhancing tumor (NET) and enhancing tumor (ET) regions. Because FeTS contains only glioblastoma data (grade 4 glioma), we additionally collected scans of three types of diffuse glioma (astrocytoma, glioblastoma, oligodendroglioma), which were histopathologically proven grade 2–4 tumors, from the newly published University of California San Francisco Preoperative Diffuse Glioma MRI (UCSF-PDGM) dataset (15) to study the impact of different types of glioma on Fed-DL performance. A total of 500 postcontrast T1-weighted MRI scans were added to our study.
Data Grouping
We grouped each of the FILTS and FeTS datasets according to site, tumor type, tumor size, dataset size, and tumor attenuation (CT) or intensity (MRI) for the evaluation of Fed-DL model performance on different types of data distribution. Tumor intensity is the normalized MRI signal intensity (z score) of tumors.
Group 1: Different sites.— In FILTS, three subsets were treated as being from three different sites. Portal venous phase CT scans were selected, as this was the only image type provided by site A. In FeTS, we selected the three sites that provided more than 40 scans (site 1: 512 scans, site 4: 47 scans, and site 18: 382 scans). Sites with a small number of scans were not considered, as they could introduce high bias.
Group 2: Different tumor types.— In FILTS, we grouped hepatic CT images at site C according to six types of liver tumors: hemangioma, FNH, cyst, HCC, intrahepatic cholangiocarcinoma, and metastases. Arterial phase CT scans were selected as certain liver tumor types, such as HCC and FNH, are better visualized in arterial phase than in portal venous phase at CT. In FeTS, the MRI scans added from UCSF-PDGM were grouped into three subsets on the basis of the three types of diffuse gliomas.
Group 3: Different tumor sizes.— In FILTS, we grouped all scans into four subsets corresponding to tumor size thresholds of less than or equal to 15 cm3, greater than 15 cm3 and less than or equal to 50 cm3, greater than 50 cm3 and less than or equal to 130 cm3, and greater than 130 cm3. In FeTS, we grouped all scans from the two largest institutions into six subsets by using thresholds of less than or equal to 3 cm3, greater than 3 cm3 and less than or equal to 10 cm3, and greater than 10 cm3 for site 1 and less than or equal to 2 cm3, greater than 2 cm3 and less than or equal to 12 cm3, and greater than 12 cm3 for site 18, respectively. We chose different thresholds to keep the number of scans in each subset balanced.
Group 4: Different dataset sizes.— To assess the effect of imbalanced training datasets on Fed-DL model performance, we first randomly selected different subsets from each site in FILTS, provided that the total number of scans in the two testing subsets remained the same. Because site A had the fewest number of scans (n = 86) among the three sites, we randomly selected a similar number of scans (n = 90) from both site B and site C. Then, we decreased the number of scans in site A by 25% (65 scans) and 50% (43 scans) and increased the same number of scans in site B and site C. Thus, the ratio of numbers of scans between two subsets decreased from approximately 1.0 (balanced) to one-third (imbalanced). For FeTS, the number of scans between site 4 and site 1 and site 4 and site 18 were highly imbalanced, with a ratio of approximately 1:10. We evaluated the FeTS results in group 1.
Group 5: Different tumor attenuations or intensities.— We first halved the FeTS scans into two subsets, quarter (Q) 12 and Q34, using thresholds of MRI signal intensity (SI) on both NET and ET regions at 50%; then, we extracted the lowest intensity quarter Q1 from Q12 and the highest intensity quarter Q4 from Q34, using thresholds on both NET and ET regions at 25% and 75%, respectively. Thus, we grouped the FeTS scans into four subsets, as follows: (a) SI-Q1 (n = 113): NET and ET each less than 25%, (b) SI-Q12 (n = 406): NET and ET each less than 50%, (c) SI-Q34 (n = 387): NET and ET each greater than or equal to 50%, and (d) SI-Q4 (n = 116): NET and ET each greater than or equal to 75%. For FILTS, certain groups of tumors had large differences in tumor attenuation, such as FNH (hyperattenuated) versus cyst (hypoattenuated). We evaluated results for the FILTS dataset in group 2.
Data Metrics
Distance of data distribution.— Data distribution specifies the data range and the relative frequency (probability of occurrence) of each data value. A histogram is the most commonly used statistical method to show data distribution. Four metrics were calculated to quantify distance in data distribution: EMD (or Wasserstein Distance) (16), Bhattacharyya distance (BD) (17), χ2 distance (CSD) (18), and Kolmogorov-Smirnov distance (KSD) (19).
Performance of tumor segmentation.— The Dice coefficient is the most well-known metric to evaluate the performance of segmentation. We used the θ coefficient to assess performance between a federated model and a centralized model evaluated on the same dataset, defined as follows: θ = (Dice of federated model)/(Dice of centralized model). In general, θ is less than 1.0. A θ value close to 1.0 means that the federated model achieves similar performance as that of a centralized model in tumor segmentation. θ was reported as mean ± standard error, of which the standard error was estimated by a method using bivariate first-order Taylor expansion (https://www.stat.cmu.edu/~hseltman/files/ratio.pdf).
We developed a federated implementation of nnU-Net (20) based on a server-client architecture and the Fed-Avg algorithm (21). For a fair comparison between federated and centralized models, we first ran the nnU-Net planning and preprocessing task on all scans by using the configuration of a three-dimensional U-Net segmentation pipeline, such as resampling, normalization, patch size, and data augmentation parameters. Then, training of either federated or centralized models employed the same preprocessed data and the same set of hyperparameters. Federated models were trained on the scheme of one server and two clients, each client containing one subdataset. All federated and centralized models were trained on an NVIDIA Tesla P40 GPU cluster with 24-GB memory. Data in each group were randomly split into 80% for training and 20% for testing, and the results from the testing data were evaluated.
More technical details of the Fed-DL implementation are described in Appendix S1.
Statistical Analysis
Paired t test was performed to assess the difference in performance between a federated model and a centralized model on the same dataset. A P value less than .05 rejects the null hypothesis that the mean paired Dice difference between a federated model and a centralized model is zero and indicates statistically significant different performances between federated and centralized models.
We also calculated the trendline and Pearson correlation coefficients to evaluate the association between θ coefficients and distance measures. The trendline is a linear function, y = kx + b, where the independent variable x is distance and the dependent variable y is the θ value. The correlation coefficient is a measure of the goodness of fit of a linear relationship between θ and distance values. Statistical analyses were performed using MedCalc (version 19.5.6; MedCalc Software), and graphs were created using Microsoft Excel (version 2210).
Data Availability
The data and the scripts used to perform study evaluations that support the findings will be made publicly available, without due reservation.
Results
Fed-DL Performance on Grouped Data
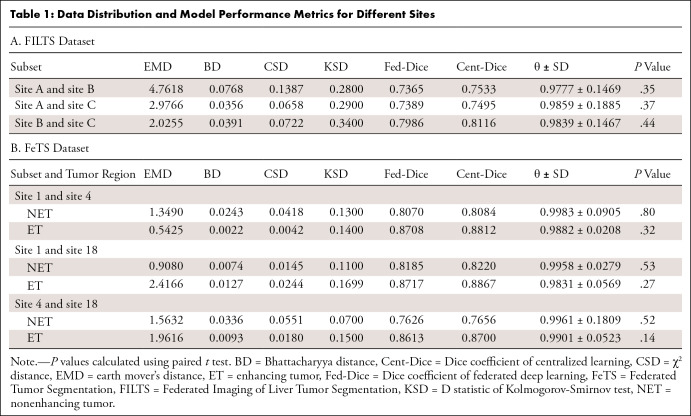
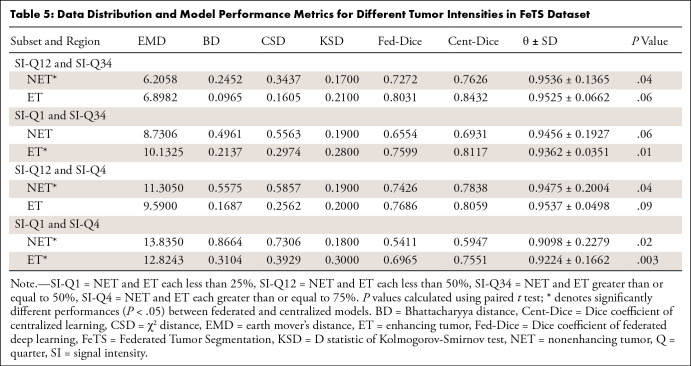
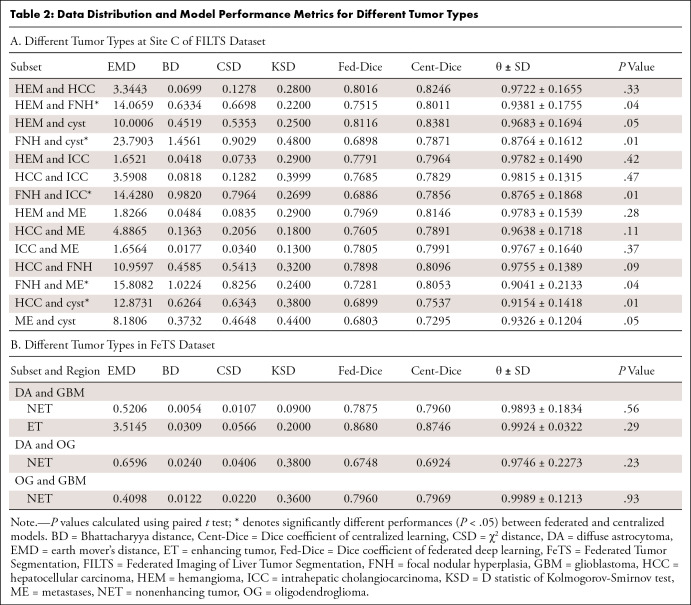
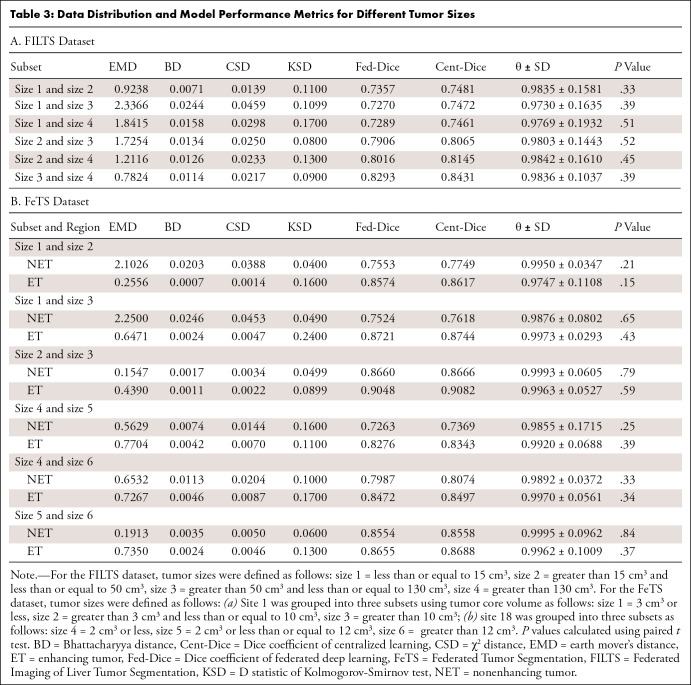
The performance of Fed-DL models trained on data grouped by site, tumor type, tumor size, dataset size, and tumor attenuation or intensity are listed in Tables 1–5.
Table 1:
Data Distribution and Model Performance Metrics for Different Sites
Table 5:
Data Distribution and Model Performance Metrics for Different Tumor Intensities in FeTS Dataset
Different sites.— We found no evidence of a difference between federated and centralized model performance on datasets grouped by site (P > .05, Table 1).
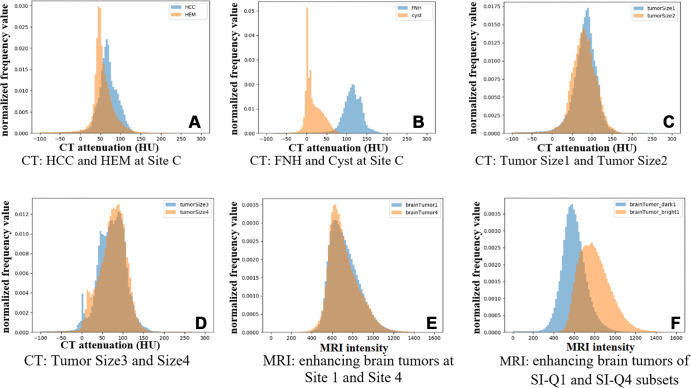
Different tumor types.— Table 2 shows θ values ranging from 0.877 to 0.982 in FILTS and 0.975 to 0.999 in FeTS. Figure 3A and 3B show two examples of distance in data distribution between HCC versus hemangioma (small distance) and FNH versus cyst (large distance). Figure 4 shows the distributions of CT attenuation among six types of liver tumors. Of 14 subsets in the FILTS dataset, five had significantly different performances (P < .05) between federated and centralized models.
Table 2:
Data Distribution and Model Performance Metrics for Different Tumor Types
Figure 3:
Examples of histograms between two different subsets of tumors in CT Liver Tumor Segmentation and MRI brain tumor segmentation datasets. (A) CT: HCC and HEM at site C (arterial phase): EMD = 3.3443, BD = 0.0699, CSD = 0.1278, KSD = 0.28. (B) CT: FNH and cyst at site C (arterial phase): EMD = 23.7903, BD = 1.4561, CSD = 0.9029, KSD = 0.48. (C) CT: tumor size 1 (≤15 cm3) and size 2 (15EN_DASH50 cm3) (PV phase): EMD = 0.9238, BD = 0.0071, CSD = 0.0139, KSD = 0.11. (D) CT: tumor size 3 (50–130 cm3) and size 4 (>130 cm3) (PV phase): EMD = 0.7824, BD = 0.0114, CSD = 0.0217, KSD = 0.09. (E) MRI: enhancing brain tumors at site 1 and site 4: EMD = 0.5425, BD = 0.0022, CSD = 0.0042, KSD = 0.14. (F) MRI: enhancing brain tumors of SI-Q1 and SI-Q4 subsets: EMD = 12.8243, BD = 0.3104, CSD = 0.3939, KSD = 0.30. BD = Bhattacharyya distance, CSD = χ2 distance, EMD = earth mover’s distance, FNH = focal nodular hyperplasia, HCC = hepatocellular carcinoma, HEM = hemangioma, KSD = d statistic of Kolmogorov-Smirnov test, Q = quarter, SI = signal intensity.
Figure 4:
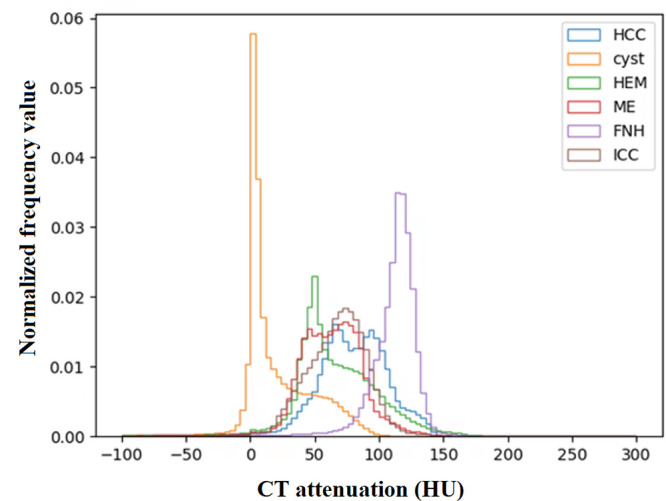
CT attenuation distributions of different types of tumors at site C in CT Liver Tumor Segmentation dataset. FNH = focal nodular hyperplasia, HCC = hepatocellular carcinoma, HEM = hemangioma, ICC = intrahepatic cholangiocarcinoma, ME = metastases.
Different tumor sizes.— Performance of Fed-DL models trained with different groups of tumor sizes are listed in Table 3A (FILTS) and 3B (FeTS). Average θ values were high in both the FILTS (0.980 ± 0.154 [standard error]) and FeTS (0.992 ± 0.075) datasets. Figure 3C and 3D show two examples of distance in data distribution between size 1 versus size 2 (small tumors) and size 3 versus size 4 (large tumors). Although Dice values were higher for large tumors compared with small tumors, the θ values remained similar.
Table 3:
Data Distribution and Model Performance Metrics for Different Tumor Sizes
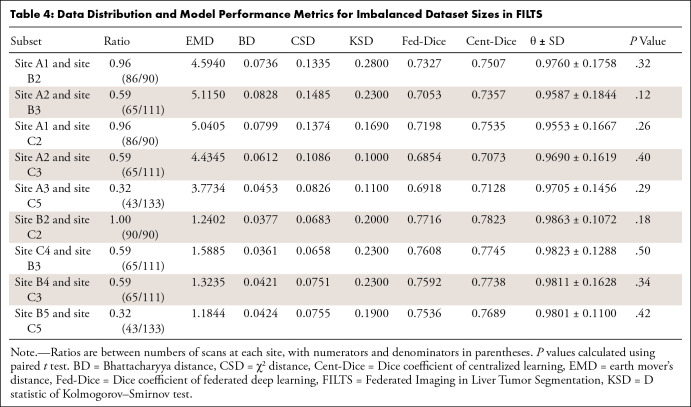
Different dataset sizes.— Table 4 shows the performance values of Fed-DL models trained with different numbers of scans in FILTS. Lower ratios of numbers of scans (ie, more imbalance) led to lower Dice values in both the federated and centralized models. However, average θ values remained similar: 0.973 ± 0.150 (ratio = 1.0), 0.973 ± 0.159 (ratio = 0.6), and 0.975 ± 0.128 (ratio = 0.3). In the FeTS dataset (Table 1B), θ values remained high even when the ratio of numbers of scans was less than 0.3 (eg, site 4–to–site 1 = 47:512 = 0.092 and site 4–to–site 18 = 47:382 = 0.123).
Table 4:
Data Distribution and Model Performance Metrics for Imbalanced Dataset Sizes in FILTS
Different tumor attenuations and intensities.— The performance of federated models trained with different tumor intensities in the FeTS dataset significantly differed from that of centralized models (Table 5). Figure 3E and 3F compare histograms of enhancing brain tumors between site 1 versus site 4 (P = .32) and SI-Q1 versus SI-Q4 (P = .003). For FILTS (Table 2A), tumors with different CT attenuations typically had lower θ values, such as FNH (hyperattenuated) versus cyst (hypoattenuated) and HCC (hyperattenuated) versus cyst (hypoattenuated).
Correlation Analysis
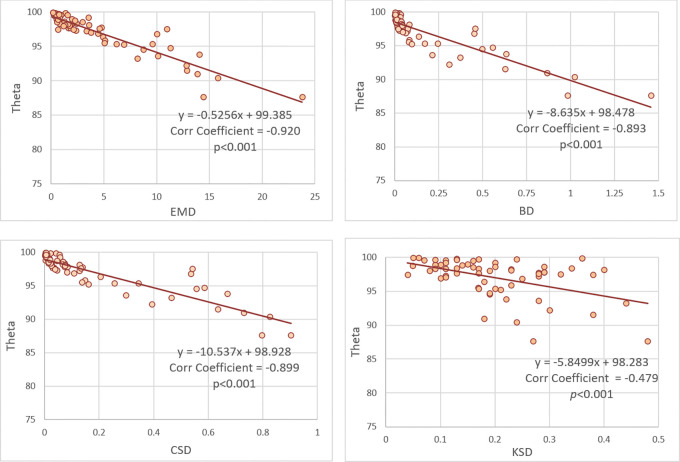
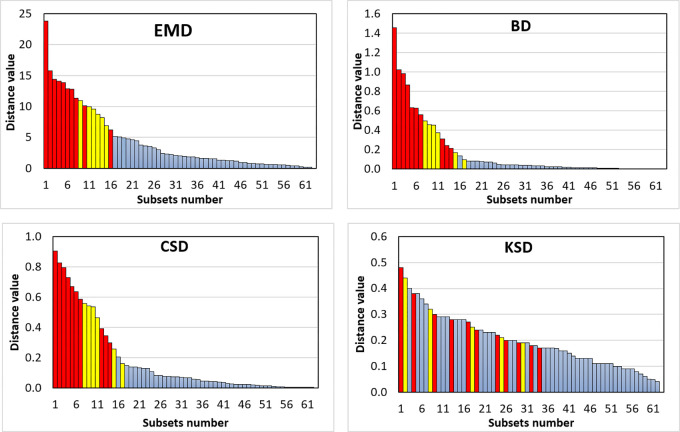
The distances of data distributions were negatively correlated with θ, with correlation coefficients of −0.920, −0.893, −0.899, and −0.479 for EMD, BD, CSD, and KSD, respectively. The trendlines in Figure 5 show a negative slope between distance (EMD, BD, CSD, KSD) and θ, indicating lower federated model performance with greater distance between data distribution. The waterfall plots of EMD, BD, CSD, and KSD in Figure 6 show the effect of changes in distance of data distribution on the performance of federated models compared with centralized models.
Figure 5:
Correlation coefficients and trendlines between distance metrics and θ value. BD = Bhattacharyya distance, Corr = correlation, CSD = χ2 distance, EMD = earth mover’s distance, KSD = D statistic of Kolmogorov-Smirnov test.
Figure 6:
Waterfall plots of distance metrics related to the performances of the federated models in 62 grouped subsets evaluations. Bar color indicates the P values calculated using paired t test: red = P < .05, yellow = .05 ≤ P < 0.10, blue = P ≥ 0.10. BD = Bhattacharyya distance, CSD = χ2 distance, EMD = earth mover’s distance, KSD = d statistic of Kolmogorov-Smirnov test.
There was a significant difference in performance between federated and centralized models for 10 of the 62 total subsets (groups 1 to 5). Corresponding distances in data distribution also differed significantly between federated and centralized models, with values of 13.527 ± 4.506 (median, 13.445) versus 2.722 ± 2.728 (median, 1.691) (P < .001) for EMD, 0.691 ± 0.395 (median, 0.472) versus 0.066 ± 0.117 (median, 0.025) (P = .001) for BD, 0.618 ± 0.211 (median, 0.531) versus 0.095 ± 0.137 (median, 0.046) (P < .001) for CSD, and 0.271 ± 0.097 (median, 0.260) versus 0.186 ± 0.097 (median, 0.170) (P = .03) for KSD, respectively.
Discussion
In this study, we investigated the correlation between various distance metrics that measure the difference in data distributions and Fed-DL performance in the segmentation of liver tumors on CT images and brain tumors on MR images. EMD had the strongest negative correlation (r = −0.920) with federated model performance. We found that the between-site difference of tumor attenuation (CT) or intensity (MRI) distributions influenced the Fed-DL performance, which was demonstrated by both liver tumors on CT images and brain tumors on MR images. For liver tumors on CT images, it was reflected by different tumor types that had different CT attenuations (tumor density), whereas for brain tumors on MR images, it was reflected by tumor regions with different MRI signal intensities. In other words, the Fed-DL performance in tumor segmentation is affected by the difference in CT attenuation or MRI intensity of tumors at different sites. The magnitude of this difference could be measured by EMD, BD, CSD, or KSD. Other factors including different tumor sizes or imbalanced dataset sizes did not significantly (P ≥ .05) impact overall data distribution and thus had little influence on federated model performance.
Our findings are consistent with those of Lee and Shin (9) and may have substantial impact on the development of Fed-DL using real-world non-IID data. We observed that a key underlying factor affecting the performance of federated models is the distance in data distributions. To achieve comparable performance with a centralized model, a federated model should be trained using datasets with small distances. Many approaches have attempted to solve the issue of non-IID data in Fed-DL from the algorithmic perspective, such as episodic learning in continuous frequency space (22), local batch normalization (23), and cross-site modeling (24). Motivated by our findings, we propose that data augmentation may be a more feasible and practical solution. For example, use of domain adaptation (25) among different clients to reduce data difference measured by EMD may improve Fed-DL performance, even with basic federated algorithms.
The two most common Fed-DL workflows are server-client and peer-to-peer topology (26), and commonly used aggregation methods include Fed-Avg (21), base + personalization layer (or, FedPer) (27), and Federated Matched Averaging (or, FedMA) (28). The server-client architecture with the Fed-Avg aggregation algorithm is the most common scheme of Fed-DL. We applied this federated scheme in our study to demonstrate the generalizability of our findings.
There are only a few publicly available Fed-DL medical imaging datasets, including thorax disease classification on chest radiographs (29,30), skin lesion image classification (31,32), prostate MRI segmentation (33), and a retinal image database (34). In particular, the 2021 RSNA Brain Tumor AI challenge based on FeTS (http://www.synapse.org/brats) has facilitated the first formal community benchmark explicitly for Fed-DL aggregation algorithms (11). As FeTS contains only a single type of glioma, we added three types of gliomas collected from the UCSF-PDGM dataset (15) to investigate the effect of tumor type on Fed-DL performance. Because FeTS and UCSF-PDGM had different imaging protocols and standards, we did not mix UCSF-PDGM scans with FeTS scans in other data groups.
Our study had several limitations. First, site A used LiTS, which is a multisite dataset, whereas datasets at sites B and C were each acquired from a unique single site. Although scans from the same site were acquired by using similar imaging protocols with different CT scanners, they also varied in image resolution and image quality. Nevertheless, site A data may have impacted study findings because of differences in imaging protocols at multiple sites. Second, tumor type was not reported for scans from sites A and B. As this was a retrospective study, tumor type data could not be obtained through tissue biopsy or postoperative pathologic examination. Third, we did not consider the potential effect of interreader variability, as segmentation was performed by different readers using different software at different institutions. This might contribute to performance degradation. However, such variability among sites may be unavoidable in real-world federated settings.
In conclusion, differences in data distribution may affect Fed-DL model performance in medical image segmentation. Model performance was strongly negatively correlated with distance (EMD, BD, and CSD) in data distribution. Reducing data distance may provide a feasible solution to ensure the development of a high-performing federated model trained on non-IID data.
W.C. supported by the National Institutes of Health/National Cancer Institute (grant no. R42CA189637) and the Children’s Tumor Foundation (grant no. CTF-2021-10-02).
Disclosures of conflicts of interest: G.L. No relevant relationships. T.L. No relevant relationships. J.L. No relevant relationships. X.C. Stock in Intel (restricted stock unit, as an employee). L.Y. No relevant relationships. J.W. No relevant relationships. D.Z.C. No relevant relationships. W.C. Support from the National Institutes of Health/National Cancer Institute (grant no. R42CA189637) and the Children’s Tumor Foundation (grant no. CTF-2021-10-02); stockholder in IQ Medical Imaging.
Abbreviations:
- BD
- Bhattacharyya distance
- CSD
- χ2 distance
- DL
- deep learning
- EMD
- earth mover’s distance
- ET
- enhancing tumor
- Fed-DL
- federated DL
- FeTS
- Federated Tumor Segmentation
- FILTS
- Federated Imaging of Liver Tumor Segmentation
- FNH
- focal nodular hyperplasia
- HCC
- hepatocellular carcinoma
- IID
- independent and identically distributed
- KSD
- Kolmogorov-Smirnov distance
- LiTS
- Liver Tumor Segmentation
- NET
- non-enhancing tumor
- Q
- quarter
- RSNA
- Radiological Society of North America
- SI
- signal intensity
- UCSF-PDGM
- University of California San Francisco Preoperative Diffuse Glioma MRI
References
- 1. Minaee S , Boykov Y , Porikli F , Plaza A , Kehtarnavaz N , Terzopoulos D . Image segmentation using deep learning: A survey . IEEE Trans Pattern Anal Mach Intell 2022. ; 44 ( 7 ): 3523 – 3542 . [DOI] [PubMed] [Google Scholar]
- 2. Kaissis GA , Makowski MR , Rückert D , et al . Secure, privacy-preserving and federated machine learning in medical imaging . Nat Mach Intell 2020. ; 2 ( 6 ): 305 – 311 . [Google Scholar]
- 3. Bonawitz K , Eichner H , Grieskamp W , et al . Towards federated learning at scale: System design . Proceedings of machine learning and systems , 2019. , 1 : 374 – 388 . https://proceedings.mlsys.org/paper/2019/hash/bd686fd640be98efaae0091fa301e613-Abstract.html . [Google Scholar]
- 4. Yang Q , Liu Y , Chen T , et al . Federated machine learning: Concept and applications . ACM Trans Intell Syst Technol 2019. ; 10 ( 2 ): 1 – 19 . [Google Scholar]
- 5. Sheller MJ , Reina GA , Edwards B , et al . Multi-institutional deep learning modeling without sharing patient data: A feasibility study on brain tumor segmentation . Brainlesion: Glioma, Multiple Sclerosis, Stroke and Traumatic Brain Injuries: 4th International Workshop , 2019. ; 92 – 104 . [DOI] [PMC free article] [PubMed] [Google Scholar]
- 6. Li W , Milletarì F , Xu D , et al . Privacy-preserving federated brain tumour segmentation . Machine Learning in Medical Imaging: 10th International Workshop , 2019. : 133 – 141 . [Google Scholar]
- 7. Roth HR , Chang K , Singh P , et al . Federated learning for breast density classification: A real-world implementation . Domain Adaptation and Representation Transfer, and Distributed and Collaborative Learning: Second MICCAI Workshop , 2020. : 181 – 191 . [Google Scholar]
- 8. Sheller MJ , Edwards B , Reina GA , et al . Federated learning in medicine: facilitating multi-institutional collaborations without sharing patient data . Sci Rep 2020. ; 10 ( 1 ): 12598 . [DOI] [PMC free article] [PubMed] [Google Scholar]
- 9. Lee GH , Shin SY . Federated learning on clinical benchmark data: performance assessment . J Med Internet Res 2020. ; 22 ( 10 ): e20891 . [DOI] [PMC free article] [PubMed] [Google Scholar]
- 10. Zhao Y , Li M , Lai L , et al . Federated Learning with Non-IID Data . arXiv 1806.00582 [preprint] https://arxiv.org/abs/1806.00582. Posted June 2, 2018. Accessed February 13, 2023 .
- 11. Pati S , Baid U , Zenk M , et al . The federated tumor segmentation (FeTS) challenge . arXiv 2105.05874 [preprint] https://arxiv.org/abs/2105.05874. Posted May 12, 2021. Accessed February 13, 2023 .
- 12. Bilic P , Christ P , Li HB , et al . The liver tumor segmentation benchmark (LiTS) . Med Image Anal 2023. ; 84 : 102680 . [DOI] [PMC free article] [PubMed] [Google Scholar]
- 13. Yushkevich PA , Gao Y , Gerig G . ITK-SNAP: An interactive tool for semi-automatic segmentation of multi-modality biomedical images . 2016 38th annual international conference of the IEEE engineering in medicine and biology society (EMBC) . 2016. : 3342 – 3345 . [DOI] [PMC free article] [PubMed] [Google Scholar]
- 14. Menze BH , Jakab A , Bauer S , et al . The multimodal brain tumor image segmentation benchmark (BRATS) . IEEE Trans Med Imaging 2015. ; 34 ( 10 ): 1993 – 2024 . [DOI] [PMC free article] [PubMed] [Google Scholar]
- 15. Calabrese E , Villanueva-Meyer JE , Rudie JD , et al . The University of California San Francisco Preoperative Diffuse Glioma MRI Dataset . Radiol Artif Intell 2022. ; 4 ( 6 ): e220058 . [DOI] [PMC free article] [PubMed] [Google Scholar]
- 16. Rubner Y , Tomasi C , Guibas LJ . The earth mover’s distance as a metric for image retrieval . Int J Comput Vis 2000. ; 40 ( 2 ): 99 – 121 . [Google Scholar]
- 17. Bhattacharyya A . On a measure of divergence between two multinomial populations . Sankhya 1946. ; 7 ( 4 ): 401 – 406 . [Google Scholar]
- 18. Pele O , Werman M . The quadratic-chi histogram distance family . 11th European Conference on Computer Vision . 2010. : 749 – 762 . [Google Scholar]
- 19. Massey FJ Jr . The Kolmogorov-Smirnov test for goodness of fit . J Am Stat Assoc 1951. ; 46 ( 253 ): 68 – 78 . [Google Scholar]
- 20. Isensee F , Jaeger PF , Kohl SAA , Petersen J , Maier-Hein KH . nnU-Net: a self-configuring method for deep learning-based biomedical image segmentation . Nat Methods 2021. ; 18 ( 2 ): 203 – 211 . [DOI] [PubMed] [Google Scholar]
- 21. McMahan B , Moore E , Ramage D , et al . Communication-efficient learning of deep networks from decentralized data. Artificial intelligence and statistics . PMLR 2017. ; 54 : 1273 – 1282 . https://proceedings.mlr.press/v54/mcmahan17a.html . [Google Scholar]
- 22. Liu Q , Chen C , Qin J , et al . FedDG: Federated domain generalization on medical image segmentation via episodic learning in continuous frequency space . Proceedings of the IEEE/CVF Conference on Computer Vision and Pattern Recognition . 2021. : 1013 – 1023 . [Google Scholar]
- 23. Li X , Jiang M , Zhang X , et al . FedBN: Federated Learning on Non-IID Features via Local Batch Normalization . ICLR , 2021. . https://openreview.net/forum?id=6YEQUn0QICG .
- 24. Guo P , Wang P , Zhou J , et al . Multi-institutional collaborations for improving deep learning-based magnetic resonance image reconstruction using federated learning . Proceedings of the IEEE/CVF Conference on Computer Vision and Pattern Recognition . 2021. : 2423 – 2432 . [DOI] [PMC free article] [PubMed] [Google Scholar]
- 25. Li X , Gu Y , Dvornek N , Staib LH , Ventola P , Duncan JS . Multi-site fMRI analysis using privacy-preserving federated learning and domain adaptation: ABIDE results . Med Image Anal 2020. ; 65 : 101765 . [DOI] [PMC free article] [PubMed] [Google Scholar]
- 26. Rieke N , Hancox J , Li W , et al . The future of digital health with federated learning . NPJ Digit Med 2020. ; 3 ( 1 ): 119 . [DOI] [PMC free article] [PubMed] [Google Scholar]
- 27. Arivazhagan MG , Aggarwal V , Singh AK , et al . Federated learning with personalization layers . arXiv 1912.00818 [preprint] https://arxiv.org/abs/1912.00818. Posted December 2, 2019. Accessed February 13, 2023 . [Google Scholar]
- 28. Wang H , Yurochkin M , Sun Y , et al . Federated learning with matched averaging . arXiv 2002.06440 [preprint] https://arxiv.org/abs/2002.06440. Posted February 15, 2020. Accessed February 13, 2023 .
- 29. Irvin J , Rajpurkar P , Ko M , et al . Chexpert: A large chest radiograph dataset with uncertainty labels and expert comparison . Proc Conf AAAI Artif Intell 2019. ; 33 ( 1 ): 590 – 597 . [Google Scholar]
- 30. Wang X , Peng Y , Lu L , et al . ChestX-ray8: Hospital-scale chest x-ray database and benchmarks on weakly-supervised classification and localization of common thorax diseases . Proceedings of the IEEE conference on computer vision and pattern recognition . 2017. : 3462 – 3471 . [Google Scholar]
- 31. Kawahara J , Daneshvar S , Argenziano G , Hamarneh G . 7-Point Checklist and Skin Lesion Classification using Multi-Task Multi-Modal Neural Nets . IEEE J Biomed Health Inform 2018. ; 23 ( 2 ): 538 – 546 . [DOI] [PubMed] [Google Scholar]
- 32. Tschandl P , Rosendahl C , Kittler H . The HAM10000 dataset, a large collection of multi-source dermatoscopic images of common pigmented skin lesions . Sci Data 2018. ; 5 ( 1 ): 180161 . [DOI] [PMC free article] [PubMed] [Google Scholar]
- 33. Litjens G , Toth R , van de Ven W , et al . Evaluation of prostate segmentation algorithms for MRI: the PROMISE12 challenge . Med Image Anal 2014. ; 18 ( 2 ): 359 – 373 . [DOI] [PMC free article] [PubMed] [Google Scholar]
- 34. Orlando JI , Fu H , Barbosa Breda J , et al . REFUGE Challenge: A unified framework for evaluating automated methods for glaucoma assessment from fundus photographs . Med Image Anal 2020. ; 59 : 101570 . [DOI] [PubMed] [Google Scholar]
Associated Data
This section collects any data citations, data availability statements, or supplementary materials included in this article.
Data Availability Statement
The data and the scripts used to perform study evaluations that support the findings will be made publicly available, without due reservation.


