

Key Points
Question
Was the 2017 health insurance mandate for assisted reproduction associated with increases in multiple pregnancies and births in Korea?
Findings
This cohort study of 1 474 484 women found that the possibility of multiple pregnancies and multiple births increased significantly after coverage for assisted reproductive technology treatment. The number of total births per pregnant woman was on a decreasing trend before the intervention but began to increase after the intervention.
Meaning
These findings suggest that policies that provide financial support for infertility treatment may contribute to addressing Korea’s low birth rates.
This cohort study evaluates the association between health insurance coverage for assisted reproductive technology and pregnancy and birth rates in Korea.
Abstract
Importance
While various policies to support couples experiencing infertility have been introduced due to the fertility rate rapidly dropping in developed countries, few large-scale nationwide cohort studies have evaluated the outcomes of assisted reproductive technology (ART) health insurance coverage policies.
Objective
To evaluate ART health insurance coverage for multiple pregnancies and births in Korea.
Design, Setting, and Participants
This population-based cohort study used delivery cohort data from the Korean National Health Insurance Service database between July 1, 2015, and December 31, 2019. A total of 1 474 484 women were included after exclusion of those who gave birth at nonmedical institutions and those with missing data.
Exposure
Two 27-month periods were examined before and after the Korean National Health Insurance Service had begun covering ART treatment (preintervention period, July 1, 2015, to September 30, 2017; postintervention period, October 1, 2017, to December 31, 2019).
Main Outcomes and Measures
Multiple pregnancies and multiple births were identified by International Statistical Classification of Diseases and Related Health Problems, Tenth Revision diagnosis codes. Total births were defined as the total number of babies born to each pregnant woman during the follow-up period. An interrupted time series with segmented regression was conducted to analyze the time trend and its change in outcomes. Data analysis was conducted between December 2, 2022, and February 15, 2023.
Results
Of the 1 474 484 women eligible for the analysis (mean [SD] age, 33.2 [4.6] years), approximately 1.60% had multiple pregnancies and 1.10% had multiple births. After covering ART treatment, the likelihood of multiple pregnancies and multiple births was estimated to increase by 0.7% (estimate, 1.007; 95% CI, 1.004-1.011; P < .001) and 1.2% (estimate, 1.012; 95% CI, 1.007-1.016; P < .001) compared with before coverage. The probability of an increase in the number of total births per pregnant woman after the intervention was estimated to be 0.5% (estimate, 1.005; 95% CI, 1.005-1.005; P < .001). The relatively high-income class above the median income showed a decreasing trend in multiple births and total births before the intervention, but after the intervention, a significant increase was observed.
Conclusions and Relevance
This population-based cohort study found that the possibility of multiple pregnancies and births in Korea significantly increased after the implementation of an ART health insurance coverage policy. These findings suggest that the development and coverage of policies to support couples experiencing infertility may help address low fertility rates.
Introduction
Over the past decades, the average total fertility rate (TFR) has decreased dramatically around the world.1,2 The Organization for Economic Co-operation and Development defines TFR as the number of children that a woman would give birth to if she were to live to the end of her childbearing years and give birth to children in alignment with the prevailing fertility rates for each age group.3 Assuming no migration and no change in mortality, a TFR of 2.1 children per woman ensures a largely stable population.3 As of 2021, the TFR of Organization for Economic Co-operation and Development countries was 1.63.4 However, Korea’s TFR is only 0.81, which has resulted in it ranking at the bottom for decades.5 The United Nations defines countries with a TFR of 2.1 or less as low-fertility countries and those with a TFR of 1.3 or less as ultra-low-fertility countries.6 Accordingly, Korea was already classified as a low-fertility country in 1983 and as an ultra-low-fertility country in 2002.5 It is one of the fastest-aging nations in the world.7 Since 2020, there has been a reversal in the number of deaths and births, leading to a decline in the population.5
South Korea is facing serious problems related to low fertility and an aging population. Various policies are being tried to prevent further population decline and increase the TFR, but the effect has not been significant. To address the complex issues associated with low fertility rates, the Korean government recognized the medical necessity of infertility care and introduced policies of financial support and an assisted reproductive technology (ART) insurance mandate for couples experiencing infertility.8,9 The ART health insurance mandate, which has been in effect since October 2017, covers 70% of ART treatment costs to all couples experiencing infertility regardless of income. In the past, people who had incomes lower than the median were given government subsidies for ART treatment, whereas this is the first coverage policy for those with incomes above the median. However, it has not been proven whether government policies supporting ART treatment have contributed to the increase in multiple birth rates and the national TFR.
A previous study in the US found that comprehensive insurance mandates are associated with greater use of ART treatment.10 It has also been suggested that health insurance coverage for infertility treatment significantly increases the first birth rate for women older than 35 years.11 Several studies have reported on the associations of ART treatment with multiple pregnancies12,13 and multiple births.14,15,16 Although the cost of ART treatment varies according to each country’s support and coverage policies,17 it is still a costly treatment for patients.18 Since Korea began to provide coverage for ART in 2017, few studies have evaluated the association of covering ART with patients’ economic burden, health outcomes, and fertility rates.
Therefore, this study aimed to evaluate whether the ART insurance mandate is associated with the increase in multiple pregnancies and births in Korea. Our hypothesis was that the probability of having multiple pregnancies and births would rise, as well as the total number of live births per pregnant woman, after the intervention.
Methods
Data and Study Population
This population-based cohort study used the Korean National Health Insurance Service (NHIS) database. In 1989, universal health coverage was introduced in Korea, which made it compulsory for all citizens to subscribe to the NHIS. Consequently, health insurance covers approximately 98% of the total population. The NHIS database contains all Koreans’ health screening data, medical utilization claims data, sociodemographic characteristics, and death information.19,20 The claims data comprise the largest database provided by the NHIS, which contains data on all medical use history for the entire Korean population, including diagnosis codes according to the clinically determined International Statistical Classification of Diseases and Related Health Problems, Tenth Revision (ICD-10), drug prescriptions, length of hospital stay, medical expenses, and information on health care provision.20
The NHIS delivery cohort database we obtained included information on all women who have experienced childbirth at least once at Korean medical institutions between July 1, 2015, and December 31, 2019. Delivery was defined using any record of inpatient hospitalization that included pregnancy-related diagnosis codes or procedure codes for vaginal or cesarean deliveries.21 A total of 1 474 484 individuals constituted the study population after excluding those with no birth records at Korean medical institutions and those with missing data.
The study protocol was approved by the institutional review board of Eulji University (No. EU22-27). Because the NHIS database we used did not contain identifiable information, the requirement for informed consent was waived. In conducting this observational study, we followed the Strengthening the Reporting of Observational Studies in Epidemiology (STROBE) reporting guideline for cohort studies.
Variables
The main variable of interest was the time of introduction of the ART health insurance coverage policy, which was divided into the periods before and after the intervention. Because the NHIS began covering ART on October 1, 2017, and the last follow-up date for data was December 31, 2019, we determined the follow-up periods before and after the intervention to be 27 months each. Therefore, the preintervention period was from July 1, 2015, to September 30, 2017 and the postintervention period was from October 1, 2017, to December 31, 2019. Study participants were classified as preintervention or postintervention based on the time of their delivery. Whether or not participants received ART could only be identified during the postintervention period because ART has only been recorded in claims data since October 2017, when the ART insurance mandates were implemented. Therefore, after the intervention, ART could be defined as infertility treatment (ICD-10 code N97) using all ART procedures, including intrauterine insemination (IUI) (ICD-10 code Z31.1) and in vitro fertilization and embryo transfer (IVF-ET) (ICD-10 code Z31.2).21,22
There were 3 dependent variables. First, multiple pregnancies were cases in which 2 or more fetuses were conceived and were identified with ICD-10 code O30. Second, multiple births were cases in which 2 or more babies were born and were determined by ICD-10 code O84. Third, total births were defined as the total number of babies born to each pregnant woman during the follow-up period and were classified into categories from 1 to 5.
As covariates, we included sociodemographic and obstetric factors. Sociodemographic factors were maternal age (<20, 20-29, 30-39, and ≥40 years), region (Seoul, metropolitan areas, small cities, and rural areas), income level (quartile 1 [lowest] to quartile 4 [highest]), and type of insurance (regionally insured, workplace insured, and medical aid). Obstetric factors were parity (nulliparous and multiparous) and maternal comorbidities (0 or ≥1).23
Statistical Analysis
Statistical analysis was conducted between December 2, 2022, and February 15, 2023. Descriptive statistics are presented as frequencies and percentages. To investigate and compare the general characteristics of the study population, a χ2 test was conducted. Subsequently, an interrupted time series (ITS) with segmented regression was performed to analyze the time trend and its change in outcomes. The ITS is modeled using a linear regression model, including 3 time-related variables, and the regression coefficients estimate the preintervention slope, level change at the time of the intervention, and postintervention slope change. The slope change quantifies the difference between the preintervention and postintervention slopes. Level change represents an absolute change in the level of outcomes at the time of the intervention, which measures the immediate effect of the intervention.24 Because we applied the log-link function to the generalized linear model to perform segmented regression, the model coefficients had to be converted into exponentials to represent trends and changes in the outcomes on the original scale. To interpret the model coefficients, log[E(Yi)] needed to be converted into multiplicative interpretations for the original scale E(Yi) = μi:
| log(μi) = β0 + β1 × timet + β2 × interventiont + β3 × time after interventiont + et |
In this model, the intercept β0 estimates the baseline level of the outcome; β1 estimates the baseline trend of the outcome; β2 estimates the level change after the intervention, which indicates the immediate effect size of the intervention; β3 estimates the change in trend after the intervention; and the sum of β1 and β3 is the slope after the intervention, indicating the follow-up outcome trend.25 Parameter estimates, SEs, and P values are presented as key results.
Subsequently, a modified Poisson regression analysis with sandwich error estimation was performed to examine the association between ART treatment and outcomes after the intervention using adjusted risk ratios and 95% CIs. SAS, version 9.4 statistical software (SAS Institute Inc) was used for all analyses. A 2-sided P < .05 was considered statistically significant.
Results
Table 1 presents the general characteristics of the participants. Of the 1 474 484 women eligible for the analysis (mean [SD] age, 33.2 [4.6] years), those in their 30s (1 077 501 [73.1%]), living in small cities (732 297 [49.7%]), and workplace insured (1 168 841 [79.3%]) were the most reported. Among the study population, those who experienced multiple pregnancies and multiple births were 1.60% and 1.10%, respectively. During the entire follow-up period, 73.54% of the women gave birth to only 1 child, and it was extremely rare for any woman to give birth to more than 3 children (0.02%). The total number of mothers after the intervention (n = 653 386) decreased compared with before the intervention (n = 821 098). However, the proportion of multiple pregnancies and multiple births increased after the intervention to 1.75% and 1.15%, respectively. Similarly, the proportion of women having 2 or more children increased during the postintervention period (28.44% vs 24.87% preintervention). eTable 1 in Supplement 1 shows the demographic characteristics of the study population by preintervention and postintervention periods.
Table 1. General Characteristics of the Study Population.
| Variable | Total, No. (N = 1 474 484) | Multiple pregnancies | Multiple births | Total births per pregnant woman | |||||||||
|---|---|---|---|---|---|---|---|---|---|---|---|---|---|
| No. (%) | P value | No. (%) | P value | No. (%) | P value | ||||||||
| Yes | No | Yes | No | 1 | 2 | 3 | 4 | 5 | |||||
| ART health insurance coverage | |||||||||||||
| Before intervention (7/1/2015 to 9/30/2017) | 821 098 | 12 090 (1.47) | 809 008 (98.53) | <.001 | 8651 (1.05) | 812 447 (98.95) | <.001 | 616 884 (75.13) | 196 805 (23.97) | 7261 (0.88) | 146 (0.02) | 2 (<0.01) | <.001 |
| After intervention (10/1/2017 to 12/31/2019) | 653 386 | 11 464 (1.75) | 641 922 (98.25) | 7503 (1.15) | 645 883 (98.85) | 467 480 (71.55) | 178 863 (27.37) | 6887 (1.05) | 153 (0.02) | 3 (<0.01) | |||
| Maternal age, y | |||||||||||||
| <20 | 3941 | 21 (0.53) | 3920 (99.47) | <.001 | 14 (0.36) | 3927 (99.64) | <.001 | 3120 (79.17) | 760 (19.28) | 59 (1.50) | 2 (0.05) | 0 | <.001 |
| 20-29 | 328 306 | 2752 (0.84) | 325 554 (99.16) | 1902 (0.58) | 326 404 (99.42) | 223 433 (68.06) | 100 288 (30.55) | 4461 (1.36) | 124 (0.04) | 0 | |||
| 30-39 | 1 077 501 | 19 518 (1.81) | 1 057 983 (98.19) | 13 456 (1.25) | 1 064 045 (98.75) | 801 689 (74.40) | 266 307 (24.72) | 9336 (0.87) | 167 (0.02) | 2 (<0.01) | |||
| ≥40 | 64 736 | 1263 (1.95) | 63 473 (98.05) | 782 (1.21) | 63 954 (98.79) | 56 122 (86.69) | 8313 (12.84) | 292 (0.45) | 6 (0.01) | 3 (<0.01) | |||
| Region | |||||||||||||
| Seoul | 281 795 | 5552 (1.97) | 276 243 (98.03) | <.001 | 3393 (1.20) | 278 402 (98.80) | <.001 | 215 066 (76.32) | 64 691 (22.96) | 1989 (0.71) | 49 (0.02) | 0 | <.001 |
| Metropolitan areas | 383 187 | 5707 (1.49) | 377 480 (98.51) | 4848 (1.27) | 378 339 (98.73) | 280 299 (73.15) | 99 006 (25.84) | 3819 (1.00) | 63 (0.02) | 0 | |||
| Small cities | 732 297 | 11 250 (1.54) | 721 047 (98.46) | 7254 (0.99) | 725 043 (99.01) | 535 095 (73.07) | 189 908 (25.93) | 7132 (0.97) | 162 (0.02) | 0 | |||
| Rural | 77 205 | 1045 (1.35) | 76 160 (98.65) | 659 (0.85) | 76 546 (99.15) | 53 904 (69.82) | 22 063 (28.58) | 1208 (1.56) | 25 (0.03) | 5 (0.01) | |||
| Income quartilea | |||||||||||||
| 1 (Lowest) | 299 343 | 4317 (1.44) | 295 026 (98.56) | <.001 | 2986 (1.00) | 296 357 (99.00) | <.001 | 211 219 (70.56) | 84 189 (28.12) | 3839 (1.28) | 94 (0.03) | 2 (<0.01) | .001 |
| 2 | 337 489 | 4261 (1.26) | 333 228 (98.74) | 3036 (0.90) | 334 453 (99.10) | 247 764 (73.41) | 86 209 (25.54) | 3429 (1.02) | 84 (0.02) | 3 (<0.01) | |||
| 3 | 524 584 | 8494 (1.62) | 516 090 (98.38) | 5880 (1.12) | 518 704 (98.88) | 388 963 (74.15) | 131 136 (25.00) | 4425 (0.84) | 60 (0.01) | 0 | |||
| 4 (Highest) | 313 068 | 6482 (2.07) | 306 586 (97.93) | 4252 (1.36) | 308 816 (98.64) | 236 418 (75.52) | 74 134 (23.68) | 2455 (0.78) | 61 (0.02) | 0 | |||
| Type of insurance | |||||||||||||
| Regional | 296 390 | 3899 (1.32) | 292 491 (98.68) | <.001 | 2685 (0.91) | 293 705 (99.09) | <.001 | 220 993 (74.56) | 71 760 (24.21) | 3560 (1.20) | 76 (0.03) | 1 (<0.01) | <.001 |
| Workplace | 1 168 841 | 19 574 (1.67) | 1 149 267 (98.33) | 13 420 (1.15) | 1 155 421 (98.85) | 856 542 (73.28) | 301 723 (25.81) | 10 374 (0.89) | 198 (0.02) | 4 (<0.01) | |||
| Medical aid | 9253 | 81 (0.88) | 9172 (99.12) | 49 (0.53) | 9204 (99.47) | 6829 (73.80) | 2185 (23.61) | 214 (2.31) | 25 (0.27) | 0 | |||
| Parity | |||||||||||||
| Nulliparous | 785 047 | 17 727 (2.26) | 767 320 (97.74) | <.001 | 11 871 (1.51) | 773 176 (98.49) | <.001 | 613 744 (78.18) | 166 484 (21.21) | 4722 (0.60) | 97 (0.01) | 0 | <.001 |
| Multiparous | 689 437 | 5827 (0.85) | 683 610 (99.15) | 4283 (0.62) | 685 154 (99.38) | 470 620 (68.26) | 209 184 (30.34) | 9426 (1.37) | 202 (0.03) | 5 (<0.01) | |||
| Maternal comorbidities | |||||||||||||
| 0 | 571 903 | 7595 (1.33) | 564 308 (98.67) | <.001 | 5263 (0.92) | 566 640 (99.08) | <.001 | 414 823 (72.53) | 151 241 (26.45) | 5703 (1.00) | 135 (0.02) | 1 (<0.01) | <.001 |
| ≥1 | 902 581 | 15 959 (1.77) | 886 622 (98.23) | 10 891 (1.21) | 891 690 (98.79) | 669 541 (74.18) | 224 427 (24.87) | 8445 (0.94) | 164 (0.02) | 4 (<0.01) | |||
| Delivery year | |||||||||||||
| 2015 | 193 697 | 2794 (1.44) | 190 903 (98.56) | <.001 | 2038 (1.05) | 191 659 (98.95) | <.001 | 138 335 (71.42) | 52 955 (27.34) | 2368 (1.22) | 38 (0.02) | 1 (<0.01) | <.001 |
| 2016 | 372 965 | 5539 (1.49) | 367 426 (98.51) | 4020 (1.08) | 368 945 (98.92) | 284 924 (76.39) | 85 410 (22.90) | 2574 (0.69) | 56 (0.02) | 1 (<0.01) | |||
| 2017 | 328 614 | 4979 (1.52) | 323 635 (98.48) | 3400 (1.03) | 325 214 (98.97) | 248 433 (75.60) | 77 071 (23.45) | 3041 (0.93) | 69 (0.02) | 0 | |||
| 2018 | 300 768 | 5001 (1.66) | 295 767 (98.34) | 3207 (1.07) | 297 561 (98.93) | 219 965 (73.13) | 78 277 (26.03) | 2461 (0.82) | 63 (0.02) | 2 (<0.01) | |||
| 2019 | 278 440 | 5241 (1.88) | 273 199 (98.12) | 3489 (1.25) | 274 951 (98.75) | 192 707 (69.21) | 81 955 (29.43) | 3704 (1.33) | 73 (0.03) | 1 (<0.01) | |||
| Total | 1 474 484 | 23 554 (1.60) | 1 450 930 (98.40) | 16 154 (1.10) | 1 458 330 (98.90) | 1 084 364 (73.54) | 375 668 (25.48) | 14 148 (0.96) | 299 (0.02) | 5 (<0.01) | |||
Abbreviation: ART, assisted reproductive technology.
Income level was classified into quartiles according to monthly household gross income (quartile 1, <$1950; quartile 2, $1950-$3899; quartile 3, $3900-$5849; quartile 4, ≥$5850).
Table 2 presents the results of the segmented regression analysis used to estimate the probabilities of the 3 outcome variables, adjusting for all covariates. The likelihood of having multiple pregnancies after ART insurance coverage was estimated to increase by 0.7% compared with before coverage (estimate, 1.007; 95% CI, 1.004-1.011; P < .001). Multiple births during the preintervention period showed a decreasing trend (estimate, 0.997; 95% CI, 0.994-0.999; P = .02) but changed to an increasing trend after the intervention (estimate, 1.008; 95% CI, 1.005-1.011; P < .001). The probability of having multiple births after the intervention increased by 1.2% compared with before the intervention (estimate, 1.012; 95% CI, 1.007-1.016; P < .001). In addition, the total number of births per pregnant woman increased by 0.5% (estimate, 1.005; 95% CI, 1.005-1.005; P < .001) with ART coverage. Before the intervention, there was a downward trend in the number of births per woman (estimate, 0.998; 95% CI, 0.998-0.998; P < .001), but after the intervention, there was a significant increase (estimate, 1.003; 95% CI, 1.003-1.003; P < .001).
Table 2. Segmented Regression Models Estimating the Probability of Multiple Pregnancies, Multiple Births, and Total Births Per Pregnant Woman.
| Estimatea | SE | 95% CI | P value | |
|---|---|---|---|---|
| Multiple pregnancies | ||||
| Intercept β0 | 0.004 | 0.036 | 0.004-0.005 | <.001 |
| Baseline outcome trend β1 | 1.000 | 0.001 | 0.998-1.003 | .81 |
| Level change after intervention β2 | 1.037 | 0.027 | 0.983-1.093 | .19 |
| Trend change after intervention β3 | 1.007 | 0.002 | 1.004-1.011 | <.001 |
| Follow-up outcome trend β1 + β3 | 1.008 | 0.001 | 1.005-1.010 | <.001 |
| Multiple births | ||||
| Intercept β0 | 0.003 | 0.043 | 0.003-0.003 | <.001 |
| Baseline outcome trend β1 | 0.997 | 0.001 | 0.994-0.999 | .02 |
| Level change after intervention β2 | 0.987 | 0.033 | 0.925-1.053 | .70 |
| Trend change after intervention β3 | 1.012 | 0.002 | 1.007-1.016 | <.001 |
| Follow-up outcome trend β1 + β3 | 1.008 | 0.002 | 1.005-1.011 | <.001 |
| Total births per pregnant woman | ||||
| Intercept β0 | 4.074 | 1.002 | 4.060-4.089 | <.001 |
| Baseline outcome trend β1 | 0.998 | 1.000 | 0.998-0.998 | <.001 |
| Level change after intervention β2 | 1.026 | 1.002 | 1.023-1.029 | <.001 |
| Trend change after intervention β3 | 1.005 | 1.000 | 1.005-1.005 | <.001 |
| Follow-up outcome trend β1 + β3 | 1.003 | 1.000 | 1.003-1.003 | <.001 |
Estimates were calculated by statistically adjusting for all covariates. Definitions of β0, β1, β2, and β3 appear in the Statistical Analysis section.
As shown in Table 2, the size of the level and trend changes could be quantitatively confirmed by calculating the parameter estimates, whereas as seen in the Figure, it was possible to intuitively confirm the outcome trend after the intervention. The ITS results showed that multiple pregnancies, multiple births, and total births increased after ART health insurance coverage was introduced.
Figure. Factors Associated With Trends of Multiple Pregnancies, Multiple Births, and Total Births Per Pregnant Woman.
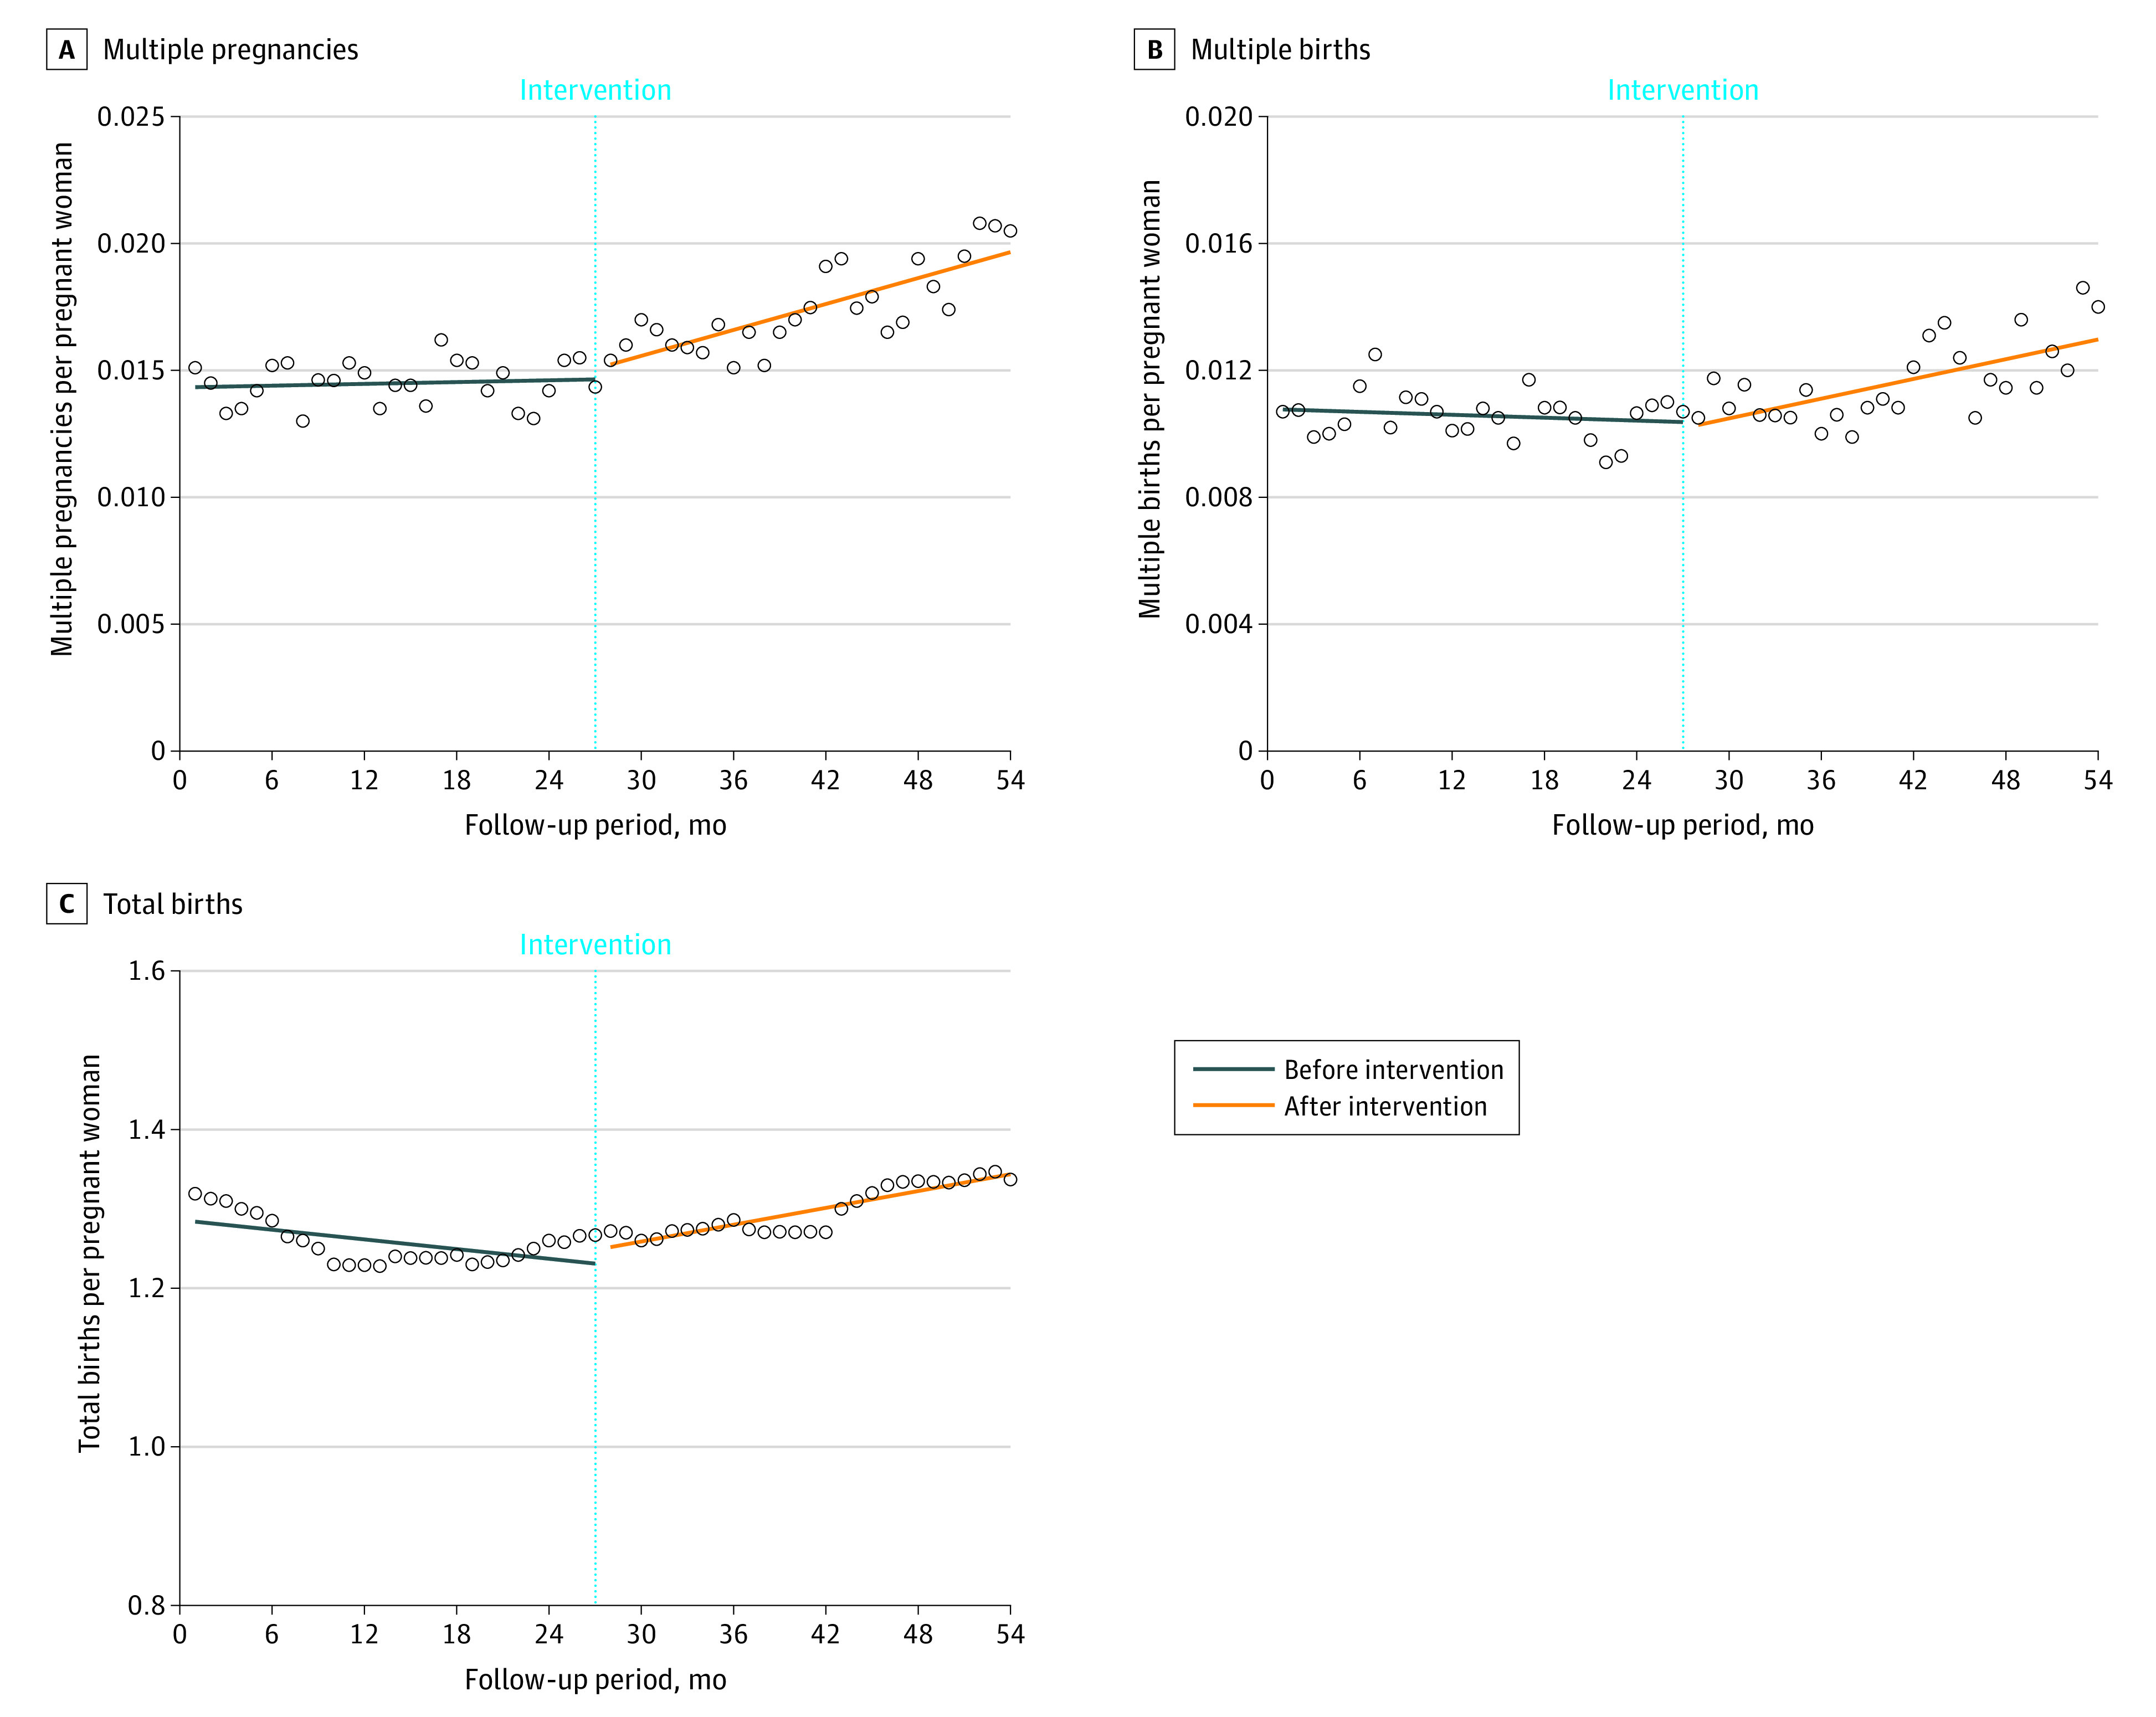
Circles represent observed values.
As Table 3 shows, subgroup analyses stratified by income level were conducted considering that the benefits of ART treatment subsidies differed according to income level. Similarly, all remaining covariates other than income level were statistically adjusted to calculate the estimates. Notably, the groups with income levels in quartiles 3 and 4 showed a decreasing trend in multiple births and total births before ART coverage that increased significantly after the intervention (quartile 3: trend change after intervention, 1.013; 95% CI, 1.007-1.020 [P < .001] and 1.005; 95% CI, 1.005-1.005 [P < .001], respectively; quartile 4: trend change after intervention, 1.011; 95% CI, 1.003-1.019 [P = .009] and 1.006; 95% CI, 1.005-1.006 [P < .001], respectively).
Table 3. Results of Subgroup Analysis Stratified by Income Levela.
| Estimate (95% CI)b | ||||||||
|---|---|---|---|---|---|---|---|---|
| Quartile 1 (Lowest) | P value | Quartile 2 | P value | Quartile 3 | P value | Quartile 4 (Highest) | P value | |
| Multiple pregnancies | ||||||||
| Intercept | 0.003 (0.003-0.004) | <.001 | 0.003 (0.003-0.003) | <.001 | 0.003 (0.003-0.003) | <.001 | 0.004 (0.003-0.004) | <.001 |
| Baseline outcome trend | 1.003 (0.998-1.008) | .30 | 1.000 (0.994-1.005) | .88 | 1.001 (0.997-1.005) | .74 | 0.998 (0.994-1.003) | .39 |
| Level change after intervention | 0.990 (0.877-1.119) | .88 | 1.012 (0.892-1.147) | .86 | 1.009 (0.923-1.104) | .84 | 1.115 (1.006-1.236) | .04 |
| Trend change after intervention | 1.003 (0.996-1.011) | .39 | 1.011 (1.003-1.019) | .008 | 1.010 (1.004-1.016) | .001 | 1.006 (0.999-1.012) | .09 |
| Follow-up outcome trend | 1.006 (1.001-1.012) | .03 | 1.010 (1.005-1.016) | <.001 | 1.010 (1.006-1.015) | <.001 | 1.004 (0.999-1.009) | .13 |
| Multiple births | ||||||||
| Intercept | 0.003 (0.002-0.003) | <.001 | 0.002 (0.002-0.003) | <.001 | 0.002 (0.002-0.003) | <.001 | 0.007 (0.006-0.008) | <.001 |
| Baseline outcome trend | 0.997 (0.991-1.003) | .34 | 1.002 (0.996-1.008) | .57 | 0.995 (0.990-1.000) | .03 | 0.996 (0.990-1.001) | .10 |
| Level change after intervention | 0.936 (0.806-1.086) | .38 | 0.929 (0.801-1.078) | .33 | 0.996 (0.894-1.110) | .95 | 1.053 (0.929-1.195) | .42 |
| Trend change after intervention | 1.013 (1.004-1.023) | .005 | 1.008 (0.999-1.018) | .08 | 1.013 (1.007-1.020) | <.001 | 1.011 (1.003-1.019) | .009 |
| Follow-up outcome trend | 1.010 (1.004-1.017) | .003 | 1.010 (1.004-1.017) | .003 | 1.008 (1.003-1.013) | <.001 | 1.006 (1.000-1.012) | .04 |
| Total births per pregnant woman | ||||||||
| Intercept | 4.261 (4.227-4.295) | <.001 | 4.399 (4.366-4.432) | <.001 | 4.076 (4.052-4.110) | <.001 | 3.898 (3.868-3.929) | <.001 |
| Baseline outcome trend | 1.000 (0.999-1.000) | .003 | 0.996 (0.996-0.997) | <.001 | 0.998 (0.998-0.998) | <.001 | 1.000 (0.999-1.000) | <.001 |
| Level change after intervention | 1.036 (1.029-1.042) | <.001 | 1.009 (1.003-1.015) | <.001 | 1.025 (1.021-1.030) | <.001 | 1.032 (1.025-1.038) | <.001 |
| Trend change after intervention | 1.004 (1.003-1.004) | <.001 | 1.005 (1.004-1.005) | <.001 | 1.005 (1.005-1.005) | <.001 | 1.006 (1.005-1.006) | <.001 |
| Follow-up outcome trend | 1.003 (1.003-1.003) | <.001 | 1.001 (1.001-1.001) | <.001 | 1.003 (1.003-1.003) | <.001 | 1.005 (1.005-1.005) | <.001 |
Income level was classified into quartiles according to monthly household gross income (quartile 1, <$1950; quartile 2, $1950-$3899; quartile 3, $3900-$5849; quartile 4, ≥$5850).
Estimates were calculated by statistically adjusting for all remaining covariates other than income level.
We also performed a Poisson regression analysis to examine the association between ART treatment and outcomes after the intervention (eTable 2 in Supplement 1). Compared with mothers not treated with ART, adjusted risk ratios show that those who received IUI and IVF-ET treatment were 13.67 times (95% CI, 13.11-14.26) and 11.27 times (95% CI, 10.50-12.10) more likely to have multiple pregnancies, respectively. Similarly, women who received IUI and IVF-ET treatment were 13.64 times (95% CI, 12.94-14.39) and 11.46 times (95% CI, 10.47-12.53) more likely to give birth to multiple babies, respectively. The number of total births per mother was 1.07 times (95% CI, 1.07-1.08) higher for mothers who received IUI treatment and 1.04 times (95% CI, 1.03-1.05) higher for those who received IVF-ET treatment than for mothers who did not receive any ART treatment.
Discussion
This cohort study evaluated the demographic policy outcomes of ART treatment coverage introduced as a solution to Korea’s low fertility rate, which is the lowest in the world.5 There were 3 principal findings. First, since October 2017, 70% of the total expenses of ART treatment were covered by health insurance for all couples experiencing infertility regardless of income level, and the possibility of multiple pregnancies and multiple births increased significantly. Second, the number of total births per pregnant woman showed a decreasing trend before the intervention but increased after the intervention. Before ART coverage, planning additional births through ART procedures would be challenging due to the high cost of infertility treatment. However, it is anticipated that after coverage, the cost burden has lessened, leading to a relative increase in the total number of births. Third, in high-income groups that were not eligible for financial support for ART treatment before the intervention, the introduction of ART insurance mandates had a more noticeable association with multiple births and total births. We believe that health insurance coverage for ART positively contributed to multiple pregnancies, multiple births, and total births. Although it was not a complete coverage and the out-of-pocket expense was 30% of the total treatment cost, the outcomes of introducing the policy were remarkable. According to NHIS claims data, the proportion of newborns conceived through ART procedures in Korea has actually increased over the past 5 years since the implementation of ART health insurance coverage, reaching 12.3% in 2022.26 As the age of marriage and first childbirth is delayed, the proportion of couples experiencing infertility and the use of ART treatment are expected to increase.
Most previous studies that examined the outcomes of ART insurance mandates focused on economic burden,17,18 use of ART treatment,27 and pregnancy outcomes.11,28 According to their findings, implementing ART coverage policies reduces patient costs and is positively associated with ART treatment use and pregnancy outcomes. There was also evidence that ART contributes to improving fertility rates and demographic changes.29 The findings of these studies are consistent with the implications of our study: ART should be actively supported as a national strategy to address low fertility rates. On the other hand, several studies have reported adverse associations of ART with maternal health outcomes. For example, a higher risk of severe maternal morbidity has been confirmed in mothers treated with ART than in those not treated with ART.21
The biggest difference between previous research and our study is that we not only evaluated the outcomes of ART treatment but also the outcomes of the ART treatment coverage policy. Considering that ART treatment imposes a very large economic burden on couples experiencing infertility,18 it is important to cover it under the NHIS. Korea’s 2017 ART insurance mandates targeted all couples experiencing infertility regardless of income. People with incomes below the median had previously received government subsidies for ART treatment, but the 2017 coverage policy was the first to cover people with incomes above the median. Therefore, in this study, differences in intervention outcomes according to income level were observed. This policy also contributed to an increase in total births per woman, which had previously been on a downward trend. Although Korea’s TFR continues to decline, our findings suggest that the decline in TFR may be slowed slightly by the ART health insurance coverage policy.
Strengths and Limitations
This study has several strengths. A major strength is that the NHIS database we analyzed contains nationwide cohort data, which ensures its applicability to the study when assessing the outcomes of medical practice and health. In addition, we used the ITS design, which is a strong quasi-experimental approach for evaluating the longitudinal outcomes of interventions.30 The main advantage of this design is that it makes full use of the longitudinal nature of the data and accounts for preintervention trends.24 Previous studies have used a difference-in-differences study design that compares only 2 time points to investigate the net policy association with the outcomes31 or segmented regression with fewer than 10 time points.32 However, there were too few time points to capture baseline trends and changes. This study used 54 time points (27 time points each before and after the intervention) to capture trend changes more robustly.
This study also had several limitations. First, the NHIS delivery cohort data we analyzed included only information on women who had experienced childbirth during the study period and did not include information on all women of childbearing potential in Korea; therefore, it was not possible to explore the outcomes of changes in the TFR trend with all Korean women of childbearing age as the denominator. Second, the inherent limitations of administrative claims data have been pointed out. Korea’s NHIS cohort data set is not a medical record; rather, it provides data for requesting the insurer to pay a part of patients’ total medical expenses.20 Thus, the recorded disease codes in the NHIS may not represent the actual disease status of patients.20 Moreover, it was not possible to verify whether ART treatment received an uninsured benefit. Third, we used the ICD-10 codes to select study participants and identify their specific outcomes, but these codes inherently have some problems.33,34,35 The ICD-10 codes are primarily used for administrative purposes and may not provide detailed clinical information about the patient. There is also the concern of incomplete coding, which could misclassify or underestimate the outcomes. Fourth, we could not control for all of the other informal benefits and interventions provided to couples experiencing infertility around the same time as the ART health insurance coverage policy was introduced. Thus, although there may have been an overestimation of the associations, ART insurance coverage was the most comprehensive and official intervention promoted at that time. Fifth, the follow-up period is insufficient for assessing the actual outcomes of the policy because certain patients may have undergone IVF before the intervention and transferred embryos at different times, leading to variability in the follow-up period, which may not truly reflect the policy’s impact. Sixth, we tried to adjust for potential confounders associated with childbirth, such as parity and maternal comorbidities, but residual confounding from unmeasured variables could not be ruled out.
Conclusions
The findings of this population-based cohort study suggest that ART health insurance coverage is associated with an increase in multiple pregnancies and multiple births and may also contribute to improving the birth rate. Considering the demographic structure of Korea, which has a very low fertility rate, policies that can support couples experiencing infertility should be further developed and implemented.
eTable 1. Demographic Characteristics of the Study Population Before and After Intervention
eTable 2. Association Between ART Treatment and Outcomes (After Intervention)
Data Sharing Statement
References
- 1.Calwell JC, Caldwell P, McDonald P. Policy responses to low fertility and its consequences: a global survey. J Popul Res. 2002;19(1):1-24. doi: 10.1007/BF03031966 [DOI] [Google Scholar]
- 2.Duncan R, Wilson C. Global population projections: is the UN getting it wrong? 2004. Accessed February 2, 2023. https://core.ac.uk/download/pdf/156615477.pdf
- 3.Fertility rates. Organisation for Economic Co-operation and Development . 2020. Accessed April 15, 2023. https://data.oecd.org/pop/fertility-rates.htm
- 4.Kato H. Total fertility rate, economic–social conditions, and public policies in OECD countries. In: Macro-econometric Analysis on Determinants of Fertility Behavior. SpringerBriefs in Population Studies. Springer; 2021:51-76. doi: 10.1007/978-981-16-3927-2_3 [DOI] [Google Scholar]
- 5.Statistics Korea . The census 2021 in South Korea. Article in Korean. Accessed February 17, 2023. https://kosis.kr/statisticsList/statisticsListIndex.do?menuId=M_01_01&vwcd=MT_ZTITLE&parmTabId=M_01_01&outLink=Y&entrType=#content-group
- 6.Lutz W, Skirbekk V, Testa MR. The low-fertility trap hypothesis: forces that may lead to further postponement and fewer births in Europe. In: Vienna Yearbook of Population Research. Vol 4. Austrian Academy of Sciences Press; 2006:167-192. [Google Scholar]
- 7.Jang IY, Lee HY, Lee E; 50th Anniversary Committee of Korean Geriatrics Society . Geriatrics fact sheet in Korea 2018 from national statistics. Ann Geriatr Med Res. 2019;23(2):50-53. doi: 10.4235/agmr.19.0013 [DOI] [PMC free article] [PubMed] [Google Scholar]
- 8.Kim M, Moon SH, Kim JE. Effects of psychological intervention for Korean infertile women under In Vitro Fertilization on infertility stress, depression, intimacy, sexual satisfaction and fatigue. Arch Psychiatr Nurs. 2020;34(4):211-217. doi: 10.1016/j.apnu.2020.05.001 [DOI] [PubMed] [Google Scholar]
- 9.Kim S. Reproductive technologies as population control: how pronatalist policies harm reproductive health in South Korea. Sex Reprod Health Matters. 2019;27(2):6-12. doi: 10.1080/26410397.2019.1610278 [DOI] [PMC free article] [PubMed] [Google Scholar]
- 10.Henne MB, Bundorf MK. Insurance mandates and trends in infertility treatments. Fertil Steril. 2008;89(1):66-73. doi: 10.1016/j.fertnstert.2007.01.167 [DOI] [PubMed] [Google Scholar]
- 11.Schmidt L. Effects of infertility insurance mandates on fertility. J Health Econ. 2007;26(3):431-446. doi: 10.1016/j.jhealeco.2006.10.012 [DOI] [PMC free article] [PubMed] [Google Scholar]
- 12.Shevell T, Malone FD, Vidaver J, et al. Assisted reproductive technology and pregnancy outcome. Obstet Gynecol. 2005;106(5, pt 1):1039-1045. doi: 10.1097/01.AOG.0000183593.24583.7c [DOI] [PubMed] [Google Scholar]
- 13.Allen VM, Wilson RD, Cheung A; Genetics Committee; Reproductive Endocrinology and Infertility Committee . RETIRED: pregnancy outcomes after assisted reproductive technology. J Obstet Gynaecol Can. 2006;28(3):220-233. doi: 10.1016/S1701-2163(16)32112-0 [DOI] [PubMed] [Google Scholar]
- 14.Wilcox LS, Kiely JL, Melvin CL, Martin MC. Assisted reproductive technologies: estimates of their contribution to multiple births and newborn hospital days in the United States. Fertil Steril. 1996;65(2):361-366. doi: 10.1016/S0015-0282(16)58100-X [DOI] [PubMed] [Google Scholar]
- 15.Murray S, Norman J. Multiple pregnancies following assisted reproductive technologies—a happy consequence or double trouble? Semin Fetal Neonatal Med. 2014;19(4):222-227. doi: 10.1016/j.siny.2014.03.001 [DOI] [PubMed] [Google Scholar]
- 16.Reynolds MA, Schieve LA, Martin JA, Jeng G, Macaluso M. Trends in multiple births conceived using assisted reproductive technology, United States, 1997-2000. Pediatrics. 2003;111(5, pt 2):1159-1162. doi: 10.1542/peds.111.S1.1159 [DOI] [PubMed] [Google Scholar]
- 17.Connolly MP, Hoorens S, Chambers GM; ESHRE Reproduction and Society Task Force . The costs and consequences of assisted reproductive technology: an economic perspective. Hum Reprod Update. 2010;16(6):603-613. doi: 10.1093/humupd/dmq013 [DOI] [PubMed] [Google Scholar]
- 18.Chambers GM, Sullivan EA, Ishihara O, Chapman MG, Adamson GD. The economic impact of assisted reproductive technology: a review of selected developed countries. Fertil Steril. 2009;91(6):2281-2294. doi: 10.1016/j.fertnstert.2009.04.029 [DOI] [PubMed] [Google Scholar]
- 19.Seong SC, Kim YY, Park SK, et al. Cohort profile: the National Health Insurance Service-National Health Screening Cohort (NHIS-HEALS) in Korea. BMJ Open. 2017;7(9):e016640. doi: 10.1136/bmjopen-2017-016640 [DOI] [PMC free article] [PubMed] [Google Scholar]
- 20.Lee J, Lee JS, Park SH, Shin SA, Kim K. Cohort profile: the National Health Insurance Service–National Sample Cohort (NHIS-NSC), South Korea. Int J Epidemiol. 2017;46(2):e15. doi: 10.1093/ije/dyv319 [DOI] [PubMed] [Google Scholar]
- 21.Nam JY, Hwang S, Jang SI, Park EC. Effects of assisted reproductive technology on severe maternal morbidity risk in both singleton and multiple births in Korea: a nationwide population-based cohort study. PLoS One. 2022;17(10):e0275857. doi: 10.1371/journal.pone.0275857 [DOI] [PMC free article] [PubMed] [Google Scholar]
- 22.Lynch A, McDuffie R Jr, Murphy J, Faber K, Orleans M. Preeclampsia in multiple gestation: the role of assisted reproductive technologies. Obstet Gynecol. 2002;99(3):445-451. doi: 10.1097/00006250-200203000-00013 [DOI] [PubMed] [Google Scholar]
- 23.Main EK, Leonard SA, Menard MK. Association of maternal comorbidity with severe maternal morbidity: a cohort study of California mothers delivering between 1997 and 2014. Ann Intern Med. 2020;173(11 suppl):S11-S18. doi: 10.7326/M19-3253 [DOI] [PubMed] [Google Scholar]
- 24.Kontopantelis E, Doran T, Springate DA, Buchan I, Reeves D. Regression based quasi-experimental approach when randomisation is not an option: interrupted time series analysis. BMJ. 2015;350:h2750. doi: 10.1136/bmj.h2750 [DOI] [PMC free article] [PubMed] [Google Scholar]
- 25.Wagner AK, Soumerai SB, Zhang F, Ross-Degnan D. Segmented regression analysis of interrupted time series studies in medication use research. J Clin Pharm Ther. 2002;27(4):299-309. doi: 10.1046/j.1365-2710.2002.00430.x [DOI] [PubMed] [Google Scholar]
- 26.Korean Health Insurance Review and Assessment Service. The evaluation results of medical institutions performing infertility treatment in 2022. Article in Korean. Accessed April 15, 2023. https://aq.hira.or.kr/hira_aq/index.jsp
- 27.Dunn AL, Stafinski T, Menon D. An international survey of assisted reproductive technologies (ARTs) policies and the effects of these policies on costs, utilization, and health outcomes. Health Policy. 2014;116(2-3):238-263. doi: 10.1016/j.healthpol.2014.03.006 [DOI] [PubMed] [Google Scholar]
- 28.Jungheim ES, Leung MYM, Macones GA, Odem RR, Pollack LM, Hamilton BH. In vitro fertilization insurance coverage and chances of a live birth. JAMA. 2017;317(12):1273-1275. doi: 10.1001/jama.2017.0727 [DOI] [PubMed] [Google Scholar]
- 29.Ziebe S, Devroey P; State of ART 2007 Workshop Group . Assisted reproductive technologies are an integrated part of national strategies addressing demographic and reproductive challenges. Hum Reprod Update. 2008;14(6):583-592. doi: 10.1093/humupd/dmn038 [DOI] [PubMed] [Google Scholar]
- 30.Cook TD, Campbell DT, Shadish W. Experimental and Quasi-Experimental Designs for Generalized Causal Inference. Houghton Mifflin Boston; 2002. [Google Scholar]
- 31.Dimick JB, Ryan AM. Methods for evaluating changes in health care policy: the difference-in-differences approach. JAMA. 2014;312(22):2401-2402. doi: 10.1001/jama.2014.16153 [DOI] [PubMed] [Google Scholar]
- 32.Kessler D, McClellan M. Do doctors practice defensive medicine? Q J Econ. 1996;111(2):353-390. doi: 10.2307/2946682 [DOI] [Google Scholar]
- 33.Surján G. Questions on validity of International Classification of Diseases-coded diagnoses. Int J Med Inform. 1999;54(2):77-95. doi: 10.1016/S1386-5056(98)00171-3 [DOI] [PubMed] [Google Scholar]
- 34.Stausberg J, Lehmann N, Kaczmarek D, Stein M. Reliability of diagnoses coding with ICD-10. Int J Med Inform. 2008;77(1):50-57. doi: 10.1016/j.ijmedinf.2006.11.005 [DOI] [PubMed] [Google Scholar]
- 35.Quan H, Li B, Saunders LD, et al. ; IMECCHI Investigators . Assessing validity of ICD-9-CM and ICD-10 administrative data in recording clinical conditions in a unique dually coded database. Health Serv Res. 2008;43(4):1424-1441. doi: 10.1111/j.1475-6773.2007.00822.x [DOI] [PMC free article] [PubMed] [Google Scholar]
Associated Data
This section collects any data citations, data availability statements, or supplementary materials included in this article.
Supplementary Materials
eTable 1. Demographic Characteristics of the Study Population Before and After Intervention
eTable 2. Association Between ART Treatment and Outcomes (After Intervention)
Data Sharing Statement