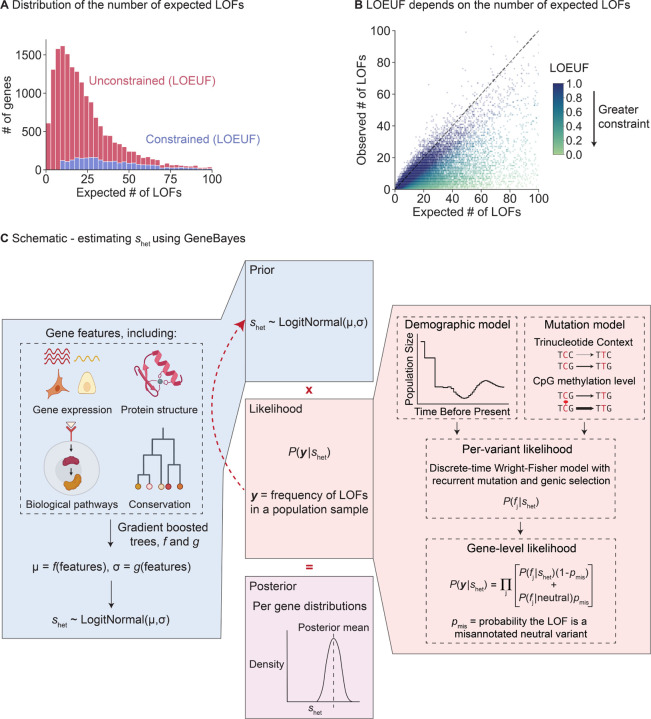
Figure 1: Limitations of LOEUF and schematic for inferring shet using GeneBayes.
A) Stacked histogram of the expected number of unique LOFs per gene, where the distribution for genes considered unconstrained (respectively constrained) by LOEUF are colored in red (respectively blue). Genes with LOEUF < 0.35 are considered constrained, while all other genes are unconstrained (Methods). The plot is truncated on the x-axis at 100 expected LOFs. B) Scatterplot of the observed against the expected number of unique LOFs per gene. The dashed line denotes observed = expected. Each point is a gene, colored by its LOEUF score; genes with LOEUF > 1 are colored as LOEUF = 1. C) Schematic for estimating shet using GeneBayes, highlighting the major components of the model: prior (blue boxes) and likelihood (red boxes). Parameters of the prior are learned by maximizing the likelihood (red arrow). Combining the prior and likelihood produces posteriors over shet (purple box). See Methods for details.

