Abstract
Isolation of skeletal muscles allows for the exploration of many complex diseases. Fibroblasts and myoblast play important roles in skeletal muscle morphology and function. However, skeletal muscles are complex and made up of many cellular populations and validation of these populations is highly important. Therefore, in this article, we discuss a comprehensive method to isolate mice skeletal muscle, create satellite cells for tissue culture, and use immunofluorescence to validate our approach.
Novel imaging technology is increasing our ability to visualize and analyze cellular organelles and compartments.
Keywords: Skeletal muscles, antibody validation, myoblast, fibroblast, immunofluorescence
Tweetable Abstract
Proper antibody validation of cellular populations within isolated skeletal muscle can lead to better elucidation of skeletal muscle structure and function, and their roles in complex diseases.
Method Summary
Myoblasts are isolated from mouse limb muscles. They are plated for immunofluorescence-based validation using confocal microscopy. This method demonstrates the need for reliable antibodies to correctly determine and differentiate between cellular populations within isolated skeletal muscles.
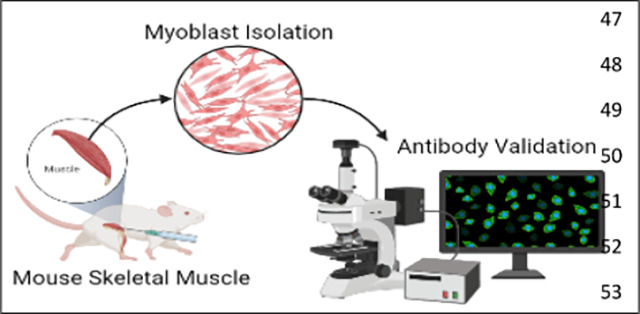
Graphical Abstract
Introduction
Skeletal muscles allow for animals and humans to be mobile 1. Defects in skeletal muscle (SkM) mass can cause atrophy and other pathological diseases 2. Since the first description of skeletal muscle diseases 3, there have been numerous discoveries describing their pathology and the next step in studying these pathologies is characterizing the different cellular populations residing within them. Isolating cells from these muscles allows for models to develop more complex studies to understand how these pathological mechanisms work. In addition to muscle diseases, skeletal muscles are also used to study immunological, neuronal, and other chronic diseases 4. Specifically, skeletal muscle cells are essential for studies on exercise and insulin stimulation. They are also useful experimental model to answer more complex questions, such as the effects of insulin stimulation 5 on organelle morphology and the efficacy of new microscopy methods like Focused Ion Beam Scanning Electron Microscopy (FIB-SEM)6.
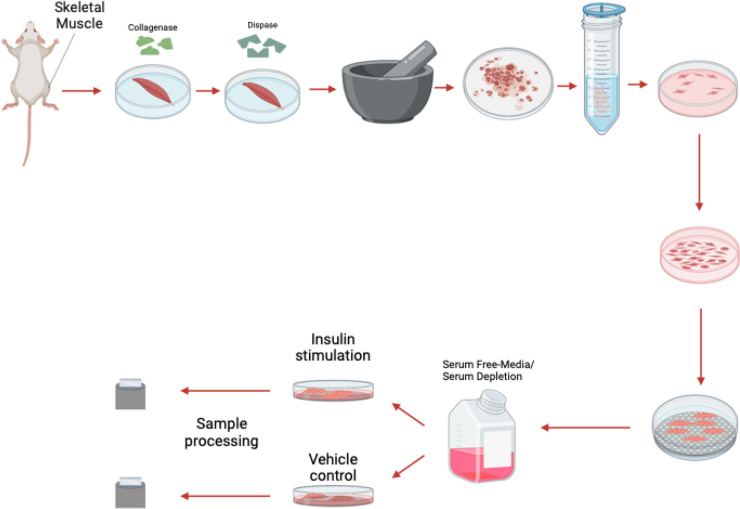
Here we offer two aims, firstly to show how to develop isolate myoblasts, or differentiated myotubes, from murine skeletal muscle (Figure 1). Secondly, developing antibody-based approaches for validating SkM cells has been a challenge. Here we also offer a technique for myoblast validation.
Figure 1: The process of myoblast isolation from gastrocnemius muscle.
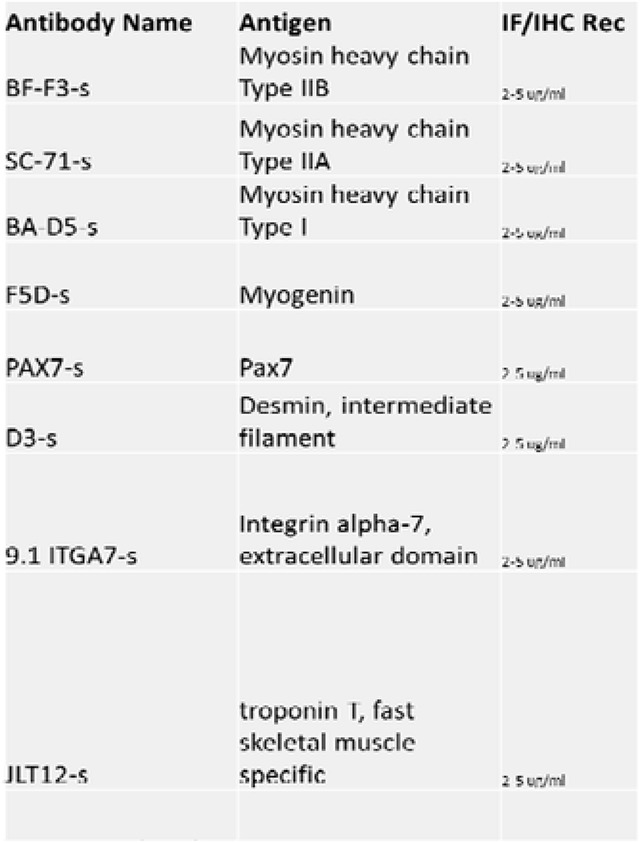
Antibodies are useful for validating different populations of skeletal muscle cells. Antibodies allow researchers to study the diversity of muscle fibers and cells while providing important insights into cellular processes and disease development. Here, we listed common antibodies used to study different cell populations in SkM tissue (Table 1).
Table 1:
A list of antibodies and their respective antigens for skeletal muscle validation after isolation. The list was obtained from https://dshb.biology.uiowa.edu/.
|
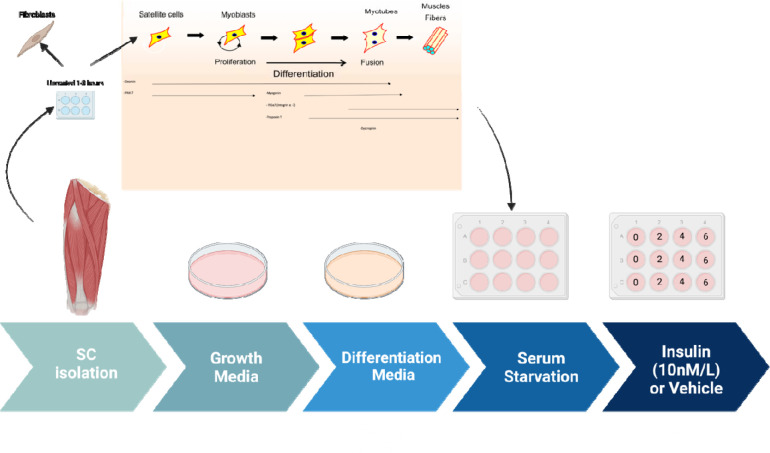
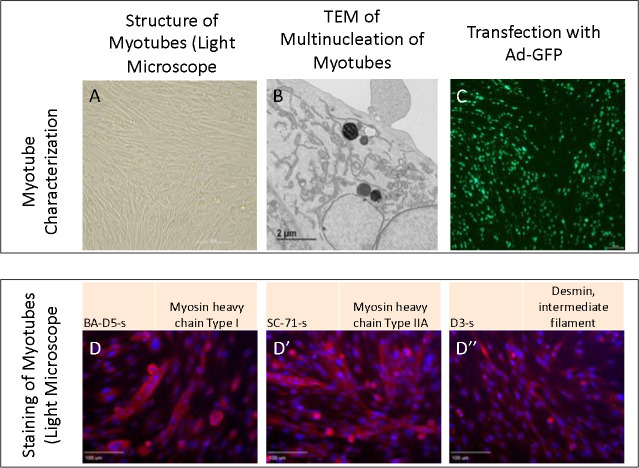
SkM tissue is composed of various cell types with different functions, including myoblasts and fibroblasts 2. Skeletal myoblasts drive muscle regeneration after injury, while fibroblasts create extracellular matrix components and secrete growth factors 7 (Figure 2). Morphologically, fibroblasts are larger than myoblasts and contain more vesicles 8. Given that these populations have morphological differences 9, validating that myoblast or myotube differentiation is successful is of critical importance, especially for experiments that seek to study homogenous populations and fine ultrastructural changes. Antibodies and fluorescence light microscopy can be used to validate different cell populations in skeletal muscle tissue (Figure 3A–D). Together, here we propose a standardized approach to isolate and identify different skeletal muscle cell populations.
Figure 2: The process of myotube differentiation from myoblasts and utilization for serum.
Figure 3:
Myotubes as characterized by A. Light microscopy, B. Transmission electron microscopy, and C. Transfection with adenovirus containing the green fluorescent protein gene (Ad-GFP). D. Straining with BA-D5-s, D’ SC-71-s, and D” D3-s to show myosin and desmin.
Before you Begin:
Initial PBS Wash mixture:
| Name | Volume |
|---|---|
| PBS | 25 mL |
| Fungizone | 75 μL |
| Penicillin-Streptomycin | 250 μL |
Initial DMEM-F12 incubation mixture:
| Name | Volume |
|---|---|
| DMEM-F12 | 250 mL DMEM (+ 4.5 g/L D-glucose, + L-Glut, - Sodium Pyruvate) + 250 mL F-12 (+L-Glut) |
| Collagenase II | 1300 mg |
| Penicillin-Streptomycin | 6.4 mL |
| Fungizone | 2.0 mL |
Secondary DMEM-F12 incubation mixture:
| Name | Volume |
|---|---|
| DMEM-F12 | 250 mL DMEM (+ 4.5 g/L D-glucose, + L-Glut, - Sodium Pyruvate) + 250 mL F-12 (+L-Glut) |
| Collagenase II | 650 mg |
| Penicillin-Streptomycin | 6.4 mL |
| Fungizone | 2.0 mL |
| Dipase | 325 mg |
DMEM-F12 Growth Media:
Mix the following. Use a sterile filter with Millipore brand 0.22 uM filter units. Store at 4C for no longer than 2 months. Add bFGF (10ng/mL) to the aliquot just before adding it to plate.
| Name | Volume | Example Catalog |
|---|---|---|
| DMEM-F12 | 250 mL DMEM (+ 4.5 g/L D-glucose, + L-Glut, - Sodium Pyruvate) + 250 mL F-12 (+L-Glut) | Gibco 11965-092 Gibco 11765-054 |
| FBS Note: Do not heat inactivate FBS. Just thaw, swirl to mix, and go. |
129 mL | Atlanta Biologicals S11550 |
| Penicillin-Streptomycin | 6.4 mL | Gibco 15140 |
| Fungizone | 2.0 mL | Gibco 15290-018 |
| MEM Non-essential Amino Acids | 6.4 mL | Gibco 11140 |
| Beta-Mercaptoethanol | 6.4 μL | Gibco 21985-023 |
Permeabilization Buffer:
| Name | Volume |
|---|---|
| PBS | 495.5 mL |
| Triton X-100 | 0.5 mL |
Differentiation medium:
| Name | Volume |
|---|---|
| DMEM (+ 4.5 g/L D-glucose, + L-Glut, - Sodium Pyruvate) | 250 mL |
| F-12 (+L-Glut) | 250 mL |
| FBS Note: Do not heat inactivate FBS. Just thaw, swirl to mix, and go. |
10.5 mL |
| Insulin-transferrin-selenium-X (100x) | 5.3 mL |
Reconstitute Human FGF-basic (FGF-2/bFGF) Recombinant Protein (here we use ThermoFisher 13256–029). Briefly, to prepare a stock solution of bFGF at a concentration of 0.1 mg/mL, reconstitute it in 100 μL of 10 mM Tris (pH 7.6). Dilute in buffer containing 0.1% BSA and store in polypropylene vials for up to six months at −20°C. Avoid freezing and rethawing.
Guide:
Myoblast Isolation
-
1
Collect muscle tissue from the gastrocnemius, quadriceps, and hamstring muscles at 4–8 weeks of age from mice.
-
2
Wash Isolated tissue 2–3 times with Initial PBS Wash Mixture.
NOTE: The PBS solution is prepared right before dissecting the tissue.
-
3
Incubate muscle tissue in the initial DMEM-F12 incubation mixture.
CRITICAL: Avoid filtering the DMEM-F12 media containing collagenase, 1% pen/strep, and 3 μL/mL Fungizone. This solution must be added cold to reduce temperature shock.
-
4
Maintain the muscle solution in a 37 °C water bath for 10–15 mins.
-
5
Shake at 220 rpm, for an overall time of 1.5 hrs.
-
6
After incubation, wash the tissue 3–4 times with PBS.
-
7
Incubate in warm the initial DMEM-F12 incubation mixture while the tissue is shaken for 30 mins in a 37 °C water bath.
NOTE: Solution has to be pre-warmed to 37°C to ensure efficient mixing of dispase and as the muscles were at 37°C after incubation
-
8
After shaking, ground tissue with mortar and pestle in the presence of liquid nitrogen.
-
9
Pass through a 100 μm, then 70μm, cell strainer.
-
10
Centrifuge the solution at 1000 rpm for five mins to pellet the cells.
-
11
Transfer the to a plate and resuspended using DMEM-F12 growth media supplemented with 40 ng/mL bFGF.
-
12
Pre-plate the cells for 1–3 hours on UNCOATED dishes to reduce the number of fibroblasts.
CRITICAL: Fibroblasts can dilute satellite cells. Recommended for dystrophic or injured muscle. Pre-plating on an uncoated plate causes fibroblasts to stick and be isolated. Fibroblasts can separately be used to isolate and for other experiments.
-
13
Dilute cells 1:15 in PBS, then plate in a Matrigel-coated dish.
NOTE: To create Matrigel-coated dishes, dilute stock concentration (while keeping on ice) to 1:15 in sterile PBS in the hood. Put Matrigel solution on flask/plate, shake/tilt to coat the bottom, incubate at room temperature in hood for 30 mins, and remove Matrigel solution back into its original tube. Matrigel solution may be reused up to 5 times total.
-
14Wait for activation, which takes 24–48 hrs, after which myoblasts will grow rapidly.
- To maintain healthy myoblast cells, use the growth media supplemented with bFGF (10 ng/mL).
CRITICAL: Use Differentiation Medium to go from myoblasts to myocytes and then to myotubes (Figure 2).
-
15
Plate primary myoblast at ~.8 X 106 cells per well and to differentiate the cells, add differentiation media, supplemented with 1:10,000 bFGF.
NOTE: This will depend on # of cell passages and type of treatment, adjust accordingly.
-
16
Incubate for 4 to 5 days.
NOTE: Switch out with fresh differentiation media every 2 days, supplemented with 1:10,000 bFGF.
-
17
Cells are split using accutase.
Note: DO NOT use trypsin to split the cells. Accutase is less harsh to the extracellular matrix, surface proteins, and cytoskeleton of skeletal cells than trypsin, so it is highly preferred 10.
-
18
Cells are maintained in a hypoxic environment (5% O2) at 37°C. If growing myotubes, A confluency of 70–85% has to be reached prior to adding growth media.
Myoblast Validation
Immunofluorescence staining is effective for examining differences in skeletal muscles simultaneously. Refer to Table 1 for a list of validated primary antibodies for skeletal muscles. Select secondary antibodies that are compatible with the epifluorescence or confocal microscope available to you.
CRITICAL: All steps are performed at room temperature unless otherwise indicated.
NOTE: This protocol for Immunofluorescence staining and antibody validation of isolated skeletal muscle cells is an adaptation of Esper et al., skeletal muscle tissue immunofluorescence labeling protocol 11.
-
1
To prepare the cells for fluorescence microscopy, the cells fix them by incubating them in 4% PFA for five mins.
-
2
Wash three times for five mins using PBS.
NOTE: Ice-cold 100% methanol or acetone is an effective fixative for cryosections and more suited for some antigens. Acetone is less harsh than methanol.
-
3
Incubate cells in permeabilization buffer for 10 mins.
-
4
Incubate cells in blocking solution for 1 hr at room temperature or overnight at 4 °C.
NOTE: When using permeabilization buffer, keep the solution away from the hydrophobic barrier to avoid loss of hydrophobicity. If this happens, wash the slide well with PBS. Include Mouse on Mouse (MOM) blocking reagent at a 1:40 dilution when staining mouse tissue with antibodies raised in the mouse.
-
5
To begin immunostaining, dilute the primary and secondary antibodies in a blocking solution according to the manufacturer’s suggested ratio.
NOTE: It is acceptable to dilute antibodies in hybridoma supernatant when targeting multiple antigens.
-
6
Aspirate the blocking buffer and cover the slide with the primary antibody solution.
-
7
Incubate the slides overnight at 4 °C.
-
8
On the following day, wash three times for five mins with PBS.
-
9
After washing, cover cells with secondary antibodies diluted in blocking buffer for 1 hr at room temperature in the dark.
NOTE: Keep slides in the dark for the remainder of the protocol.
-
10
After incubation, wash the slides three times for five mins with PBS.
-
11
Incubate the cells with 1 μg/mL DAPI diluted in PBS for five mins.
-
12
Wash once with PBS for five min.
-
13
Aspirate the PBS and place 1–2 drops of mounting media on to the cells
-
14
Carefully place a coverslip on the slide, while avoiding air bubbles.
-
15
Let the slides dry in the dark for 1–2 hr before sealing the slides with clear nail polish.
-
16
Store the slides at 4 °C and image within 2 weeks.
Expected Outcomes:
Upon isolation of myoblast and myotube, we validated their structure in light microscopy (Figure 3A). Furthermore, we viewed multinucleated myotubes through TEM to validate that ultrastructure was as expected (Figure 3B). Transfection further showed myotubes demonstrated fluorescence as expected (Figure 3C). From there, we performed staining for myosin and desmin, muscle-specific proteins that play crucial roles in muscle cell structure and function 12, to confirm that filaments were present as expected (Figure 3 D–D”).
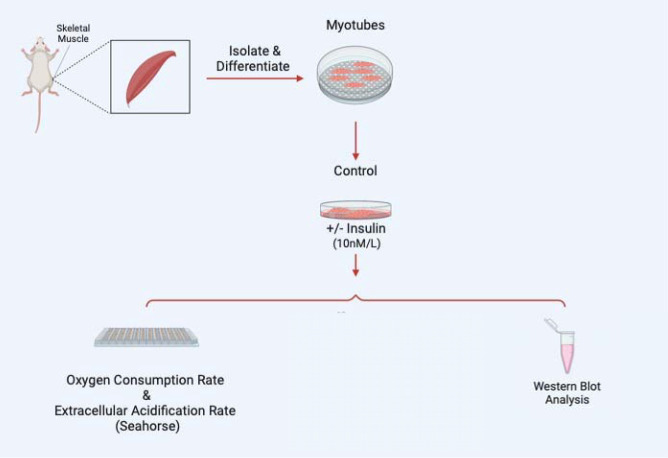
Once myoblasts and myotubes are validated, they can be used for a variety of studies including to measure mitochondrial efficiency with oxygen consumption rate, western blot analysis to look for expression of specific proteins in knockout studies, or a variety of electron microscopy techniques such as serial block-face scanning-electron microscopy to perform 3D reconstruction of organelles 13 (Figure 4). As an example, to validate this method, we sought to understand how insulin treatment (10 nM/L) in 2-hour increments may alter myoblast and myotube function through the usage of a Seahorse XF96 analyzer, per past protocols 14.
Figure 4:
Examples of experiments that may be performed following myotube differentiation and isolation.
To begin with, time points 1–3 measure basal respiration, or baseline rate of oxygen consumption by cells in culture without any treatment. Oligomycin (1 μg/ml) was added to inhibit ATP synthase, which reduces mitochondrial respiration and leads to an increase in proton gradient, to measure the amount of oxygen consumed by the myoblasts and myotubes to maintain the proton gradient in time points 4–6. carbonyl cyanide 4-(trifluoromethoxy)phenylhydrazone (FCCP; 1 μM) was then added in time points 7–9 which allows electrons to flow freely through the chain for reserve capacity and maximum oxygen consumption to be measured. Finally, rotenone (1 μM) and antimycin A (10 μM) were added in time points 10–12 which inhibit electron transfer from NADH to ubiquinone and ubiquinol to cytochrome c, respectively, to measure non-mitochondrial respiration 15.
We found that for myoblasts, there is a significantly increased basal, maximum, and non-mitochondrial OCR after 2 hours of insulin treatment, while this difference is retained or exacerbated after 4 hours of insulin treatment (Figure 5A–B). After 6 hours of insulin treatment, OCR conversely showed significant decreases in all of these parameters (Figure 5C). In myotubes, after 2 and 4 hours of insulin treatment, we similarly noted a significant increase in mitochondrial OCR (Figure 5D–E). Notably, the increase in basal, ATP-linked, maximum, and non-mitochondrial OCR is much higher in 4 hours than 2 hours. Unlike myoblasts, 6 hours of insulin treatment myotubes did not differ significantly from untreated cells (Figure 5F). Importantly, there may be a differential response to insulin treatment in myoblasts and myotubes, highlighting the importance of studying both models. This validated that the function of myoblasts and myotubes are intact following this isolation.
Figure 5:
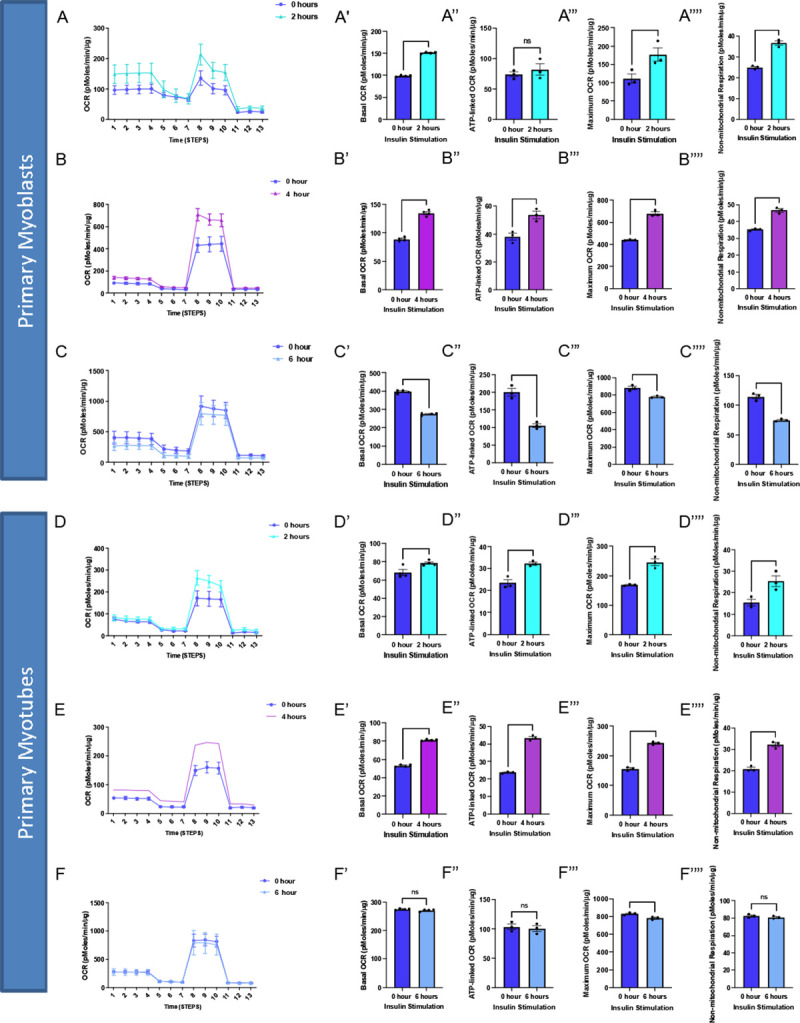
Oxygen consumption rate (OCR) altered in myoblasts and myotubes upon altered insulin stimulation which shows changes in mitochondrial efficiency. (A) Seahorse plot for primary myoblasts following 2 hours of insulin stimulation (B) 4 hours of insulin stimulation and (C) 6 hours of insulin stimulation. (D) Oxygen consumption rate was measured after several inhibitors to measure respiration in primary myotubes after 2 hours, (E) 4 hours and (F) 6 hours of insulin stimulation. (A’-F’) Basal OCR which represents respiration under normal, unstressed conditions. (A”-F”) ATP-linked OCR, which is respiration associated with ATP synthesis during oxidative phosphorylation which is marked by a reduction in OCR due to oligomycin. (A”‘-F”‘) Maximum OCR which is the maximal capacity at which mitochondria may utilize oxygen. (A”“-F”“) Non-mitochondrial respiration which can be attributed to factors such as glycolysis or ROS and not due to mitochondrial respiration.These values were compared to the control (blue) in all of these examples. N = 6 per treatment, and * indicates p-value < .05.
From there we sought to elucidate if organelle proteins are affected following insulin treatment and we targeted Optic atrophy protein 1 (OPA-1), which is a mitochondrial inner membrane (IMM) fusion protein that mediates the fusion of the IMM between two mitochondria while also serving roles in mitochondrial bioenergetics and cristae architecture 17. OPA-1 is just one of several proteins which modulate mitochondrial structure. For example, contrastingly, Dynamin-related protein 1 (DRP-1) is a protein which initiates the fission process through constriction of the mitochondria which divides the mitochondria into two separate organelles 18. However, given that OCR increased following insulin treatment, it is possible this is due to increased mitochondrial area caused by upregulated mitochondrial fusion. To see if OPA-1 may be changed in expression, we performed western blotting. When looking at OPA-1, we noticed a significant continuous increase in protein levels in myoblasts across 2 and 4 hours of insulin stimulation when normalized (Figure 6A–B). We further differentiated primary myotubes and carried out these experiments again to see if any differences existed (Figure 6C–D). We noticed significant increases in OPA-1 levels after 4 hours of insulin stimulation (Figure 6C–D). Together, this suggests that insulin stimulation causes increased expression of OPA-1 in a short time frame which is exacerbated in myotubes compared with myoblasts. These results are suggestive that mitochondrial fusion may be a compensatory of insulin stimulation which occurs through OPA-1-mediated mechanisms in myoblasts and myotubes. Together these data validate this isolation and validation technique allows for the application of experimental models to elucidate cellular processes.
Figure 6:
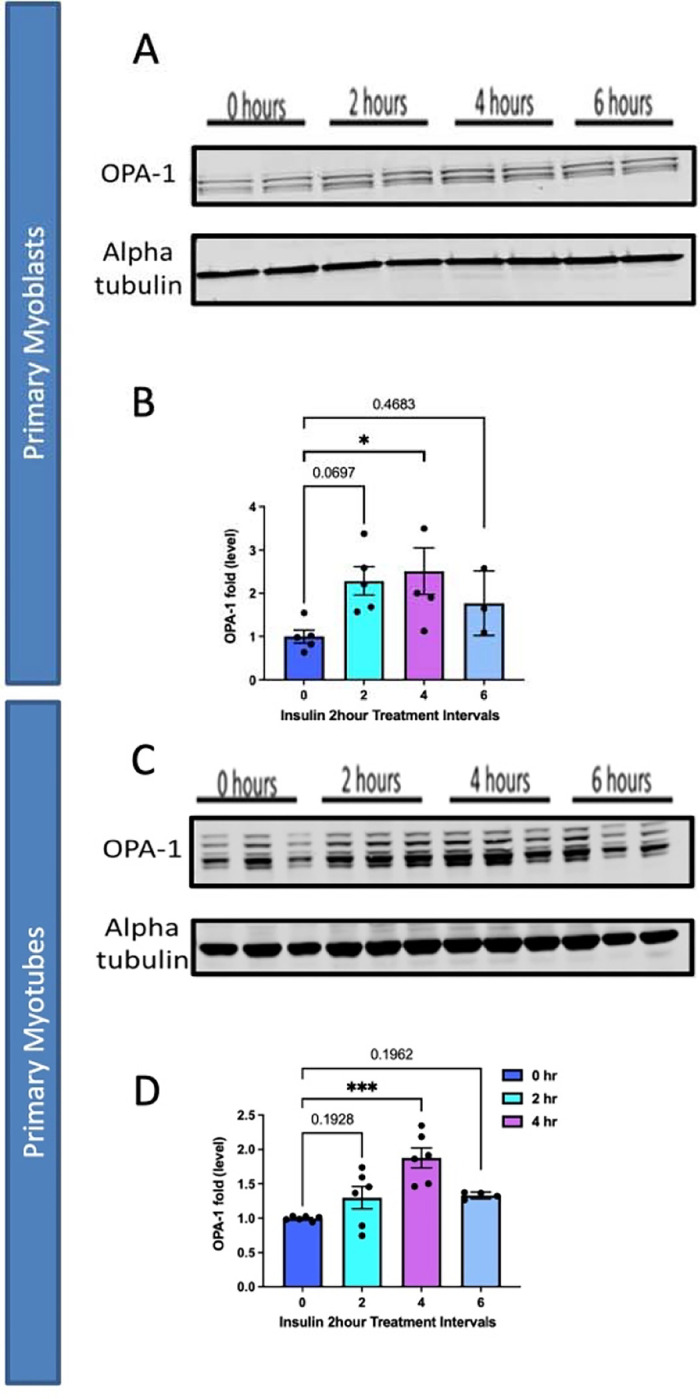
Comparison of mitochondrial fusion proteins following insulin stimulation in primary myoblasts and myotubes. (A) Western blotting for mitochondrial fusion protein OPA-1 following 2 hours, 4 hours, and 6 hours of insulin stimulation. (B) OPA-1 levels normalized to Alpha tubulin following insulin stimulation. (C) This was replicated in primary myotubes, as western blotting for mitochondrial fusion OPA1. (D) OPA-1 levels, normalized to Alpha tubulin, in primary myotubes following insulin treatment. N = 6 per treatment, and * indicates p-value < 378 .05.
Quantification and Statistical Analysis:
After differentiation, quantification can be done for many experimental designs. Here, we performed seahorse analysis per prior methods 14 with GraphPad Prism version 8.4.0 (GraphPad Software, La Jolla, CA) was used to perform students’ T-tests to measure statistical significance.
Limitations:
This protocol has been optimized for mice gastrocnemius, quadriceps, and hamstring muscles and may not be applicable to other model organisms or tissue types. Compared with other protocols, ours takes a similar period of time 19, but this can still be a slow process that must be carried out across multiple days. While C2C12 myoblasts are ideal for this protocol, increasingly human skeletal myoblasts are important to study and past protocols indicate that differences in the procedure must be made, such as antisense miR-133a addition, to promote the fast differentiation of human skeletal myoblasts 20.
Trouble Shooting:
Problem:
Ultrastructure or Gross morphology of Myoblasts are Degraded
Potential Solution:
This may be due to too much damage incurred to myoblasts during preparation. Here, we found that tissue should first be digested with type II collagenase and dispase, then ground by being put in liquid nitrogen with a mortar with a pestle, and finally passed through cell strainers optimizes this procedure. However, reducing the time grounded or reducing the amount of digestion can avoid potential damage to the myoblasts if it is occurring.
Problem:
Contamination with Fibroblasts
Potential Solution:
It is important to plate first on an uncoated plate. However, if fibroblasts are still observed, pre-plating can be done twice. Antibody-based selection of fibroblast may cause certain issues but can also be explored as an option to remove fibroblasts. If this remains an issue, other methods have shown that using flowing cytometry can be used to identify and remove fibroblasts 21.
Problem:
Low Cell Yield or Viability
Potential Solution:
If myoblast or myotube viability is low increasing the concentration of growth factors and assuming a sterile environment is attained is important. Reducing time with accutase can also ensure cells are not treated too harshly.
Resource Availability:
Lead contact
Further information and requests for resources and reagents should be directed to and will be fulfilled by the lead contact, Antentor Hinton (antentor.o.hinton.jr@Vanderbilt.Edu).
Materials availability
All generated materials, if applicable, are created in methods highlighted in the text above.
Acknowledgements
All antibodies were obtained from the Iowa Developmental Studies Hybridoma Bank (DSHB).
Footnotes
Financial & Competing Interests’ Disclosure
All authors have no competing interests.
This project was funded by the UNCF/Bristol-Myers Squibb E.E. Just Faculty Fund, BWF Career Awards at the Scientific Interface Award, BWF Ad-hoc Award, NIH Small Research Pilot Subaward to 5R25HL106365-12 from the National Institutes of Health PRIDE Program, DK020593, Vanderbilt Diabetes and Research Training Center for DRTC Alzheimer’s Disease Pilot & Feasibility Program. CZI Science Diversity Leadership grant number 2022- 253529 from the Chan Zuckerberg Initiative DAF, an advised fund of Silicon Valley Community Foundation (to A.H.J.). NSF EES2112556, NSF EES1817282, and CZI Science Diversity Leadership grant number 2022-253614 from the Chan Zuckerberg Initiative DAF, an advised fund of Silicon Valley Community Foundation (to S.M. D.) and National Institutes of Health grant HD090061 and the Department of Veterans Affairs Office of Research award I01 BX005352 (to J.G.). Additional support was provided by the Vanderbilt Institute for Clinical and Translational Research program supported by the National Center for Research Resources, Grant UL1 RR024975-01, and the National Center for Advancing Translational Sciences, Grant 2 UL1 TR000445-06 and the Cell Imaging Shared Resource.
Data Sharing and Open Access
All data is available upon request to the corresponding author.
Data and code availability
Full data utilized and requests for data and code availability should be directed to and will be fulfilled by the lead contact, Antentor Hinton (antentor.o.hinton.jr@Vanderbilt.Edu).
References
- 1.Figueiredo P.A., Mota M.P., Appell H.J., and Duarte J.A. (2008). The role of mitochondria in aging of skeletal muscle. Biogerontology 9, 67–84. 10.1007/s10522-007-9121-7. [DOI] [PubMed] [Google Scholar]
- 2.Dave H.D., Shook M., and Varacallo M. (2022). Anatomy, Skeletal Muscle. In StatPearls [Internet] (StatPearls Publishing; ). [PubMed] [Google Scholar]
- 3.Walusinski O. (2022). François-Amilcar Aran (1817–1861) and the recognition of spinal muscular atrophy. Rev Neurol (Paris) 178, 756–765. 10.1016/j.neurol.2022.01.011. [DOI] [PubMed] [Google Scholar]
- 4.Morgan J., and Partridge T. (2020). Skeletal muscle in health and disease. Disease Models & Mechanisms 13, dmm042192. 10.1242/dmm.042192. [DOI] [PMC free article] [PubMed] [Google Scholar]
- 5.Alonge K.M., Meares G.P., and Hillgartner F.B. (2017). Glucagon and Insulin Cooperatively Stimulate Fibroblast Growth Factor 21 Gene Transcription by Increasing the Expression of Activating Transcription Factor 4 *. Journal of Biological Chemistry 292, 5239–5252. 10.1074/jbc.M116.762922. [DOI] [PMC free article] [PubMed] [Google Scholar]
- 6.Marshall A.G., Damo S.A., and Hinton A. (2023). Revisiting focused ion beam scanning electron microcopy. Trends Biochem Sci, S0968–0004(23)00056–7. 10.1016/j.tibs.2023.02.005. [DOI] [PubMed] [Google Scholar]
- 7.Thummarati P., and Kino-Oka M. (2020). Effect of Co-culturing Fibroblasts in Human Skeletal Muscle Cell Sheet on Angiogenic Cytokine Balance and Angiogenesis. Front Bioeng Biotechnol 8, 578140. 10.3389/fbioe.2020.578140. [DOI] [PMC free article] [PubMed] [Google Scholar]
- 8.Yablonka-Reuveni Z., Anderson S.K., Bowen-Pope D.F., and Nameroff M. (1988). Biochemical and morphological differences between fibroblasts and myoblasts from embryonic chicken skeletal muscle. Cell Tissue Res 252, 339–348. 10.1007/BF00214376. [DOI] [PubMed] [Google Scholar]
- 9.Mingueitti G., and Mair W.G. (1980). The developing human muscle: ultrastructural differences between myoblasts and fibroblasts. Rev Bras Pesqui Med Biol 13, 1–8. [PubMed] [Google Scholar]
- 10.Nowak-Terpiłowska A., Śledziński P., and Zeyland J. (2021). Impact of cell harvesting methods on detection of cell surface proteins and apoptotic markers. Braz J Med Biol Res 54, e10197. 10.1590/1414-431X202010197. [DOI] [PMC free article] [PubMed] [Google Scholar]
- 11.Esper M.E., Kodippili K., and Rudnicki M.A. (2023). Immunofluorescence Labeling of Skeletal Muscle in Development, Regeneration, and Disease. Methods Mol Biol 2566, 113–132. 10.1007/978-1-0716-2675-7_9. [DOI] [PMC free article] [PubMed] [Google Scholar]
- 12.Agnetti G., Herrmann H., and Cohen S. (2022). New roles for desmin in the maintenance of muscle homeostasis. The FEBS Journal 289, 2755–2770. 10.1111/febs.15864. [DOI] [PubMed] [Google Scholar]
- 13.Garza-Lopez E., Vue Z., Katti P., Neikirk K., Biete M., Lam J., Beasley H.K., Marshall A.G., Rodman T.A., Christensen T.A., et al. (2022). Protocols for Generating Surfaces and Measuring 3D Organelle Morphology Using Amira. Cells 11, 65. 10.3390/cells11010065. [DOI] [PMC free article] [PubMed] [Google Scholar]
- 14.Pereira R.O., Marti A., Olvera A.C., Tadinada S.M., Bjorkman S.H., Weatherford E.T., Morgan D.A., Westphal M., Patel P.H., and Kirby A.K. (2021). OPA1 deletion in brown adipose tissue improves thermoregulation and systemic metabolism via FGF21. Elife 10, e66519. [DOI] [PMC free article] [PubMed] [Google Scholar]
- 15.Rose S., Frye R., Slattery J., Wynne R., Tippett M., Pavliv O., Melnyk S., and James S. (2014). Oxidative Stress Induces Mitochondrial Dysfunction in a Subset of Autism Lymphoblastoid Cell Lines in a Well-Matched Case Control Cohort. PloS one 9, e85436. 10.1371/journal.pone.0085436. [DOI] [PMC free article] [PubMed] [Google Scholar]
- 16.Chen H., Detmer S.A., Ewald A.J., Griffin E.E., Fraser S.E., and Chan D.C. (2003). Mitofusins Mfn1 and Mfn2 coordinately regulate mitochondrial fusion and are essential for embryonic development. J Cell Biol 160, 189–200. 10.1083/jcb.200211046. [DOI] [PMC free article] [PubMed] [Google Scholar]
- 17.Barrera M., Koob S., Dikov D., Vogel F., and Reichert A.S. (2016). OPA1 functionally interacts with MIC60 but is dispensable for crista junction formation. FEBS Letters 590, 3309–3322. 10.1002/1873-3468.12384. [DOI] [PubMed] [Google Scholar]
- 18.Peng L., Men X., Zhang W., Wang H., Xu S., Xu M., Xu Y., Yang W., and Lou J. (2011). Dynamin-related protein 1 is implicated in endoplasmic reticulum stress-induced pancreatic β-cell apoptosis. Int J Mol Med 28, 161–169. 10.3892/ijmm.2011.684. [DOI] [PubMed] [Google Scholar]
- 19.Shahini A., Vydiam K., Choudhury D., Rajabian N., Nguyen T., Lei P., and Andreadis S.T. (2018). Efficient and high yield isolation of myoblasts from skeletal muscle. Stem Cell Research 30, 122–129. 10.1016/j.scr.2018.05.017. [DOI] [PMC free article] [PubMed] [Google Scholar]
- 20.Cheng C.S., El-Abd Y., Bui K., Hyun Y.-E., Hughes R.H., Kraus W.E., and Truskey G.A. (2014). Conditions that promote primary human skeletal myoblast culture and muscle differentiation in vitro. Am J Physiol Cell Physiol 306, C385–C395. 10.1152/ajpcell.00179.2013. [DOI] [PMC free article] [PubMed] [Google Scholar]
- 21.Stellato M., Czepiel M., Distler O., Błyszczuk P., and Kania G. (2019). Identification and Isolation of Cardiac Fibroblasts From the Adult Mouse Heart Using Two-Color Flow Cytometry. Frontiers in Cardiovascular Medicine 6. [DOI] [PMC free article] [PubMed] [Google Scholar]
Associated Data
This section collects any data citations, data availability statements, or supplementary materials included in this article.
Data Availability Statement
Full data utilized and requests for data and code availability should be directed to and will be fulfilled by the lead contact, Antentor Hinton (antentor.o.hinton.jr@Vanderbilt.Edu).


