

Abstract
The study for the pathophysiology study of Alzheimer’s disease (AD) has been hampered by lack animal models that recapitulate the major AD pathologies, including extracellular β-amyloid (Aβ) deposition, intracellular aggregation of microtubule associated protein tau (MAPT), inflammation and neurodegeneration. We now report on a double transgenic APPNL-G-F MAPTP301S mouse that at 6 months of age exhibits robust Aβ plaque accumulation, intense MAPT pathology, strong inflammation and extensive neurodegeneration. The presence of Aβ pathology potentiated the other major pathologies, including MAPT pathology, inflammation and neurodegeneration. However, MAPT pathology neither changed levels of amyloid precursor protein nor potentiated Aβ accumulation. The APPNL-G-F/MAPTP301S mouse model also showed strong accumulation of N6-methyladenosine (m6A), which was recently shown to be elevated in the AD brain. M6A primarily accumulated in neuronal soma, but also co-localized with a subset of astrocytes and microglia. The accumulation of m6A corresponded with increases in METTL3 and decreases in ALKBH5, which are enzymes that add or remove m6A from mRNA, respectively. Thus, the APPNL-G-F/MAPTP301S mouse recapitulates many features of AD pathology beginning at 6 months of aging.
Keywords: Tauopathy, Neurodegeneration, RNA binding proteins, RNA metabolism, TIA1, tau oligomers, tau fibrils, stress granules, neuropathology, RNA methylation, neuritic plaques
Introduction
The hallmark pathologies of Alzheimer’s disease (AD) consist of the accumulation of neuritic plaques composed of β-amyloid (Aβ), the accumulation of neurofibrillary tangles (NFTs) composed of microtubule associated protein tau (MAPT, Tau), inflammation and neurodegeneration [1]. Mutations in amyloid precursor protein (APP) cause AD, however cognitive loss is only weakly correlated with the accumulation of Aβ [1]. Cognitive loss is much more robustly correlated with MAPT based NFTs pathology, and mutations in MAPT are sufficient to cause dementia (frontotemporal dementia, FTD) [1]. Mutations in MAPT might not cause AD because MAPT pathology does not drive the accumulation of Aβ pathology [1]. The requirement of Aβ and MAPT pathologies to model AD has posed a challenge for mouse models of AD because mutations in either gene alone are insufficient to produce both pathologies in mice.
Models relying only on genetic modification of amyloid precursor protein (APP) develop abundant Aβ plaques but produce little MAPT pathology beyond modest increases in phosphorylation [2]. Mouse models over-expressing mutant APP, such as Tg2576, or over-expressing mutant APP and mutant presenilin 1, such as 5xFAD, rapidly develop accumulated Aβ and develop neuritic plaques. However, over-expressing APP and presenilin 1 cause effect resulting from the over-expression that are unrelated to the disease process [3, 4]. These problems have been addressed by knocking in the human APP gene containing mutations that increase production of Aβ40 and/or Aβ42 [3, 4]. These mice develop robust plaque pathology beginning as early as 3 months of age, however they develop little tau pathology and little neurodegeneration [3, 4].
The absence of robust MAPT pathology in mouse models expressing only endogenous MAPT likely derives from the low aggregation propensity of murine MAPT [5, 6]. This limitation has been addressed by introducing human tau constructs into the mouse brain [2, 7]. Many mouse models have been developed based on over-expressing wild type (WT) tau or mutant forms of tau linked to frontotemporal dementia [2, 7, 8]. These models develop robust tau pathologies, including pathologically phosphorylated, misfolded, oligomeric and/or fibrillar forms of tau pathology. These models also exhibit progressive neurodegeneration, which is consistent with observations in humans that cognitive loss is more closely associated with tau pathology than Aβ pathology [9–11]. Human MAPT knock-in models have also been developed, and these models produce tau pathology, but only very late in the murine life span (~15 months) [2–4].
Multiple groups have explored crossing transgenic APP mouse over-expression models with tau mouse models [12–19]. The results generally show that Aβ accelerates tau pathology [12–14, 16]. The tau pathology does not appear to increase Aβ deposition [12–17]; indeed, in some cases it accelerates removal of Aβ [13]. These studies all suffer because they exhibit artifacts arising from the over-expression APP (WT or mutant) and in some cases mutant presenilins [3,8, 20]. Recent studies have begun to explore crossing human knockin models [2]. Human APP knockin (KI) models develop robust Aβ pathology, yet do not exhibit artifacts associated with APP over-expression, such as elevated levels of APP cleavage products [3]. Human MAPT KI models exhibit delayed tau pathology, as does a cross between the two KI models [21, 22]. Thus, we sought to create a model that avoided artifacts associated with APP over-expression, yet still exhibited robust tau pathology.
We now report creating a mouse model in which the APPNL-G-F KI and the PS19 P301S MAPT mouse lines were crossed. The resulting mouse model, termed APPNL-G-F/MAPTP301S, develops many aspects of AD pathology. The APPNL-G-F/MAPTP301S mouse exhibits a progressive increase in Aβ load, neuritic plaques, all major forms of tau pathology, as well as exhibiting enhanced microglial activation, astrogliosis, neurodegeneration and a progressive loss in cognitive function. This model also exhibits other key elements of AD pathology including inflammation and elevated levels of N6-methyl-adenosine (m6A) tagged RNA, which has recently been shown to change strongly with disease progression [23]. In this APPNL-G-F/MAPTP301S model, we also found that Aβ pathology potentiates MAPT pathology, astrogliosis, inflammation and neurodegeneration. MAPT pathology does not appear enhance the accumulation of Aβ pathology or inflammation beyond that observed in the APPNL-G-F mouse. Intriguingly we found that levels of m6A RNA correlate with MAPT but not Aβ pathology.
Methods
Mice
Use of all animals was approved by the Boston University Institutional and Animal Care and Use Committee (IACUC). All animals used in this study were handled according to IACUC approved protocols and housed in IACUC approved vivariums at the Boston University Animal Science Center. The APPNL-G-F mouse model was generated by Takaomi Saido and colleagues at the RIKEN Brain Science Institute in Japan [3]; the PS19 (B6;C3-Tg(Prnp-MAPT*P301S)PS19Vle/J, stock #008169) and C57BL/6J (stock #000664) mice were originally purchased from the Jackson Laboratory in Maine [24]. All mice used were on a congenic C57BL/6J background. To generate the APPNL-G-F/MAPTP301S cross, homozygous APPNL-G-F mice were bred with heterozygous PS19 mice resulting in either the double transgenic cross or heterozygous AppNL-G-F mice. Due to littermates being heterozygous for the APP mutations, wild-type C57BL/6J mice were used as controls.
Immunoblot
The homogenized lysate for western blot were collected from fresh frozen brain tissue with RIPA lysis buffer. Reducing and non-reducing protein samples were separated by gel electrophoresis and transferred to 0.2μm nitrocellulose membranes using the Bolt SDS-PAGE system (Life Technologies). Membranes were blocked in 5% nonfat dry milk (NFDM) in PBS supplemented with 0.025% Tween-20 (PBST) for 1 hour RT, followed by incubation overnight at 4°C in primary antibody diluted in 5% bovine serum albumin/PBST. Primary antibodies used were as follows: pTau217 (1:500) anti-tau antibody (rabbit, Thermo Scientific, Cat# 44744); 4G8, Anti-Amyloid β Antibody, clone W0-2, reactive to amyloid-β, aa 17-24 (Millipore Sigma, Cat# MABN10). Membranes were then washed 3 times with PBST and incubated in HRP-conjugated secondary antibodies (Jackson ImmunoResearch) diluted in 1% BSA/PBST at RT for 1 h. After incubation in secondary antibody, membranes were washed 3 times in PBST and developed using SuperSignal West Pico Chemilluminescent ECL substrate (ThermoFisher Scientific, cat# 34080).
Immunohistochemistry
Wild type (WT), APPNL-G-F, MAPTP301S, and APPNL-G-F/MAPTP301S mouse brains were collected at 3, 6 and 9-month of age, respectively. Briefly, mice were anaesthetized with isoflurane and then the hearts perfused with 20 ml ice cold PBS for 5 mins followed by perfusion with 20ml ice cold 4% PFA for 10 mins. The mouse brains were dissected and placed in 4% PFA on ice for 2 hours. Then the brains were washed with PBS and transferred into 30% sucrose/PBS until the brains sank to the bottom of the tube (about 48h), and sectioned. The fixed brains were sliced into 30μm coronal sections by cryostat, and stored in 0.005% sodium azide/PBS solution at 4°C for up to 3 months. For long-term storage, the sections were transferred into cryoprotectant solution (30% glycerol and 30% ethylene glycol in PBS), and stored at −20 °C.
For immuno-labeling, the 30 μm free-floating sections with hippocampus or lateral entorhinal cortex (LEnt) were blocked with 5% BSA and 5% goat serum in PBST (PBS/0.25% Triton X-100) for 30 min and then incubated with monoclonal 6E10 antibody (BioLegend, cat# 803001, 1:1000 dilution) overnight at 4 °C. On the second day, sections were washed with PBST three times and then incubated with biotinylated goat anti-mouse IgG antibody (Vector Laboratories, cat# BA-9200) for 2 hours RT. The antibody binding was visualized using a Vectastain ABC Kit (Vector Laboratories, cat# PK-6100) and diaminobenzidine (DAB) substrate tablet (Sigma-Aldrich, cat# D4293-50SET) as described previously [25]. Images were captured by Keyence microscope bz-x800.
Immuno-fluorescence staining of fixed brain tissues
For immuno-fluorescence labeling, selected sections of hippocampus from bregma −1.8 and LEnt from bregma −2.8, were washed in PBS for 10 mins and then permeabilized in 0.5ml PBS/0.25% Triton X-100 (PBST). Block tissues in blocking solution supplemented with 5% BSA and 5% normal donkey semm in PBST, 1.5-2 hours at RT. Dilute 1° antibodies in 5% BSA/PBST and incubate sections for overnight at 4°C. On the second day, wash the brain sections 3x in PBST, 15 min each. And then incubate the brain sections in 2° antibodies (1:700 for Dylight-/Alexa-conjugated antibodies made in donkey purchased from Thermo Fisher Scientific) in 5% BSA/PBST and incubate for 2 hours at RT. For DAPI nuclei stain, dilute DAPI (1:10,000) in PBST and incubate for 15 min. Wash 2x with PBST then 1x with PBS, 10 min each. Mount the brain sections onto microscope glass slides in Prolong gold anti-fade reagent. The primary antibodies used in this study are as follows: NeuN (chicken, Millipore, cat# ABN91), 1: 300; MC1 (mouse, provided by Peter Davies, Northwell), 1:100; TOMA2 (mouse, provided by Rakez Kayed, UTMB Galveston), 1:200 [26]; Images were captured by Carl Zeiss confocal LSM700.
Measurements of pathological proteins Aβ and phosphorylated Tau by Enzyme-linked immunosorbent assay (ELISA)
The Measurements of pathological Aβ and phosphorylated tau by ELISA is as described previously [27–29]. In brief, frozen mouse brain tissue was homogenized in 5:1 volume of freshly prepared, ice cold 5M guanidine hydrochloride in Tris-buffered saline (20 mM Tris-HCl, 150 mM NaCl, pH 7.4), which contained 1:100 Halt protease inhibitor cocktail (Thermo Fisher Scientific) and 1:100 phosphatase inhibitor cocktail 2 & 3 (Sigma-Aldrich) as previously reported [27, 28]. The homogenate was then shaken (regular rocker) overnight at room temperature. The lysate was diluted with 1% Blocker A (Meso Scale Discovery [MSD], #R93BA-4) in wash buffer according to specific immunoassays: 1:4000 for Aβ1-38, Aβ1-40, and Aβ1-42 (MSD #K15200E-2), and 1:300 for p-tau181, p-tau202 (MSD custom kit), total tau and p-tau231 (MSD #K15121D-2). Samples were centrifuged at 17,000 g and 4°C for 15 minutes. The supernatant was subsequently applied to the immunoassays, and the original homogenate was aliquoted and stored at −80°C.
To capture MAPT phosphorylated at Thr residue 181, antibody AT270 was used. The detecting antibody was the biotinylated HT7 that recognizes residue 159-163 of tau (Thermo Fisher Scientific). To measure p-Tau396, a rabbit monoclonal antibody against p-Tau396 (Abeam, ab156623) was used as the capturing antibody, and HT7 was used as a detecting antibody. Sulfo-tag conjugated streptavidin secondary antibody was used for signal detection by the MSD platform. MSD SECTOR Imager 2400 was used to measure p-tau396 levels. Internal calibrators of p-Tau and tau were used (MSD). P-Tau levels were measured in arbitrary units, which may or may not be related among the different epitopes. Standards with known concentrations were used for Aβ, and all standards and samples were run in duplicate. Measurements were made using the multidetection SPECTOR 2400 Imager (MSD).
RT qPCR
The reverse transcription quantitative real-time PCR (RT-qPCR) was applied for the rapid detection of gene expression changes of pro-inflammatory cytokines and complement proteins in the brain tissue of WT, APPNL-G-F, MAPTP301S, and APPNL-G-F/MAPTP301S double transgenic, respectively. The primers used in this study are listed below:
| Internal Control | mouse GAPDH | forward primer reverse primer |
CAACAGCAACTCCCACTCTTC GGTCCAGGGTTTCTTACTCCTT |
| pro-inflammation | mouse TNF-α | forward primer reverse primer |
GAC CCT CAC ACT CAG ATC ATC TTC T CCT CCA CTT GGT GGT TTG CT |
| pro-inflammation | mouse IL-1β | forward primer reverse primer |
GAAGAGCCCATCCTCTGTGA TTCATCTCGGAGCCTGTAGTG |
| DAM microglia | Mouse TREM2 | forward primer reverse primer |
GACCTCTCCACCAGTTTCTCC TACATGACACCCTCAAGGACTG |
| Neurotrophic factor | mouse BDNF | forward primer reverse primer |
AGGCAACTTGGCCTACCCAGGTGTG TACTGTCACACACGCTCAGCTCCCC |
Images Analysis
The intensity in immuno-fluorescence or DAB stained brain sections were measured by MATLAB program; the NeuN-positive cell number were quantified by Image J automatically cell counting. The quantification of cell numbers was done in a blinded manner, with the investigator analyzing the samples being different than the investigator coding the samples.
Statistical analysis
Statistical analyses and figures artwork were performed using GraphPad Prism version 9.00 for Windows with two sided α of 0.05. All group data are expressed as mean ± SEM. Colum means were compared using one-way ANOVA with treatment as the independent variable. And group means were compared using two-way ANOVA with factors on genotype and age time course of the mice, respectively. When ANOVA showed a significant difference, pair wise comparisons between group means were examined by Tukey’s multiple comparison test. Significance was defined at p< 0.05.
Results
Generation of the APPNL-G-F/MAPTP301S mouse line
The APPNL-G-F mouse line was developed to avoid artifacts associated with over-expressing APP [3]. These mice develop robust neuritic plaque pathology. We initiated the project by crossing homozygous APPNL-G-F mice with heterozygous P301S MAPT mice. The mice generated normal mendelian patterns of inheritance, producing expected genotypes in the offspring. The resulting mouse lines were aged, harvested and examined patterns of APP expression, as well as the accumulation of Aβ and neuritic plaques at 3, 6 and 9 months of age. Immunoblots of APP using the 48G antibody showed that all mice exhibited similar levels of APP expression at each age (Fig. 1A, B).
Figure 1. Beta-Amyloid deposition accumulates in a time-dependent manner in the APPNL-G-F/MAPTP301S mouse.

A. Representative images of western blot with 4G8 antibody showed the expression of human amyloid precursor protein (APP) in the APPNL-G-Fand APPNL-G-F/MAPTP301S mouse brain but not wild type (WT) or MAPTP301S brain. Total brain lysates were harvested at 3, 6 and 9 month old in each of the four mouse genotypes (WT, APPNL-G-F, MAPTP301S, and APPNL-G-F/MAPTP301S double transgenic, respectively). GAPDH was detected as the internal control.
B. Quantification of human APP expression in the total brain lysate as shown in (A). N=4, Data shown as mean ± SEM.
C. The 6E10 antibody (reactive to aa 1-16 Aβ and to APP) was used to examine the diffused amyloid plaques in the aging process of APPNL-G-F and APPNL-G-F/MAPTP301S mouse brain. Representative DAB staining images showed the progressive increase of 6E10 positive β-amyloid plaques in the entorhinal cortex from 3-month to 6 and 9-month of mouse brain. Scale bar 250μm.
D. Quantification for the number of 6E10 positive β-amyloid plaques averaged over 1 mm2 squares across each brain slice. N=4 mice in each group, Data shown as mean ± SEM. Two-way ANOVA with Tukey’s multiple comparisons test, *p<0.05, ****p<0.001.
E. The 4G8 antibody (reactive to Aβ, aa 17-24) was used to examine the compact amyloid plaques in the aging process of APPNL-G-F and APPNL-G-F/MAPTP301S mouse brain. Representative red fluorescence labeling stacked images showed the progressive increase of 4G8 positive β-amyloid plaques in the entorhinal cortex from 3-month to 6 and 9-month of mouse brain. Scale bar 100μm.
F-G. Quantification of the number and average size of 4G8 positive Aβ+ plaques. N=4 mice per group, 3 sections were used for each mouse. Data shown as mean ± SEM. Two-way ANOVA with Tukey’s multiple comparisons test, *p<0.05, ****p<0.001.
H-I. The amount of Aβ38 and Aβ42 in the total brain lysate detected by V-PLEX Aβ Peptide Panel 1 (4G8) Kit. Brain lysate from 4 genotypes of mice were detected at 3, 6 and 9 months, respectively. N=4 mice in each condition, data shown as mean ± SEM. Two-way ANOVA with Tukey’s multiple comparisons test, *p<0.05, **p<0.01, ****p<0.001.
Next we explored whether the accumulation of Aβ was affected by the presence of the P301S MAPT transgene. Mice at 3, 6 and 9 months were harvested and subjected to immunohistochemistry using both colorimetric and fluorescent approaches. DAB/peroxidase colorimetry can capture the broad distribution of pathology and also avoids any complications from lipofuscin accumulation. Immunofluorescence was also used because it can provide quantification based on intensity and provides finer imaging detail. Analysis of sections with antibody 6E10, which preferentially detects diffuse plaques, was done using the colorimetric DAB/peroxidase method. These results showed a progressive increase in amyloid plaque accumulation in the APPNL-G-F mouse line as well as the APPNL-G-F/MAPTP301S mouse line (Fig. 1C, D). The presence of the MAPTP301S exerted only a small effect on the accumulation of 6E10 positive plaques, with a 20% decrease in plaque load evident only at 6 months (p<0.05, Fig. 1C, D). Studies with 4G8, which preferentially detects consolidated plaques, showed the same pattern (Fig. 1E–G). A progressive increase in plaque load was observed in both the APPNL-G-F mouse line as well as the APPNL-G-F x MAPTP301S mouse line; we did note that the APPNL-G-F x MAPTP301S mice exhibited slightly fewer (15-20%) plaques than the APPNL-G-F mice at 6 and 9 months (Fig. 1F), however the average plaque size did not differ between the two groups (Fig. 1G).
To explore the levels of extracellular Aβ and neuritic plaques in the transgenic mouse, we examined the amount of Aβ38 and Aβ42 in the total brain lysate by V-PLEX Aβ Peptide ELISA Kit. The V-PLEX platform offers analytically validated singleplex and multiplex assay kits, which can provide accurate and reproducible results with consistency from lot to lot [30]. The ELISA result showed that Aβ38 levels were similar in APPNL-G-F and APPNL-G-F x MAPTP301S mice at 3 month old but slowly decreased as the mice aged. In contrast, the Aβ42 level was elevated and progressively increased with age in both APPNL-G-F and APPNL-G-F x MAPTP301S mouse brains. Notably, in the APPNL-G-F mouse the Aβ42 level peaked at 6-months and remained constant at 9-months while levels of Aβ42 steadily increased with age (at 3, 6 and 9-months) in APPNL-G-F x MAPTP301S mouse brain.
These results indicate that the APPNL-G-F x MAPTP301S double transgenic mouse model recapitulates the progressive accumulation Aβ plaques and levels characteristic of brains of AD subjects.
AppNL-G-F potentiates progression of MAPT pathology in the APPNL-G-F/MAPTP301S double transgenic mice.
Another goal of the APPNL-G-F/MAPTP301S double transgenic mice is to recapitulate the development of MAPT pathology associated with cognitive decline in AD patients. To investigate the MAPT aggregation in the MAPTP301S and APPNL-G-F/MAPTP301S mice as well as the effect of AppNL-G-F on MAPT pathology, we examined MAPT phosphorylation, oligomerization and misfolding in the aging process of all four genotypes, including MAPTP301S, APPNL-G-F and APPNL-G-F/MAPTP301S in comparison to WT C57BL/6 control. The total brain lysates were prepared from the fresh frozen brain tissue harvested at 3, 6 and 9-months and homogenized in RIPA buffer.
Recent studies highlight phosphorylated MAPT at threonine MAPT 217 (pTau217) as a new promising plasma biomarker for pathological changes implicated in AD [31]. Immunohistochemistry with postmortem AD brain tissue also demonstrated that pTau217 is found in neurofibrillary tangles (NFTs) and neuropil threads that are also positive for pTau181, 202, 202/205, 231, and 369/404 [32]. Levels of pTau217 also correlate with total Aβ and NFT brain load in AD brain [32, 33]. Thus, we use levels of pTau217 as biomarker for evaluating the pathological progression of the APPNL-G-F/MAPTP301S mouse model. Western blot of brain lysates from MAPTP301S and APPNL-G-F/MAPTP301S mice showed progressive accumulation of pTau217 over 3, 6 and 9-month range (Fig. 2A, B). The APPNL-G-F/MAPTP301S exhibited significantly more pTau217 MAPT phosphorylation at 6 and 9-months compared to MAPTP301S alone, which suggest that APPNL-G-F potentiated MAPT phosphorylation (Fig. 2A,sB). To further confirm the accumulation of hyper-phosphorylated MAPT in the brain lysate and exclude the variation on the total MAPT expression level, we quantified the MAPT phosphorylation at threonine181 (pTau181) with the AT270 antibody and total tau level with BT2 antibody (epitope between aa 194-198, but not PHF MAPT), respectively, by ELISA assay. The result showed that APPNL-G-F/MAPTP301S and MAPTP301S alone mice presented similar levels of total MAPT but APPNL-G-F/MAPTP301S contained significant elevated level of pTau181 (Fig. 2C–D).
Figure 2. APPNL-G-F potentiates progression of MAPT pathology in the APPNL-G-F/MAPTP301S double transgenic mice.
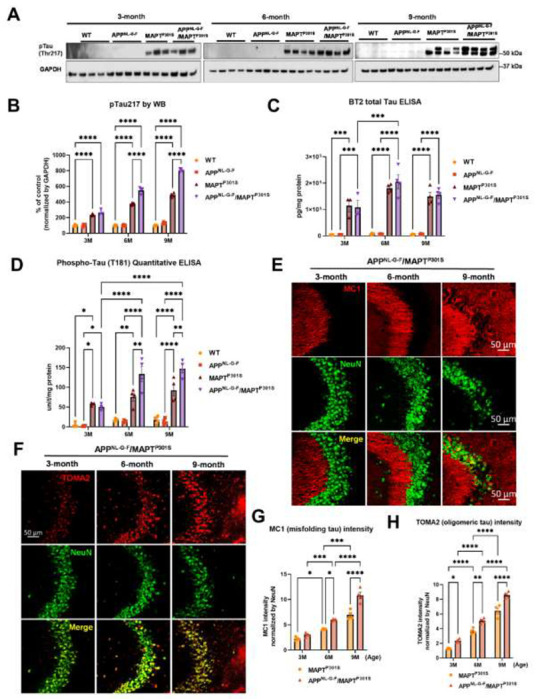
A. Representative images of western blot with phosphorylated tau antibody on phosphor-site threonine217 (pTau217) showed the accumulation of hyper phosphorylated tau in the MAPTP301S and APPNL-G-F/MAPTP301S mouse brain but not wild type (WT) or APPNL-G-F brain. Total brain lysate were harvested at 3, 6 and 9 months for each of the four genotypes (WT, APPNL-G-F, MAPTP301S, and APPNL-G-F/MAPTP301S) of mice, respectively. GAPDH was detected as the internal control.
B. Quantification of pTau217 in the total brain lysate as shown in (A). N=4 mice in each group, Data shown as mean ± SEM. Statistics was by two-way ANOVA with post hoc Tukey’s multiple comparisons test, ****p<0.001.
C-D. Detection of total MAPT levels in the brain lysates with the BT2 antibody (epitope between aa 194–198, but not PHF tau) and threonine181 phosphorylated tau (pTau181) by AT270 antibody, respectively, with ELISA assay. N=4 mice in each group, Data shown as mean ± SEM. Statistical analysis was by two-way ANOVA with post hoc Tukey’s multiple comparisons test, ***p<0.005, ****p<0.001.
E. Representative fluorescence labeling images showed the accumulation of misfolding tau (by MC1 antibody, red) in the hippocampal CA3 region of APPNL-G-F/MAPTP301S mice over 3, 6 and 9 months. NeuN antibody (green) was used to label the neuronal cells. Scale bar 50μm.
F. Representative fluorescence images show the accumulation of oligomeric tau (TOMA2 antibody, red) in the hippocampal CA3 brain region of APPNL-G-F/MAPTP301S mice over 3, 6 and 9 months. NeuN antibody (green) was used to label neurons. Scale bar 50μm.
G-H. Quantification of misfolded tau (MC1) and oligomeric tau (TOMA2) as shown in (E) and (F) respectively. Total fluorescence intensity was collected and then normalized by NeuN for statistics. N=4 mice in each group, data is shown as mean ± SEM. Two-way ANOVA was used for statistics followed by post hoc analysis with Tukey’s multiple comparisons test, *p<0.05, **p<0.01, ***p<0.005, ****p<0.001.
In addition to the MAPT phosphorylation, we also examined the MAPT aggregation by the conformational tau marker MC1 (epitope within aa 312-322) with immuno-fluorescence labeling. Our result showed that MAPT tau misfolding started at the dendritic compartment of the neurons in CA3 when the mice were 3-month old. The misfolded MAPT distributed and accumulated more in neuronal soma than dendrites and synapses when the mice were 9 month old (Fig 2E). Compared to MAPTP301S alone, the APPNL-G-F/MAPTP301S double transgenic mouse presented accelerated and potentiated accumulation of misfolded MAPT over the time span of 3, 6 and 9 month of age (Fig. 2G).
Studies suggest that MAPT oligomers are the more toxic species that induce neurodegeneration [25, 26, 34–36]. To assess the assembly of toxic MAPT oligomers in the APPNL-G-F/MAPTP301S double transgenic mouse, we labeled MAPT with the antibody TOMA2, which is the oligomeric MAPT specific by immuno-fluorescence labeling in the hippocampus. The result showed that oligomeric MAPT accumulated in the somatic compartment of the neurons and was elevated in older animals (9 m) (Fig. 2F). Quantification of TOMA2 intensity revealed that MAPT oligomers were more abundant in APPNL-G-F/MAPTP301S double transgenic mouse compared to MAPTP301S (Fig. 2H).
These results demonstrate that APPNL-G-F potentiates the progression of MAPT pathology including phosphorylation, mis-conformation and oligomerization in the APPNL-G-F/MAPTP301S double transgenic mice.
APPNL-G-F is the predominant driver of microglial activation and astrogliosis.
In addition to Aβ plaques and MAPT pathology, neuroinflammation including microglial activation and astrogliosis are thought to be key drivers mediating neurodegeneration in AD [37, 38]. To characterize the glial activation feature in the APPNL-G-F/MAPTP301S double transgenic mouse, we analyzed the microglial and astrocytic morphology changes as well as the transcriptomic level of inflammatory factors in the aging process of APPNL-G-F/MAPTP301S mouse brain. Our data showed that microglia exhibit a ramified appearance under basal conditions labeled by Iba-1 marker. The microglia then become hyper-ramified with elongation of their processes and increase branch complexity in MAPTP301S mouse brain, suggestive of an intermediate step to microglial activation or a mild response. In the APPNL-G-F and APPNL-G-F/MAPTP301S mouse brain, microglia bcome highly activated displaying morphological changes with thickening processes and amoeboid shape (Fig. 3A–B). At the same time, astrocytes (labeled by astrocytic marker GFAP) are robustly activated in APPNL-G-F and APPNL-G-F/MAPTP301S mouse brains exhibiting enlarged morphological sizes and co-localization with the Aβ plaques (Fig. 3A). The morphological changes of microglia and astrocyte are particularly enhanced in the conditions with APPNL-G-F, implying that APPNL-G-F is the predominant driver of microglial activation and astrogliosis (Fig. 3C–D).
Figure 3. APPNL-G-F is the predominant driver of microglial activation and astrogliosis.
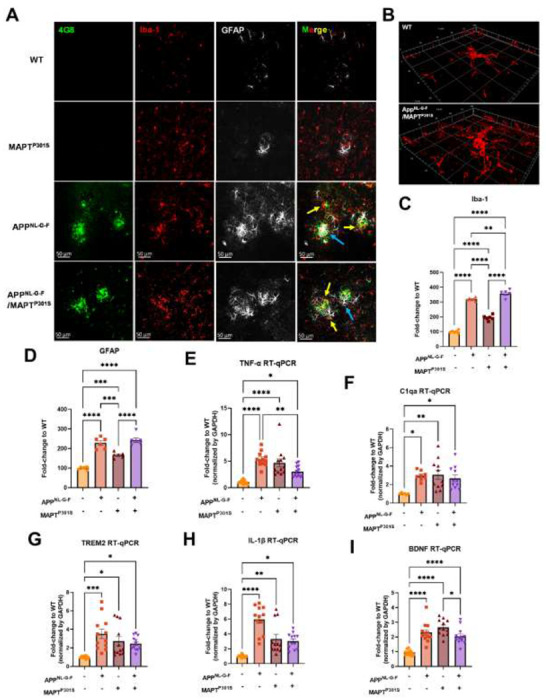
A. Representative fluorescence labeling images showed the activation and morphological changes of microglia (by Iba-1 antibody, red) in the frontal cortex in pathological APPNL-G-F and/or MAPTP301S mouse brain at 9-month old. Astrocytes (GFAP antibody, white) were robustly activated around Aβ plaques. Scale bar 50μm.
B. Enlarged image showed the amoeba-like morphological changes of microglia in the APPNL-G-F/MAPTP301S mouse brain.
C-D. Quantification of microglial activation by Iba-1 intensity and astrogliosis by GFAP intensity as shown in (A). Data was normalized to the fold increase of WT control. N=6 mice in each group, data is shown as mean ± SEM. Two-way ANOVA was used for statistics followed by post hoc analysis with Tukey’s multiple comparisons test, **p<0.01, ***p<0.005, ****p<0.001.
E-I. Quantification on the transcriptomic levels of inflammatory factors in the brain of WT, APPNL-G-F, MAPTP301S, and APPNL-G-F/MAPTP301S mouse lines, respectively, at 9-months. The pro-inflammatory factors TNF-α, IL-1 β, C1qa as well as BDNF were quantified by RT qPCR. Results are shown as fold-change vs. WT control. N=10-12 mice per group; data is shown as mean ± SEM. One-way ANOVA was used for statistics followed by post hoc analysis with Tukey’s multiple comparisons test, *p<0.05, **p<0.01, ***p<0.005, ****p<0.001.
To further confirm the microglia and astrocyte activation, we measured transcripts coding for pro-inflammatory cytokines, anti-inflammatory cytokines and complement proteins in the brain tissue of WT, APPNL-G-F, MAPTP301S, and APPNL-G-F/MAPTP301S mice, respectively. Our result show that the pro-inflammatory cytokine TNF-α and IL-1β are increased in all APPNL-G-F, MAPTP301S and APPNL-G-F/MAPTP301S mice compared to WT mice. Interestingly, the APPNL-G-F mouse brain showed the highest levels of the two inflammatory factors (Fig. 3E, H). The complement protein, C1q, has been shown to bind to fibrillar Aβ and NFTs in AD resulting in the activation of the classical complement pathway [39, 40]. In the APPNL-G-F/MAPTP301S mouse model, we examined the C1qa RNA level by RT-qPCR and found that it was elevated equally among the APPNL-G-F, MAPTP301S, and APPNL-G-F/MAPTP301S mouse lines compared to WT control (Fig. 3F). Next we analyzed TREM2, a key player in microglial biology and AD[41]. Analysis of TREM2 transcripts demonstrated a similar (~3-fold) increase in the APPNL-G-F, MAPTP301S, and APPNL-G-F/MAPTP301S mouse lines (Fig. 3G). Finally, we also examined brain-derived neurotrophic factor (BDNFs), which maintains synaptic plasticity and has attracted increasing attention for its potential as a biomarker or therapeutic molecule for AD [42]. Quantification of BDNF transcript by RT-PCR in the APPNL-G-F/MAPTP301S mouse model showed elevation BDNF each of the mouse models(Fig. 3I).
The combined data indicate that the APPNL-G-F/MAPTP301S mouse model recapitulates many of the pivotal neuroinflammatory features of AD, and also suggest that the accumulation of Aβ is a stronger driver of microglial activation and astrogliosis that MAPT pathology.
AppNL-G-F potentiates neurodegeneration in the APPNL-G-F/MAPTP301S mice
In the current APPNL-G-F/MAPTP301S mouse model, we have shown multiple hallmark features of AD, including Aβ plaques, MAPT pathology and neuroinflammation. To further understand their roles in mediating neurodegeneration, we quantified how expression of neuronal and synaptic markers change with aging in each mouse line (APPNL-G-F, MAPTP301S, and APPNL-G-F/MAPTP301S vs. WT control). Our results showed that the APPNL-G-F/MAPTP301S mouse line displayed progressive neuronal loss in consistency with Aβ plaques and tau pathology in the aging process from 3 to 6 and 9 month old (Fig. 4A). At 6-months, the APPNL-G-F/MAPTP301S mouse showed ~35% neuronal loss compared to WT control, which progressed to more than 60% loss of MAP-2 at 9-months (Fig. 4B). We aimed to elucidate the contribution of APPNL-G-F and MAPTP301S in neuronal loss by comparing the APPNL-G-F/MAPTP301S mouse to APPNL-G-F KI alone and P301S Tau PS19 conditions. Our result showed that APPNL-G-F KI itself exhibited limited amount of neuronal loss but can potentiate the neuronal loss in APPNL-G-F/MAPTP301S mouse brain in comparison to P301S MAPT PS19 over-expression alone (Fig. 4C–D). In addition to the immunofluorescence labeling, we also applied the biochemistry assay with post-synaptic marker PSD-95 probed by western blot to validate the neuronal deficit in APPNL-G-F/MAPTP301S mouse brain (Fig. 4E). The quantification of PSD-95 showed that MAPTP301S is correlated to the neuronal deficit while APPNL-G-F can potentiate the neuronal loss mediated by MAPTP301S (Fig. 4F).
Figure 4. APPNL-G-F potentiates neurodegeneration in the APPNLGF/MAPTP301S double transgenic mice.

A. Representative images showed the enhanced neurodegeneration (MAP-2, magenta) associated with progressive Aβ deposition (4G8, red) and phosphorylated tau (pTau217, green) accumulation in the APPNL-G-F/MAPTP301S mouse brain. Scale bar 50μm.
B. Quantification of neurodegeneration by MAP-2 intensity as shown in (A). N=6 mice in each group; data is shown as mean ± SEM. Two-way ANOVA was used for statistics followed by post hoc analysis with Tukey’s multiple comparisons test, *p<0.05, ****p<0.001.
C. Representative images showed enhanced neurodegeneration in APPNL-G-F/MAPTP301S mouse brain compared to APPNL-G-F or MAPTP301S mouse lines at 9-months. Scale bar 50μm.
D. Quantification of neurodegeneration by NeuN positive neuronal intensity as shown in panel C (magenta panels). N=6 mice in each group, data is shown as mean ± SEM. One-way ANOVA was used for statistics followed by post hoc analysis with Tukey’s multiple comparisons test, *p<0.05, ***p<0.005.
E-F. Western blot of post-synaptic marker PSD-95 showed the potentiated neurodegeneration in the APPNL-G-F/MAPTP301S mouse brain compared to APPNL-G-F or MAPTP301S mouse lines over a 3, 6 and 9-month old. Quantification of band intensities showed that progressive and enhanced decrease of PSD-95 in the AppNL-G-F /MAPTP301S mouse brain. N=4 mice in each group, data was normalized to percentage of WT control and is shown as mean ± SEM. Two-way ANOVA was used for statistics followed by post hoc analysis with Tukey’s multiple comparisons test, *p<0.05, **p<0.01, ***p<0.005, ****p<0.001.
N6-Methyladenosine and its regulator enzyme proteins are dysregulated in the APPNLGF/MAPTP301S double transgenic mice in correspondence to the progression of tau pathology.
N6-methyladenosine (m6A) is the most prevalent, abundant and conserved internal cotranscriptional modification in eukaryotic RNA [43]. In the recent studies, our group discovered that m6A accumulation is a general feature of AD pathology [23]. Levels of m6A modifications are controlled by addition of m6A modifications the m6A methyltransferases (also known as writers), such as METTL3/14/16, RBM15/15B and WTAP; m6A levels are also controlled by removal via demethylases (also known as erasers), including FTO and ALKBH5. The m6A -binding proteins YTHDF1/2/3, YTHDC1/2 IGF2BP1/2/3 and HNRNPA2B1 recognize the modifications; these are also known as “readers” [43]. Previously we showed that interaction of MAPT with HNRNPA2B1 and m6A RNA mediates the progression of tauopathy [23]. Other studies of AD indicate that m6A dysregulation often occurs in the context of altered expression of m6A writers and readers [44–48]. Hence we examined levels of m6A writers and readers in the APPNL-G-F/MAPTP301S mouse model. Levels of m6A progressively increased in the APPNL-G-F/MAPTP301S mouse at 3, 6 and 9-months compared to WT control (Fig. 5A–B). The m6A methyltransferase Mettl3 also increased in the AppNL-G-F, mAPTP301S and APPNLGF/MAPTP301S compared to WT control at 6-months. However, at 9 months only the MAPTP301S or APPNLGF/MAPTP301S mouse lines showed progressive increases in Mettl3 levels (Fig. 5C–D). The m6A eraser ALKBH5 showed a corresponding decrease in expression in MAPTP301S and APPNLGF/MAPTP301S mouse compared to WT control at 6 and 9 months (Fig. 5E–F). These results demonstrate dysregulation of m6A and enzymes in the m6A pathway in a manner similar to AD, and suggest that the phenomenon is predominantly driven by MAPTP301S tau pathology.
Figure 5. m6A and its regulator enzyme proteins are dysregulated in the APPNLGF/MAPTP301S double transgenic mice in correspondence to the progression of tau pathology.

A. Representative images showed the increased m6A intensity in APPNLGF/MAPTP301S mouse brain at 6-months compared to WT control. Scale bar 50μm.
B. Quantification of m6A intensity in comparison between APPNLGF/MAPTP301S and WT control during the aging process. N=6 mice in each group, 3 brain sections were selected from each mouse brain with same position of hippocampus CA3. Data are shown as mean ± SEM. Two-way ANOVA was used for statistics followed by post hoc analysis with Tukey’s multiple comparisons test, ***p<0.005, ****p<0.001.
C-D. Western blot analysis of the m6A methyltransferase Mettl3 showed progressively increased intensity in APPNL-G-F/MAPTP301S mouse brain compared to APPNL-G-F or MAPTP301S alone at 3, 6 and 9 months. GAPDH was detected and used as internal control for statistical analysis. N=4 mice in each group, data was normalized to percentage of WT control and is shown as mean ± SEM. Two-way ANOVA was used followed by post hoc analysis with Tukey’s multiple comparisons test, ****p<0.001.
E-F. Western blot analysis of the m6A RNA demethylase ALKBH5 showed decreased intensity in AppNL-G-F /MAPTP301S mouse brain compared to APPNL-G-F or MAPTP301S alone during the aging process at 3 6 and 9 months. Quantification of band intensity showed the dereased ALKBH5 correlated with MAPT pathology in APPNL-G-F/MAPTP301S and MAPTP301S mouse brain. GAPDH was used as internal control for statistical analysis. N=4 mice in each group, data was normalized to percentage of WT control and is shown as mean ± SEM. Two-way ANOVA was used followed by post hoc analysis with Tukey’s multiple comparisons test, ****p<0.001.
Discussion
The results presented above show that Aβ enhances tau pathologies (phosphorylation, misfolding, and fibrillization) in the context of P301S MAPT over-expression. Neurodegeneration parallels tau pathology, being enhanced in the double transgenic mouse. However, the converse is not true. Aβ pathologies (neuritic plaque, Aβ40 and Aβ42 load) are not greater in the APPNL-G-F/MAPTP301S mouse than in the APPNL-G-F mouse alone. These results are consistent with those recently reported for an APPNL-G-F/MAPTP209L mouse [49]. The report on the APPNL-G-F/MAPTP209L mouse showed enhancement of MAPT pathology by Aβ but did not provide any information on other pathologies, such as inflammation or m6A. We now report that the amount of inflammation parallels Aβ pathology, while the amount of m6A parallels MAPT pathology.
These results are generally consistent with prior observations using crosses of APP over-expression mouse lines and MAPT over-expression mouse models [12–17]. These over-expression models consistently observe that the presence of Aβ pathology enhances the accumulation of MAPT pathology, neurodegeneration and cognitive loss [12–17]. These same studies indicate that the presence of MAPT pathology either doesn’t change the accumulation of Aβ pathology or decreases it [12–17], with only one initial study suggesting that MAPT pathology increases Aβ pathology [18]. A closer look at the MAPT and Aβ pathologies suggest further parallels between the APPNL-G-F/MAPTP301S cross and AD in humans. Bulbous processes filled with MAPT can be seen surrounding Aβ plaques in both the APPNL-G-F/MAPTP301S cross and in AD. These bulbous processes are thought to reflect degenerating neuronal dendritic processes (Fig. 4A) [50]. The enhancement of MAPT pathology in the APPNL-G-F/MAPTP301S mouse is also evident in the distribution of MAPT pathology in the hippocampus. The APPNL-G-F model exhibits modest phospho-MAPT pathology at 6 and 9 months that is evident in the dendritic fields in the CA3 region, while the APPNL-G-F/MAPTP301S cross exhibits MAPT pathology in the dendritic fields as well as in the neuronal soma of CA3 (Fig. 4D). The cell body MAPT pathology is particularly important because this pathology colocalizes with markers of the translational stress response, such as stress granule proteins HNRNPA2B1, TIA1, EIF3n and PABP, and also neuronal death (as shown by cleaved caspase 3 and loss of NeuN positive cells) [23, 25, 36, 51–53]. Thus, neurodegeneration appears to be potentiated in the APPNL-G-F/MAPTP301S model.
Increasing evidence points to a key role for inflammation in AD. Many AD-linked genes appear to enhance disease risk by affecting the biology of microglia. For instance, TREM2 is one of the strongest risk factors for AD, and evidence suggests that TREM2 acts to recognize Aβ pathology and direct microglial responses toward the pathology [54, 55]. The strong impact of Aβ on inflammation is also evident in the APPNL-G-F/MAPTP301S model. Inflammatory cells are readily evident in the area around Aβ plaques (Fig. 3A). These microglia were more abundant and showed greater ramifications than in the P301S MAPT model. However, it is important to note that microglia do respond to MAPT pathology; Iba1 reactivity was increased in the P301S MAPT model, but not to the same level as observed in the APPNL-G-F or APPNL-G-F/MAPTP301S model. These results are consistent with published work indicating that Aβ pathology elicits a phenotype termed “Disease Associated Microglia” while MAPT pathology elicits microglial responses exhibiting weaker cytokine production [56].
The increases observed for m6A parallel those reported by our group previously [23]. We observed that increases in m6A were observed most prominently in neurons, and that levels of m6A correlated with levels of MAPT pathology. This finding is consistent with the observation that MAPT pathology co-localizes with the RNA binding protein, HNRNPA2B1, which functions as an indirect m6A reader. The results presented above in Figure 5 directly compare m6A levels in the context of MAPT pathology, Aβ pathology and combined MAPT and Aβ pathology. The results are clear in that m6A levels follow MAPT pathology. A previous manuscript examining m6A in an AD model utilizing over-expression of only APP, which is a model that exhibits Aβ accumulation without corresponding MAPT pathology. The data presented above suggest that the absence of MAPT pathology in this model produced a corresponding absence of m6A accumulation [44]. Our studies also provide insight into potential mechanisms regulating m6A in disease. The increases in m6A observed correlate with MAPT pathology are show a corresponding association with increased levels of METTL3 and reduced levels of ALKBH5, which are the enzymes that respectively add and remove m6A from mRNA. More writing combined with reduced erasure leads to increased levels of m6A.
Although changes in m6A were most evident in neurons, the results in Figure 5A show that some astrocytes and microglia also exhibited strong increases in m6A in the APPNL-G-F/MAPTP301S model. Such results are consistent with emerging studies showing that m6A regulates inflammation, macrophages and also astrocytosis [57–61]. Such findings raise the possibility that m6A modulation might also be applied towards regulation of inflammation in AD; indeed a recent study observed that conditional knockout of METTL3 in microglia attenuated inflammation and Aβ accumulation in a mouse model based on Aβ injection [62].
Conclusion
The field is increasingly moving towards use of KI models. The APPNL-G-F/MAPTP301S model described in this manuscript takes advantage of the APPNL-G-F KI line, but utilizes the human MAPTP301S line in order to achieve robust MAPT pathology. Our results show that this model provides an appealing alternative to the double APPNL-G-F x MAPT KI model, which develop both MAPT pathologies very slowly [21]. The current APPNL-G-F/MAPTP301S model thus provides a useful compromise. This model exhibits strong Aβ accumulation and strong inflammation, while avoiding artifacts associated with APP or presenilin over-expression. The APPNL-G-F/MAPTP301S model also possesses the benefits arising from strong expression of human MAPT with the resulting rapid development of robust MAPT pathology, strong m6A accumulation and, importantly, significant neurodegeneration.
Acknowledgements and Funding Declaration
We would like to thank the following funding agencies for their support: BW: NIH (AG050471, R01AG080810, AG056318, AG064932, AG061706, UO1AG072577) and the BrightFocus Foundation. SR: JSPS Kakenhi 20KK0338.
Abbreviations
- Aβ
β-Amyloid
- AD
Alzheimer disease
- ALKBH5
AlkB Homolog 5
- APP
Amyloid precursor protein
- ELISA
Enzyme-linked immunosorbent assay
- FTO
Fat mass and obesity associated
- GFAP
Glial fibrillary acidic protein
- HNRNPA2B1
Heterogeneous Nuclear Ribonucleoprotein A2/B1
- Iba-1
Ionized calcium binding adaptor molecule 1
- m6A
N6-Methyladenosine
- MAPT, Tau
microtubule associated protein tau
- Mettl3
Methyltransferase-like 3
- qPCR
Quantitative polymerase chain reaction
- YTHDF1
YTH N6-Methyladenosine RNA Binding Protein 1
- YTHDF2
YTH N6-Methyladenosine RNA Binding Protein 2
Footnotes
Ethics approval and consent to participate
Not Applicable
Consent for publication
All authors are consent for publication
Competing interests
B.W. is co-founder and Chief Scientific Officer for Aquinnah Pharmaceuticals Inc. All other authors declare that they have no competing interests to disclose.
Availability of data and materials
Generated datasets used for analyses in this study are available from the corresponding author upon reasonable request.
References
- 1.Scheltens P, De Strooper B, Kivipelto M, Holstege H, Chetelat G, Teunissen CE, Cummings J, van der Flier WM: Alzheimer’s disease. Lancet 2021, 397:1577–1590. [DOI] [PMC free article] [PubMed] [Google Scholar]
- 2.Sasaguri H, Hashimoto S, Watamura N, Sato K, Takamura R, Nagata K, Tsubuki S, Ohshima T, Yoshiki A, Sato K, et al. : Recent Advances in the Modeling of Alzheimer’s Disease. Front Neurosci 2022, 16:807473. [DOI] [PMC free article] [PubMed] [Google Scholar]
- 3.Saito T, Matsuba Y, Mihira N, Takano J, Nilsson P, Itohara S, Iwata N, Saido TC: Single App knock-in mouse models of Alzheimer’s disease. Nat Neurosci 2014, 17:661–663. [DOI] [PubMed] [Google Scholar]
- 4.Sakakibara Y, Sekiya M, Saito T, Saido TC, Iijima KM: Cognitive and emotional alterations in App knock-in mouse models of Abeta amyloidosis. BMC Neurosci 2018, 19:46. [DOI] [PMC free article] [PubMed] [Google Scholar]
- 5.Eckermann K, Mocanu MM, Khlistunova I, Biernat J, Nissen A, Hofmann A, Schonig K, Bujard H, Haemisch A, Mandelkow E, et al. : The beta-propensity of Tau determines aggregation and synaptic loss in inducible mouse models of tauopathy. J Biol Chem 2007, 282:31755–31765. [DOI] [PubMed] [Google Scholar]
- 6.Mocanu MM, Nissen A, Eckermann K, Khlistunova I, Biernat J, Drexler D, Petrova O, Schonig K, Bujard H, Mandelkow E, et al. : The potential for beta-structure in the repeat domain of tau protein determines aggregation, synaptic decay, neuronal loss, and coassembly with endogenous Tau in inducible mouse models of tauopathy. J Neurosci 2008, 28:737–748. [DOI] [PMC free article] [PubMed] [Google Scholar]
- 7.Hutton M, Lewis J, Dickson D, Yen SH, McGowan E: Analysis of tauopathies with transgenic mice. Trends Mol Med 2001, 7:467–470. [DOI] [PubMed] [Google Scholar]
- 8.Sasaguri H, Nilsson P, Hashimoto S, Nagata K, Saito T, De Strooper B, Hardy J, Vassar R, Winblad B, Saido TC: APP mouse models for Alzheimer’s disease preclinical studies. EMBO J 2017, 36:2473–2487. [DOI] [PMC free article] [PubMed] [Google Scholar]
- 9.Lewis J, McGowan E, Rockwood J, Melrose H, Nacharaju P, Van Slegtenhorst M, Gwinn-Hardy K, Paul Murphy M, Baker M, Yu X, et al. : Neurofibrillary tangles, amyotrophy and progressive motor disturbance in mice expressing mutant (P301L) tau protein. Nat Genet 2000, 25:402–405. [DOI] [PubMed] [Google Scholar]
- 10.Polydoro M, Acker CM, Duff K, Castillo PE, Davies P: Age-dependent impairment of cognitive and synaptic function in the htau mouse model of tau pathology. J Neurosci 2009, 29:10741–10749. [DOI] [PMC free article] [PubMed] [Google Scholar]
- 11.Ramsden M, Kotilinek L, Forster C, Paulson J, McGowan E, SantaCruz K, Guimaraes A, Yue M, Lewis J, Carlson G, et al. : Age-dependent neurofibrillary tangle formation, neuron loss, and memory impairment in a mouse model of human tauopathy (P301L). J Neurosci 2005, 25:10637–10647. [DOI] [PMC free article] [PubMed] [Google Scholar]
- 12.Heraud C, Goufak D, Ando K, Leroy K, Suain V, Yilmaz Z, De Decker R, Authelet M, Laporte V, Octave JN, Brion JP: Increased misfolding and truncation of tau in APP/PS1/tau transgenic mice compared to mutant tau mice. Neurobiol Dis 2014, 62:100–112. [DOI] [PubMed] [Google Scholar]
- 13.Chen W, Abud EA, Yeung ST, Lakatos A, Nassi T, Wang J, Blum D, Buee L, Poon WW, Blurton-Jones M: Increased tauopathy drives microglia-mediated clearance of beta-amyloid. Acta Neuropathol Commun 2016, 4:63. [DOI] [PMC free article] [PubMed] [Google Scholar]
- 14.Chabrier MA, Cheng D, Castello NA, Green KN, LaFerla FM: Synergistic effects of amyloid-beta and wild-type human tau on dendritic spine loss in a floxed double transgenic model of Alzheimer’s disease. Neurobiol Dis 2014, 64:107–117. [DOI] [PMC free article] [PubMed] [Google Scholar]
- 15.Saul A, Sprenger F, Bayer TA, Wirths O: Accelerated tau pathology with synaptic and neuronal loss in a novel triple transgenic mouse model of Alzheimer’s disease. Neurobiol Aging 2013, 34:2564–2573. [DOI] [PubMed] [Google Scholar]
- 16.Stancu IC, Ris L, Vasconcelos B, Marinangeli C, Goeminne L, Laporte V, Haylani LE, Couturier J, Schakman O, Gailly P, et al. : Tauopathy contributes to synaptic and cognitive deficits in a murine model for Alzheimer’s disease. FASEB J 2014, 28:2620–2631. [DOI] [PubMed] [Google Scholar]
- 17.Kang S, Kim J, Chang KA: Spatial memory deficiency early in 6xTg Alzheimer’s disease mouse model. Sci Rep 2021, 11:1334. [DOI] [PMC free article] [PubMed] [Google Scholar]
- 18.Ribe EM, Perez M, Puig B, Gich I, Lim F, Cuadrado M, Sesma T, Catena S, Sanchez B, Nieto M, et al. : Accelerated amyloid deposition, neurofibrillary degeneration and neuronal loss in double mutant APP/tau transgenic mice. Neurobiol Dis 2005, 20:814–822. [DOI] [PubMed] [Google Scholar]
- 19.Pooler AM, Polydoro M, Maury EA, Nicholls SB, Reddy SM, Wegmann S, William C, Saqran L, Cagsal-Getkin O, Pitstick R, et al. : Amyloid accelerates tau propagation and toxicity in a model of early Alzheimer’s disease. Acta Neuropathol Commun 2015, 3:14. [DOI] [PMC free article] [PubMed] [Google Scholar]
- 20.Balducci C, Forloni G: APP transgenic mice: their use and limitations. Neuromolecular Med 2011, 13:117–137. [DOI] [PubMed] [Google Scholar]
- 21.Saito T, Mihira N, Matsuba Y, Sasaguri H, Hashimoto S, Narasimhan S, Zhang B, Murayama S, Higuchi M, Lee VMY, et al. : Humanization of the entire murine Mapt gene provides a murine model of pathological human tau propagation. J Biol Chem 2019, 294:12754–12765. [DOI] [PMC free article] [PubMed] [Google Scholar]
- 22.Islam A, Saito T, Saido T, Ali AB: Presubiculum principal cells are preserved from degeneration in knock-in APP/TAU mouse models of Alzheimer’s disease. Semin Cell Dev Biol 2023, 139:55–72. [DOI] [PMC free article] [PubMed] [Google Scholar]
- 23.Jiang L, Lin W, Zhang C, Ash PEA, Verma M, Kwan J, van Vliet E, Yang Z, Cruz AL, Boudeau S, et al. : Interaction of tau with HNRNPA2B1 and N(6)-methyladenosine RNA mediates the progression of tauopathy. Mol Cell 2021, 81:4209–4227 e4212. [DOI] [PMC free article] [PubMed] [Google Scholar]
- 24.Yoshiyama Y, Higuchi M, Zhang B, Huang SM, Iwata N, Saido TC, Maeda J, Suhara T, Trojanowski JQ, Lee VM: Synapse loss and microglial activation precede tangles in a P301S tauopathy mouse model. Neuron 2007, 53:337–351. [DOI] [PubMed] [Google Scholar]
- 25.Jiang L, Ash PEA, Maziuk BF, Ballance HI, Boudeau S, Abdullatif AA, Orlando M, Petrucelli L, Ikezu T, Wolozin B: TIA1 regulates the generation and response to toxic tau oligomers. Acta Neuropathol 2019, 137:259–277. [DOI] [PMC free article] [PubMed] [Google Scholar]
- 26.Castillo-Carranza DL, Sengupta U, Guerrero-Munoz MJ, Lasagna-Reeves CA, Gerson JE, Singh G, Estes DM, Barrett AD, Dineley KT, Jackson GR, Kayed R: Passive immunization with Tau oligomer monoclonal antibody reverses tauopathy phenotypes without affecting hyperphosphorylated neurofibrillary tangles. JNeurosci 2014, 34:4260–4272. [DOI] [PMC free article] [PubMed] [Google Scholar]
- 27.Xia W, Yang T, Shankar G, Smith IM, Shen Y, Walsh DM, Selkoe DJ: A specific enzyme-linked immunosorbent assay for measuring beta-amyloid protein oligomers in human plasma and brain tissue of patients with Alzheimer disease. Arch Neurol 2009, 66:190–199. [DOI] [PMC free article] [PubMed] [Google Scholar]
- 28.Stein TD, Montenigro PH, Alvarez VE, Xia W, Crary JF, Tripodis Y, Daneshvar DH, Mez J, Solomon T, Meng G, et al. : Beta-amyloid deposition in chronic traumatic encephalopathy. Acta Neuropathol 2015, 130:21–34. [DOI] [PMC free article] [PubMed] [Google Scholar]
- 29.Stathas S, Alvarez VE, Xia W, Nicks R, Meng G, Daley S, Pothast M, Shah A, Kelley H, Esnault C, et al. : Tau phosphorylation sites serine202 and serine396 are differently altered in chronic traumatic encephalopathy and Alzheimer’s disease. Alzheimers Dement 2022, 18:1511–1522. [DOI] [PMC free article] [PubMed] [Google Scholar]
- 30.van Dyck CH, Swanson CJ, Aisen P, Bateman RJ, Chen C, Gee M, Kanekiyo M, Li D, Reyderman L, Cohen S, et al. : Lecanemab in Early Alzheimer’s Disease. N Engl J Med 2023, 388:9–21. [DOI] [PubMed] [Google Scholar]
- 31.Telser J, Risch L, Saely CH, Grossmann K, Werner P: P-tau217 in Alzheimer’s disease. Clin Chim Acta 2022, 531:100–111. [DOI] [PubMed] [Google Scholar]
- 32.Wennstrom M, Janelidze S, Nilsson KPR, Netherlands Brain B, Serrano GE, Beach TG, Dage JL, Hansson O: Cellular localization of p-tau217 in brain and its association with p-tau217 plasma levels. Acta neuropathologica communications 2022, 10:3. [DOI] [PMC free article] [PubMed] [Google Scholar]
- 33.Ashton NJ, Janelidze S, Mattsson-Carlgren N, Binette AP, Strandberg O, Brum WS, Karikari TK, Gonzalez-Ortiz F, Di Molfetta G, Meda FJ, et al. : Differential roles of Abeta42/40, p-tau231 and p-tau217 for Alzheimer’s trial selection and disease monitoring. Nat Med 2022, 28:2555–2562. [DOI] [PMC free article] [PubMed] [Google Scholar]
- 34.Lasagna-Reeves CA, Castillo-Carranza DL, Sengupta U, Clos AL, Jackson GR, Kayed R: Tau oligomers impair memory and induce synaptic and mitochondrial dysfunction in wild-type mice. Mol Neurodegener 2011, 6:39. [DOI] [PMC free article] [PubMed] [Google Scholar]
- 35.Jiang L, Zhao J, Cheng JX, Wolozin B: Tau Oligomers and Fibrils Exhibit Differential Patterns of Seeding and Association With RNA Binding Proteins. Front Neurol 2020, 11:579434. [DOI] [PMC free article] [PubMed] [Google Scholar]
- 36.Apicco DJ, Ash PEA, Maziuk B, LeBlang C, Medalla M, Al Abdullatif A, Ferragud A, Botelho E, Ballance HI, Dhawan U, et al. : Reducing the RNA binding protein TIA1 protects against tau-mediated neurodegeneration in vivo. Nat Neurosci 2018, 21:72–80. [DOI] [PMC free article] [PubMed] [Google Scholar]
- 37.Leng F, Edison P: Neuroinflammation and microglial activation in Alzheimer disease: where do we go from here? Nat Rev Neurol 2021, 17:157–172. [DOI] [PubMed] [Google Scholar]
- 38.Hansen DV, Hanson JE, Sheng M: Microglia in Alzheimer’s disease. J Cell Biol 2018, 217:459–472. [DOI] [PMC free article] [PubMed] [Google Scholar]
- 39.Rupprecht C, Rupprecht R, Rammes G: C1q, a small molecule with high impact on brain development: putative role for aging processes and the occurrence of Alzheimer’s disease. Eur Arch Psychiatry Clin Neurosci 2021, 271:809–812. [DOI] [PMC free article] [PubMed] [Google Scholar]
- 40.Afagh A, Cummings BJ, Cribbs DH, Cotman CW, Tenner AJ: Localization and cell association of C1q in Alzheimer’s disease brain. Exp Neurol 1996, 138:22–32. [DOI] [PubMed] [Google Scholar]
- 41.Ulland TK, Colonna M: TREM2 - a key player in microglial biology and Alzheimer disease. Nat Rev Neurol 2018, 14:667–675. [DOI] [PubMed] [Google Scholar]
- 42.Bathina S, Das UN: Brain-derived neurotrophic factor and its clinical implications. Arch Med Sci 2015, 11:1164–1178. [DOI] [PMC free article] [PubMed] [Google Scholar]
- 43.Jiang X, Liu B, Nie Z, Duan L, Xiong Q, Jin Z, Yang C, Chen Y: The role of m6A modification in the biological functions and diseases. Signal Transduct Target Ther 2021, 6:74. [DOI] [PMC free article] [PubMed] [Google Scholar]
- 44.Han M, Liu Z, Xu Y, Liu X, Wang D, Li F, Wang Y, Bi J: Abnormality of m6A mRNA Methylation Is Involved in Alzheimer’s Disease. Front Neurosci 2020, 14:98. [DOI] [PMC free article] [PubMed] [Google Scholar]
- 45.Deng Y, Zhu H, Xiao L, Liu C, Liu YL, Gao W: Identification of the function and mechanism of m6A reader IGF2BP2 in Alzheimer’s disease. Aging (Albany NY) 2021, 13:24086–24100. [DOI] [PMC free article] [PubMed] [Google Scholar]
- 46.Huang H, Camats-Perna J, Medeiros R, Anggono V, Widagdo J: Altered Expression of the m6A Methyltransferase METTL3 in Alzheimer’s Disease. eNeuro 2020, 7. [DOI] [PMC free article] [PubMed] [Google Scholar]
- 47.Zhang X, Yang S, Han S, Sun Y, Han M, Zheng X, Li F, Wei Y, Wang Y, Bi J: Differential methylation of circRNA m6A in an APP/PS1 Alzheimer’s disease mouse model. Mol Med Rep 2023, 27. [DOI] [PMC free article] [PubMed] [Google Scholar]
- 48.Zhao F, Xu Y, Gao S, Qin L, Austria Q, Siedlak SL, Pajdzik K, Dai Q, He C, Wang W, et al. : METTL3-dependent RNA m(6)A dysregulation contributes to neurodegeneration in Alzheimer’s disease through aberrant cell cycle events. Mol Neurodegener 2021, 16:70. [DOI] [PMC free article] [PubMed] [Google Scholar]
- 49.Huang M, Macdonald J, Lavenir I, Chen R, Craxton M, Slavik-Smith E, Davies SW, Goedert M: Increase in Tau Pathology in P290S Mapt Knock-In Mice Crossed with App (NL-G-F) Mice. eNeuro 2022, 9. [DOI] [PMC free article] [PubMed] [Google Scholar]
- 50.Ballatore C, Lee VM, Trojanowski JQ: Tau-mediated neurodegeneration in Alzheimer’s disease and related disorders. Nat Rev Neurosci 2007, 8:663–672. [DOI] [PubMed] [Google Scholar]
- 51.Apicco DJ, Zhang C, Maziuk B, Jiang L, Ballance HI, Boudeau S, Ung C, Li H, Wolozin B: Dysregulation of RNA Splicing in Tauopathies. Cell reports 2019, 29:4377–4388 e4374. [DOI] [PMC free article] [PubMed] [Google Scholar]
- 52.Ash PE, Vanderweyde TE, Youmans KL, Apicco DJ, Wolozin B: Pathological stress granules in Alzheimer’s disease. Brain Res 2014, 1584:52–58. [DOI] [PMC free article] [PubMed] [Google Scholar]
- 53.Maziuk BF, Apicco DJ, Cruz AL, Jiang L, Ash PEA, da Rocha EL, Zhang C, Yu WH, Leszyk J, Abisambra JF, et al. : RNA binding proteins co-localize with small tau inclusions in tauopathy. Acta Neuropathol Commun 2018, 6:71. [DOI] [PMC free article] [PubMed] [Google Scholar]
- 54.Guerreiro R, Wojtas A, Bras J, Carrasquillo M, Rogaeva E, Majounie E, Cruchaga C, Sassi C, Kauwe JS, Younkin S, et al. : TREM2 variants in Alzheimer’s disease. N Engl J Med 2013, 368:117–127. [DOI] [PMC free article] [PubMed] [Google Scholar]
- 55.Zhou Y, Song WM, Andhey PS, Swain A, Levy T, Miller KR, Poliani PL, Cominelli M, Grover S, Gilfillan S, et al. : Human and mouse single-nucleus transcriptomics reveal TREM2-dependent and TREM2-independent cellular responses in Alzheimer’s disease. Nat Med 2020, 26:131–142. [DOI] [PMC free article] [PubMed] [Google Scholar]
- 56.Paolicelli RC, Sierra A, Stevens B, Tremblay ME, Aguzzi A, Ajami B, Amit I, Audinat E, Bechmann I, Bennett M, et al. : Microglia states and nomenclature: A field at its crossroads. Neuron 2022, 110:3458–3483. [DOI] [PMC free article] [PubMed] [Google Scholar]
- 57.Cockova Z, Honc O, Telensky P, Olsen MJ, Novotny J: Streptozotocin-Induced Astrocyte Mitochondrial Dysfunction Is Ameliorated by FTO Inhibitor MO-I-500. ACS Chem Neurosci 2021. [DOI] [PubMed] [Google Scholar]
- 58.Sun J, Liu G, Chen R, Zhou J, Chen T, Cheng Y, Lou Q, Wang H: PARP1 Is Upregulated by Hyperglycemia Via N6-methyladenosine Modification and Promotes Diabetic Retinopathy. Discov Med 2022, 34:115–129. [PubMed] [Google Scholar]
- 59.Sun Z, Chen W, Wang Z, Wang S, Zan J, Zheng L, Zhao W: Matr3 reshapes m6A modification complex to alleviate macrophage inflammation during atherosclerosis. Clin Immunol 2022, 245:109176. [DOI] [PubMed] [Google Scholar]
- 60.Wang JN, Wang F, Ke J, Li Z, Xu CH, Yang Q, Chen X, He XY, He Y, Suo XG, et al. : Inhibition of METTL3 attenuates renal injury and inflammation by alleviating TAB3 m6A modifications via IGF2BP2-dependent mechanisms. Sci TranslMed 2022, 14:eabk2709. [DOI] [PubMed] [Google Scholar]
- 61.Yi D, Wang Q, Zhao Y, Song Y, You H, Wang J, Liu R, Shi Z, Chen X, Luo Q: Alteration of N (6) - Methyladenosine mRNA Methylation in a Rat Model of Cerebral Ischemia-Reperfusion Injury. Front Neurosci 2021, 15:605654. [DOI] [PMC free article] [PubMed] [Google Scholar]
- 62.Yin H, Ju Z, Zheng M, Zhang X, Zuo W, Wang Y, Ding X, Zhang X, Peng Y, Li J, et al. : Loss of the m6A methyltransferase METTL3 in monocyte-derived macrophages ameliorates Alzheimer’s disease pathology in mice. PLoS Biol 2023, 21:e3002017. [DOI] [PMC free article] [PubMed] [Google Scholar]
Associated Data
This section collects any data citations, data availability statements, or supplementary materials included in this article.
Data Availability Statement
Generated datasets used for analyses in this study are available from the corresponding author upon reasonable request.