

Abstract
Ample evidence indicates that the gut microbiome is a tumor-extrinsic factor associated with antitumor response to anti-programmed cell death protein-1 (PD-1) therapy, but inconsistencies exist between published microbial signatures associated with clinical outcomes. To resolve this, we evaluated a new melanoma cohort, along with four published datasets. Time-to-event analysis showed that baseline microbiota composition was optimally associated with clinical outcome at approximately 1 year after initiation of treatment. Meta-analysis and other bioinformatic analyses of the combined data show that bacteria associated with favorable response are confined within the Actinobacteria phylum and the Lachnospiraceae/Ruminococcaceae families of Firmicutes. Conversely, Gram-negative bacteria were associated with an inflammatory host intestinal gene signature, increased blood neutrophil-to-lymphocyte ratio, and unfavorable outcome. Two microbial signatures, enriched for Lachnospiraceae spp. and Streptococcaceae spp., were associated with favorable and unfavorable clinical response, respectively, and with distinct immune-related adverse effects. Despite between-cohort heterogeneity, optimized all-minus-one supervised learning algorithms trained on batch-corrected microbiome data consistently predicted outcomes to programmed cell death protein-1 therapy in all cohorts. Gut microbial communities (microbiotypes) with nonuniform geographical distribution were associated with favorable and unfavorable outcomes, contributing to discrepancies between cohorts. Our findings shed new light on the complex interaction between the gut microbiome and response to cancer immunotherapy, providing a roadmap for future studies.
The intestinal microbiome has emerged as a tumor-extrinsic predictive biomarker to immune checkpoint blockade (ICB)1–6. Additionally, there is evidence that the microbiome is associated with development of immune-related adverse events (irAEs) following ICB7–9. Administration of certain gut commensals promotes efficacy of anti-programmed cell death protein-1 (PD-1) therapy in mice, providing evidence that microbiota can drive immunotherapy outcomes4–6. In two proof-of-concept trials with a total of 26 patients, responder-derived fecal microbiota transplantation (FMT) overcame PD-1 resistance in a third of patients with melanoma, suggesting that microbiome modulation could improve responsiveness to anti-PD-1 ICB10,11. However, there is limited concordance among species identified across studies, which included small numbers of patients and used different analytical approaches, not always adjusted for multiple testing4,5,12,13. Three meta-analyses including multiple tumors and treatments and applying uniform computational approaches have not explained discrepancies among published cohorts14–16. It also is unclear whether the microbiome exerts positive or negative effects on effectiveness of ICB therapy and at which time during therapy microbiome action is most important.
In this study, we evaluated a large cohort of microbiome samples of PD-1-treated patients with melanoma, integrating time-to-event outcomes with variables including medications, neutrophil-to-lymphocyte ratio (NLR) and irAEs. We identified distinct microbial signatures associated with specific irAE profiles and outcomes, and a systemic and enteric lipopolysaccharide (LPS)-dependent inflammatory status associated with unfavorable clinical response. We performed meta-analysis of microbial sequencing data from the new cohort and four published independent cohorts of PD-1-treated patients with melanoma4,5,12,13, using the same bioinformatic approach. Cross-cohort microbiome-trained machine learning consistently predicted outcomes of PD-1 therapy despite heterogeneity among cohorts. Distinct geographically distributed intestinal microbial signatures (microbiotypes) were differentially associated with PD-1 response, partly explaining discrepancies among cohorts.
Results
Patients and treatment.
Stool samples were collected from 94 PD-1-treated patients with melanoma (Supplementary Table 1). Samples were collected before treatment or within 4 months of starting anti-PD-1 (63 patients, Pittsburgh early sample cohort (P-ESC)) or after more than 4 months (range, 4–41 months) from the start of anti-PD-1 (31 patients, Pittsburgh late sample cohort (P-LSC)). The P-ESC was considered representative of baseline microbiome data due to observations that the microbiome of patients treated with anti-PD-1, unlike anti-CTLA-4 or chemotherapy, is stable early after therapy initiation17–19. Extended Data Fig. 1a,b depicts Kaplan–Meier curves for progression-free survival (PFS) and overall survival (OS) of P-ESC patients. The association of select clinical characteristics upon OS and PFS was evaluated using Cox regression hazards model (Supplementary Table 2). Low body mass index and high NLR were negatively associated with OS, while use of proton pump inhibitors (PPIs) and high NLR were negatively associated with PFS. Data from the Pittsburgh melanoma cohort also were combined in a meta-analysis with four published cohorts of PD-1-treated patients with melanoma (Supplementary Table 3)4,5,12,13.
Fecal microbiome signatures associate with PD-1-response.
To estimate the time at which baseline intestinal microbiome composition was maximally associated with clinical outcomes, we computed permutational multivariate analysis of variance (PERMANOVA) P values and distances between centroids using taxonomic relative abundances comparing non-progressors (NPs) and progressors (Ps) at various time points after therapy initiation (Fig. 1a). Microbiota composition reflected maximal separation between Ps and NPs at 9–10 months (Fig. 1a,b; distance = 0.32, P = 0.006). The most differentially abundant species in NPs were Ruminococcus (Mediterraneibacter) torques, Blautia producta, Blautia wexlerae, Blautia hansenii, Eubacterium rectale, Ruminococcus (Mediterraneibacter) gnavus and Anaerostipes hadrus. Ps exhibited increased abundance of Prevotella spp., Oscillibacter spp., Alistipes spp. and Sutterellaceae spp. (Fig. 1c). To estimate PFS probability for each taxon, we categorized patients into high/low groups based on the optimal cutoff of fecal bacterial abundance identified using Evaluate Cutpoints and calculated Kaplan–Meier curves (Extended Data Fig. 1c).
Fig. 1 |. Compositional differences in the fecal microbiome of anti-PD-1-treated patients with melanoma are associated with differential progression-free survival.
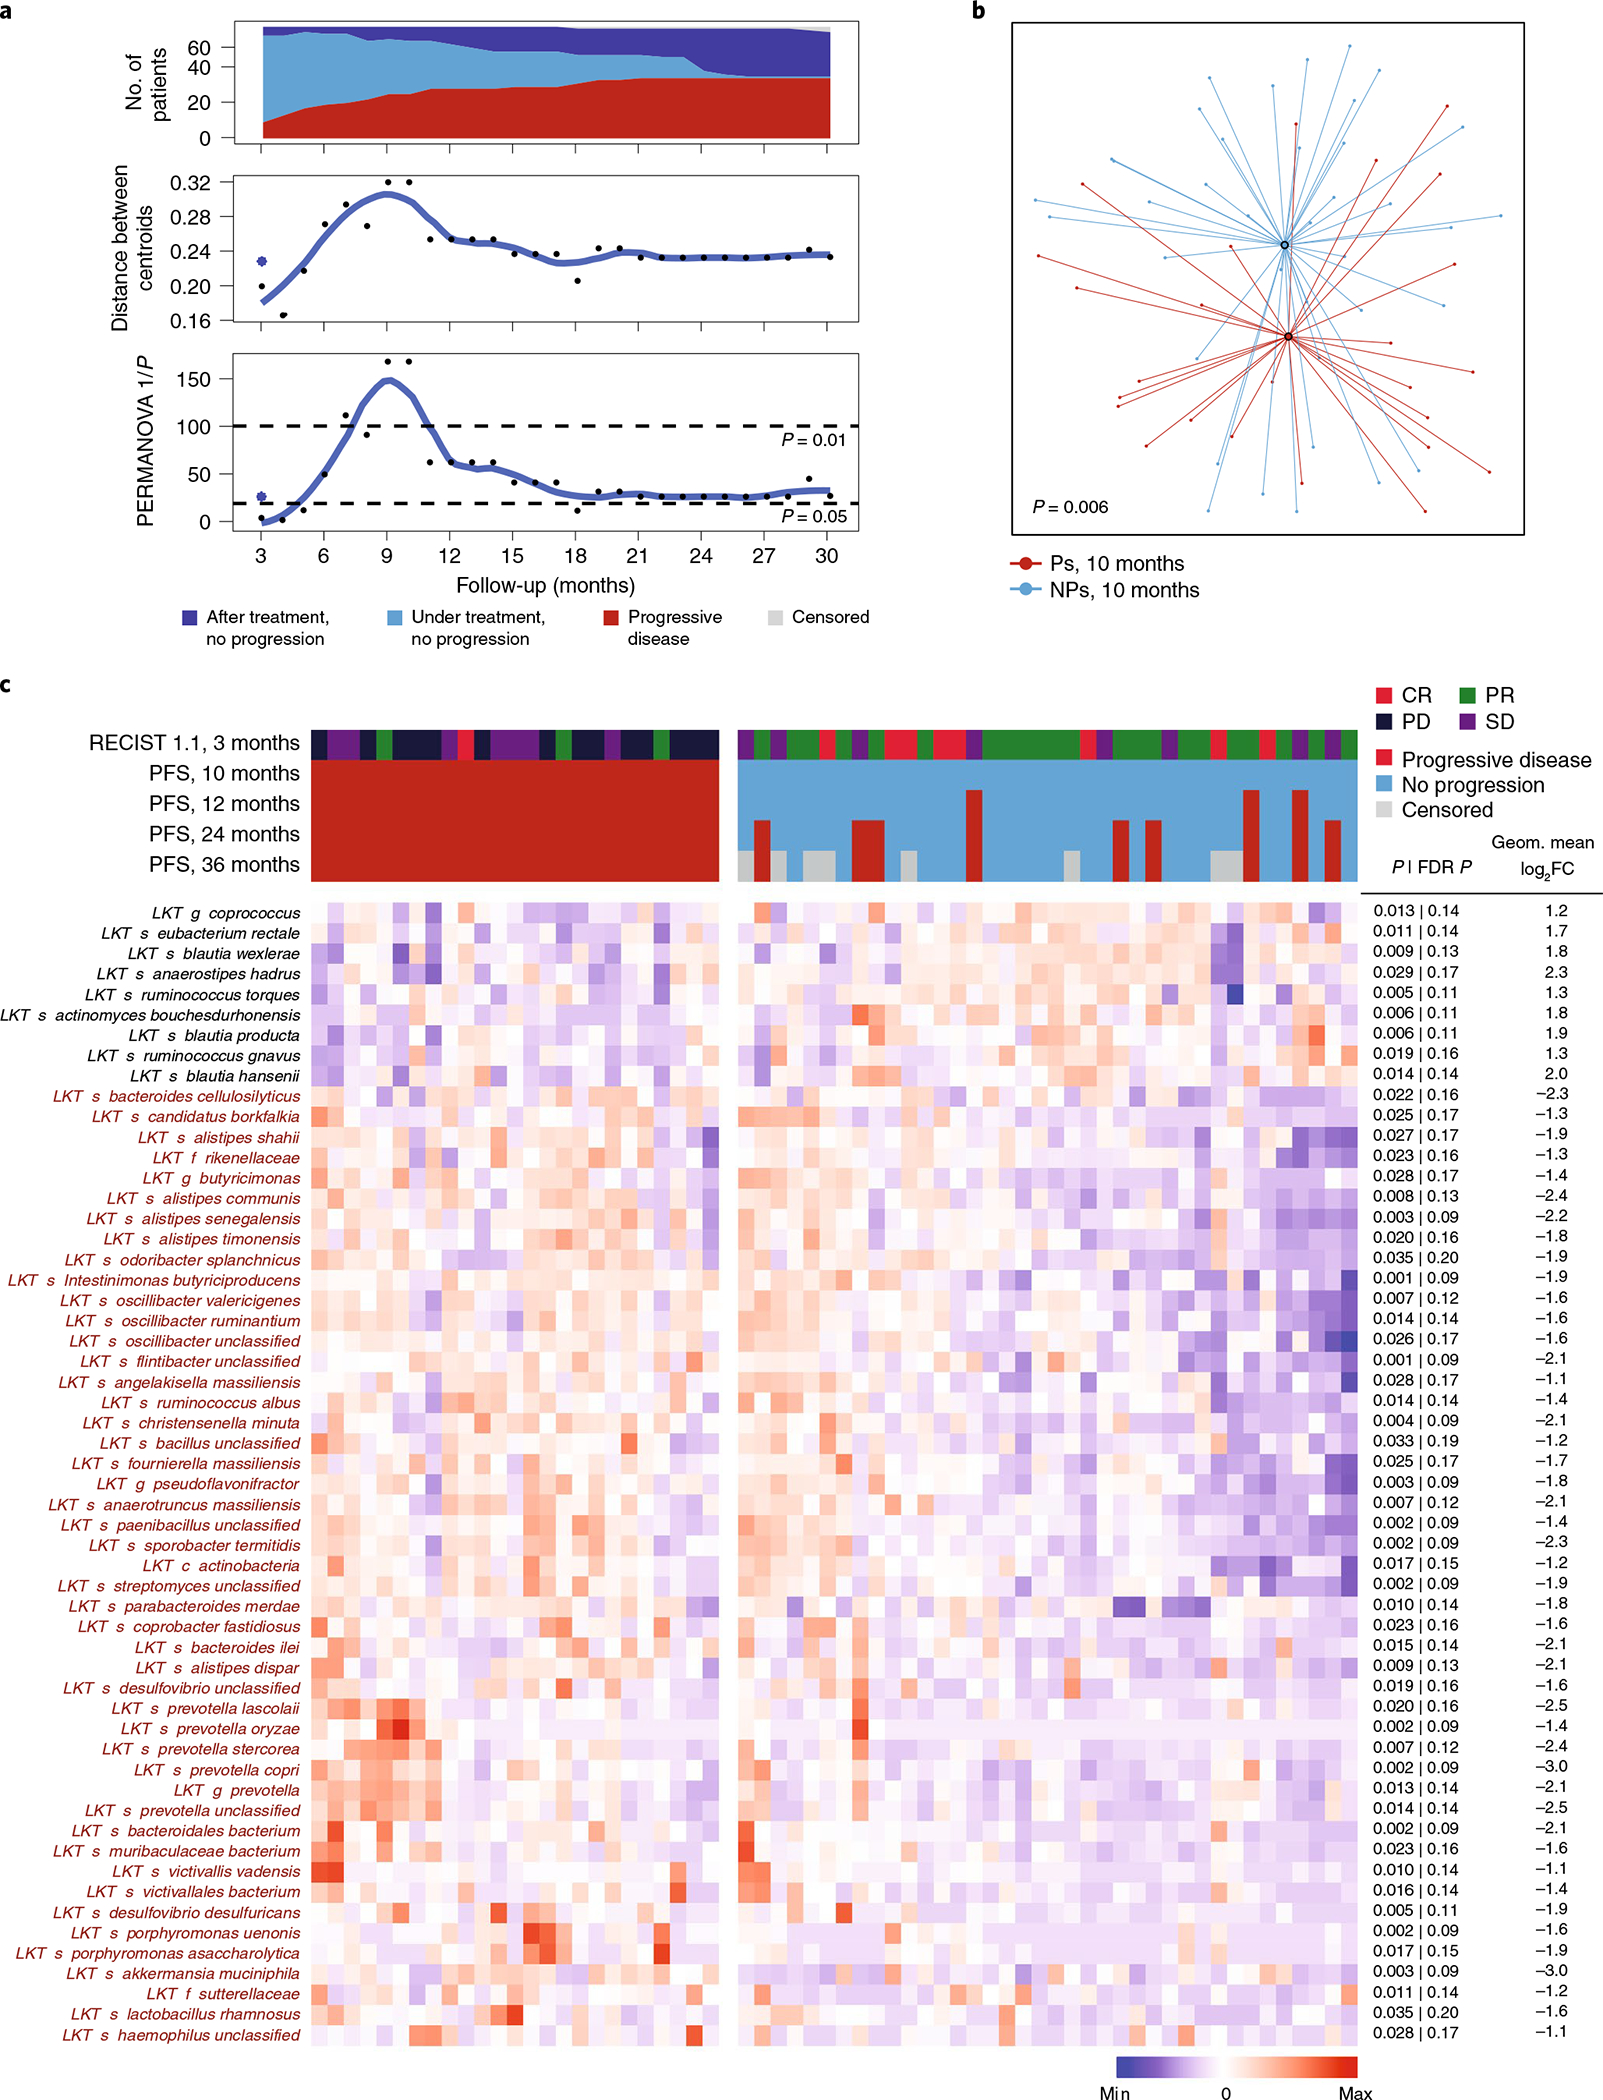
a–c, Valuation of the association of fecal microbiome composition (P-ESC) and response to anti-PD-1 therapy were assessed using shotgun metagenomic sequencing. Objective radiographic response to therapy was evaluated using RECIST v1.1 every 3 months, and progression was defined based on radiographic and/or clinical progression at each treatment visit (every 3–4 weeks). a, Top, number of patients on follow-up at each time point in relation to response status. Middle, distance in composition of the initial microbiome between Ps and NPs identified at each treatment visit. Distances between centroids comparing Ps and NPs were calculated at each time point as the Euclidean distance between the two centroids in all principal-component dimensions of the Bray–Curtis distance in a principal-component analysis; dots indicate PFS at all time points, while the asterisk indicates RECIST v1.1 response (complete response (CR) or partial response (PR)) at 3 months. Bottom, significance of the difference at each time point using PERMANOVA 1/p of Bray–Curtis distance. b, t-distributed uniform manifold approximation and projection (t-UMAP) plot depicting fecal microbiota compositional differences between NPs and Ps at time of maximal difference from start of therapy (10 months). Open circles represent centroids, with connecting lines corresponding to samples from each group. Two-tailed P value was calculated using PERMANOVA. c, Metagenomic shotgun sequencing of fecal microbiota samples identified differentially abundant taxa in Ps versus NPs at 10 months from start of therapy (because no events were observed in this cohort at 9–10 months after treatment, results at these two time points are identical). Statistical significance was calculated by two-tailed Mann–Whitney U test. Heat map shows differentially abundant taxa identified by metagenomic shotgun sequencing (FDR < 0.2 and FC > 2). Columns denote patients grouped by progression status and clustered within P/NP groups; rows denote bacterial taxa enriched (black) or depleted (red) in NPs versus Ps, clustered based on microbiota composition. RECIST v1.1 radiographic response categories: complete response (CR), partial response (PR), stable disease (SD), and progressive disease (PD).
Taxa associated with Ps or NPs in cohorts treated with either anti-PD-1 alone (49 patients) or anti-PD-1 in combination with pegylated interferon (peg-IFN; 14 patients) were largely concordant (Fig. 1c and Supplementary Figs. 1 and 2), suggesting that peg-IFN did not affect the associations and thus analysis of the combined results increased sample size and significance of the observed differences.
The microbiome of P-LSC patients (mostly long-term NPs) did not predict progression subsequent to stool collection (Extended Data Fig. 2a,b). The fecal microbiome of P-LSC patients was significantly distinct from Ps and similar to NPs in the P-ESC cohort (Fig. 1c, Extended Data Fig. 2c,d and Supplementary Fig. 3). These data suggest that beneficial microbiome signatures are preserved in long-term NPs during therapy. Indeed, using the taxa identified by Cox regression as positively or negatively associated with PFS (Supplementary Tables 4 and 5) to manually train a model for prediction of clinical response, a similar area under curve (AUC; ~90%) was observed for both training early and independent late cohorts (Extended Data Fig. 2e).
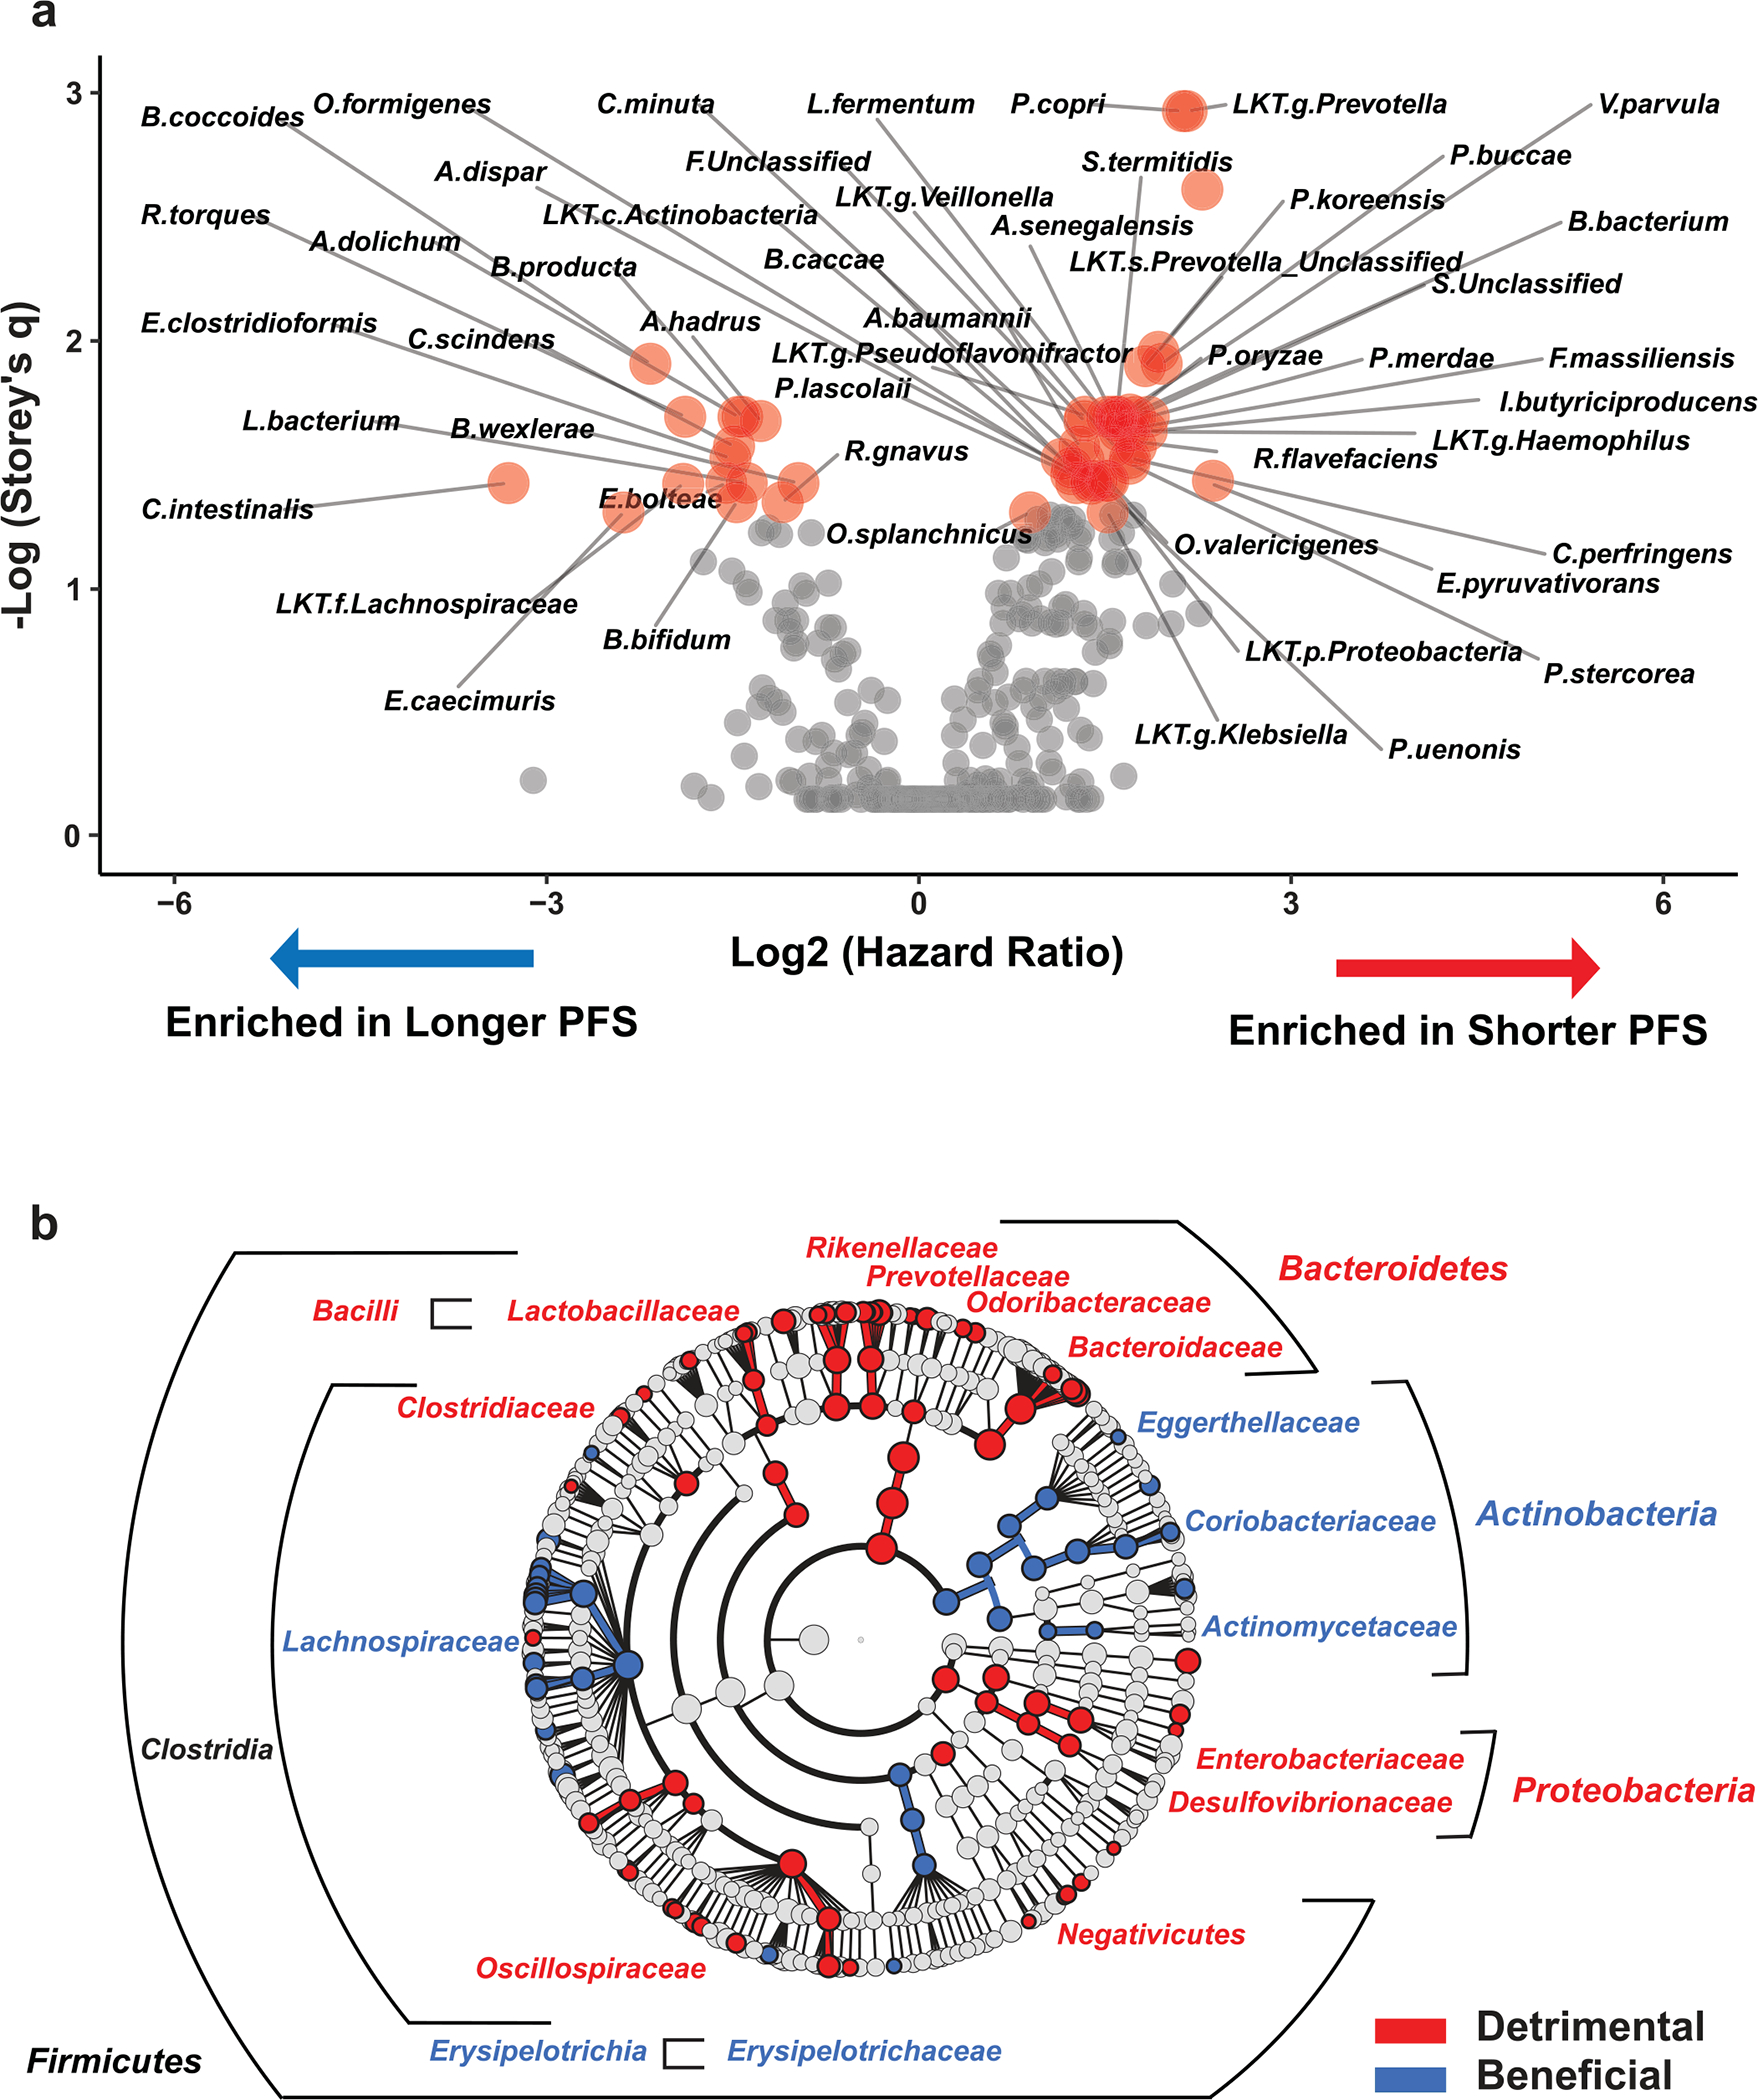
Survival analyses identified taxa associated with response.
Favorable or unfavorable association of bacterial species with PFS was evaluated by determining fecal abundance cutoff points using Evaluate Cutpoints20 for all taxa and calculating Cox regression hazard ratios (HRs). False discovery rate (FDR) was accounted for by calculating Storey’s ‘q value’ twice, correcting for both the number of taxa and the cutoff points analyzed. This approach identified additional taxa (compared to the approach in Fig. 1) associated with either improved or decreased PFS (Extended Data Fig. 3a,b and Supplementary Tables 4 and 5). Members of the of the Bacteroides genus and Proteobacteria phylum appeared to be associated only with Ps, while members of Actinobacteria phylum and Lachnospiraceae family associated only with NPs. Because many of the species seemed to belong to the same genus, family, and so on, we performed statistical analysis of probabilities that a particular taxonomic level will have members behaving similarly (Extended Data Fig. 3b).
Systemic and gut inflammation associates with poor response.
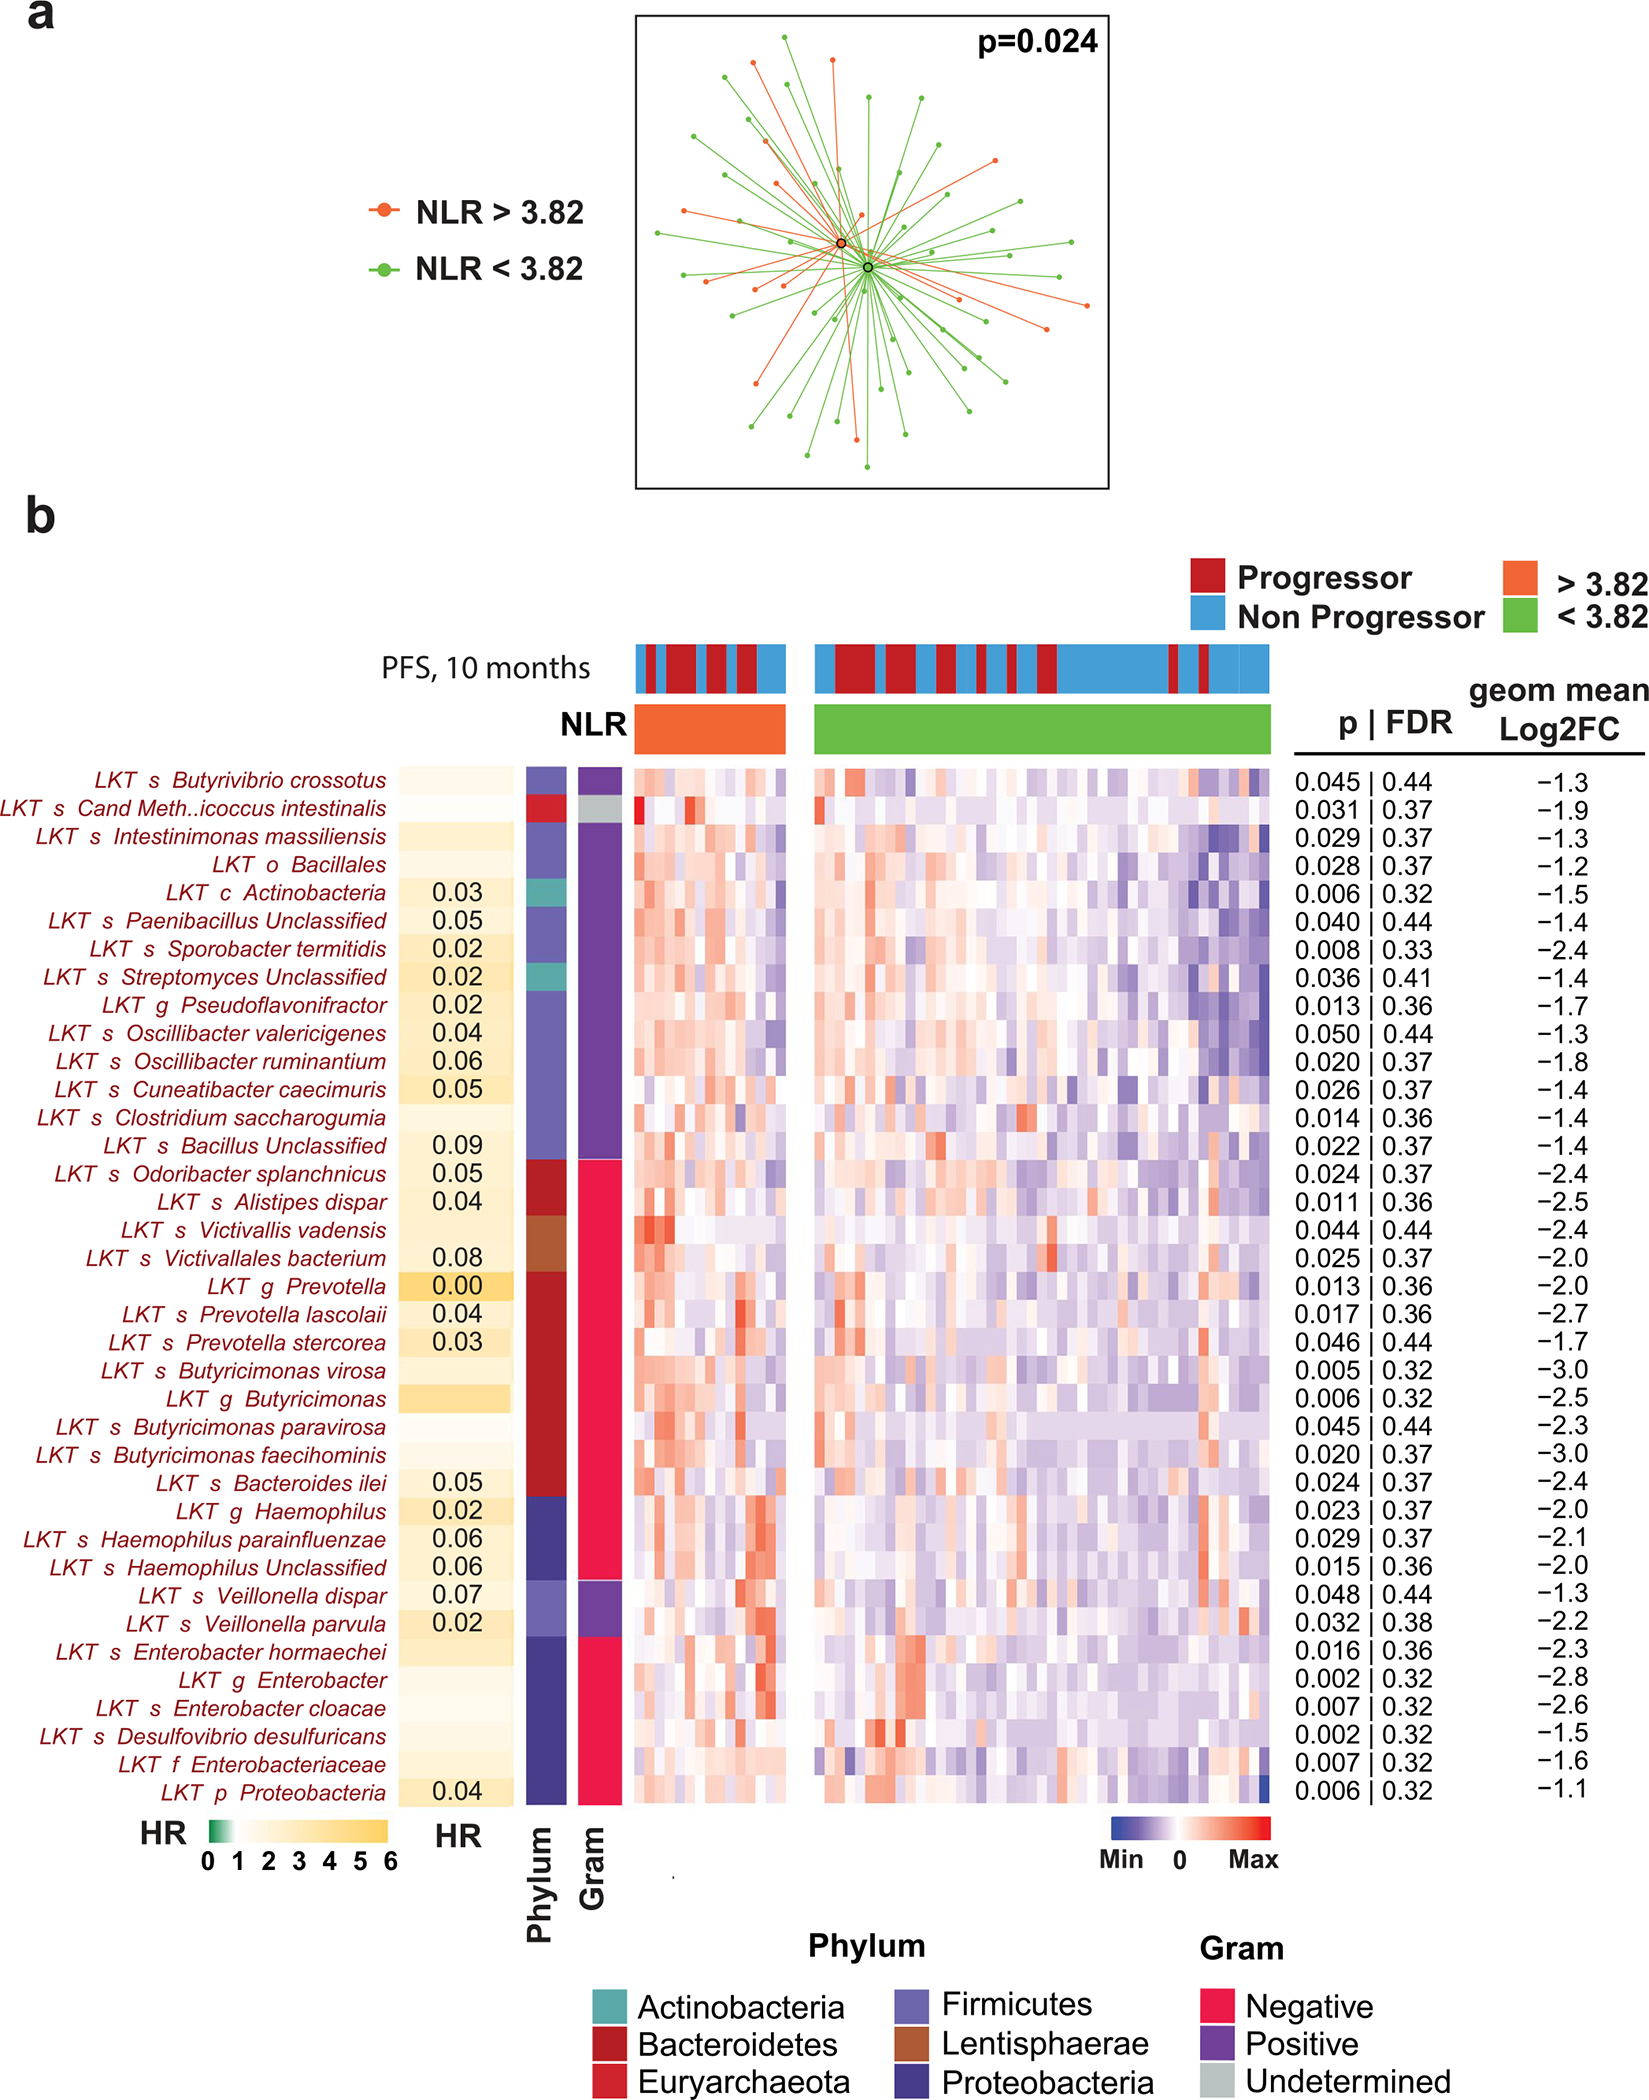
Consistent with published studies in multiple settings21–24, PD-1-treated patients with melanoma with a high NLR had poorer survival (OS/PFS) than those with a low NLR. Further, fecal microbiome composition was different in patients with high NLR compared to low NLR; the species associated with the high NLR phenotype were enriched for Gram-negative bacteria (Extended Data Fig. 4a,b).
To investigate mechanisms by which the microbiota influences clinical outcomes, we analyzed microbial gene signatures. Of approximately 39,000 genes, 1,200 were differentially abundant between Ps and NPs (FDR < 0.2 and fold change (FC) > 1.5; Extended Data Fig. 5a,b). We identified that microbial signatures such as LPS synthesis in Ps and iron bioavailability in NPs may affect host response (Extended Data Fig. 5b–d).
To evaluate the impact of intestinal microbiome upon host tissues, we performed noninvasive transcriptomic analyses of shed intestinal luminal cells (exfoliome) on the fecal samples used for microbiome analysis25,26. We identified ~2,000 host genes expressed at >10 reads per sample in 26 samples that were further compared between Ps and NPs. Genes encoding pro-inflammatory cytokines (IL1B and CXCL8), transcription factors (NFKBIZ, NFKBIA, TNFAIP3 and LITAF) and superoxide dismutase (SOD2) were increased in Ps, while NPs exhibited increased expression of genes encoding mucosal and endotoxin protective membrane mucins (MUC13 and MUC20) and apolipoproteins (APOA1, APOA4 and APOB; Fig. 2a). Ingenuity pathway analysis of upstream regulators of differentially expressed host genes identified LPS as a major contributor of a pro-inflammatory gene signature in Ps (Fig. 2b). Gene-set enrichment analysis (GSEA) predicted that the most abundant exfoliated cell type in stool samples from both Ps and NPs was intestinal epithelial cells (enterocytes and goblet cells). Fecal samples of Ps also had increased inflammatory cells (dendritic cells, monocytes, macrophages and neutrophils; Fig. 2c).
Fig. 2 |. Relationship between microbiota composition and associated host variables in relation to clinical response.
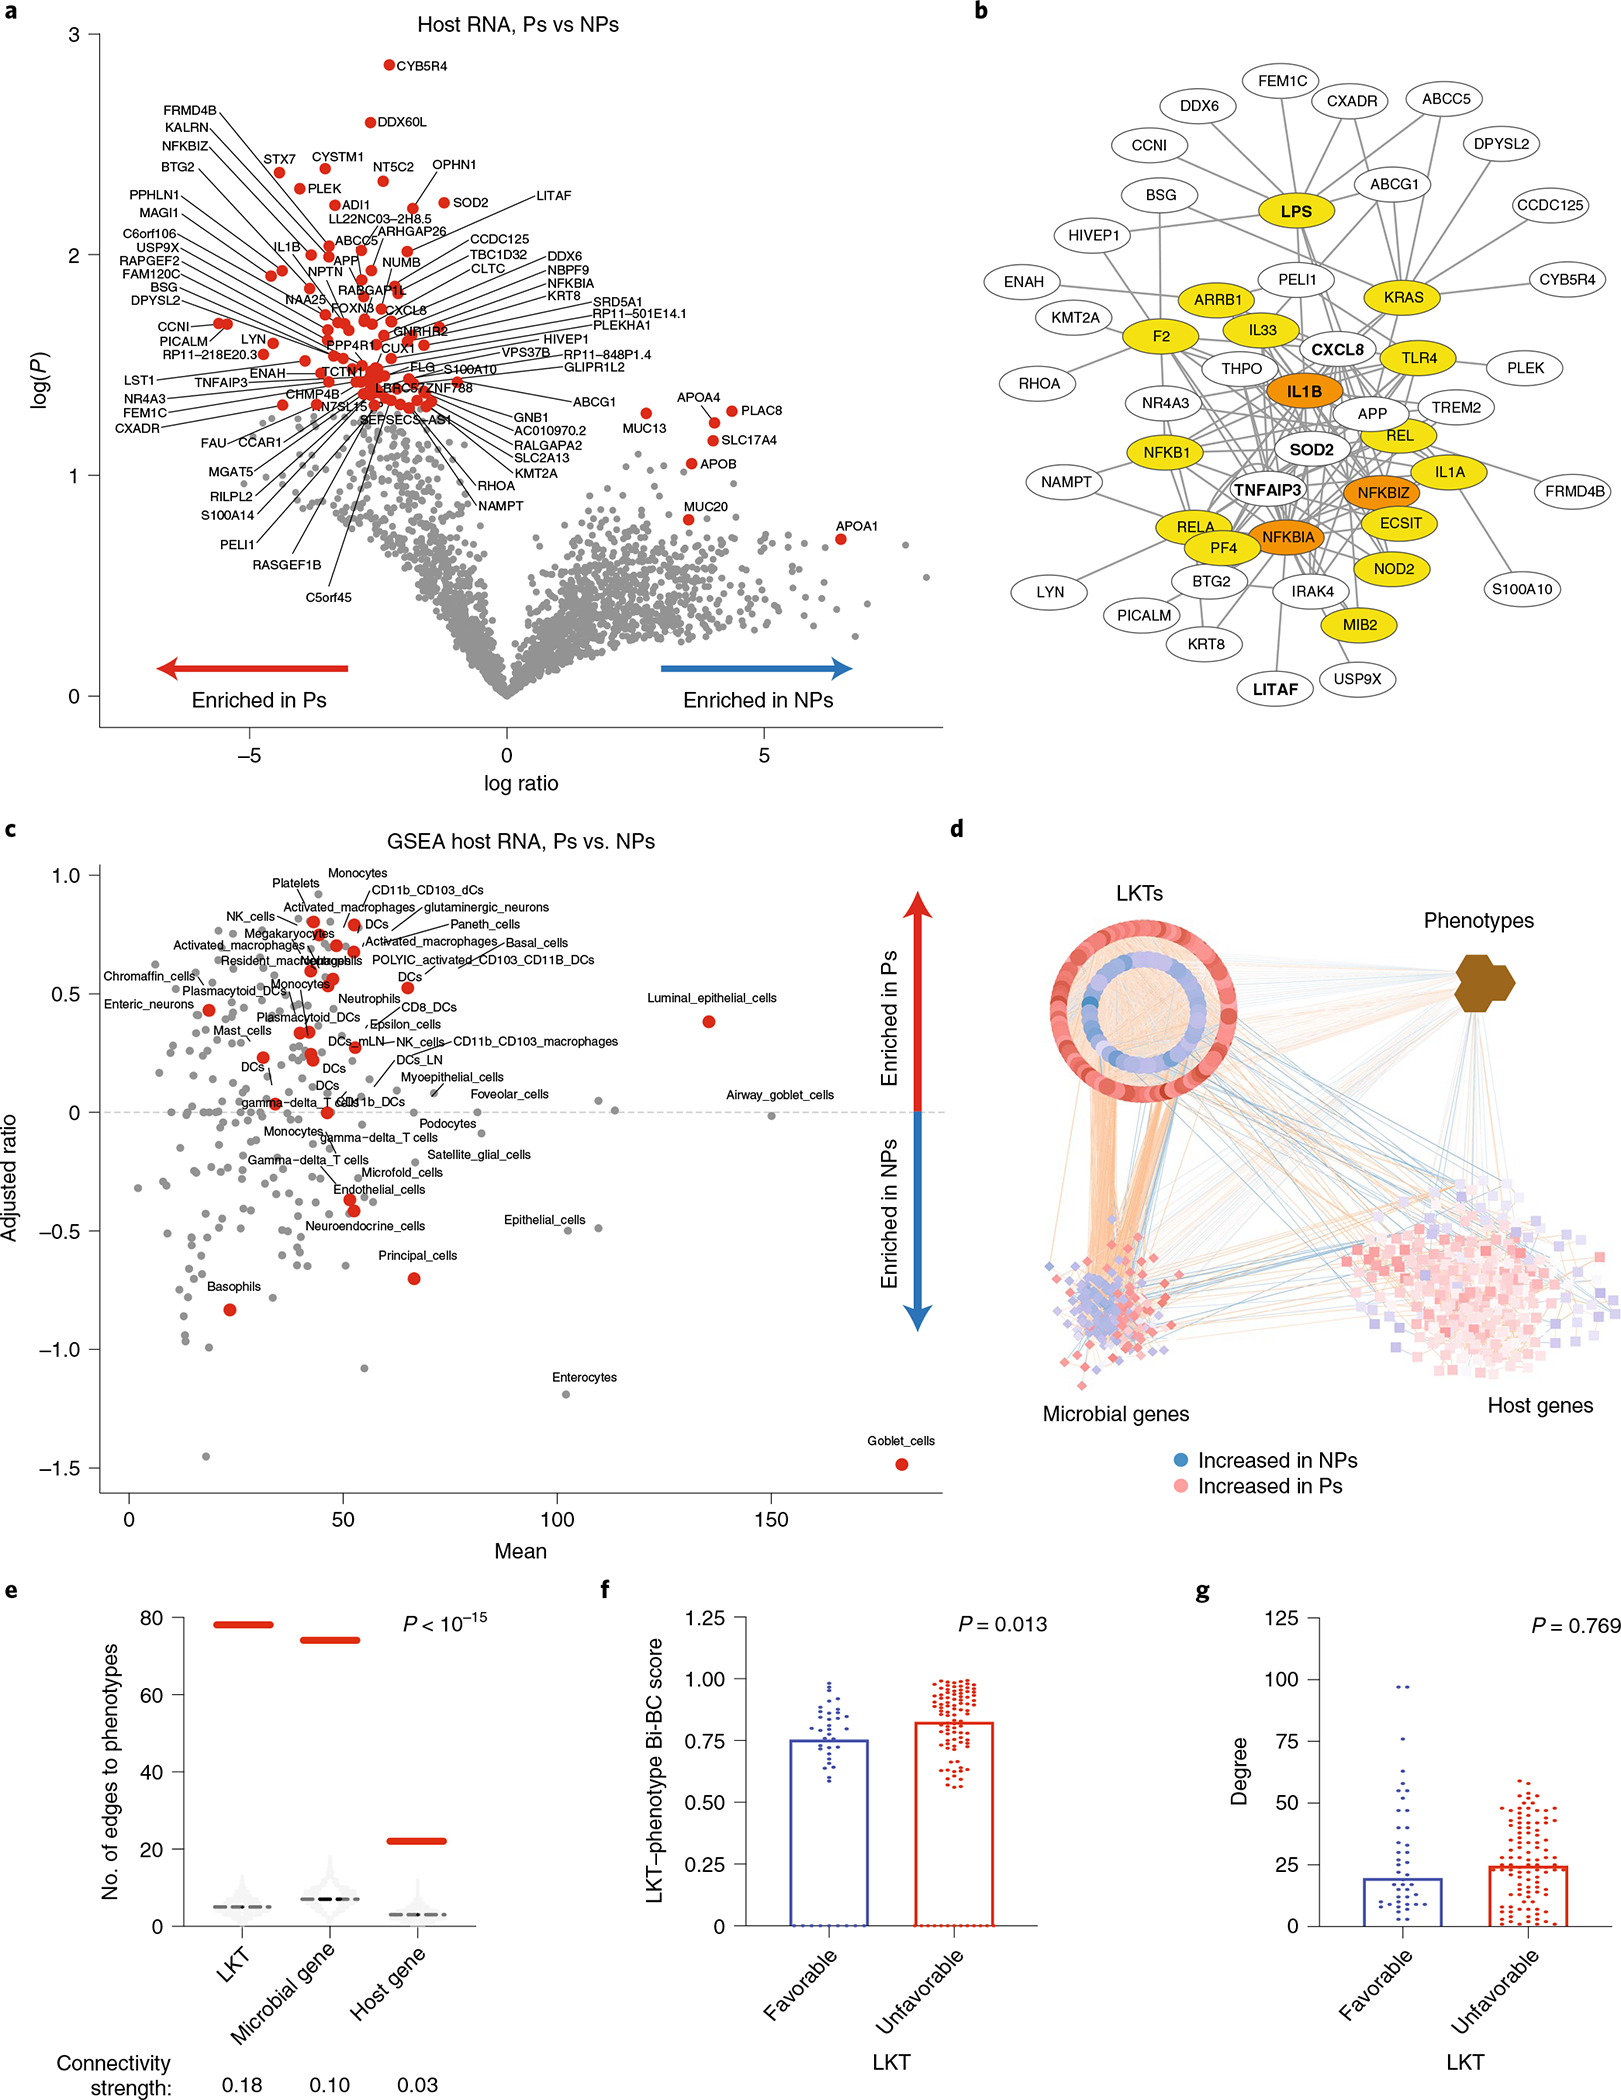
a, Differentially expressed human host genes identified in stool specimens of NPs (n = 18) compared to Ps (n = 8) at 10 months. Significance was calculated using two-tailed Mann–Whitney U test. Genes with P < 0.5 and FC > 2 were considered. b, Ingenuity pathway analysis of upstream regulators of differentially expressed host genes in Ps. Regulators and their targets were plotted using Cytoscape 3.8.0, with edges showing connections between regulators and their targets. Newly predicted upstream regulators are in yellow, while predicted upstream regulators that were included in the identified gene list are in orange. Genes in bold are discussed in the text. c, GSEA of predicted cell types based on host genes identified in a and differentially expressed in NPs compared to Ps. Significantly enriched (P < 0.05) cell types are depicted by red dots. d, Transkingdom network analysis. Data for microbial taxa (circles), microbial genes (diamonds) and human genes (squares) were analyzed to identify highly differentially abundant elements between Ps and NPs and integrated with phenotypes (brown hexagons denote clinical outcome (PFS) and baseline variables (NLR)) to form a transkingdom network. Favorable (blue) and unfavorable (red) nodes (taxa, microbial genes and host genes) were defined as in Fig. 1c and in Methods. Blue and orange edges indicate negative and positive correlations, respectively. e, Number of edges between phenotypes and each type of omics data (taxa, microbial genes and human genes) in the transkingdom (solid red line) and randomized networks (the light gray violin plot shows the distribution in 103 random networks, and the dashed black line indicates the average). Connectivity strength is the number of observed edges between two groups of nodes in the transkingdom network normalized by the number of all possible edges in a bipartite graph of the two groups of nodes. Two-tailed P values were calculated by one-sample Wilcoxon signed-rank test. f,g, LKT–phenotype Bi-BC (global property; f) and degree (local property; g) of nodes in the transkingdom network from d were calculated. Two-tailed P values were calculated by Mann–Whitney U test. DCs, dendritic cells; mLN, mesenteric lymph node; NK, natural killer.
To investigate regulatory relationships between host and microbe, we created a statistical model of robust interactions, called the transkingdom network11,27,28, among NLR, PFS, host gene expression and microbial taxa and genes, consisting of 684 nodes and 10,040 edges (Fig. 2d). First, the transkingdom network had significantly more edges between phenotypes and the other omics types than randomly generated ones (Fig. 2e). Second, microbes had the strongest connectivity to phenotypes compared to host and microbial genes (Fig. 2e). Taken together, network interrogation revealed that microbes (taxa and genes) and host genes were strongly connected with phenotypes, with higher connectivity for microbial components than for human genes. Unfavorable microbes had a greater influence upon PFS and NLR as illustrated by higher bipartite betweenness centrality (Bi-BC) scores (Fig. 2f; Mann–Whitney U, P = 0.013) between all microbes and human phenotypes (that is, PFS and NLR). Average node degree did not differ significantly between favorable and unfavorable microbes (Fig. 2g).
Collectively, our findings hint that an unfavorable gut microbiome enriched in Gram-negative bacteria may promote an LPS-dominated inflammatory signature in the gut, resulting in systemic inflammation manifested by elevated NLR and poor response to anti-PD-1.
Gut microbial signatures are associated with distinct immune-related adverse events.
IrAEs represent toxicities secondary to anti-PD-1 therapy that result from off-tumor immune activation. We analyzed whether occurrence of irAEs linked to anti-PD-1 was associated with microbiome composition in P-ESC patients. As in previous reports29–31, landmark analysis (landmark time point for OS set at 10 months after therapy initiation) identified that any-grade irAEs were associated with improved PFS (Supplementary Table 6 and Supplementary Fig. 4a).
IrAE occurrence at any time was associated with distinct fecal microbiota composition (Fig. 3a). Two taxa groups with opposing effects upon anti-PD-1 response (enriched for either Lachnospiraceae spp. or Streptococcus spp.) were associated with irAEs (Fig. 3b and Extended Data Fig. 6). To exclude immortal time bias (artefactual association of favorable taxa with irAEs due to increased PFS and thus higher probability to develop irAEs in patients with higher abundance of said taxa), we reanalyzed the association of microbial taxa with irAEs using the landmark time point and confirmed the association between irAEs and several Lachnospiraceae spp. (Supplementary Fig. 4b,c).
Fig. 3 |. Fecal microbial signatures are differentially associated with immune-related adverse events and progression-free survival in PD-1-treated patients with melanoma.
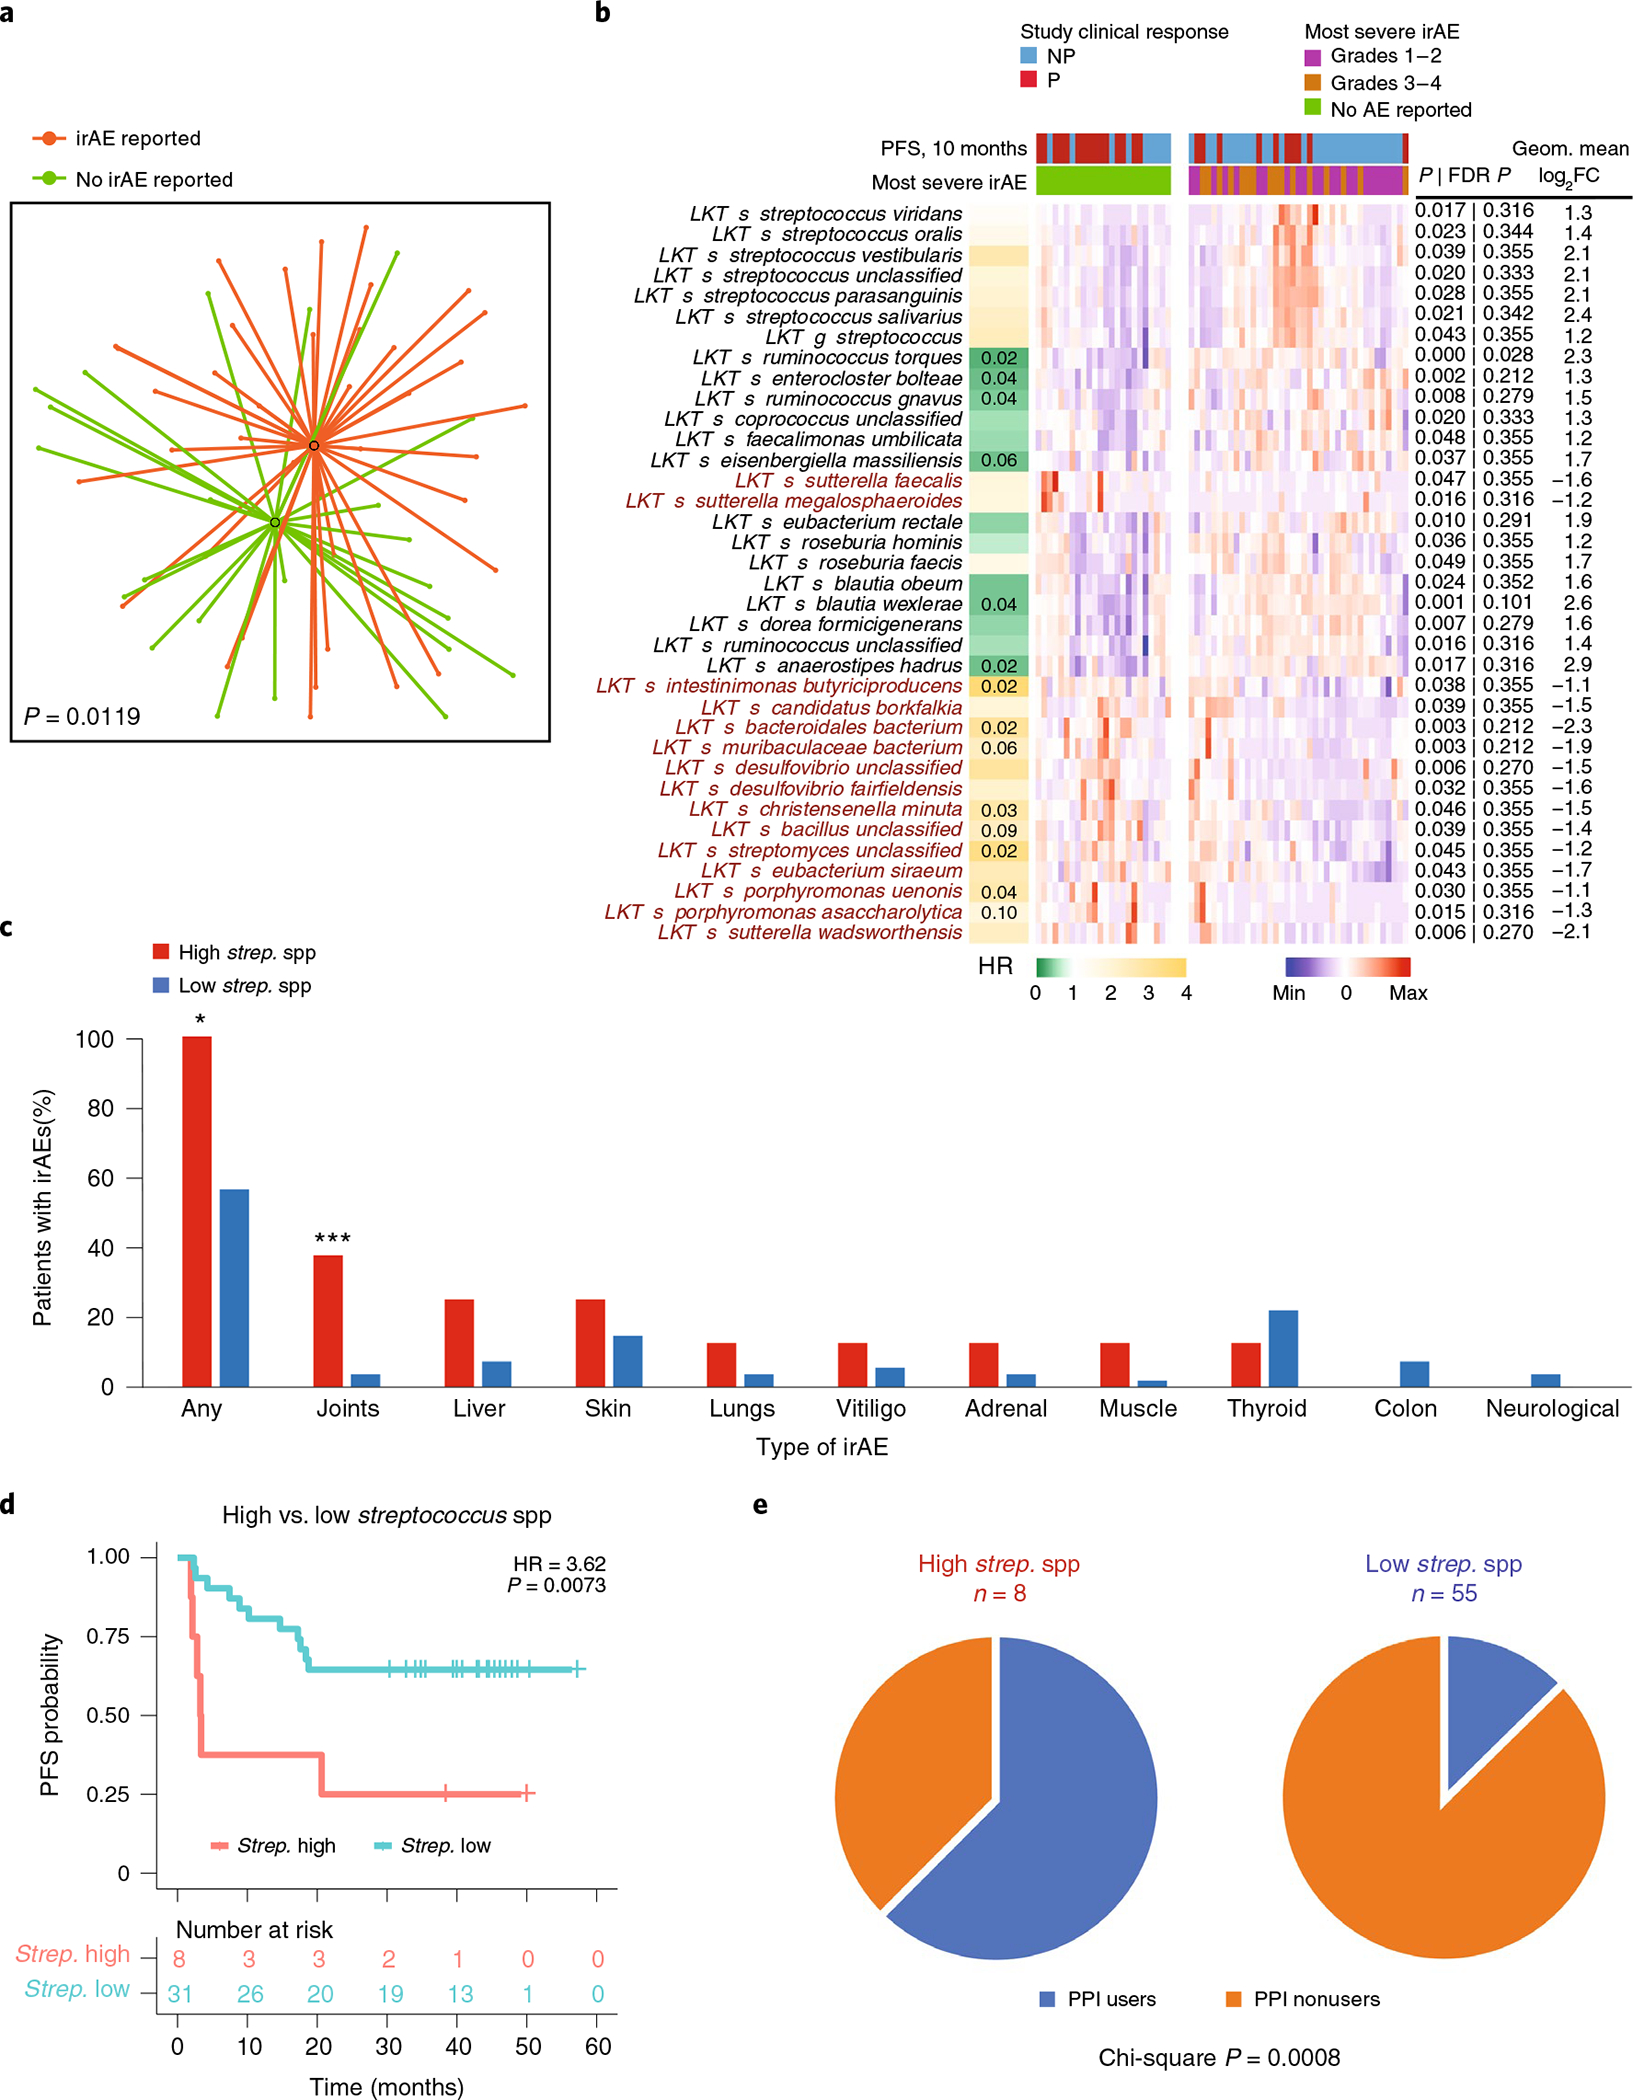
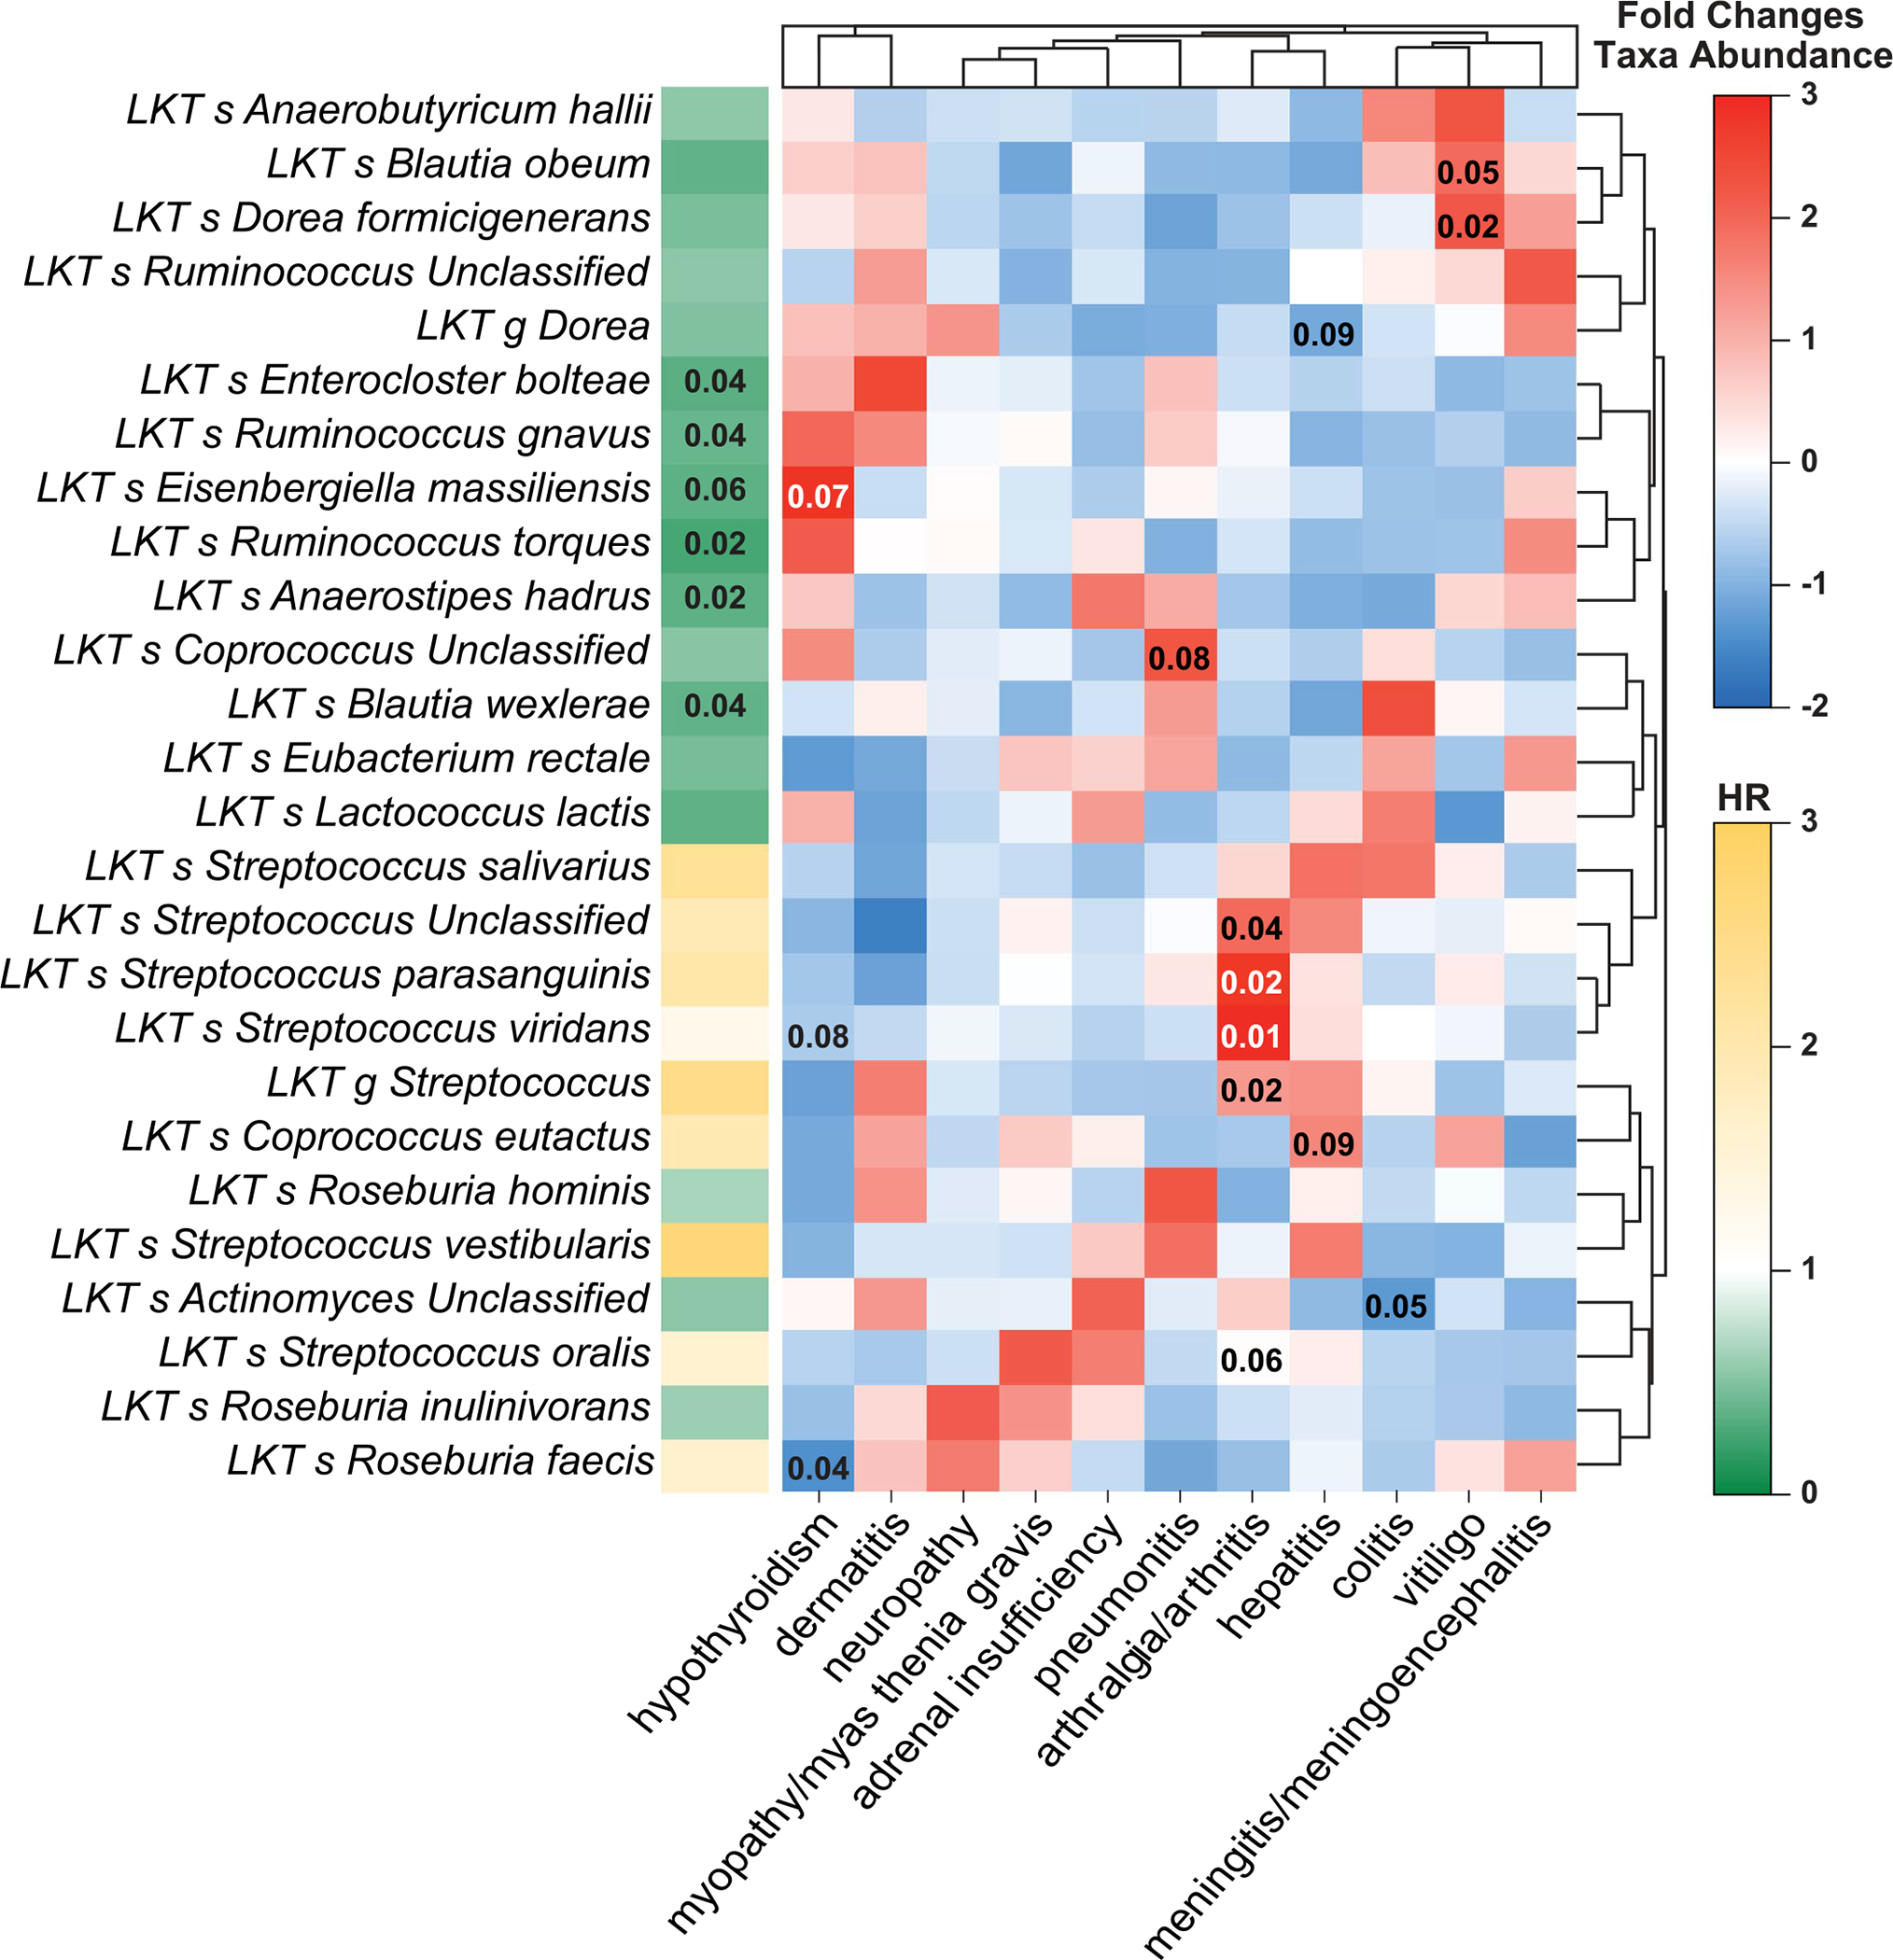
a, t-UMAP plot depicting compositional differences between patients with melanoma who developed any irAEs and those who did not at any time point from the start of anti-PD-1 therapy. Two-tailed P value was calculated using PERMANOVA. b, Heat map of differentially abundant taxa (P < 0.05 and FC > 2) in patients with no irAEs versus grade 1–4 irAEs. irAE severity was graded with CTCAE v5.0. The column on the left shows HRs on a color scale and Storey’s q value numerically when less than 0.1 for each LKT. Columns in the heat map depict patients grouped by reported or non-reported irAEs and clustered within corresponding groups based on gut microbiome composition. Rows depict bacterial taxa enriched (black) or depleted (red) in patients with melanoma with irAEs (grade 1–4) and clustered based on gut microbiota composition. Statistical significance was calculated by two-tailed Mann–Whitney U test. c, Percentages of PD-1-treated early-cohort patients with melanoma exhibiting all or specific types of irAEs segregated by relative abundance of the seven Streptococcus spp. identified in b (eight patients clustered in the high Streptococcus group; χ2, *P = 0.0018; ***P = 0.001) d, Kaplan–Meier plot of PFS probability based on the relative abundance of Streptococcus spp. among patients with irAEs (n = 39). Numbers of patients at risk at each time point are shown. HR and score (log rank) test two-tailed P value from Cox proportional hazards regression analysis. e, Proportion of patients with melanoma treated with PPIs among patients with high versus low relative abundance of Streptococcus spp.
Patients developed distinct irAE profiles depending upon the abundance of Streptococcus spp. in pretreatment microbiome samples (Fig. 3c and Extended Data Fig. 6). All eight patients with the highest cumulative abundance of seven Streptococcus spp. developed irAEs (Fig. 3c). Analysis of the association of different bacteria with individual irAEs linked specific bacteria to the occurrence of different irAEs (Supplementary Fig. 5). Patients with high Streptococcus spp. abundance had significantly shorter PFS compared to those with low Streptococcus spp. abundance (Fig. 3d; HR = 3.62, P = 0.0073). High Streptococcus spp. abundance was correlated with PPI use during therapy (Fig. 3e; χ2 P = 0.0008), which in turn was associated with worse PFS (Supplementary Fig. 6a; P = 0.0483). PPI use also correlated with the presence of intestinal bacteria associated with oralization, such as Streptococcus spp. and Veillonella spp. (Supplementary Fig. 6b).
Collectively, our findings identified two microbial signatures associated with distinct irAE profiles in PD-1-treated melanoma. As previously reported, they also link PPI use with fecal microbiota oralization32 and adverse outcomes in response to anti-PD-1 therapy33.
Meta-analysis of gut microbiome in PD-1-treated patients.
We performed meta-analysis of the microbiome datasets of PD-1-treated patients with melanoma from four published cohorts and the Pittsburgh cohort (Supplementary Table 3)4,5,12,13. The combined dataset comprised 155 shotgun and 150 16S amplicon sequenced samples. The definition of patients who were responders (Rs) and nonresponders (NRs) was maintained as reported in each study. Meta-analysis of α-diversity as measured by inverse Simpson, Shannon and observed taxa methods did not show significant differences between Rs and NRs for both shotgun (five cohorts) and 16S amplicon (four cohorts) sequenced samples (Extended Data Fig. 7a). The high I2 statistic (heterogeneity P value < 0.05) indicated the studies were heterogenous.
Reanalysis of the shotgun datasets using the same bioinformatics pipeline11,34,35 mostly reproduced reported taxonomic differences between Rs and NRs with minimal overlap between datasets (Supplementary Fig. 7a–d). Inter-study heterogeneity was reduced by batch correction using an empirical Bayesian framework implemented in the ComBat R package36,37, and pooled batch-effect-corrected metagenomic data showed a significant difference between microbiota of Rs and NRs (Extended Data Fig. 7b,c; P = 0.002). The top taxa associated with Rs belonged to the Actinobacteria phylum and Lachnospiraceae family (Extended Data Fig. 7d). Conversely, the top taxa associated with NRs belonged to either Bacteroidetes or Proteobacteria (Extended Data Fig. 7d).
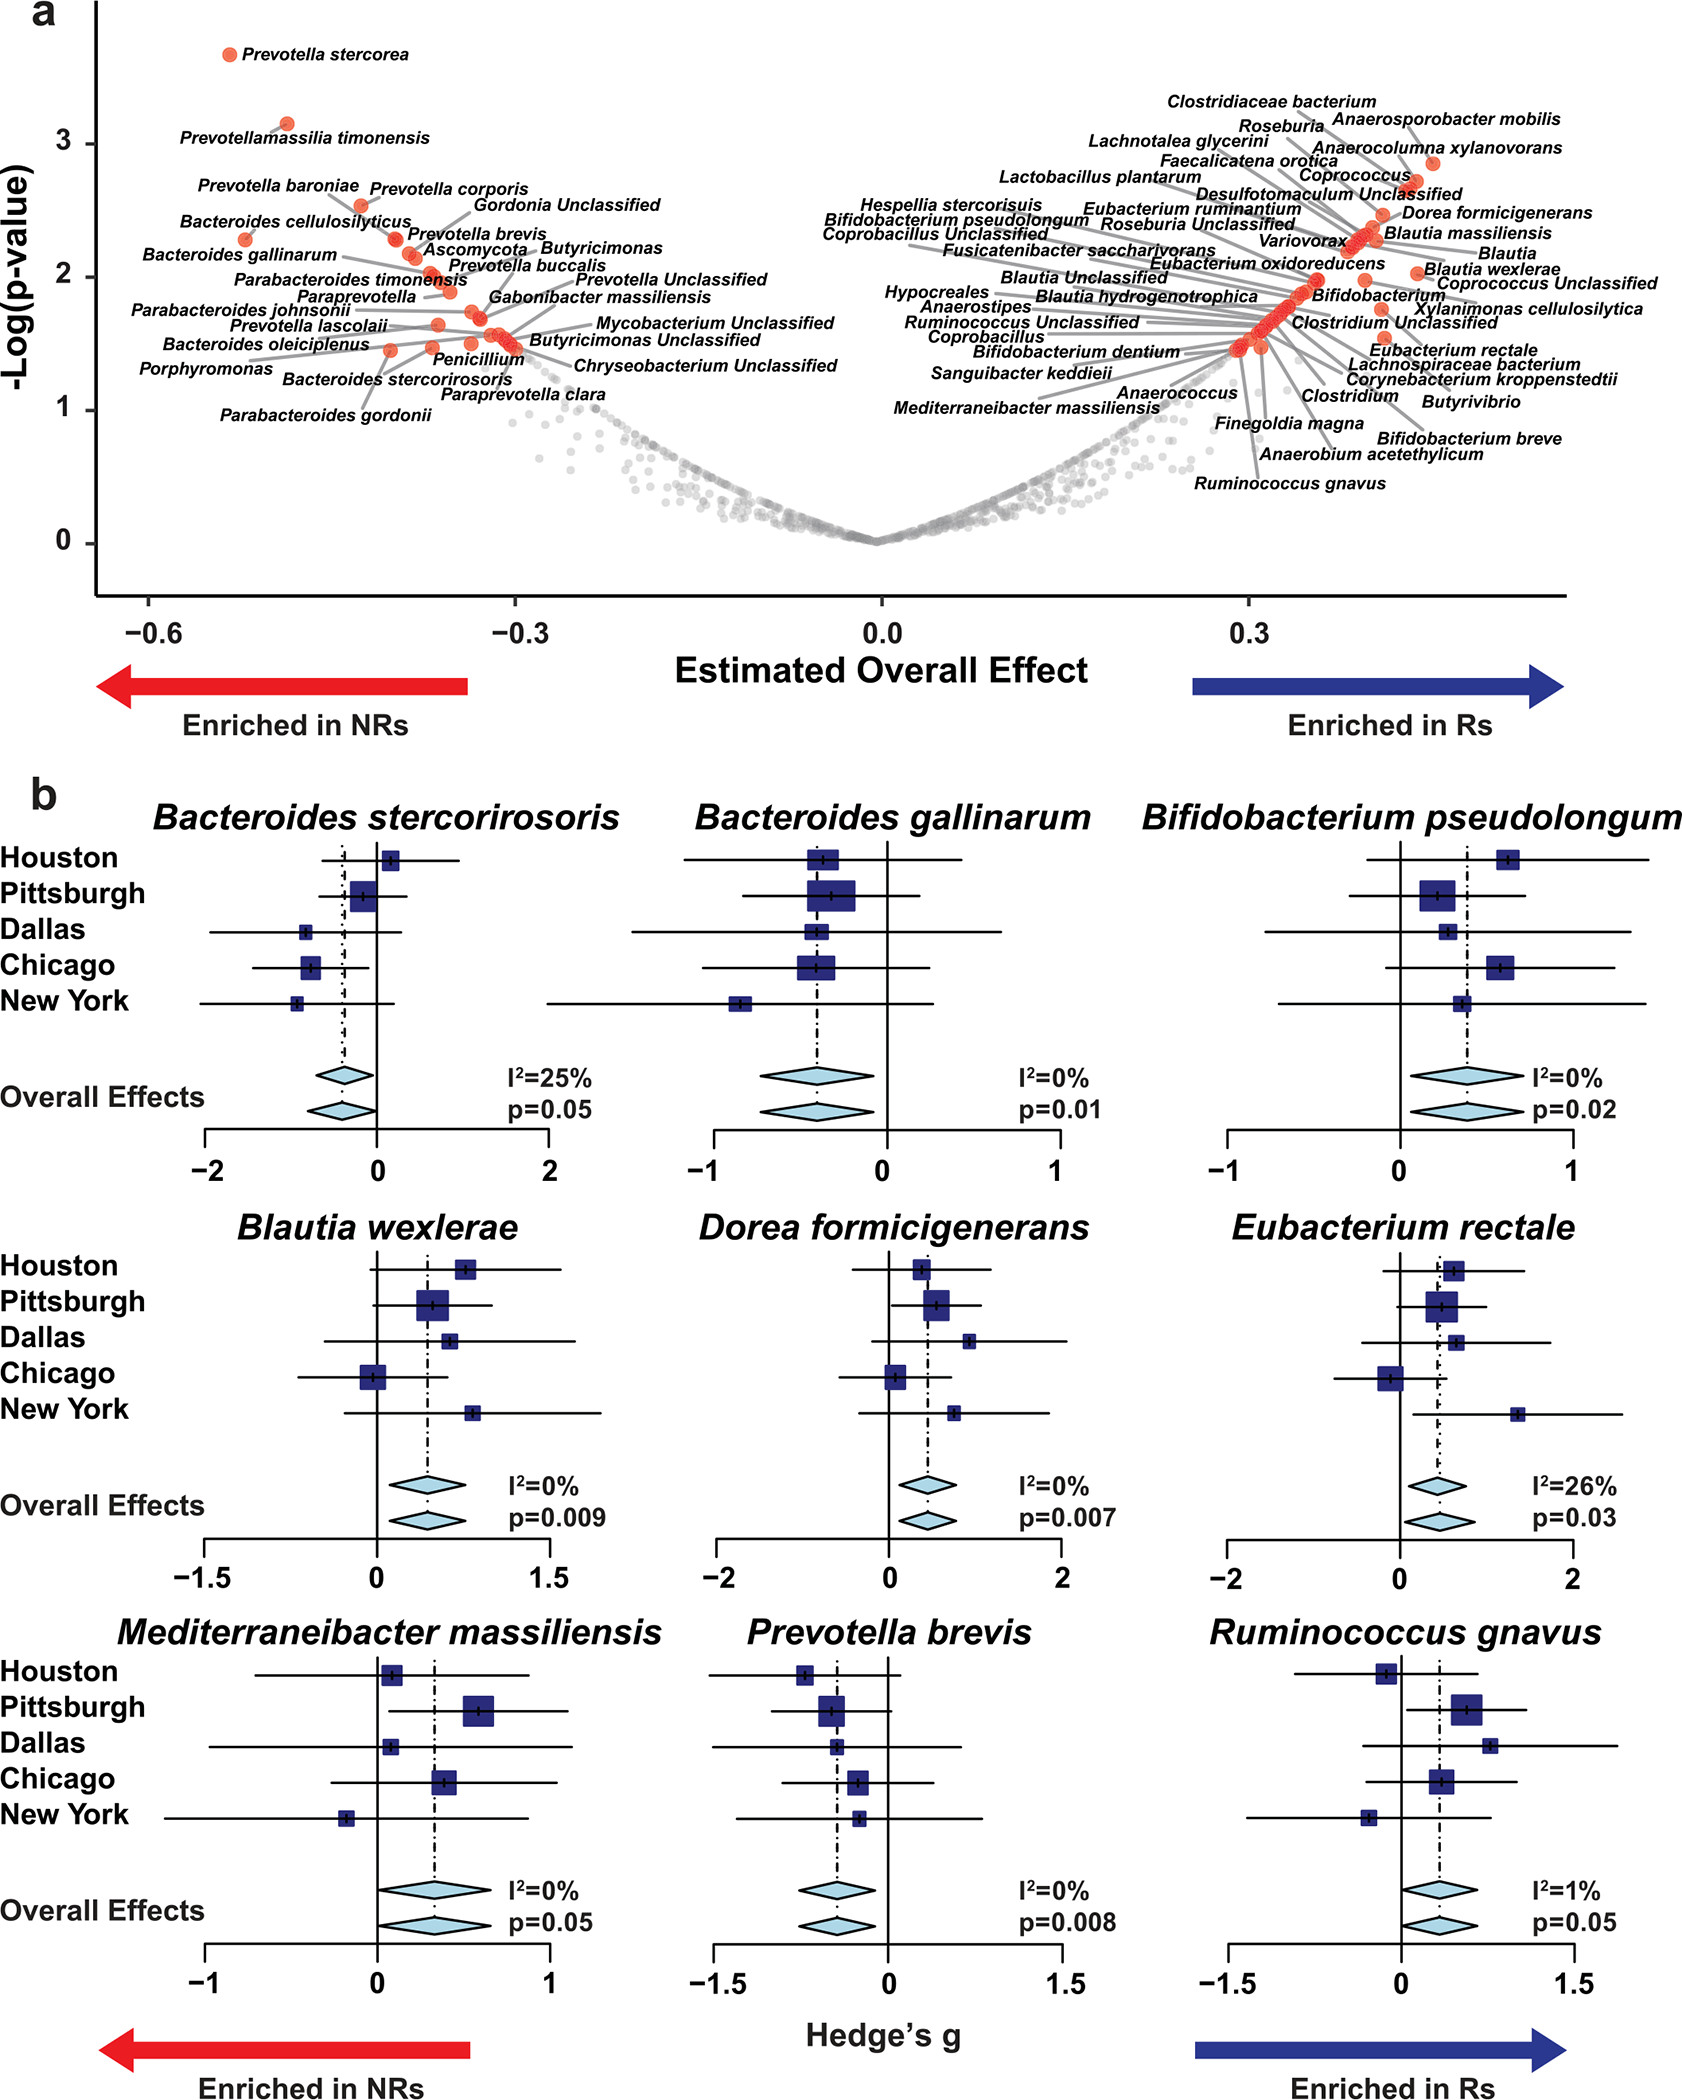
To dissect the contribution of taxonomic levels to PD-1 response, we performed supervised comparisons of batch-corrected pooled microbiota data by linear discriminant effect size (LEfSe) analysis38. Again, organisms within the Firmicutes and Actinobacteria phyla were enriched in Rs. Organisms selectively enriched in NRs primarily belonged to the Prevotellaceae, Rikenellaceae, Porphyromonadaceae and Bacteroidaceae families within the Bacteroidetes phylum (Fig. 4a and Supplementary Table 7). To confirm these associations in non-batch-corrected data, we performed two types of meta-analysis by combining study-level analyses between select bacteria in Rs and NRs from the five cohorts (Fisher’s method, Fig. 4b; random-effects model, Extended Data Fig. 8a,b). These meta-analyses identified many of the previously described taxa as associated with response to PD-1 therapy. Taxa belonging to a few genera of the Lachnospiraceae family and Actinobacteria phylum including the Bifidobacterium genus were predominant in Rs, while multiple Prevotella spp. within Bacteroidetes were enriched in NRs.
Fig. 4 |. Gut microbiome meta-analysis of five independent cohorts of patients with melanoma treated with anti-PD-1 identifies organisms and microbial genes differentially enriched in responders and nonresponders.
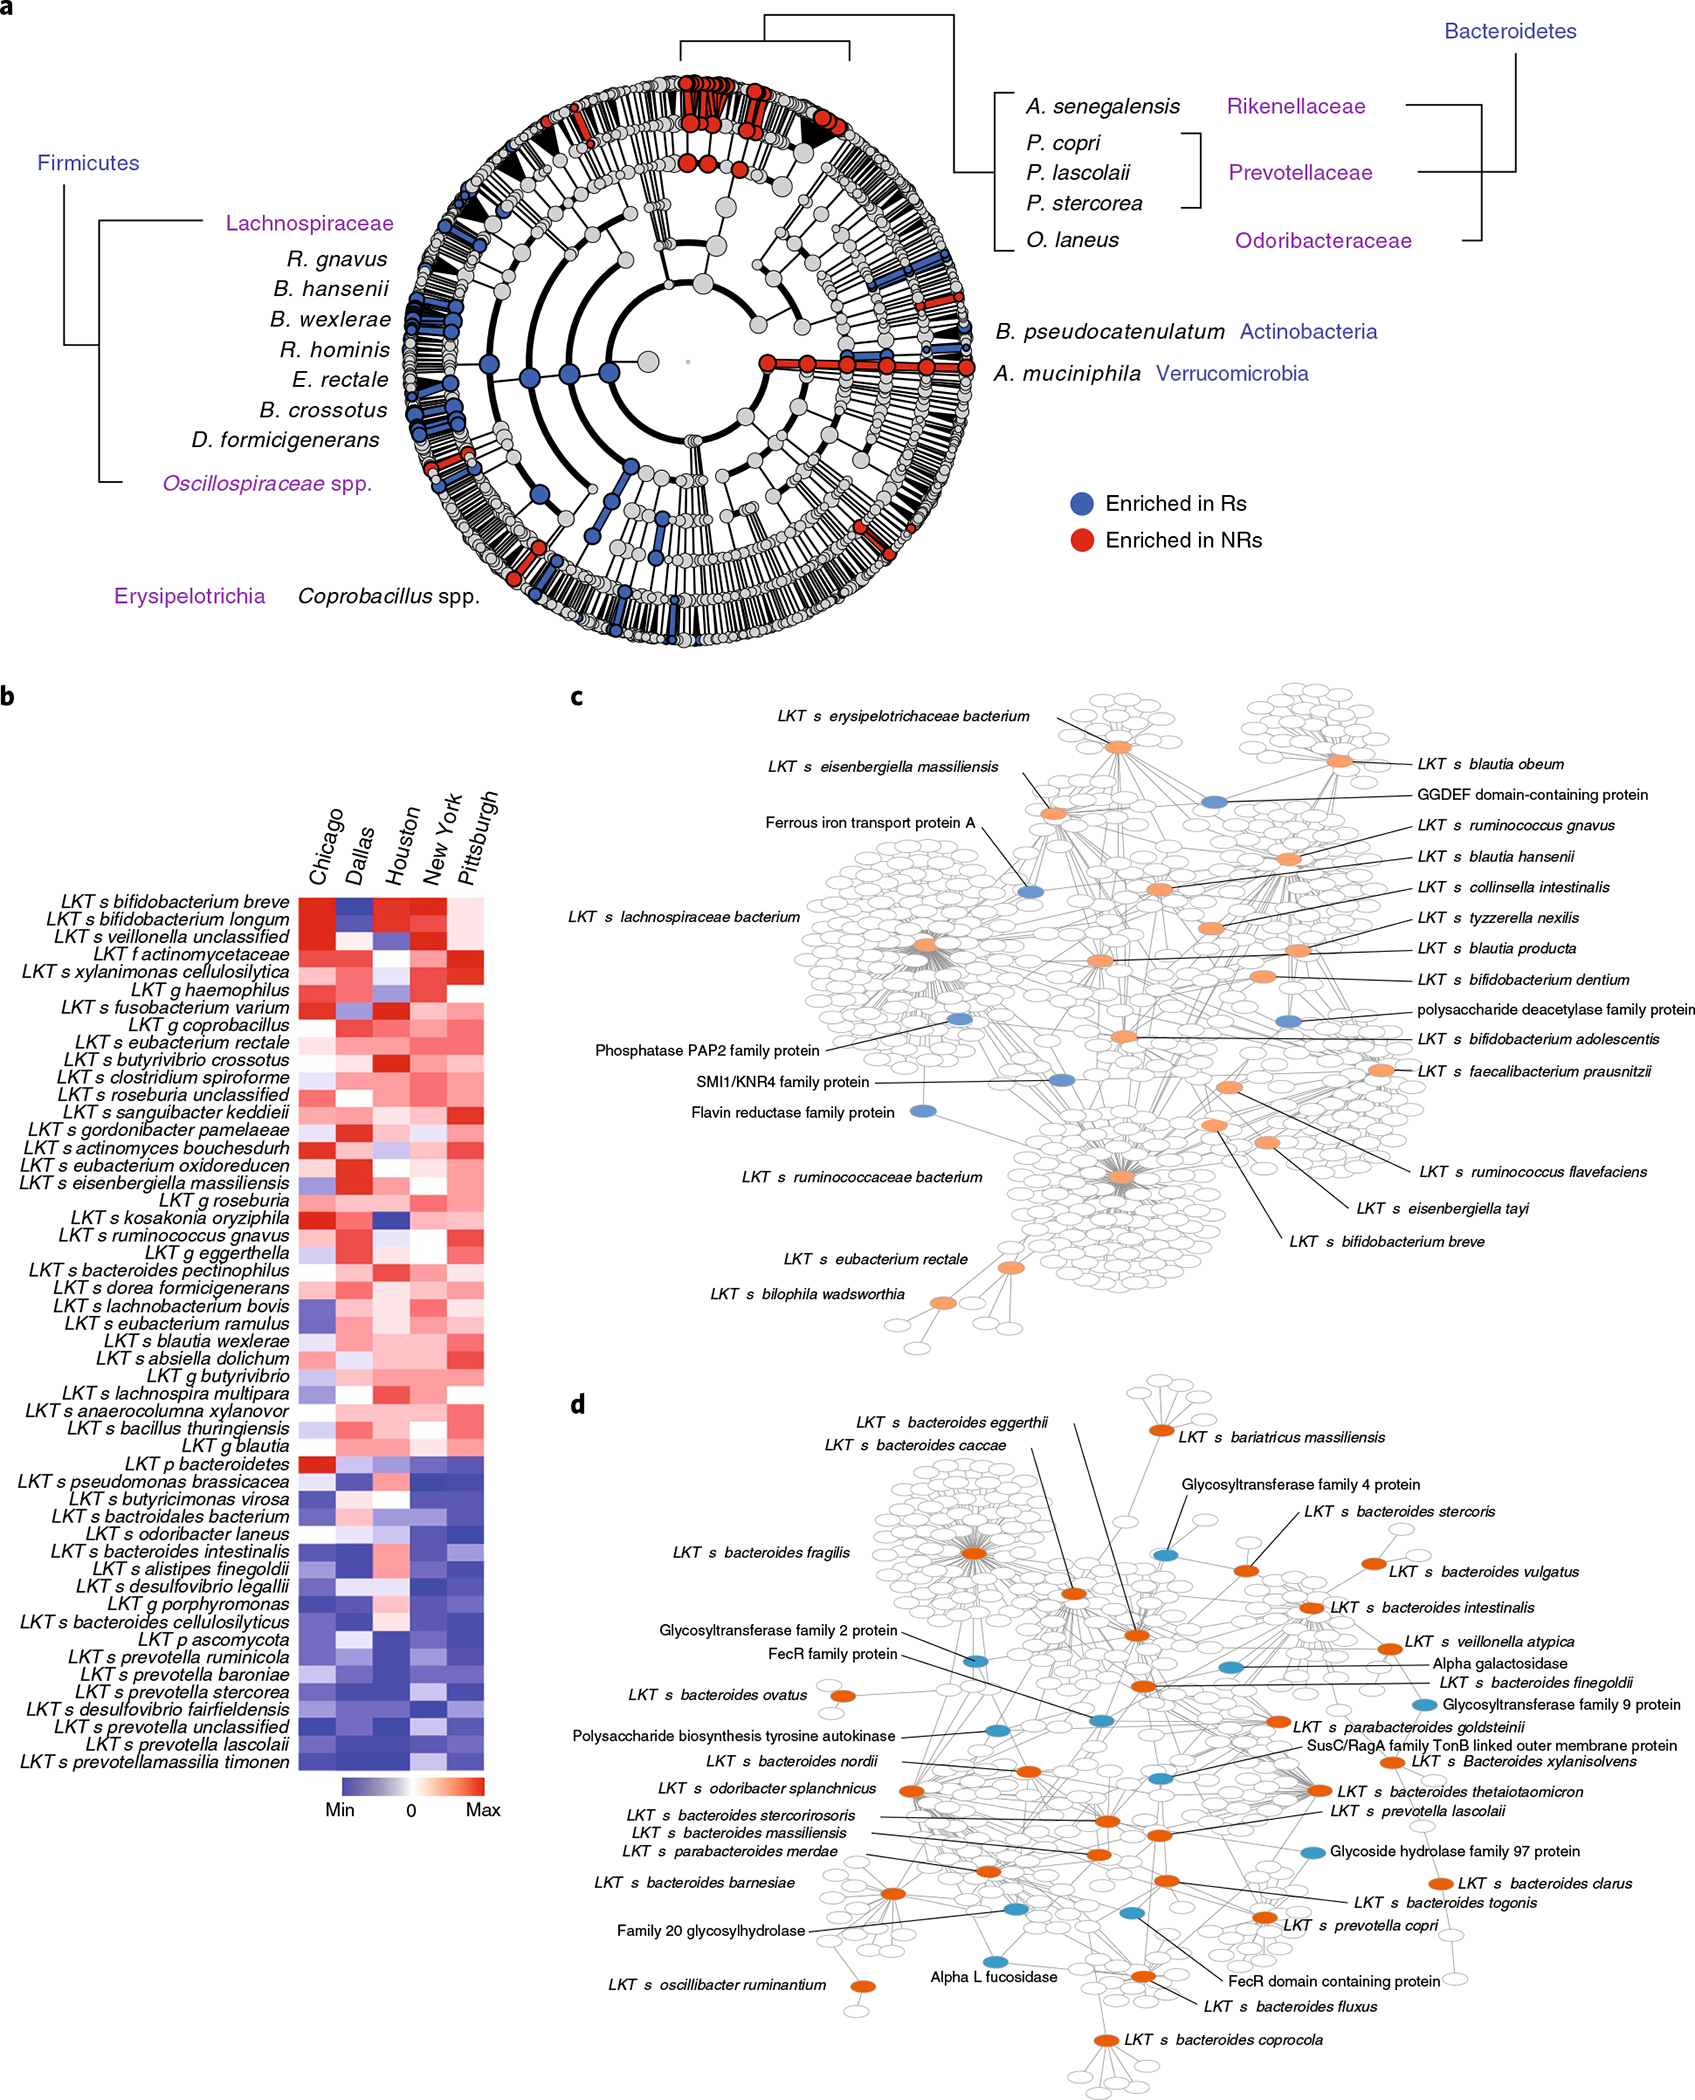
a, After removing study-related batch effects using the ComBat R package, the resultant batch-corrected dataset was further analyzed using LEfSe analysis and depicted in a cladogram. b, Fisher’s method meta-analysis of differentially abundant shotgun-sequenced gut microbiome taxa (P < 0.01) in Rs versus NRs from four publicly available melanoma patient cohorts, along with P-ESC. Response to therapy in each of the published cohorts was determined as described in each study (Supplementary Table 3). c,d, Visualization (Cytoscape 3.8.0) of genes associated with clinical response and shared between favorable (c) or unfavorable (d) species (as identified by LEfSe from all five analyzed cohorts after removing study-related batch effects) but present only in a proportion of subspecies within each species. All species with identified genes are shown in red. Among identified genes, those mentioned in the main text are shown in blue, whereas unlabeled white circles show all other genes. The full list of genes enriched in Rs or NRs is reported in Supplementary Fig. 10.
To validate the predictive power of gut microbiota composition upon PFS, we analyzed an independent PD-1-treated melanoma cohort (Houston) with available time-to-event information4. Similarly to the Pittsburgh cohort, baseline fecal microbiota composition showed maximal separation of Ps from NPs at 13 months (Supplementary Fig. 8a,b). At this time point, we observed microbial signatures that resembled other datasets, including increased abundance of Bacteroides massilliensis in Ps and Faecalibacterium spp. and Eubacterium spp. in NPs (Supplementary Fig. 8c).
We performed continuous variable Cox regression analyses separately for Pittsburgh and Houston cohorts. Significant taxa from the Pittsburgh cohort showing a correlation between last known taxon (LKT) abundance and PFS are listed in Supplementary Table 8, and two representative scattergrams are depicted in Supplementary Fig. 9a. To overcome sample size limitations, we used GSEA39 to check whether significantly enriched organisms at different FDR cutoffs (‘LKT sets’) in one cohort (Pittsburgh) were enriched in an independent cohort (Houston). Only LKTs associated with shorter PFS from one cohort were enriched in the independent cohort, suggesting that unfavorable microbes are more reproducibly identified across cohorts (Supplementary Fig. 9b,c).
Gene signature of favorable and unfavorable intestinal taxa.
Differentially present microbial genes mostly reflect taxonomic differences, resulting in identification of taxa-specific genes (passenger genes) rather than genes that may impact host response (driver genes). Notably, we identified similar gene signatures associated with host response across different taxa, suggesting that unknown variance in complex microbial communities precluded robust signature identification. We observed that subspecies within taxonomically identified species were differentially associated with clinical outcomes. Because functional diversity in taxonomically similar bacteria largely depends on the presence or absence of a discrete number of genes linked to those functions, we sought to eliminate the confounding effect of taxonomically shared genes and to identify genes potentially involved in regulating the phenotype. We performed reference-independent binning analysis of assembled contigs from the five melanoma patient cohorts similar to the MetaBAT approach40,41. We found 13,237 clusters that belonged to 730 taxonomic known units and identified 39,480 genes. This approach permitted subspecies-level gene comparison. Nonparametric statistical comparisons are presented as species–gene networks of favorable and unfavorable taxa (Fig. 4c,d), along with ‘degree’ statistics (number of species shared by a gene; Supplementary Fig. 10). Within favorable taxa, we identified increased abundance of genes related to polysaccharide deacetylation known to play a role in immune evasion42, as well as iron transport and iron-induced production of reactive oxygen species ROS, which affect mucosal healing43. We also observed increased abundance of genes encoding flavin and riboflavin metabolism, byproducts of which can be presented by MR1 and recognized by mucosal-associated invariant T cells11,44, which we showed are activated in PD-1-responsive patients after FMT11. Conversely, within unfavorable taxa, genes encoding enzymes related to LPS synthesis and mucus degradation such as alpha-l-fucosidase45 and alpha-galactosidase46 were increased.
Gut microbiome composition predicts clinical response.
To evaluate whether a machine learning model trained on metagenomic datasets could predict PD-1 response, we used three machine learning models: random forest (RF), generalized linear model (GLM) and polynomial support-vector machine (poly-SVM). Analysis of single datasets using 70:30 train–test splitting showed variable results with no cohort giving AUC > 0.79, and cross-training–testing with the different cohorts also gave variable results with AUC values ranging from 0.21 to 0.79 (Supplementary Fig. 11a). Meta-analysis of all results confirmed that prediction of the combination was not significant and that models failed to predict clinical response, most likely because of the small size of most cohorts (Supplementary Fig. 11b).
Using leave-one-out cross-validation of batch-corrected pooled data with an extra training step (Methods), we found AUC values between 0.54 and 1.00 with significant (P < 0.05) accuracy of prediction of clinical responses in 12 of 15 combinations; meta-analysis confirmed that each learning method significantly (P < 0.01) predicted clinical response when trained with microbiota data of unrelated cohorts (Fig. 5a,b).
Fig. 5 |. Machine learning shows significant prediction of cohort response using models trained on other cohorts combined.
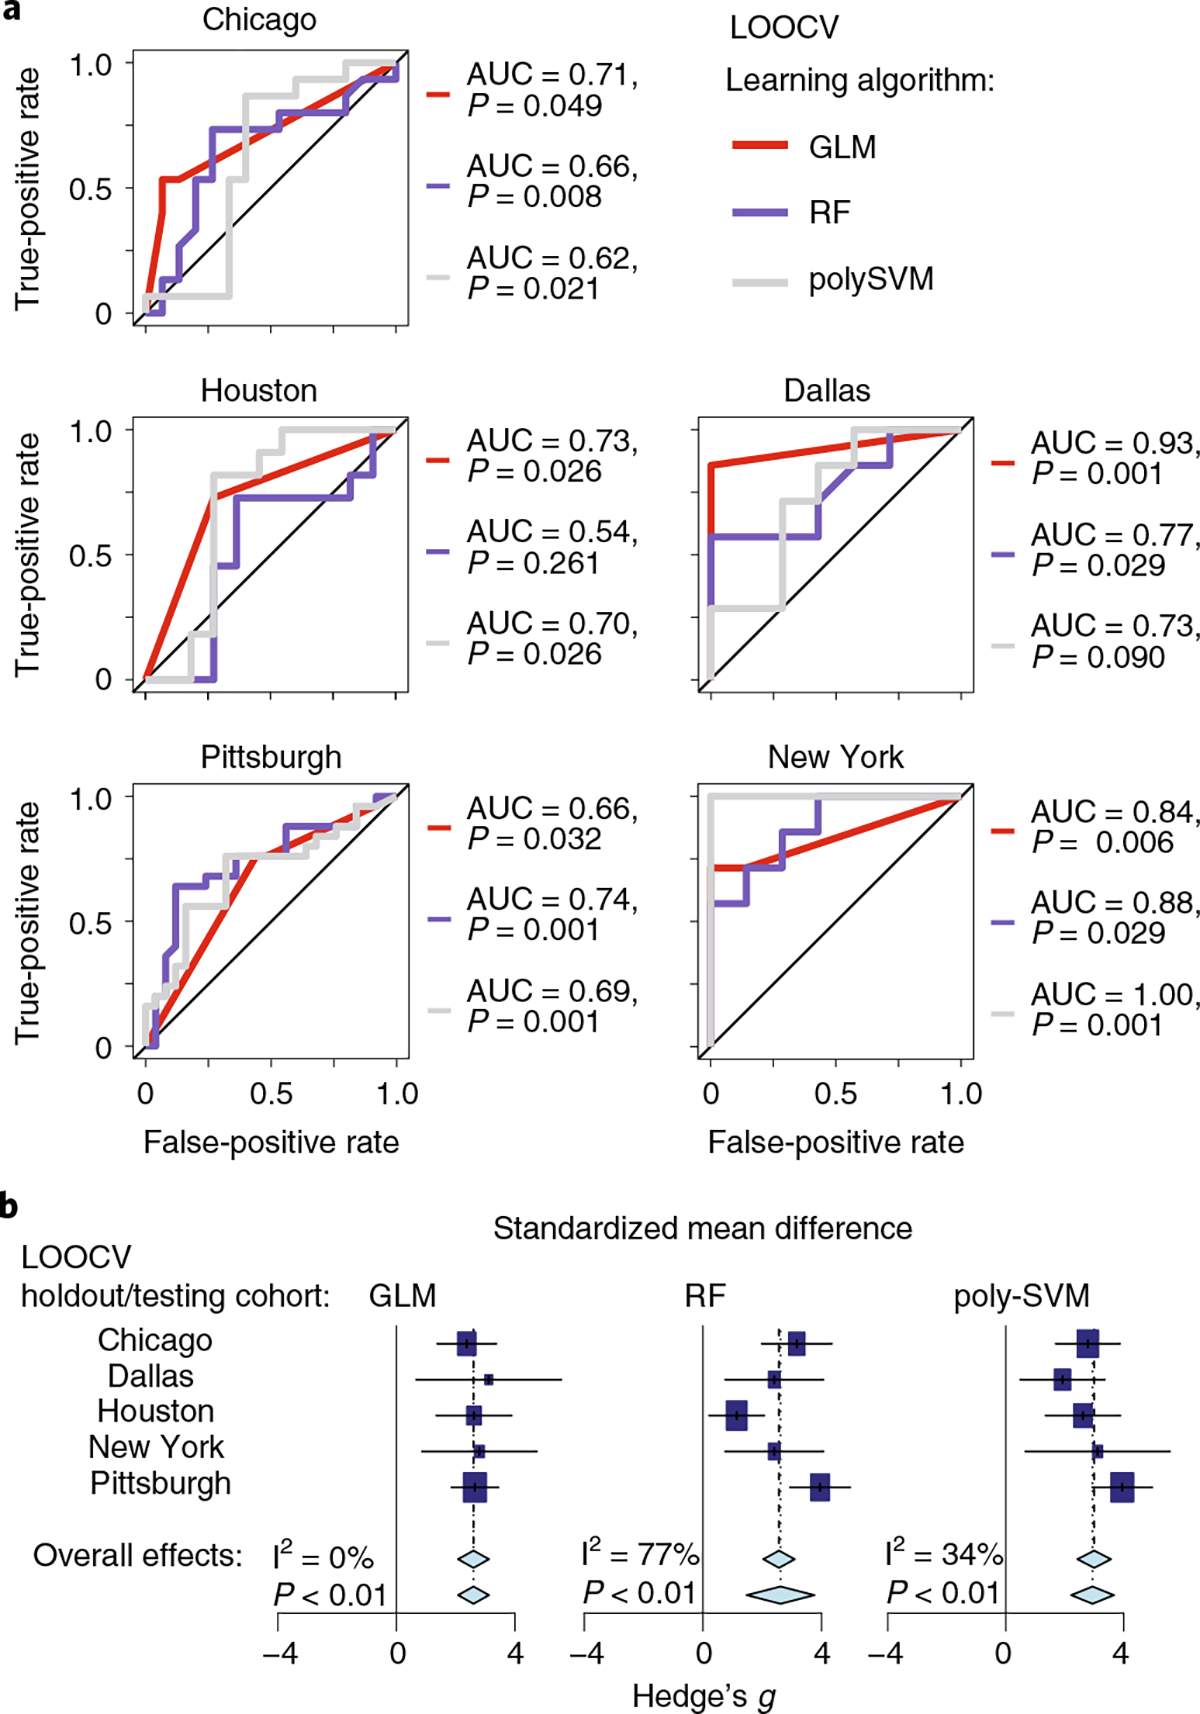
a, Receiver operating characteristic curves for models trained on the four cohorts and tested on the remaining cohort. Three machine learning (modified leave-one-out cross-validation (LOOCV)) methods were used: GLM, RF and poly-SVM. AUC and P values (P(accuracy) > no information rate) via the one-tailed binomial test) of the accuracy of models are given. b, Forest plots based on the results from a. Each machine learning method is represented by a separate forest plot, with cohorts shown on different lines. Hedge’s g (squares, standardized mean differences, size proportional to sample size) and associated 95% confidence intervals (bars) are shown along with the dashed vertical line of no effect. To control for unobserved heterogeneity, we separately evaluated Hedge’s g and P values using a random-effects model on metagenomic data and performed an I2 test for heterogeneity as shown.
To explore the commonality of important taxa across cohorts, we created a network of taxa from the top 20 most important (for distinguishing R from NR samples) clusters from the best RF models of the five cohorts (Supplementary Fig. 12). A few taxa previously identified as favorably or unfavorably associated with PD-1 response contributed to the machine learning model across more than one cohort. Interestingly, the most involved taxa were Bacteroides, Prevotella and Alistipes genera. These findings suggest that associations between outcomes and microbial signatures are more robust and universal for unfavorable taxa than favorable taxa, which tend to be more cohort specific.
Identification of favorable and unfavorable microbiotypes.
The human gut microbiome includes multiple discrete ecologically balanced communities—hereafter referred to as ‘enteric microbiotypes’—that are resilient although still modifiable by diet, drugs and lifestyle47–52. While much work has linked individual taxa to outcome, little is known about the relationship between enteric microbiotypes and response to anti-PD-1.
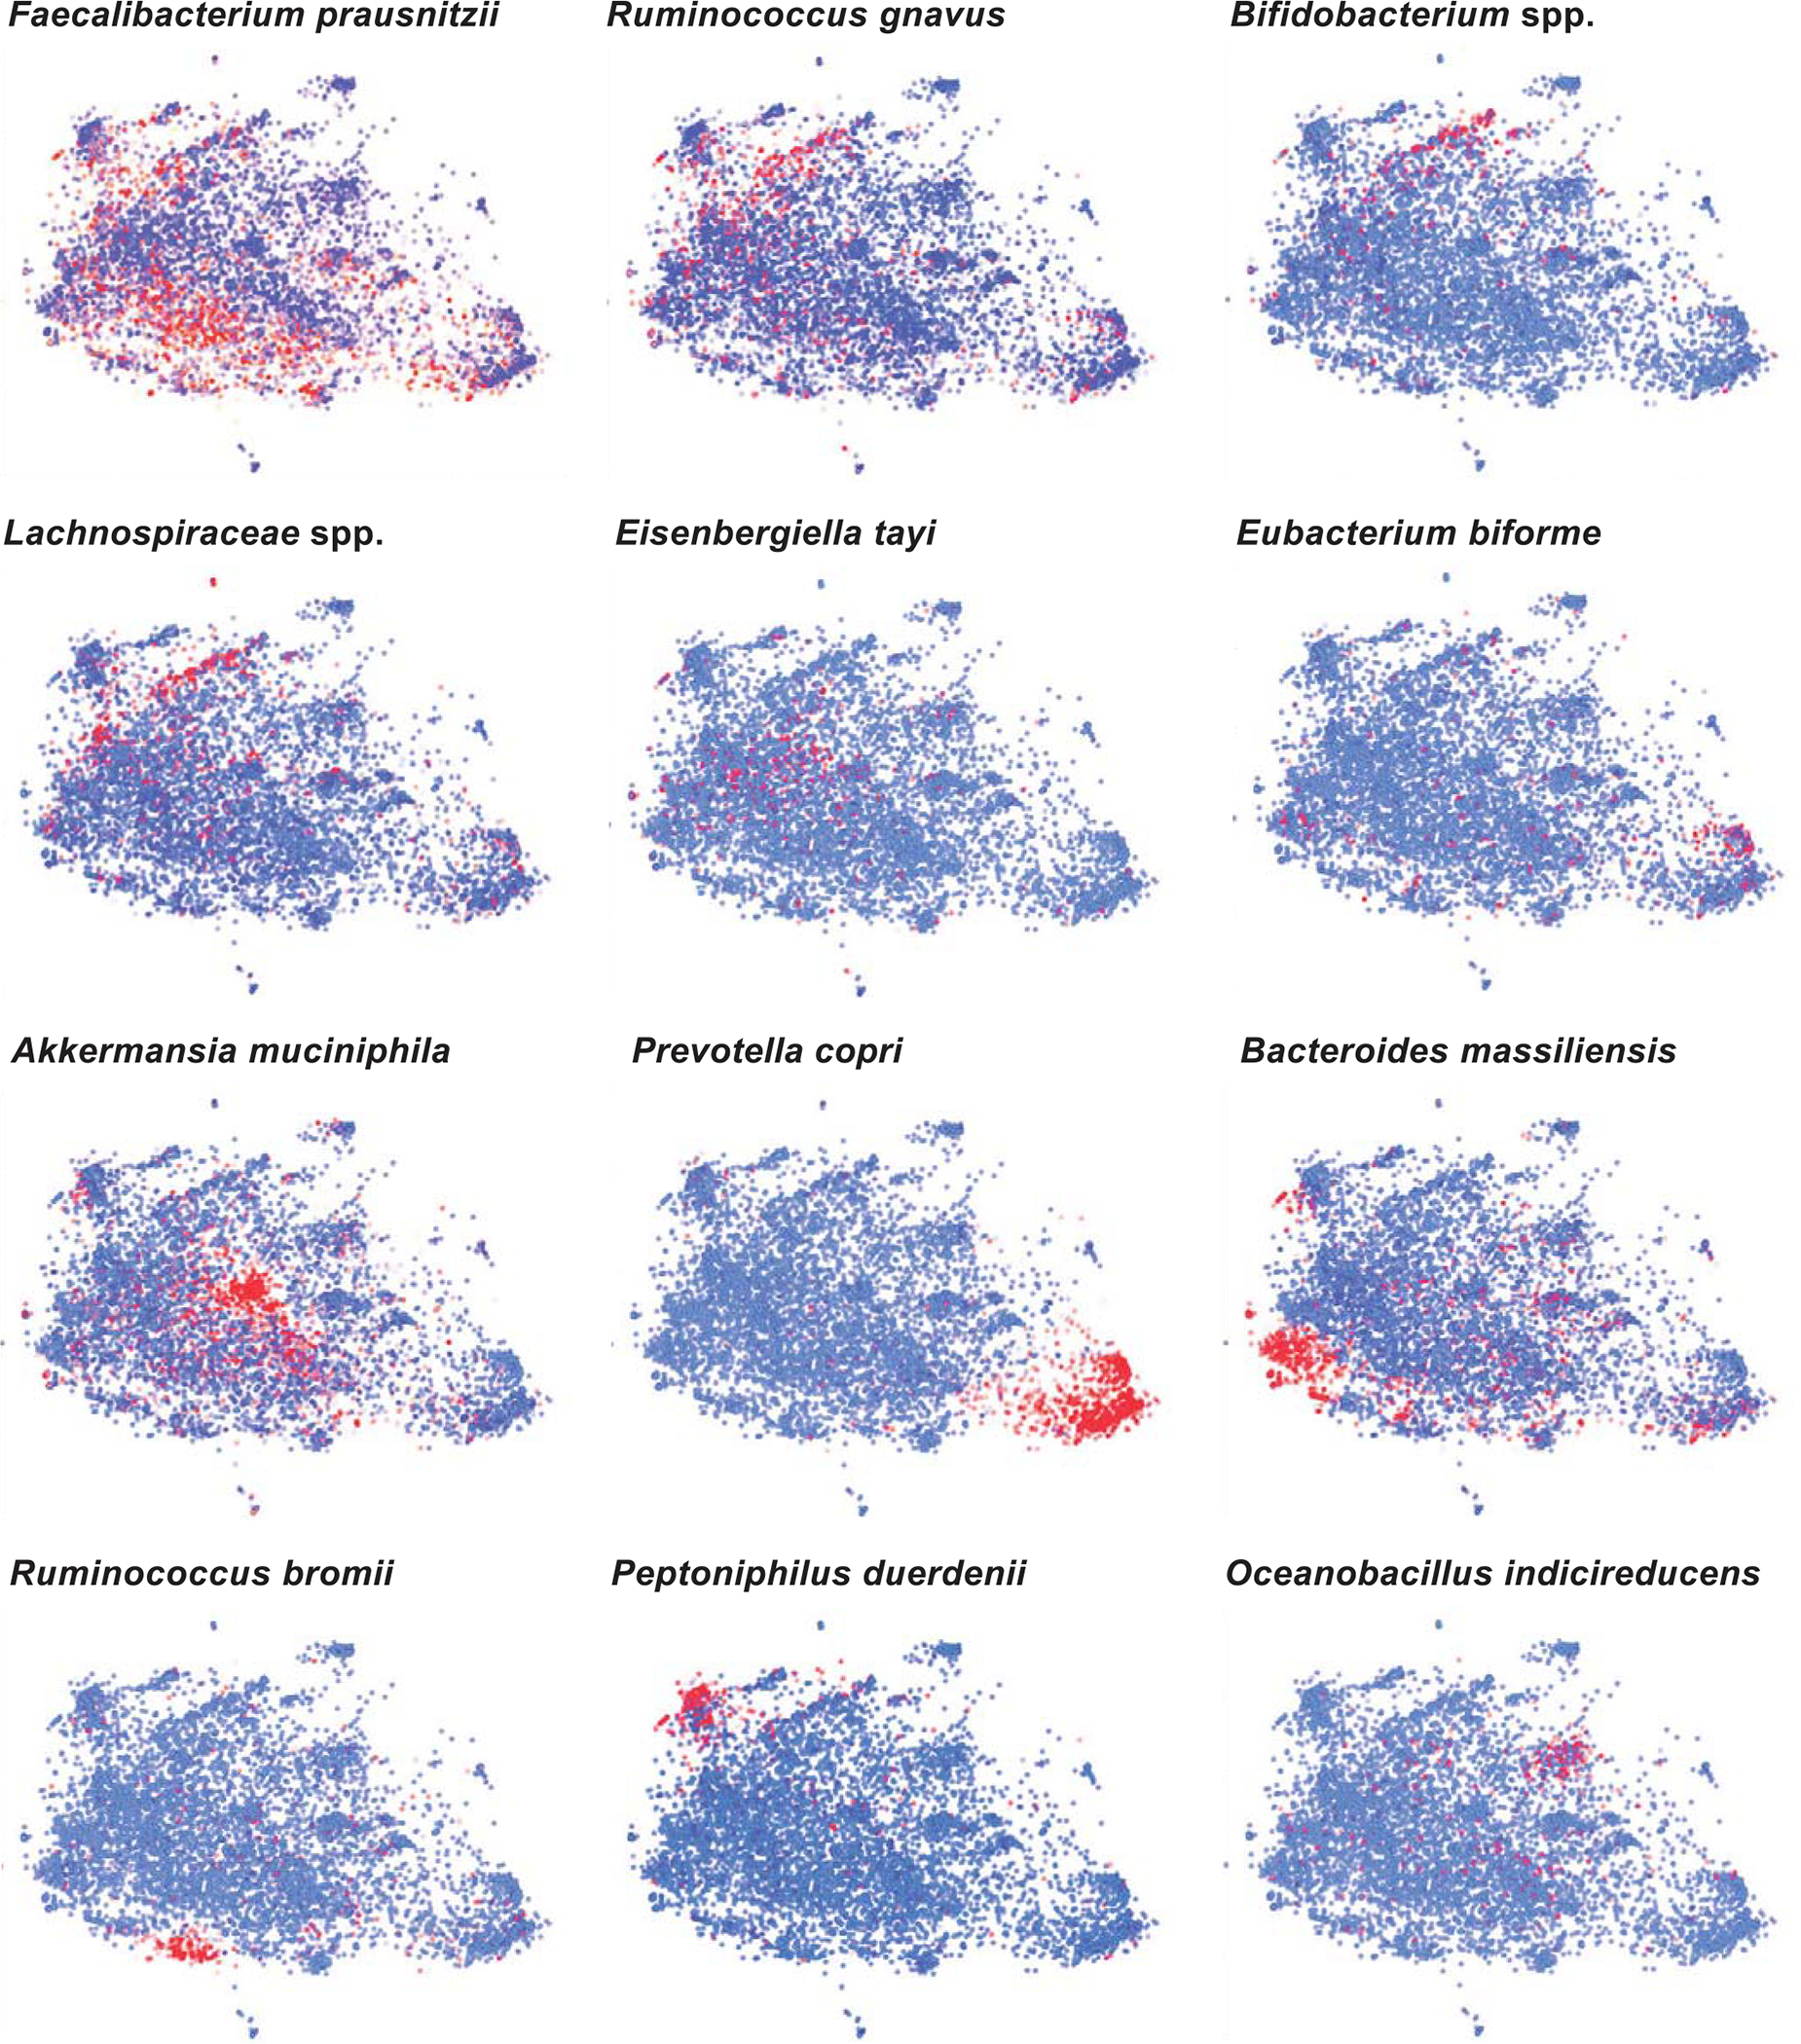
We observed that favorable and unfavorable bacteria identified in the five melanoma cohorts segregated in distinct clusters (Supplementary Fig. 13). To define these clusters, we uniformly analyzed 16S rRNA gene amplicon data from the American Gut Project (AGP) and PD-1-treated patients with melanoma available from four independent melanoma cohorts (Fig. 6a)53. We defined 27 distinct microbiotypes (Fig. 6a). Some were distinct (for example, clusters 9 and 19), while others (for example, clusters 13 and 27) had overlapping features with neighboring clusters (Supplementary Fig. 14a)54. Concordant with reported enterotypes in the human microbiome47,51,55, we identified microbiotype-defining taxa including Prevotella spp., Akkermansia spp. and Bifidobacterium spp. (Extended Data Fig. 9). Mapping 16S amplicon data from patients with melanoma to the AGP map, we observed differential distribution of four cohorts (Fig. 6b and Extended Data Fig. 10a). We also observed that Rs and NRs had a nonhomogenous distribution (Fig. 6c). By calculating the odds ratio (OR) of Rs to NRs in each cluster, Rs and NRs segregated into compositionally distinct favorable and unfavorable ‘superclusters’ with differential probabilities of response (Fig. 6d). We defined four superclusters that broadly grouped microbiotypes with similar correlation between microbial composition and clinical response: two enriched in favorable taxa and two enriched in unfavorable taxa (Fig. 6e). We also calculated probabilities of nonrandom distribution of clusters with ORs in similar directions within the same supercluster (Fig. 6e). We used analysis of variance (ANOVA; Fig. 6f) and linear discriminant analyses (Fig. 6g and Supplementary Table 9) to evaluate the most differentially abundant taxa within each supercluster.
Fig. 6 |. Mapping of combined 16S rRNA gene amplicon sequencing data from PD-1-treated patients with melanoma to the American Gut Project dataset identifies favorable and unfavorable enteric microbiotypes.
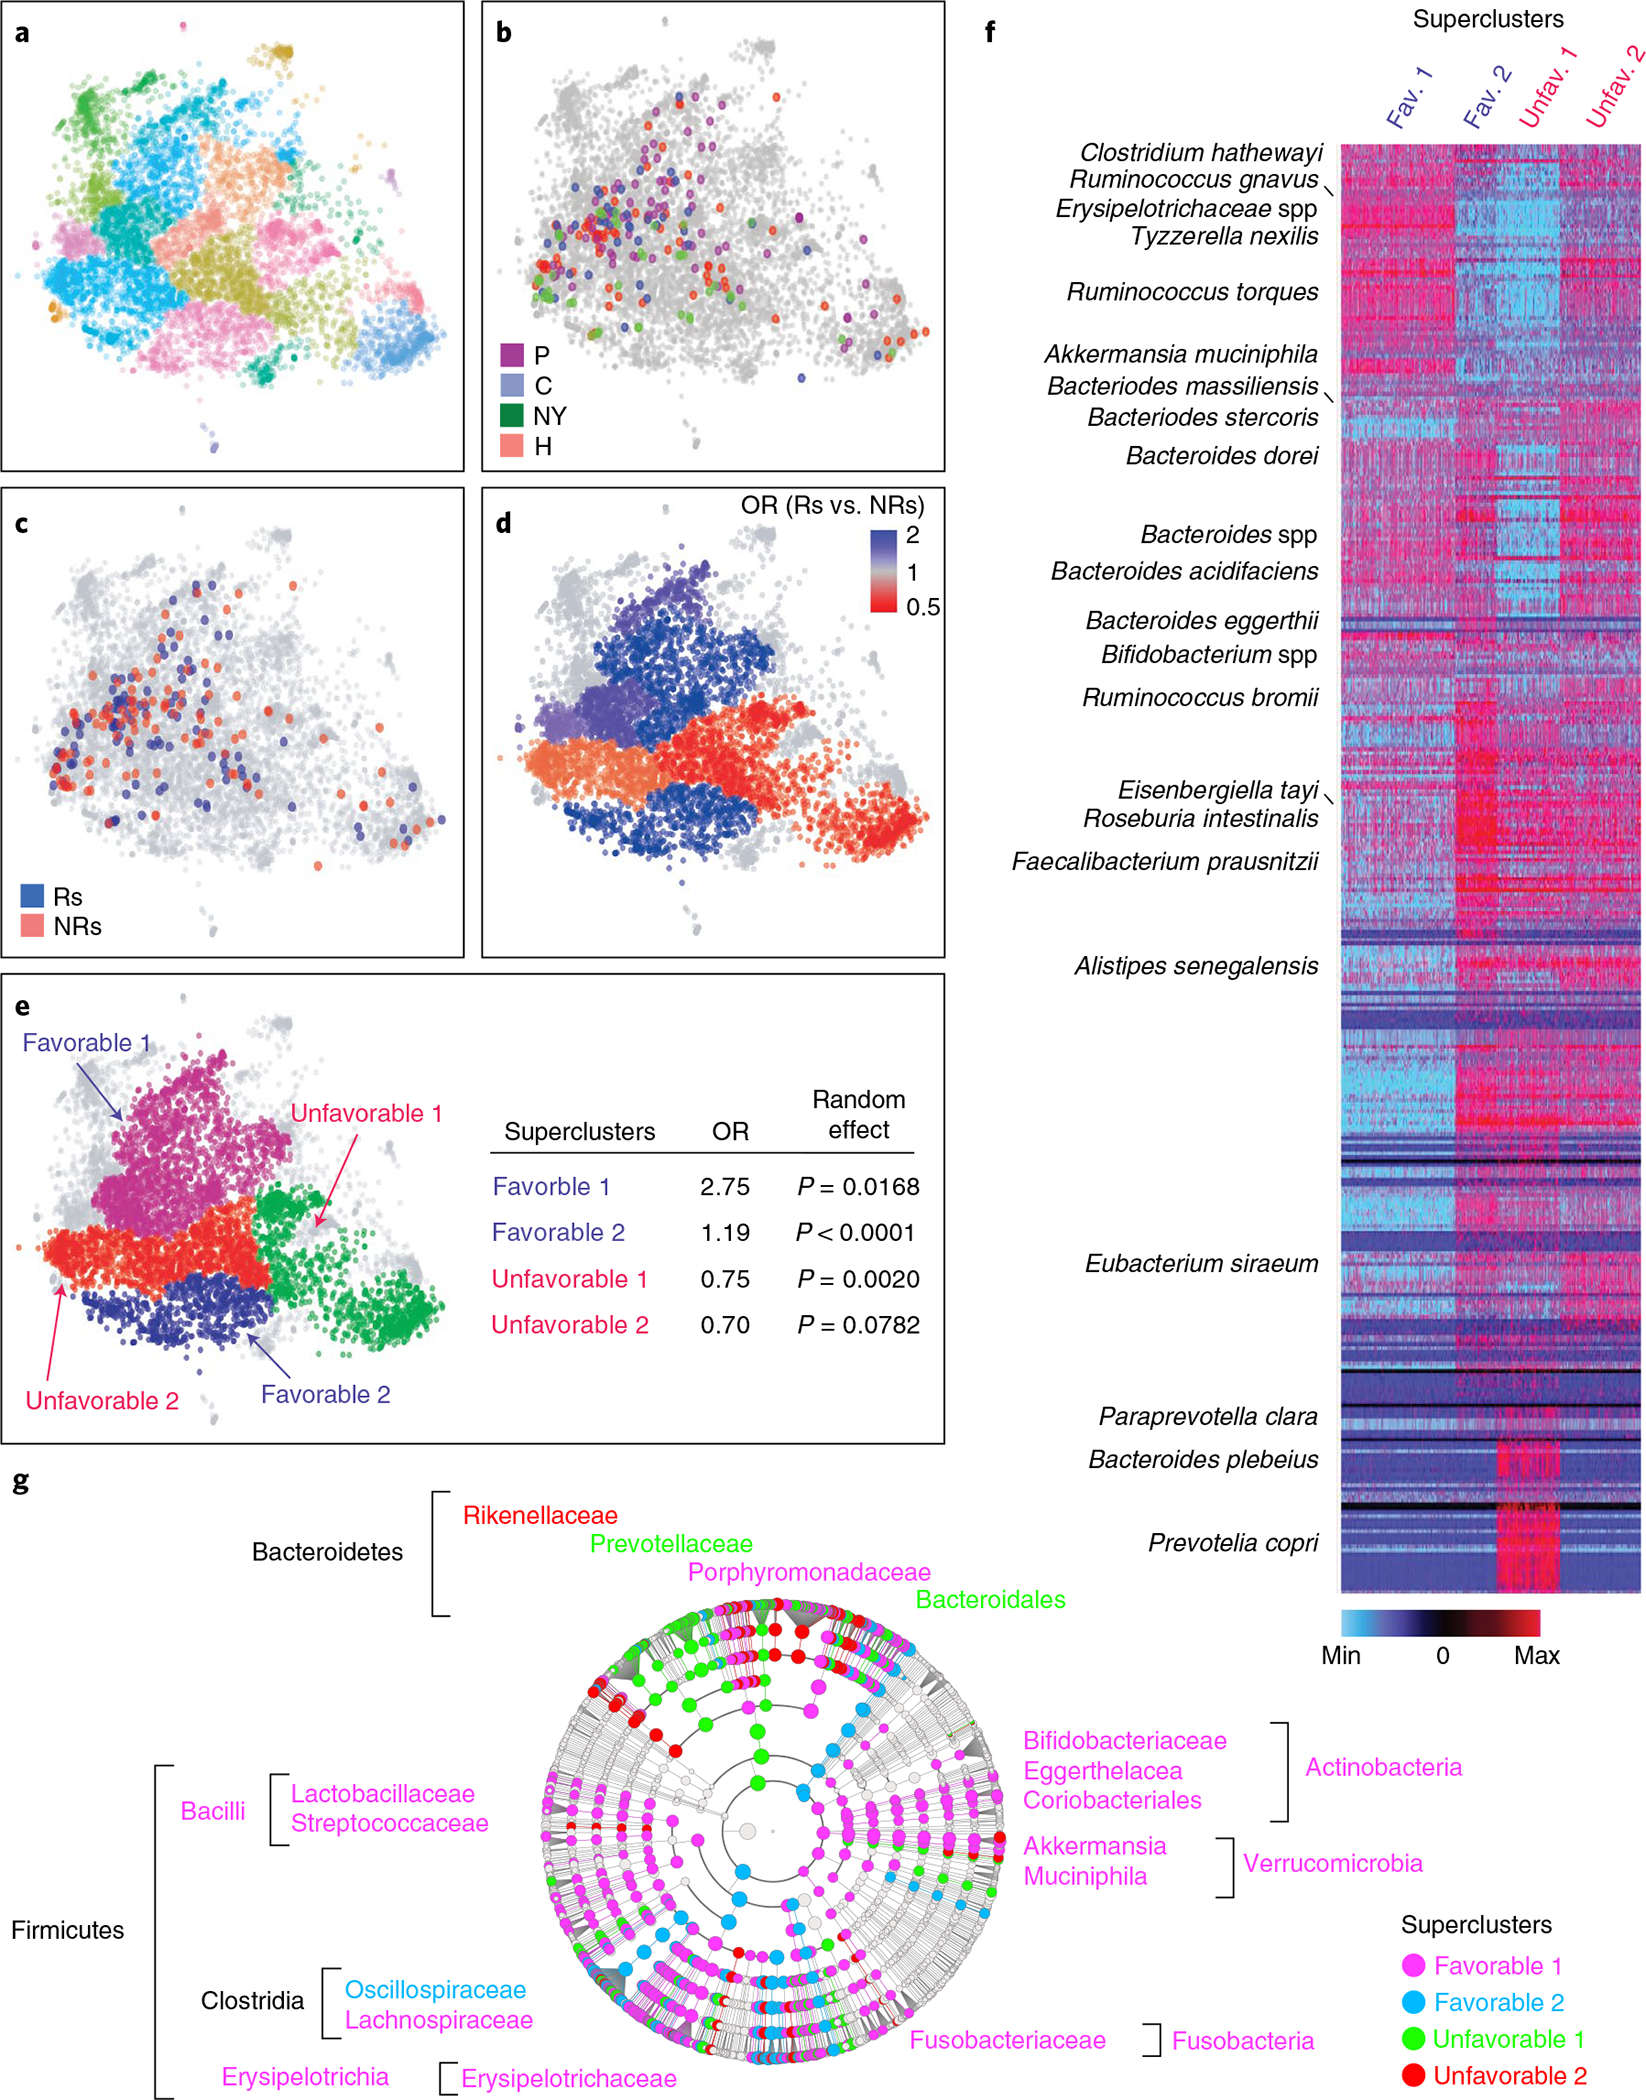
a, t-distributed stochastic neighbor embedding (t-SNE) plot of ~7,000 stool samples from the AGP dataset. All the sequences from AGP and melanoma cohorts were corrected to eliminate contamination of room temperature growing bacteria (‘bloom’) using the ‘Deblur’ program65. Samples were clustered using the PhenoGraph R package, and compositionally distinct clusters were displayed using different colors. b, Mapping of samples from four independent PD-1-treated melanoma patient cohorts (Chicago (C), Houston (H)4, New York (NY) and Pittsburgh (P)) with available 16S amplicon data onto an AGP t-SNE plot, with each cohort depicted in a different color. c, Mapping of samples from b onto an AGP t-SNE plot with Rs (blue) and NRs (red) depicted separately. d, Distinct favorable (blue) and unfavorable (red) enteric microbiotypes were estimated by calculating ORs of response to nonresponse in each cluster as defined by PhenoGraph in R. e, Manual segregation of favorable and unfavorable enteric superclusters from d onto an AGP t-SNE plot. Probability (P) of nonrandom distribution of neighboring clusters with the same OR of response within the four superclusters was estimated using a random-effects model. f, Heat map depicts abundances of all taxa from the AGP in favorable and unfavorable enteric superclusters. Dark red indicates most abundant; dark blue indicates least abundant. g, Visualization using LEfSe cladogram of differentially abundant taxa in the four superclusters calculated on 16S amplicon data from the combined cohorts.
Given differences in microbial taxa abundances in cohorts from different US cities and the known contribution of host location to microbiota variation4,5,12,13,56, we sought to define the effect of geography upon enteric microbiotype distribution. Using geolocation data from the AGP cohort, we mapped every sample and calculated the proportional distribution of each cluster at the county level (Extended Data Fig. 10b,c). Like a report on districts in southern China56, we observed preponderances of distinct clusters at the US state level (four representative microbiotypes with uneven geographical distribution shown in Extended Data Fig. 10d), suggesting a possible explanation of inter-study differences. We confirmed uneven distribution of microbiotypes and superclusters within the four cohorts analyzed (Supplementary Fig. 14b). In particular, favorable supercluster 2, characterized by abundance of Oscillospiraceae (Ruminococcaceae), was present in the Houston and New York cohorts, in which members of this family and Faecalibacterium prausnitzii in particular were associated with anti-PD-1 benefit, whereas it was almost absent in the Pittsburgh and Chicago cohorts. Favorable supercluster 1, characterized by members of the Lachnospiraceae and Bifidobacteriaceae families, was abundant in the Pittsburgh and Chicago cohorts, in which Lachnospiraceae and Bifidobacteriaceae spp., respectively, were associated with clinical response.
Discussion
Several studies demonstrated that gut microbiota composition correlates with response to ICB therapy, and FMT from Rs to NRs followed by anti-PD-1 can restore the ability of some patients to control tumors. However, the field has been hampered by lack of concordance of results among different studies. In addition, it is not clear whether the microbiome is important for initial response to ICB therapies or during the entire treatment. We show that baseline microbiota composition reaches the most significant association with clinical response (PFS) in the P-ESC cohort at 9–10 months and, similarly, in an independent Houston cohort at 13 months. The implications of these findings are several fold. Unlike previous studies that used multiple different clinical outcomes, these results provide a scientific rationale for selecting the clinical time point most significantly associated with baseline gut microbiome composition. They suggest that early response is dominated by host-intrinsic and tumor-intrinsic factors, while the microbiota influence on response becomes a dominant factor around 1 year after initiation of treatment. Afterwards, the association declines, possibly because of resurgence of new tumor-intrinsic factors (for example, appearance of non-immunogenic clones) or loss of beneficial microbiota in some patients. In this regard, fecal microbiomes of Rs collected around the start of therapy and at much later time points were similar to each other but different from microbiomes of NRs. Collectively, these observations, together with the ability of FMT to overcome primary PD-1-resistance11, suggests that favorable microbiota may need to be maintained to prevent disease progression.
We analyzed the role in regulation of therapy not only of individual species and strains but also larger taxonomical branches. Due to the heterogeneity of biologic properties underlying taxonomic diversity of commensal bacteria, response of the host to bacterial signals shared at the family level or higher may be involved in modulation of ICB efficacy. Indeed, our data in the Pittsburgh cohort showed a favorable microbiota signature that included multiple members of the Actinobacteria phylum and Lachnospiraceae family of Firmicutes phylum, while an unfavorable signature comprised members of Bacteroidetes and Proteobacteria phyla. Importantly, meta-analysis with four other published datasets largely confirmed these findings.
Although machine learning trained by individual cohorts failed to predict response across the other cohorts, likely because of cohort heterogeneity and small size, a leave-one-out model using batch-corrected data and training optimization consistently predicted the response in all cohorts. Cross-validation identified unfavorable bacteria of the Bacteroidetes phylum as predictive for most cohorts, while favorable bacteria of the Clostridium phylum were predictive only for subsets of cohorts.
Our data suggest that both systemic and enteric inflammatory status may be associated with poor PD-1 response. Patients with a high NLR, a biomarker of systemic inflammation predicting poor PD-1 response in multiple cancers including melanoma21–24, have shorter PFS than patients with a low NLR, associated with enrichment of LPS-producing Gram-negative bacteria in their microbiome. Analysis of the fecal exfoliome25 and network analysis integrating host and microbial data linked the presence of unfavorable taxa in NRs with an LPS-dependent inflammatory signature encompassing cytokines either directly or indirectly implicated in immune suppression, including CXCL8/interleukin (IL)-8, IL-1β and tumor necrosis factor. Using a new binning approach to focus on candidate bacterial driver genes, we observed enrichment of bacterial genes encoding key enzymes: polysaccharide deacetylase (associated with reduction of polysaccharide immunogenicity42) in Rs; and alpha-l-fucosidase45 and alpha-galactosidase46 (associated with mucus degradation) and glycosyltransferases (associated with LPS synthesis57) in NRs. One may speculate that mucus degradation allows localization of bacteria next to the intestinal epithelium, where bacterial products including LPS may promote chronic inflammation and immunosuppression.
As also previously proposed on the basis of predictive taxa in a meta-analysis of PD-1-treated cohorts16, multiple lines of evidence in the present studies—Gram-negative bacteria and LPS association with systemic and intestinal inflammation in NRs, transkingdom analysis, shared taxa associated with PD-1 response in different cohorts and machine learning prediction—converge upon the observation that unfavorable taxa are more consistently distributed across patients and cohorts than favorable taxa. While these data provide a possible explanation for the discordant results of previous studies, they also suggest a dominant effect of unfavorable taxa on PD-1 response, possibly through induction of an immunosuppressive inflammatory status. Identification of favorable taxa may be more difficult because of uneven distribution across patients, shared functions of different taxa, unique mechanisms mediated by each taxon or an indirect effect through ecological control of unfavorable taxa abundance.
We observed an association between irAEs and improved PFS using a landmark analysis, in agreement with previous studies58–60, and uncovered that baseline gut microbiome composition segregated PD-1-treated patients who developed irAEs from those who did not. Two distinct microbial signatures were associated with the insurgence of irAEs. While favorable bacteria of the Lachnospiraceae family enhance the immunostimulatory effects of anti-PD-1 both against cancer and self-antigens, others dominated by Streptococcus spp. may induce organ pathology without enhancing cancer immunity. Altogether, our findings help reconcile discordant published results linking irAEs and PD-1 response and will need to be confirmed in larger patient cohorts with sufficient representation of each type of irAE.
Multiple factors affect the composition of the human gut microbiome, including geography, diet, infection and drug usage56,61–64. Human intestinal microbiota variation encompasses discrete microbial clusters or enterotypes, although their distribution may be continuous and their composition can be variable within the same individual47,50,51. Complexity of highly dimensional gut microbiota may be better comprehended by organization into discrete classes of ecologically balanced communities or enteric microbiotypes that consider their functional and ecological context47,55. Enteric microbiotypes are distinctive of different geographical areas, as the human gut microbiome is affected by ethnicity and geographical origin48,49,52. To investigate whether certain microbiotypes are preferentially associated with clinical outcomes of PD-1-treated patients with melanoma, we clustered 16S rRNA gene amplicon data available from AGP and data from four independent melanoma cohorts. We observed that microbiotypes were unequally geographically distributed in the United States and differentially represented in the five analyzed cohorts. Four distinct superclusters (two favorable and two unfavorable) comprised distinct microbiotypes, with similar association between microbiome composition and clinical outcome. Altogether, evaluation of gut microbial signatures through the lens of microbiotypes, which exhibit geographical distribution and association with clinical outcome, explains some of the inconsistencies of previous data while still supporting their relevance.
In summary, our findings identified microbial signatures associated with clinical outcomes and irAEs in one new melanoma cohort and four previously published cohorts. We provide new data supporting the role of the gut microbiome in promoting chronic inflammation and immunosuppression. The findings suggest that distinct geographically distributed microbiotypes may be preferentially associated with clinical outcome in patients with melanoma treated with anti-PD-1. Our work provides a roadmap for future studies to confirm the relevance of our findings in large prospective cohorts of patients treated with ICB and supports additional preclinical studies to further our understanding of the mechanisms by which the gut microbiome regulates antitumor immunity10,11.
Online content
Any methods, additional references, Nature Research reporting summaries, source data, extended data, supplementary information, acknowledgements, peer review information; details of author contributions and competing interests; and statements of data and code availability are available at https://doi.org/10.1038/s41591-022-01698-2.
Methods
Patient characteristics.
Patient enrollment.
Patients with unresectable stage III or IV melanoma treated at the University of Pittsburgh’s Hillman Cancer Center (HCC) who were receiving frontline anti-PD-1 therapy for treatment of advanced disease were eligible. Patients were treated with single-agent anti-PD-1 immunotherapy (nivolumab, pembrolizumab or investigational anti-PD-1) or pembrolizumab in combination with peg-IFN in the context of a separate clinical trial, the results of which have been previously published (HCC 13–105, IRB approval no. CR19090075–002)66. Of the 94 studied patients, 78 patients (83%) were treated with anti-PD-1 in the frontline setting, and 16 patients (17%) received other prior therapy (Supplementary Table 1). Stool samples were banked under University of Pittsburgh Institutional Review Board-approved banking protocols (HCC 96–099 and 20–019, IRB approval nos. MOD19080226–004 and STUDY20010266, respectively). Radiographic response to therapy while receiving PD-1 inhibitor treatment was determined by the investigators providing the clinical treatment and assessed using response evaluation criteria in solid tumors (RECIST v1.1)67. Clinical response to therapy was assessed at each visit. Progression was defined based on first documented clinical and/or radiographic progression and confirmed in all instances.
Clinico-demographic variables.
Body mass index, NLR and lactate dehydrogenase were based on values obtained immediately before therapy or on the day of anti-PD-1 initiation. PPI exposure was defined as exposure to omeprazole, esomeprazole, lansoprazole, dexlansoprazole, pantoprazole or rabeprazole taken by patients for at least 30 d preceding the date of stool sample collection.
Survival endpoints.
PFS was defined as the time from the start of therapy to first confirmed clinical and/or radiographic progression. OS was defined as the time from the start of therapy to date of death. Patients were censored as of the date of last contact.
Immune-related adverse events.
irAEs were defined as any clinical and/or laboratory event that occurred following initiation of anti-PD-1 therapy that was definitely linked to administration of anti-PD-1 therapy based on investigator assessment. Adverse events were considered irAEs based on mechanism of action and a prespecified list of terms developed by study investigators and grouped under the following broader terms: pneumonitis, colitis, hepatitis, nephritis, arthritis, thyroid (including hyperthyroidism, hypothyroidism and thyroiditis), adrenal (adrenal insufficiency), dermatologic (skin and subcutaneous disorders including rash, pemphigoid and vitiligo) and neurologic (Guillain-Barré syndrome, encephalitis and myasthenic syndrome). Infusion reactions without immunologic etiology were not included in this analysis.
DNA/RNA extraction, sequencing and analysis.
Stool samples were collected from patients using Alpco EasySampler Stool Collection Kit (https://www.alpco.com/store/easysamplerr-stool-collection-kit.html) using a patient-specific and time-point-specific printed barcoded FedEx label. Samples were shipped overnight using a well-insulated FedEx container containing a Thermo pack to maintain a temperature below −15 °C to the HCC processing laboratory for initial processing. Immediately upon receipt, study staff opened the packages to check for stool sample adequacy and to ensure the paperwork (time and date of collection) had been completed. Samples were then stored in a −80 °C freezer. If after 2 weeks an expected stool sample had not arrived at the HCC laboratory, the participant was notified and a follow-up phone call was made to ensure a sample was collected. Subsequently, samples were shipped using a cold-chain approach to the Laboratory of Integrative Cancer Immunology at the National Cancer Institute (NCI), National Institutes of Health (NIH). Total metagenomic DNA was extracted from stool samples using the PowerSoil DNA Isolation Kit (MO BIO Laboratories) and Epmotion 5075 liquid handling robot (Eppendorf). The DNA library was prepared using the Nextera DNA Flex Library Prep Kit, quantified using Qubit, and sequenced on the NovaSeq System (Illumina) using the 2 × 150 base-pair (bp) paired-end protocol.
All code used for shotgun sequencing analysis can be found within the in-house JAMS_BW package, version 1.5.7, publicly available on GitHub (https://github.com/johnmcculloch/JAMS_BW). Quality trimming and adapter clipping of raw reads for each metagenomic sample was carried out using Trimmomatic (v0.36)68. Reads were then aligned against the human genome with Bowtie2 (v2.3.2)69, and unaligned (non-host) reads were assembled using MEGAHIT (v1.2.9)70,71. Assembly contigs smaller than 500 bp were discarded. For the 94 samples, mean sequencing depth (already discounting host reads) was 10.14 Gbp ± 4.95 Gbp, yielding a mean assembly rate of 81.94% ± 5.24%.
Taxonomic classification of contigs was achieved by k-mer analysis using Kraken 2 software72, with a custom 96-Gb Kraken 2 database built using draft and complete genomes of all bacteria, archaea, fungi, viruses and protozoa available in the NCBI GenBank in April 2020, in addition to human and mouse genomes, built in April 2020 using the JAMSbuildk2db tool of the JAMS package. Functional annotation of contigs was done ab initio with Prokka (v1.14.6)73. To evaluate sequencing depth of each contig, reads used for assembly were then aligned back to the assembly contigs. Unassembled reads for each sample were classified individually using Kraken 2 on the same database. Taxonomy was expressed as the LKT, or the taxonomically lowest unambiguous classification determined for each query sequence, using Kraken’s confidence scoring threshold of 5 × 10⁻⁶ (using the --confidence parameter). Relative abundance for each LKT within each sample was obtained by dividing the number of base pairs covering all contigs and unassembled reads pertaining to that LKT by the total number of non-host base pairs sequenced for that sample. Relative abundances were expressed in ppm.
For comparisons between samples, ordination plots were made with the t-SNE algorithm using the uwot package in R (https://github.com/jlmelville/uwot) and the ggplot2 library. PERMANOVA values were obtained using the adonis function of the vegan package, with default (999) permutations and pairwise distances calculated using Bray–Curtis distance. Heat maps were drawn using the ComplexHeatmap package in R74. For each feature, P values were calculated using the Mann–Whitney–Wilcoxon U test on ppm relative abundances for that feature in samples within each group. The log2FC values shown on the heat maps were obtained by calculating the fold change between the geometric mean ppm relative abundance for samples within each group, using the gtools::foldchange2logratio function to obtain log2FC value.
Transkingdom network analysis of multi-omics data.
Network reconstruction.
To create a statistical model of robust interactions among the different players, we created a transkingdom network11,27,28. Microbial (taxa and genes) and host (genes and phenotypes) nodes significantly different between NPs and Ps were first selected. Next, the Spearman rank correlation was calculated between all pairs of nodes. To keep robust relationships independent of a particular group, within-omics interactions were selected if they had the same sign of correlation in: (1) early Ps, (2) early NPs, (3) late NPs, and if they satisfied principles of causality (that is, satisfied fold-change relationship between the two partners in NPs versus Ps). For between-omics interactions, an additional criterion was applied to check that the sign of correlation calculated using all samples matched that of the within-group correlations. The combined P value (CP) for meta-analysis of within-group correlations was calculated based on Fisher’s z-transformation of correlations (metacor in R package ‘meta’ v4.9–7). For within-omics edges, the cutoffs were as follows: for phenotypes, CP < 5%, FDR < 10%; for host genes, within-group P values < 35%, CP < 10%, FDR < 15%; for LKTs, within-group P values < 30%, CP < 10%, FDR < 15%; for microbial genes, within-group P values < 3%, CP < 1%, FDR < 5%. Connections of microbes (taxa/microbial genes) and host genes with phenotypes had FDRs < 5% and 25%, respectively. Connections of taxa and microbial genes with host genes had FDRs < 15% and 5%, respectively, whereas taxa and microbial gene connections had within-group P values < 0.25% and FDR < 1%. The resulting transkingdom network was visualized with Cytoscape (2.6.3)75. Degree and Bi-BC scores were calculated using R 3.6 and compared between favorable and unfavorable LKTs (two-tailed Mann–Whitney U test, P value < 5%). To check whether observed interactions were by chance, we created 103 random networks keeping the same number of total nodes and edges. Next, we assessed connectivity between phenotypes and each type of omics data (taxa, microbial and human genes) by calculating the number of observed edges between two groups of nodes in the transkingdom network normalized by the number of all possible edges in a bipartite graph of the two groups of nodes. P values were calculated by one-sample Wilcoxon signed-rank test.
Determining cutoff points for markers with continuous values.
Analysis was performed using Evaluate Cutpoints software, as described previously20. Briefly, the ‘coxph’ function from the ‘survival’ package was used to fit a Cox proportional hazard model to the binary outcome (OS, dead/alive; PFS, progressed/not) and continuous (overall or PFS time and biomarker value) covariates. Cutoff points were then computed with the ‘cutp’ function (survMisc v0.5.5 package), and samples were categorized into high and low groups based on biomarker values. A Kaplan–Meier plot was generated using a combination of survival v3.2–11, ggplot2 v3.3.5 and plotly packages. Finally, univariate and multivariate Cox regression analyses for categories were performed using the coxph function from survival package, and HRs, confidence intervals and P values were calculated.
In silico validation of significant microbes in an independent cohort.
Of the 93 bacteria significant from the Pittsburgh cohort (Supplementary Tables 4 and 5), applying the same fecal abundance threshold (cutpoint) from the Pittsburgh cohort to the Houston cohort showed only 11 unfavorable (HR > 1) bacteria (mostly Prevotella spp.) with concordant Cox regression HR direction and P value < 10%. However, significance was lost when corrected for multiple testing (bacteria). To avoid the use of cohort-specific optimal cutpoints, continuous variable Cox regression analyses for log (microbial abundance) versus PFS were performed separately for the full Pittsburgh and Houston cohorts (survival v3.2–11; survminer v0.4.9; R v4.0.5). Due to the low sample size for the Houston cohort, checking for common (multiple-testing corrected) significant microbes from the two cohorts would result in more false negatives. Therefore, we applied GSEA as a threshold-free enrichment analysis to check whether significant bugs from the Pittsburgh cohort were enriched in the Houston cohort. Briefly, ‘LKT sets’ from Pittsburgh were defined at different Storey FDR (qvalue v2.22.0) cutoffs, and LKTs from Houston were ranked as per their beta (ln(HR)) from continuous variable Cox regression. GSEA checks whether microbes from an LKT set from one cohort are overrepresented at the ‘top’ (or ‘bottom’) of the ranked list in the second cohort more than expected by chance. Enrichment plots were generated using standalone GSEA (v4.1.0), fgsea (v1.16.0) and ggplot2 (v3.3.5).
Landmark analyses to determine the effect of immune-related adverse events on progression-free survival.
To account for lead-time bias inherent to the time-dependent nature of irAEs, we performed landmark analysis for PFS using only patients who survived for at least 10 months after initiation of therapy. An irAE was considered present if it developed before the landmark date or absent if it had not developed before the landmark date and/or occurred after the landmark date76.
The time point of 10 months was chosen based on our observations regarding the time when favorable and unfavorable microbiota maximally segregated between anti-PD-1-treated patients with melanoma (Fig. 1a,b). This 10-month time point also maximized the number of patients who developed irAEs while minimizing the number of patients who progressed before the landmark. A similar method has been adopted in multiple prior analyses of anti-PD-1-treated patients with melanoma, wherein conditional landmark analyses were performed to remove guarantee-time bias77.
Machine learning methods.
Machine learning analyses were performed on taxonomic counts that were batch corrected by study using ComBat (v. 3.20.0)78. For comparison, several machine learning methods were tested—RF79, SVM80 and GLM81 using an inverse link function.
Each study was balanced by randomly removing either R or NR samples to obtain equal numbers of Rs and NRs. To reduce the number of features involved in training for the all-versus-all analysis, k-means clustering with k = 150 was applied to the taxonomic count table to create 150 clusters. Organisms belonging to each cluster were recorded to allow interpretation of clusters. Machine learning models were produced for each study with the R package caret v6.0.90 (https://CRAN.R-project.org/package=caret) using a training set of 70% of samples, with the remaining 30% used to evaluate model performance. To help improve results of the models given the random effects of picking train–test sets as well as random factors involved in various machine learning methods, the model chosen for further use was the best performing model from 100 bootstrap replicates of 70/30 train–test sets. The code used to create these results is available at https://github.com/trinchierilab/microbiotapd1melanoma2021.
Separately, we implemented a new modification of the traditional leave-one-out cross-validation approach where we tried to overcome limitations of the small training size of the cohorts. Models were trained on batch-corrected taxon count data from four of the five cohorts and tested on the remaining cohort. However, for selection of the model from the test dataset, we additionally repeatedly separated the training dataset into 70:30 train–test splits and performed training/testing using RF, GLM and poly-SVM 100 times. Afterwards, the best model was selected and used to test on the initially left-out dataset. That procedure was repeated for all cohorts. Statistical significance of the consistency of predictions across different cohorts and different machine learning methods was performed using a random-effects model in forest plots.
A manual predictive model was trained on the organisms associated with increased and decreased PFS in the Pittsburgh cohort (Supplementary Tables 4 and 5). For each sample, a positive score was given to each organism associated with increased PFS surpassing its cutpoint and a negative score to each organism associated with decreased PFS surpassing its cutpoint. As there were more organisms associated with decreased PFS than increased PFS, positive score was set to 2.5 and negative score to −1.
Transcriptomic analyses of exfoliated intestinal cells.
Fecal RNA was isolated with Epmotion 5730 using MO BIO’s PowerFecal kit (Qiagen). Although the fecal environment is capable of quickly degrading host RNA, the very large number of cells shed into the lumen makes RNA identification possible. In addition, shed cells most likely die very fast in the intestinal lumen and thus would have minimal time to change RNA expression levels. Sequencing libraries were prepared using Illumina TruSeq Stranded Total RNA sequencing kit, following depletion of bacterial ribosomal RNA with the RiboZero (Illumina) kit. Libraries were quantified using Qubit and sequenced using Nextseq 500. Sequencing reads, after adapter trimming with Trimmomatic (0.33)68 and basic quality control, were analyzed using the RSEM package. Resultant count files were further analyzed with R 4.04. Briefly, genes with counts that had less than five reads, genes encoding ribosomes, and ribosomal and mitochondrial genes were removed, and counts were log transformed and quantile normalized. P values were calculated using the Mann–Whitney U test and visualized using ggplot2 in R. Significant genes were uploaded to Ingenuity Pathway Studio, and upstream regulator analysis output was used to construct a network using Cytoscape (3.8.0)75.
For cell prediction analysis, the resultant datasets were individually analyzed using GSEA and compared to a gmx file containing gene signatures of all cell types that we derived in-house from the Immgen database (https://www.immgen.org/). GSEA analysis was done in R using the fgsea package v1.19.4. Normalized enrichment scores were used to calculate ratios between Rs and NRs, and normalized size was used to represent abundance of different cell types in the data. For difference between NPs and Ps, we used ranked values of NP/P ratios. For prediction of cell abundance, we used ranked values of individual samples. Resultant values of leading-edge GSEA analysis were used to calculate ratios of differences between Rs and NRs and presented as average values of leading-edge analysis for all samples to visualize abundance of the predicted cell type, analogous to a standard MA plot.
Meta-analysis methodologies.
Data were analyzed using two meta-analysis methods: Fisher’s method for combining P values, and a random-effects model. The random-effects model meta-analysis was calculated using meta package in R with default parameters. Taxa with heterogeneity P values > 0.1 were considered. Fisher’s combined P value was calculated as follows. The results of individual analysis of all datasets were compared. Taxa that agreed in directionality of NP versus P differences in more than four of five datasets were considered. When taxa in one of five datasets failed to agree in directionality, its P values were assigned as 0.999 and ratio as one. χ2 values and the combined P value were calculated. Data were visualized using heat maps or volcano plots (R 4.04).
Reference-independent binning analysis of metagenomic data.
Sequencing reads were quality trimmed using Trimmomatic (0.33)68, host RNA was removed using Bowtie2 (v2.3.2)69. Reads for all samples from all five cohorts were combined into one large file and larger sequence contigs were assembled using MEGAHIT (1.2.9)70,71. Reads longer than 1,000 bp were used in the analysis. Contigs were indexed using bwa package v0.7.17, and reads from individual samples were aligned to contigs. The resultant dataset was used to calculate clusters using Phenograph R package v0.99.1 and t-SNE plots. To reduce cluster overlap, contigs were subdivided into taxonomic units using Kraken package before application of Phenograph clustering tool. Clusters were merged into single fasta files and analyzed again using Kraken. Resultant clusters were considered independent functional taxonomical units (FTUs). To perform comparison between FTUs within specific taxa, for every FTU we created a taxa–gene dataset where existence of the gene was remarked by number ‘1’ and absence by ‘0’. Favorable and unfavorable taxa were identified using statistical tools described above, and the top 30% and bottom 30% of taxa were used for statistical comparisons. Taking advantage of the presence of genes associated with clinical response in only a fraction of subspecies of certain taxonomic species but shared among more than one different species, we attempted to identify bacterial genes potentially encoding products directly or indirectly affecting clinical response. Data were visualized using Cytoscape (v.3.8.0)75.
Clustering of enteric microbiotypes from metagenomic data.
Stool AGP data were used for analysis. Only read 1 was used in the analysis. Data were pooled together with 16S data from the abovementioned cohorts. All sequences from AGP and patient samples were corrected for possible expansion at room temperature of certain species (‘bloom’) using the ‘Deblur’ technique (v.1.1.0), which has been shown with AGP samples to yield results consistent with studies of carefully preserved samples65. Quality-trimmed data were combined into one file, and unique sequences with more than ten reads were identified and used as a reference. Unique reads were indexed with bwa, and sequences from individual samples were mapped back to those reads. Data, like the analysis above, were clustered using Phenograph R package v0.99.1; the most abundant sequence of the cluster was classified using RDP algorithm in Mothur v1.45.2, and these data were assigned to the whole cluster. The resultant dataset was filtered to include at least 5,000 reads per sample and clustered using Phenograph R package and t-SNE into bins (or tentative microbiotypes). To determine favorable or unfavorable status of the microbiotype, every OR was calculated for every cluster. A random-effects model for uniformity of clusters was calculated with the R package meta (v5.1–1) using number of Rs and NRs as mean and n, and standard deviation values were calculated from the Poisson distribution model. Once favorable and unfavorable clusters were defined, we used linear discriminant analyses (LEfSe package v1.1.2) or ANOVA analysis to identify taxonomic composition of those groups.
Extended Data
Extended Data Fig. 1 |. Kaplan-Meier plots of progression-free survival and overall survival in the Pittsburgh early sample cohort and progression-free survival after dichotomization for abundance of select bacterial species.
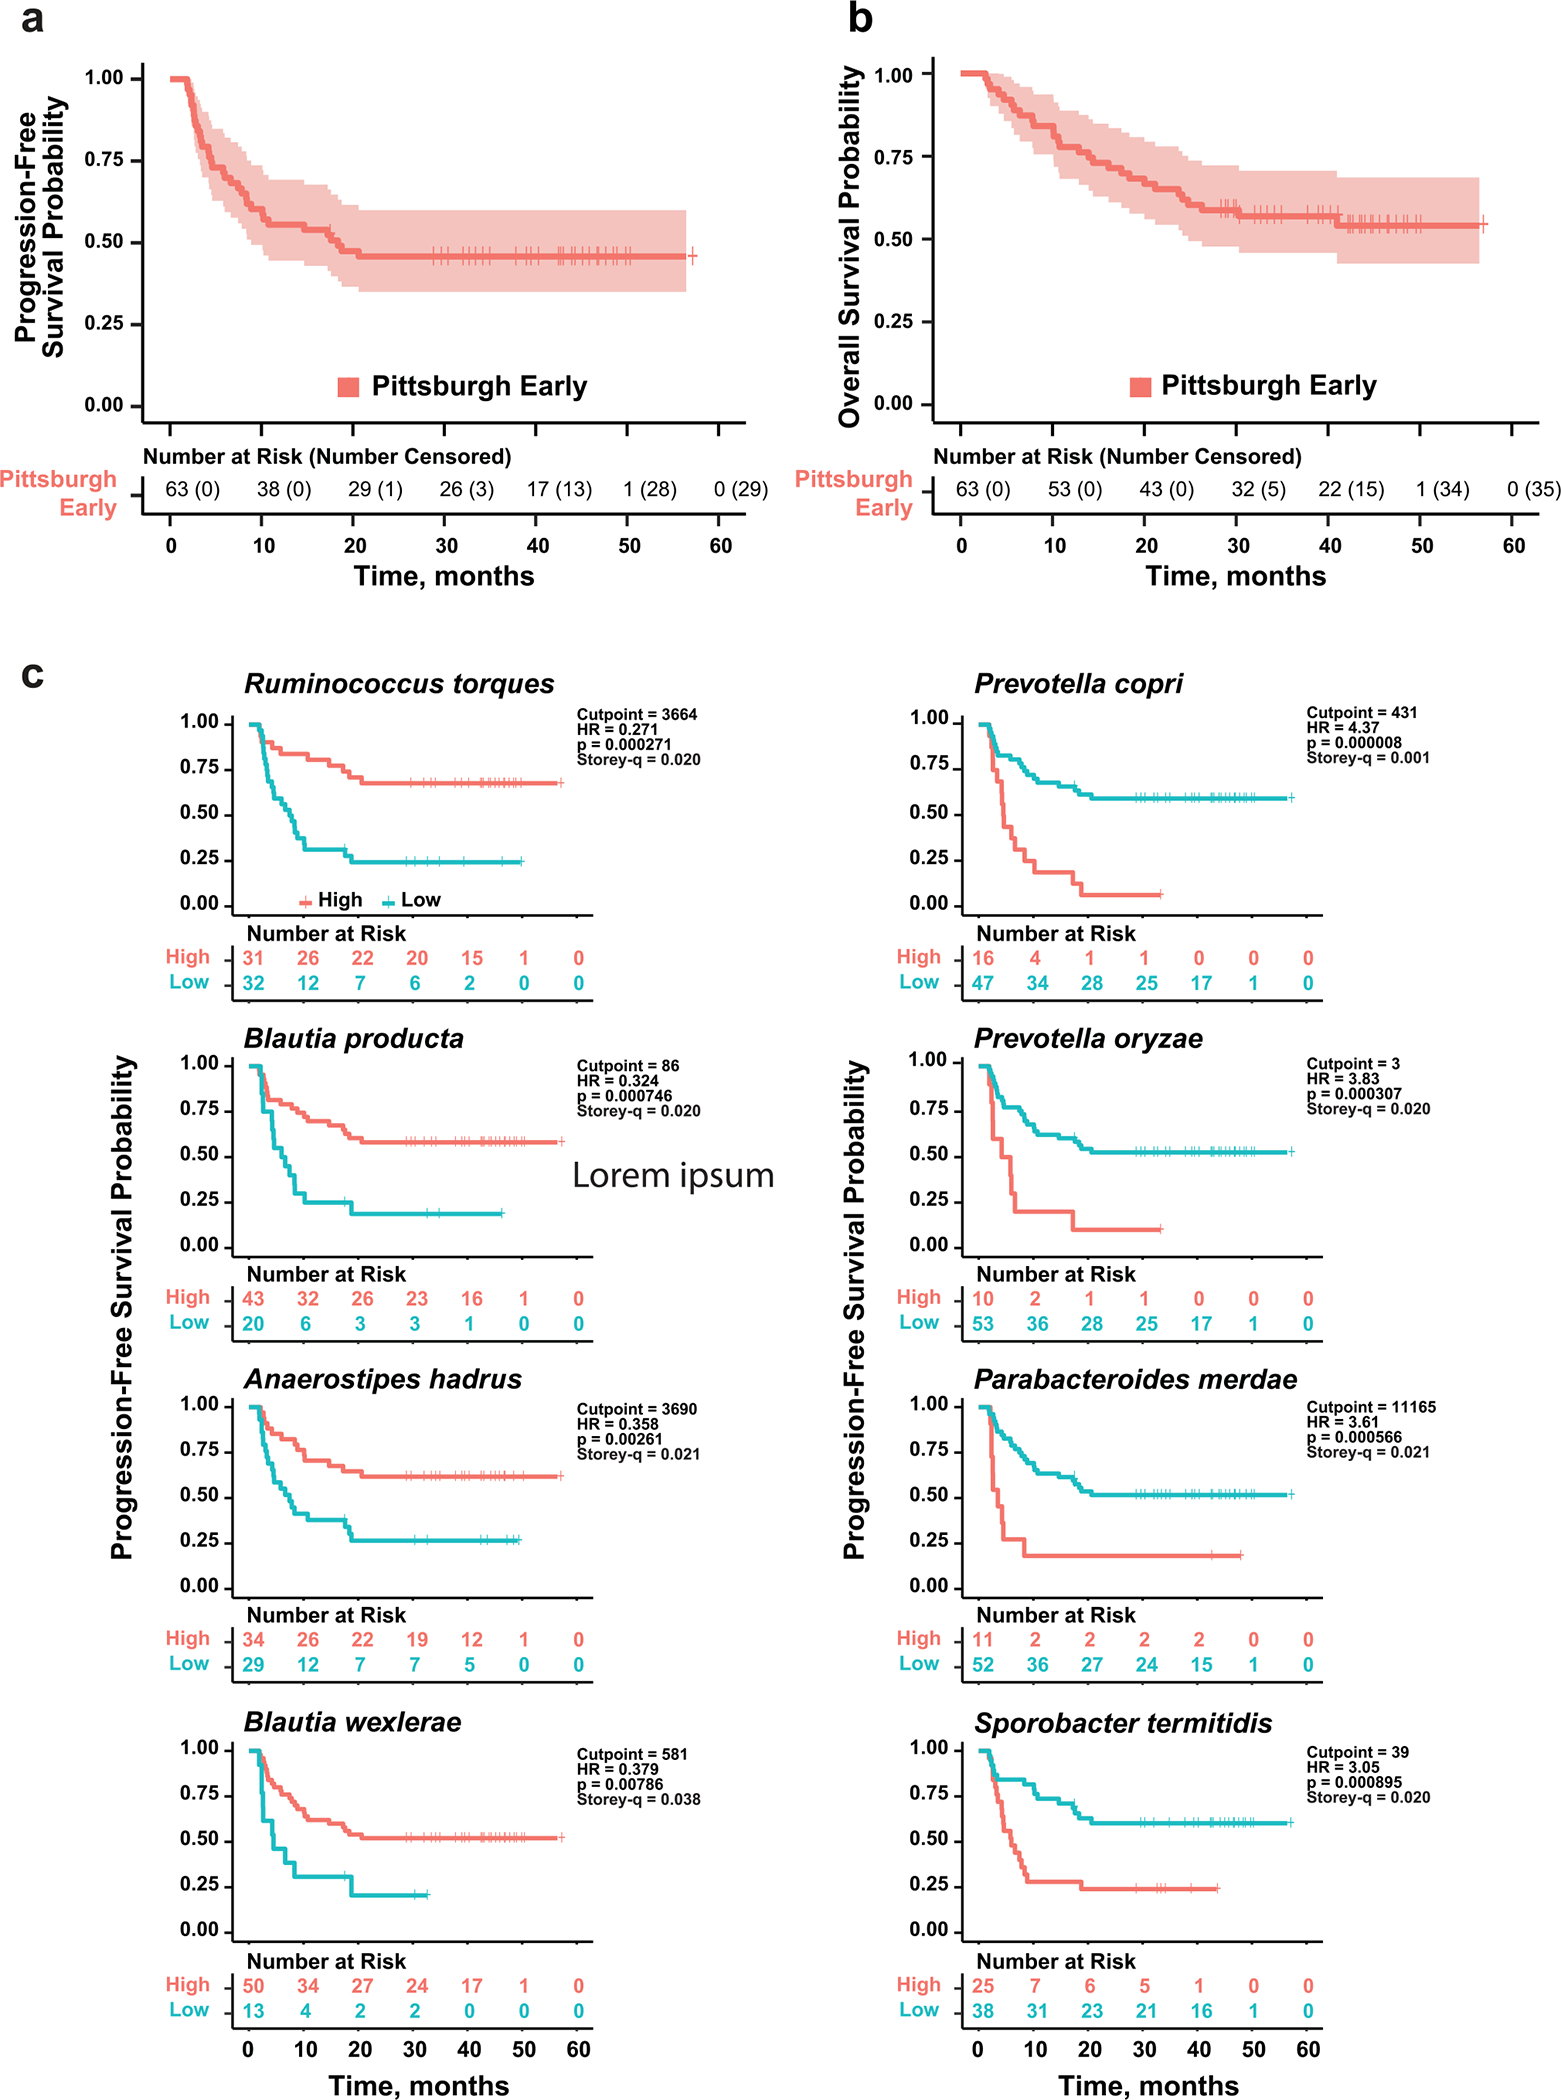
a and b. Kaplan-Meier plots of probability of progression-free survival (PFS) (a) and overall survival (OS) (b) of PD-1-treated Pittsburgh early cohort melanoma patients. Vertical ticks show censored data. Central line is median OS or PFS probability, shaded area shows 95% confidence interval. c. Optimal cutpoints of bacterial abundance determined using Evaluate Cutpoints. Different plots show the effect on PFS of abundance (high vs. low) of the top four most significantly increased (left) and decreased (right) individual bacterial species in non-progressors at 10 months, determined using Mann-Whitney U test (Fig. 1c). Number of people at risk in in either group (high vs. low abundance) is shown below each panel. Vertical ticks show censored data. Hazard Ratio (HR) and score (logrank) test two-tailed p-value from Cox proportional hazards regression analysis.
Extended Data Fig. 2 |. Microbiota composition of non-progressing patients in the Pittsburgh cohort whose stool samples were collected 4–41 months after initiation of therapy is not predictive of late therapy failure but is enriched for similar bacterial taxa as observed in the initial microbiome of patients who did not progress at 10 months.
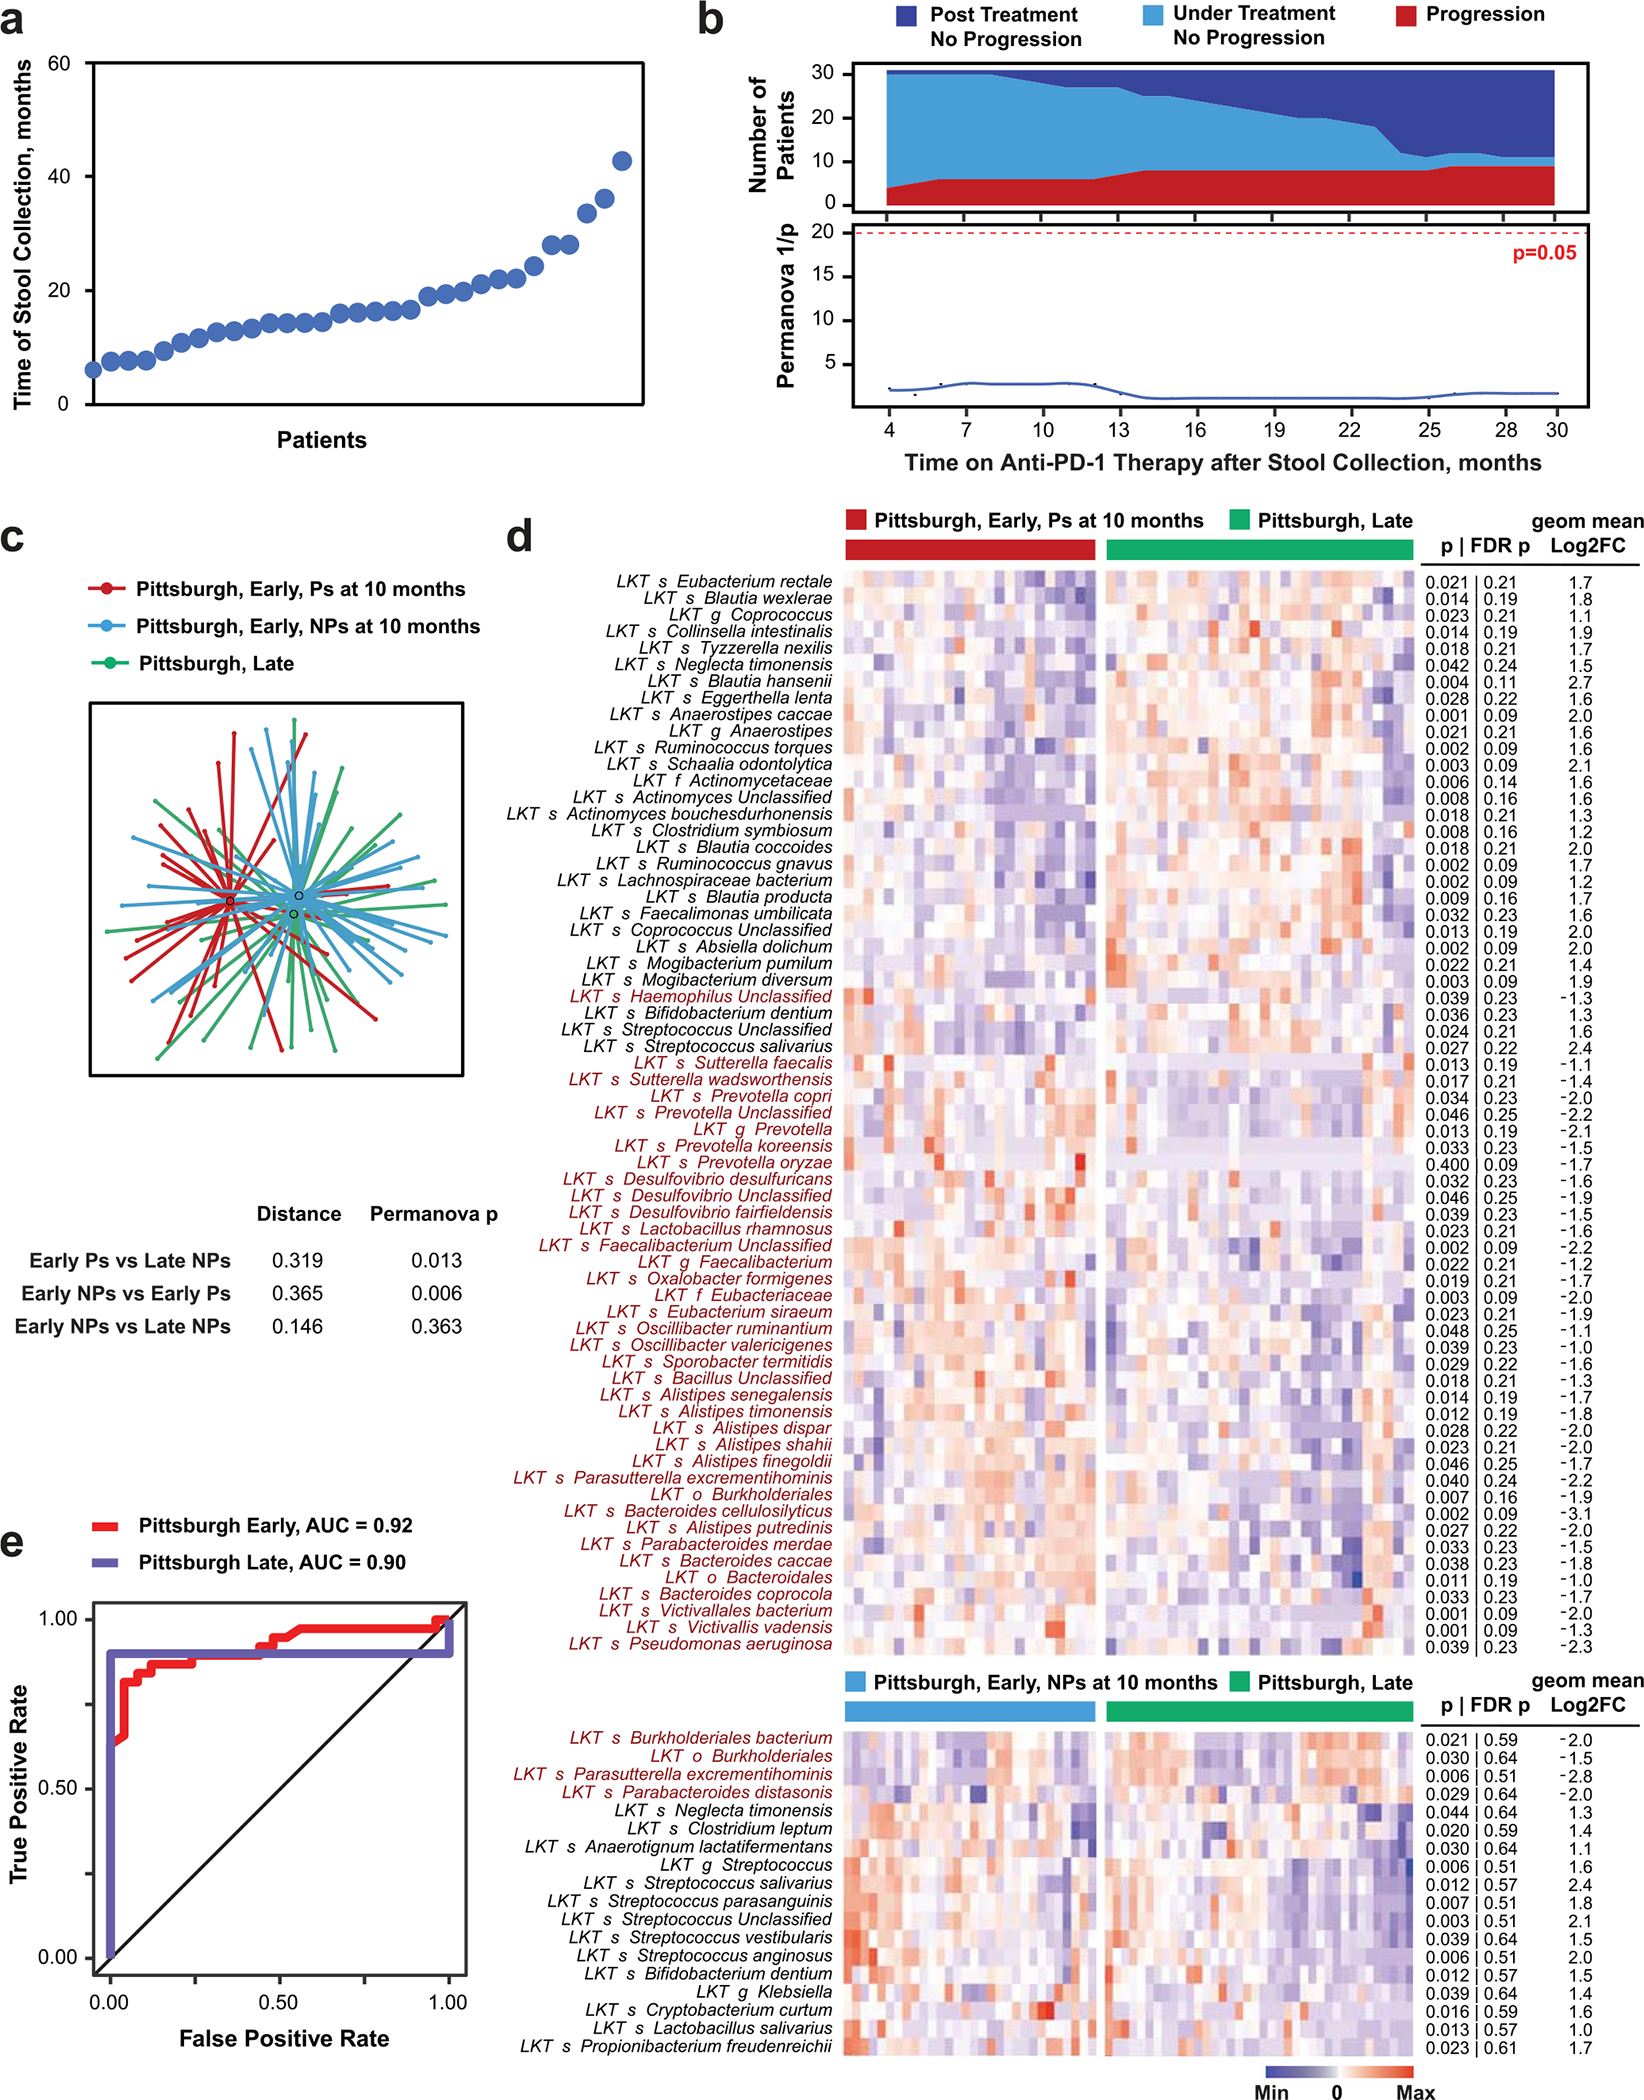
a. Plot of time of stool sample acquisition from 31 patients whose samples were collected after >4 months from therapy initiation. b. Progressor (P) and non-progressor (NP) groups identified at serial timepoints after late stool collection (top panel) were used to calculate the significance (two-tailed p-value) of compositional differences of the late-collected fecal microbiome using PERMANOVA (bottom panel). Fecal microbiota composition was determined using metagenomic sequencing. Progression during continued therapy was evaluated using RECIST v1.1 every 3 months or by clinical observation during follow-up visits. Number of patients on follow-up at each timepoint in relation to response status is shown in top panel. c. t-distributed uniform manifold approximation and projection (t-UMAP) plot depicts fecal microbiota compositional differences between early-collected patients who progressed (red) or did not progress (blue) in the first 10 months after initiation of therapy and late-collected long-term responders (green). Distance between centroids calculated as described in Fig. 1a, and significance (two-tailed p-value) of the differences by PERMANOVA are shown in lower table. d. Heatmap shows differentially abundant taxa (p < 0.05 and FC > 2) between the late Pittsburgh cohort compared with Ps (top) and NPs (bottom) at 10 months from the early Pittsburgh cohort. Columns denote patients grouped by each cohort before clustering; rows denote bacterial taxa enriched (black) or depleted (red) in early-sampled P versus late-sampled long-term NP clustered based on microbiota composition. Two-tailed p-values were calculated using two-tailed Mann-Whitney U test. e. ROC curve for manual model trained on the organisms associated with increased and decreased PFS in the Pittsburgh cohort from Supplementary Tables 4 and 5. Note that the model predicts late Pittsburgh samples well even though they were not included in the data used in training.
Extended Data Fig. 3 |. Entire time-to-event progression data analysis by Cox regression method of baseline fecal microbiome composition identifies additional favorable and unfavorable taxa linked with response to anti-PD-1 immunotherapy.
a. Volcano plot depicting bacteria identified by effect on progression-free survival (PFS) in the Pittsburgh early sample cohort using Cox regression analysis in Evaluate Cutpoints software. Taxa with q < 0.05 are shown as red dots. b. Cladogram visualization (favorable taxa – blue; unfavorable taxa – red) of bacterial taxa at different phylogenetic levels identified using approach described in (a).
Extended Data Fig. 4 |. Differential abundance analysis reveals relationship of baseline gut microbial taxa with high vs. low neutrophil-lymphocyte ratio in Pittsburgh early sample cohort.
a. t-distributed uniform manifold approximation and projection (t-UMAP) plots depicting fecal microbiota compositional differences between patient groups with high (≥3.82; orange) and low (<3.82; green) pre-treatment neutrophil-lymphocyte ratio (NLR). Optimal cutoff for NLR (3.82) was determined by time serial PERMANOVA as shown in Fig. 1a. Two-tailed p-value was calculated using PERMANOVA. b. Heatmap of differentially abundant taxa (p < 0.05 and FC > 2) in high-pre-treatment NLR (orange) and low-NLR (green) patients, using optimal cutoff (3.82). Columns denote patients grouped by NLR status and clustered within each group; rows denote bacterial taxa enriched (red) in patients with high NLR clustered based on microbiota composition; no bacterial taxa significantly enriched in the low-NLR patients were identified. Statistical significance was calculated using two tailed Mann-Whitney U test. Bar plot to left of heatmap indicates extent of association between corresponding taxa and PFS probability [scaled hazard ratio (HR)] with Storey’s q-values <0.1 displayed within cells. Proportion of Gram-negative bacteria among those associated with high NLR was 58%, significantly higher than the average proportion of Gram-negative in patients’ fecal microbiome (28%, Chi-squared p = 0.0004).
Extended Data Fig. 5 |. Gut microbial gene differences discriminate between non-progressors and progressors during anti-PD-1 therapy in the Pittsburgh early sample cohort.
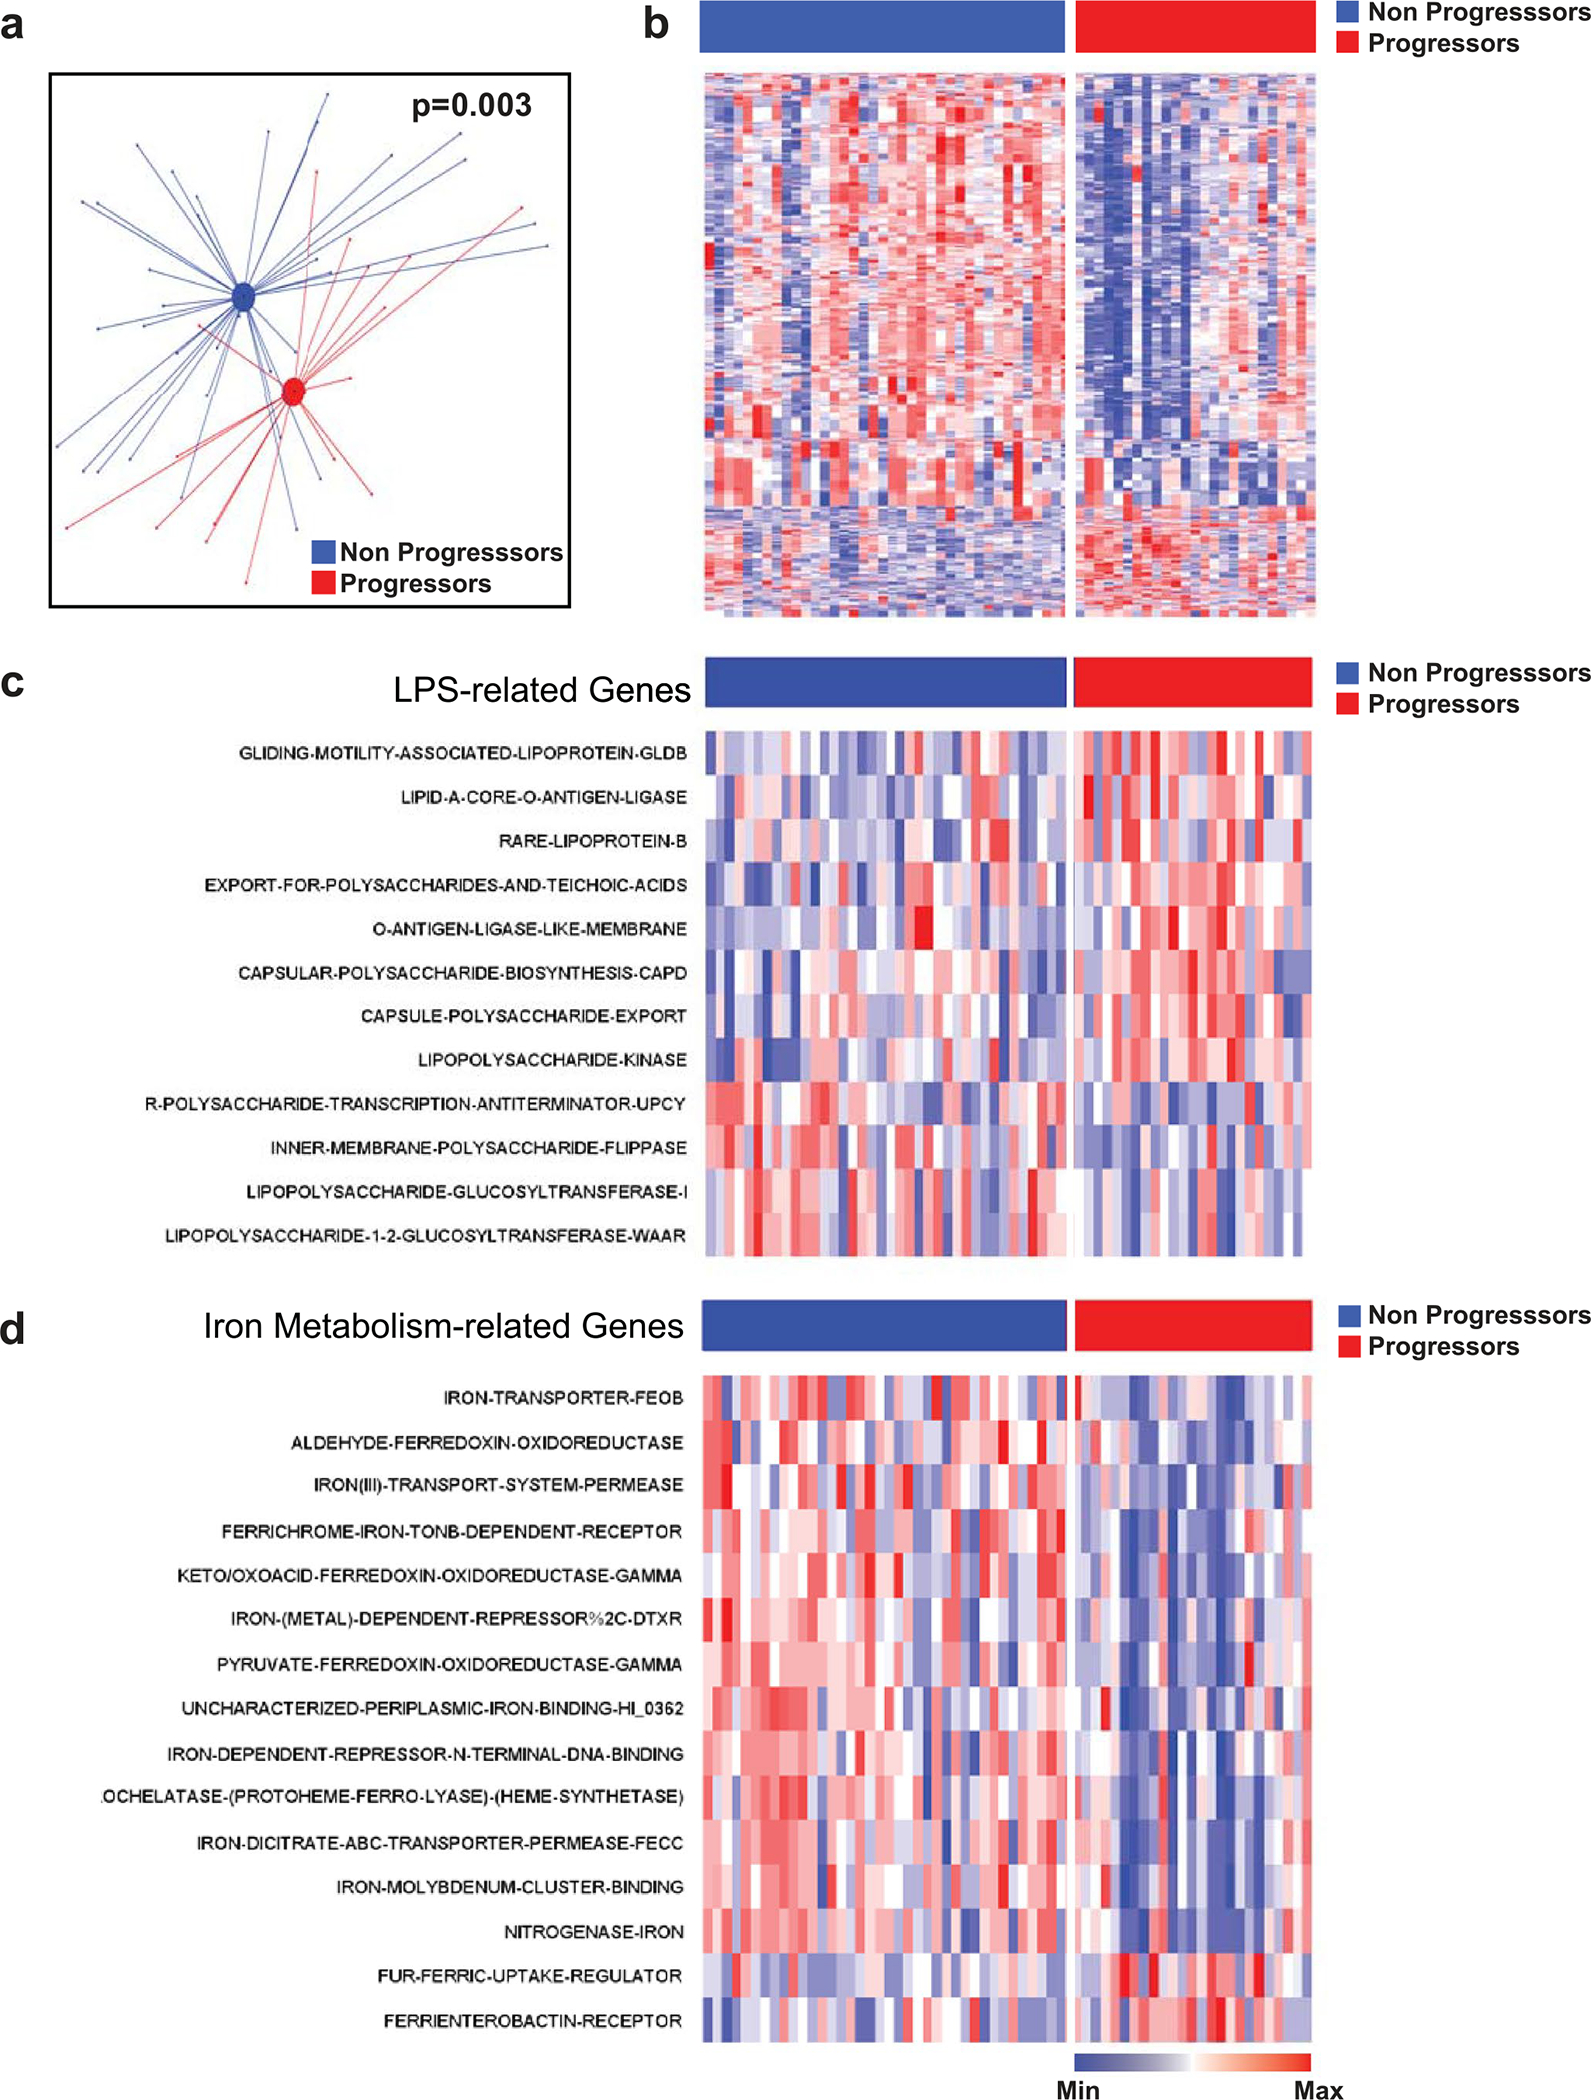
a. t-distributed uniform manifold approximation and projection (t-UMAP) plot depicting genetic differences of gut microbiomes between non-progressors (NPs; blue) and progressors (Ps; red) at time of maximal difference from start of therapy (10 months). Filled circles represent centroids, with connecting lines corresponding to samples from each group. Two-tailed p-value was calculated using PERMANOVA. b. Metagenomic shotgun sequencing of fecal microbiota samples identifies differentially abundant genes in Ps vs. NPs at 10 months from start of therapy. Heatmap shows differentially abundant genes identified by metagenomic shotgun sequencing (FDR < 0.2 and FC > 1.5). Columns denote patients grouped by progression status and clustered within P/NP groups; rows denote bacterial genes significantly upregulated (red) or downregulated (blue) in Ps versus NPs. c and d. Select genes involved in representative microbial processes of lipopolysaccharide (LPS) processing (c) and iron metabolism (d).
Extended Data Fig. 6 |. Metagenomic sequencing identifies distinct taxa associated with various immune-related adverse events in PD-1-treated melanoma patients in Pittsburgh early cohort.
Heatmap depicts metagenomic compositional differences between patients with a given immune-related adverse event (irAE) as compared to patients with other irAEs using scaled fold differences (high – red; low – blue) in abundances of specific bacteria. Values in individual cells represent unadjusted p-values calculated using two-tailed Mann-Whitney U test, with p-values <0.1 displayed within cells. Bar plot to left of heatmap indicates extent of association between corresponding taxa and progression-free survival probability [scaled hazard ratio (HR)], with Storey q-values <0.1 displayed within cells (from Supplementary Tables 4 and 5).
Extended Data Fig. 7 |. Reanalysis of four previously published individual cohorts using the same bioinformatic pipeline.

a. Analysis of α-diversity from five PD-1-treated melanoma patient cohorts (n = 185), including the Pittsburgh early sample cohort (n = 63), using either shotgun metagenomic (5 cohorts, red) or 16S rRNA gene amplicon (4 cohorts, black) sequencing. Details of each individual cohort are summarized in Supplementary Table 3. Forest plots depict α-diversity-based association tests including inverse Simpson, Shannon, and observed operational taxonomic units. Within each fixed-effect plot, names of each cohort are shown on a separate line, while log odds ratio of α-diversity (squares, size proportional to sample size used in meta-analysis) and associated 95% confidence intervals (bars) are shown, along with the dotted vertical line of no effect. The p-values reported for each cohort are two-tailed p values computed from the z statistic. To control for unobserved heterogeneity, we separately evaluated α-diversity using a random effects model on both pooled shotgun and 16S sequencing data from the 5 cohorts and performed I2 test for heterogeneity as shown. The p-value reported for heterogeneity is a one-tailed Cochran’s Q-test. b. t-distributed uniform manifold approximation and projection (t-UMAP) plot before (left) and after (right) correction for study-related batch effect using ComBat R package for all cohorts together including Pittsburgh cohort. P-values were calculated using PERMANOVA. c. t-UMAP plot of batch-corrected pooled metagenomic sequencing data from five separate cohorts of melanoma patients treated with anti-PD-1 therapy depicting fecal microbiota compositional differences with two-tailed p-value calculated using PERMANOVA between responders (Rs) and non-responders (NRs). d. Heatmap of differentially (p-values were calculated using non-parametric two-tailed Mann-Whitney U test) abundant gut microbiome taxa (p < 0.05, FC > 2) evaluated with shotgun sequencing in five melanoma patient cohorts, including Pittsburgh early sample cohort. Study-related batch effect was removed using ComBat R package. Response to therapy in published cohorts was determined as described in each study (Supplementary Table 3). Response to therapy in the Pittsburgh early sample cohort was defined as non-progression at 10 months after initiation of treatment. Columns represent patients grouped by clinical response and clustered within R/NR groups; rows depict bacterial taxa enriched (black) or depleted (red) in Rs versus NRs clustered based on gut microbiota composition.
Extended Data Fig. 8 |. Meta-analysis of all cohorts using random effects model identifies organisms differentially enriched in melanoma patients treated with anti-PD-1 therapy in separate cohorts by response status.
a. Random effect model meta-analysis of differentially abundant bacteria between responders (Rs) and non-responders (NRs) from five cohorts (n = 185) including Pittsburgh early sample cohort (n = 63) using shotgun metagenomic sequencing. All significant bacterial taxa enriched in Rs and NRs are shown. b. Forest plots depict association of representative bacterial species with response to anti-PD-1 therapy. Within each plot, names of various cohorts are shown on separate lines, while Hedge’s g (squares, standardized mean differences, size proportional to sample size) and associated 95% confidence intervals (bars) are shown, along with the dotted vertical line of no effect. To control for unobserved heterogeneity, we separately evaluated Hedge’s g using random effect model on metagenomic data and performed I2 test for heterogeneity as shown. P-values were calculated using random effect model.
Extended Data Fig. 9 |. Expression levels of selected taxa in different American Gut Project enteric microbiotypes.
t-distributed stochastic neighbor embedding (t-SNE) plots depicting American Gut Project (AGP) dataset with visualization of abundances of select taxa (blue – low; red – high).
Extended Data Fig. 10 |. Geographic differences determine sampling variability between cohorts.
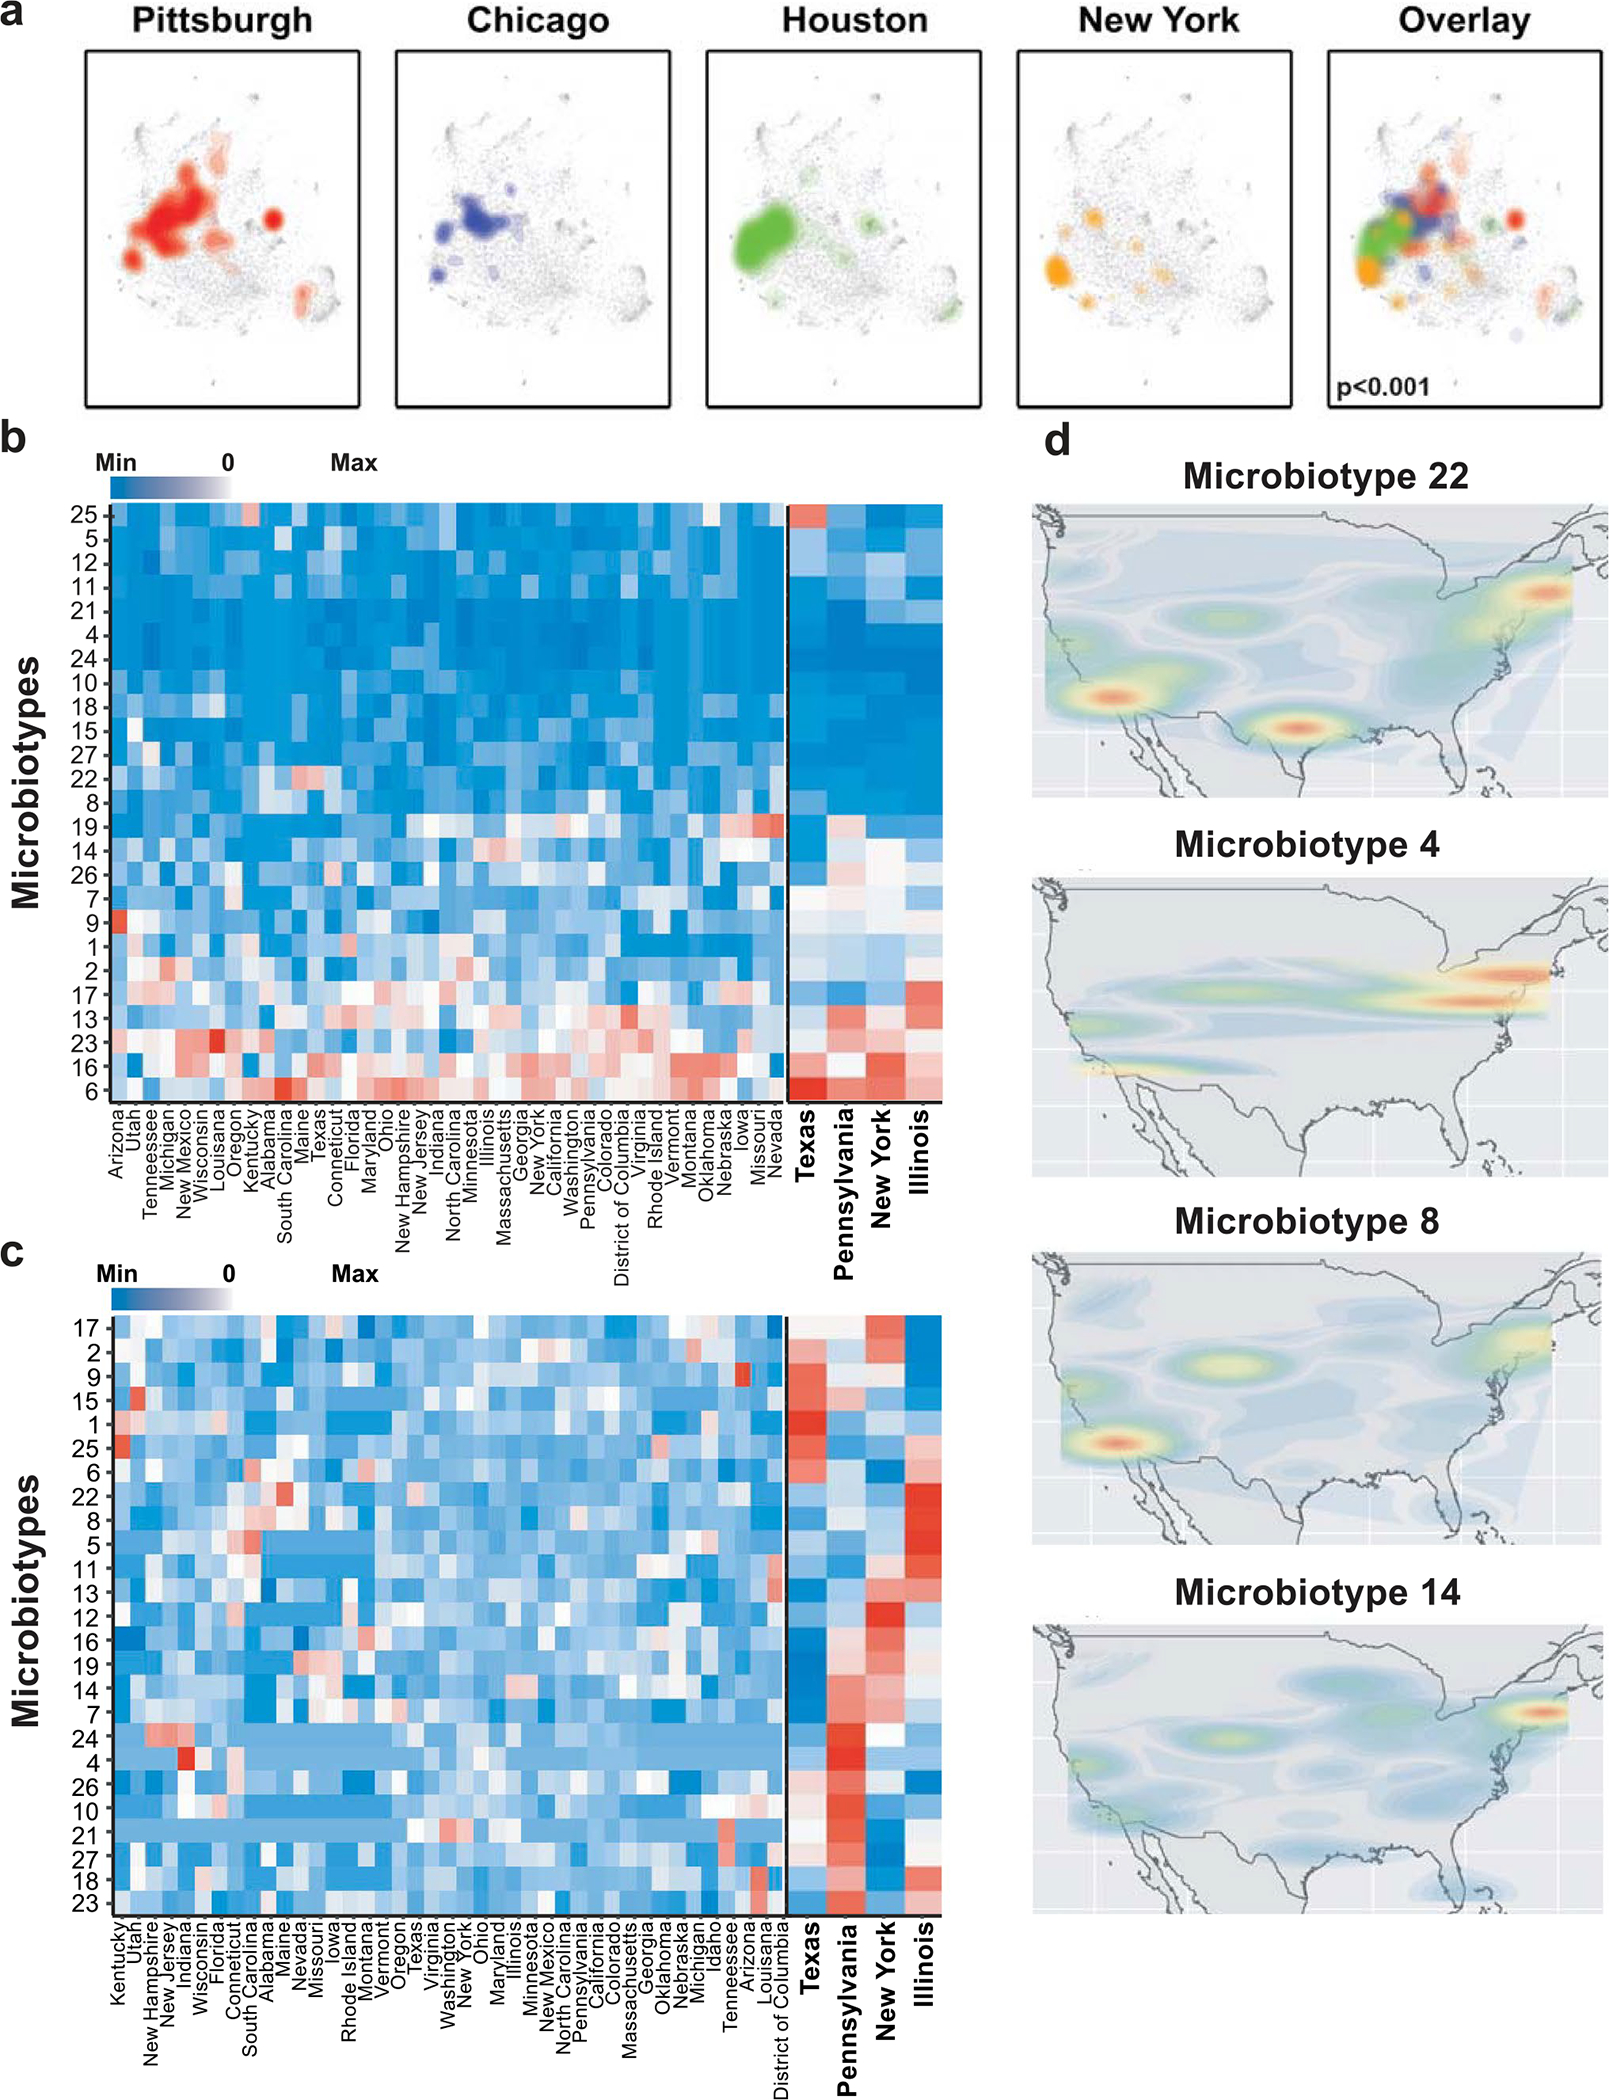
a. t-distributed stochastic neighbor embedding (t-SNE) plots depicting mapping of individual melanoma patient cohorts to American Gut Project (AGP) dataset revealed distinct compositional differences between them. Each cohort is represented by a different color that is maintained in the overlay. Colors in the overlay are semi-translucent and were stratified starting from the Pittsburgh to New York cohort. Gut microbiota compositions of the different cohorts were significantly different (PERMANOVA, two-tailed p < 0.001). b. and c. Heatmaps represent scaled abundances of each enteric microbiotypes across 28 states from which AGP data were available on the left, with the four states from which anti-PD-1-treated melanoma cohorts originated separately on the right using three individuals per county per cluster as a cutoff. Data were scaled by number of individuals per state and per cluster and are depicted in relation to the 28 states that met the cutoff and in relation to the four states from which the four studied cohorts originated. b. Heatmaps are (b) scaled only by number of samples from state (to reflect local abundance of microbiotypes) or (c) scaled by both number of samples per state and by number of samples per microbiotype (to reflect distribution of different microbiotypes across the US). d. Geographic representation in the US of four representative enteric microbiotypes, with most uneven distribution between four states (right panel in c).
Supplementary Material
Acknowledgements
We acknowledge all patients and families affected by metastatic melanoma. We acknowledge J. Wargo for providing unpublished metadata of the Houston melanoma patient cohort. This work was supported in part by the Intramural Research Program of the NIH, NCI, Center for Cancer Research. D.D. is supported by the Melanoma Breakthrough Foundation Breakthrough Consortium. H.M.Z. is supported by the NIH/NCI (R01 CA228181 AND R01 CA222203) and the James W. and Frances G. McGlothlin Chair in Melanoma Immunotherapy Research. M.V. was supported by an Irvington postdoctoral fellowship from the Cancer Research Institute. Work of the University of Pittsburgh Medical Center HCC Microbiome Shared Facility and Cytometry Facility is supported by the NIH NCI Comprehensive Cancer Center Support Core grant (P30 CA047904). This research was supported in part by the University of Pittsburgh Center for Research Computing and Unified Flow Cytometry Core of the University of Pittsburgh’s Department of Immunology through the resources provided.
Footnotes
Competing interests
D.D. reports the following disclosures: Arcus, Bristol-Myers Squibb, Checkmate Pharmaceuticals, CellSight Technologies, Merck, GlaxoSmithKline/Tesaro (research support); Array Biopharma, Checkmate Pharmaceuticals, Finch, Incyte, Immunocore, Merck; Shionogi (consulting); and Vedanta Biosciences (scientific advisory board). H.M.Z. reports the following disclosures: Bristol-Myers Squibb, Checkmate Pharmaceuticals, GlaxoSmithKline (research support); Bristol-Myers Squibb, Checkmate Pharmaceuticals, GlaxoSmithKline, Vedanta (consulting). D.D., H.M.Z., J.A.M., R.R.R., G.T. and A.K.D. are inventors on a patent application (US patent no. 63/208,719) submitted by the University of Pittsburgh that covers methods to enhance checkpoint blockade therapy by the microbiome. The other authors declare no competing interests.
Reporting Summary.
Further information on research design is available in the Nature Research Reporting Summary linked to this article.
Code availability
All codes used for shotgun sequencing analysis can be found within the in-house JAMS_BW package, version 1.5.7, publicly available on GitHub (https://github.com/johnmcculloch/JAMS_BW/). GSEA analysis was done in R using fgsea package 1.19.4. Codes for transkingdom network analysis are available at https://github.com/richrr/TransNetDemo/. Additional codes used are part of the packages mentioned in the text or can be found on GitHub at https://github.com/trinchierilab/microbiotapd1melanoma2021/.
Additional information
Extended data is available for this paper at https://doi.org/10.1038/s41591-022-01698-2.
Supplementary information The online version contains supplementary material available at https://doi.org/10.1038/s41591-022-01698-2.
Peer review information Nature Medicine thanks R. Dummer, A. Bhatt and the other, anonymous, reviewer(s) for their contribution to the peer review of this work. Editor Recognition Statement: Javier Carmona and Saheli Sadanand are the primary editors on this article and managed its editorial process and peer review in collaboration with the rest of the editorial team.
Reprints and permissions information is available at www.nature.com/reprints.
Data availability
The corresponding authors will comply with all requests for raw and analyzed data and materials after verification whether the request is subject to any patients’ confidentiality obligation. Patient-related data not included in the paper were generated as part of clinical trials and might be subject to patient confidentiality. All sequencing (human and microbiome) data and de-identified metadata that support the findings have been deposited in NCBI databases and are all accessible via BioProject accession no. PRJNA762360. AGP data are available at the ENA database (https://www.ebi.ac.uk/) under accession no. PRJEB11419. Access to publicly available sequencing data of the other cohorts analyzed in this study was obtained through BioProject accession nos. PRJNA399742 (Chicago), PRJNA541981 (New York), PRJNA397906 (Dallas) and PRJEB22893 (Houston). Source data are provided with this paper. The Sequence Read Archive accession numbers for each sample from each of these cohorts is the stated name of the sample on the spreadsheet in the source data. All other data are provided within the paper and its Supplementary Information files.
References
- 1.Sivan A et al. Commensal Bifidobacterium promotes antitumor immunity and facilitates anti-PD-L1 efficacy. Science 350, 1084–1089 (2015). [DOI] [PMC free article] [PubMed] [Google Scholar]
- 2.Vetizou M et al. Anticancer immunotherapy by CTLA-4 blockade relies on the gut microbiota. Science 350, 1079–1084 (2015). [DOI] [PMC free article] [PubMed] [Google Scholar]
- 3.Dzutsev A, Goldszmid RS, Viaud S, Zitvogel L & Trinchieri G The role of the microbiota in inflammation, carcinogenesis, and cancer therapy. Eur. J. Immunol. 45, 17–31 (2015). [DOI] [PubMed] [Google Scholar]
- 4.Gopalakrishnan V et al. Gut microbiome modulates response to anti-PD-1 immunotherapy in melanoma patients. Science 359, 97–103 (2018). [DOI] [PMC free article] [PubMed] [Google Scholar]
- 5.Matson V et al. The commensal microbiome is associated with anti-PD-1 efficacy in metastatic melanoma patients. Science 359, 104–108 (2018). [DOI] [PMC free article] [PubMed] [Google Scholar]
- 6.Routy B et al. Gut microbiome influences efficacy of PD-1-based immunotherapy against epithelial tumors. Science 359, 91–97 (2018). [DOI] [PubMed] [Google Scholar]
- 7.Chaput N et al. Baseline gut microbiota predicts clinical response and colitis in metastatic melanoma patients treated with ipilimumab. Ann. Oncol. 28, 1368–1379 (2017). [DOI] [PubMed] [Google Scholar]
- 8.Dubin K et al. Intestinal microbiome analyses identify melanoma patients at risk for checkpoint-blockade-induced colitis. Nat. Commun. 7, 10391 (2016). [DOI] [PMC free article] [PubMed] [Google Scholar]
- 9.Andrews MC et al. Gut microbiota signatures are associated with toxicity to combined CTLA-4 and PD-1 blockade. Nat. Med. 27, 1432–1441 (2021). [DOI] [PMC free article] [PubMed] [Google Scholar]
- 10.Baruch EN et al. Fecal microbiota transplant promotes response in immunotherapy-refractory melanoma patients. Science 371, 602–609 (2021). [DOI] [PubMed] [Google Scholar]
- 11.Davar D et al. Fecal microbiota transplant overcomes resistance to anti-PD-1 therapy in melanoma patients. Science 371, 595–602 (2021). [DOI] [PMC free article] [PubMed] [Google Scholar]
- 12.Frankel AE et al. Metagenomic shotgun sequencing and unbiased metabolomic profiling identify specific human gut microbiota and metabolites associated with immune checkpoint therapy efficacy in melanoma patients. Neoplasia 19, 848–855 (2017). [DOI] [PMC free article] [PubMed] [Google Scholar]
- 13.Peters BA et al. Relating the gut metagenome and metatranscriptome to immunotherapy responses in melanoma patients. Genome Med. 11, 61 (2019). [DOI] [PMC free article] [PubMed] [Google Scholar]
- 14.Gharaibeh RZ & Jobin C Microbiota and cancer immunotherapy: in search of microbial signals. Gut 68, 385–388 (2019). [DOI] [PMC free article] [PubMed] [Google Scholar]
- 15.Limeta A, Ji B, Levin M, Gatto F & Nielsen J Meta-analysis of the gut microbiota in predicting response to cancer immunotherapy in metastatic melanoma. JCI Insight 5, e140940 (2020). [DOI] [PMC free article] [PubMed] [Google Scholar]
- 16.Shaikh FY et al. A uniform computational approach improved on existing pipelines to reveal microbiome biomarkers of non-response to immune checkpoint inhibitors. Clin. Cancer Res. 27, 2571–2583 (2021). [DOI] [PMC free article] [PubMed] [Google Scholar]
- 17.Byrd AL et al. Gut microbiome stability and dynamics in healthy donors and patients with non-gastrointestinal cancers. J. Exp. Med. 218, e20200606 (2021). [DOI] [PMC free article] [PubMed] [Google Scholar]
- 18.Derosa L et al. Gut bacteria composition drives primary resistance to cancer immunotherapy in renal cell carcinoma patients. Eur. Urol. 78, 195–206 (2020). [DOI] [PubMed] [Google Scholar]
- 19.Viaud S et al. The intestinal microbiota modulates the anticancer immune effects of cyclophosphamide. Science 342, 971–976 (2013). [DOI] [PMC free article] [PubMed] [Google Scholar]
- 20.Ogluszka M, Orzechowska M, Jedroszka D, Witas P & Bednarek AK Evaluate Cutpoints: adaptable continuous data distribution system for determining survival in Kaplan–Meier estimator. Comput. Methods Prog. Biomed. 177, 133–139 (2019). [DOI] [PubMed] [Google Scholar]
- 21.Capone M et al. Baseline neutrophil-to-lymphocyte ratio (NLR) and derived NLR could predict overall survival in patients with advanced melanoma treated with nivolumab. J. Immunother. Cancer 6, 74 (2018). [DOI] [PMC free article] [PubMed] [Google Scholar]
- 22.Valero C et al. Pretreatment neutrophil-to-lymphocyte ratio and mutational burden as biomarkers of tumor response to immune checkpoint inhibitors. Nat. Commun. 12, 729 (2021). [DOI] [PMC free article] [PubMed] [Google Scholar]
- 23.Ascierto PA et al. Proteomic test for anti-PD-1 checkpoint blockade treatment of metastatic melanoma with and without BRAF mutations. J. Immunother. Cancer 7, 91 (2019). [DOI] [PMC free article] [PubMed] [Google Scholar]
- 24.Yang AP, Liu JP, Tao WQ & Li HM The diagnostic and predictive role of NLR, d-NLR and PLR in COVID-19 patients. Int. Immunopharmacol. 84, 106504 (2020). [DOI] [PMC free article] [PubMed] [Google Scholar]
- 25.Knight JM et al. Noninvasive analysis of intestinal development in preterm and term infants using RNA-sequencing. Sci. Rep. 4, 5453 (2014). [DOI] [PMC free article] [PubMed] [Google Scholar]
- 26.Whitfield-Cargile CM et al. The noninvasive exfoliated transcriptome (exfoliome) reflects the tissue-level transcriptome in a mouse model of NSAID enteropathy. Sci. Rep. 7, 14687 (2017). [DOI] [PMC free article] [PubMed] [Google Scholar]
- 27.Rodrigues RR, Shulzhenko N & Morgun A Transkingdom networks: a systems biology approach to identify causal members of host–microbiota interactions. Methods Mol. Biol. 1849, 227–242 (2018). [DOI] [PMC free article] [PubMed] [Google Scholar]
- 28.Yambartsev A et al. Unexpected links reflect the noise in networks. Biol. Direct 11, 52 (2016). [DOI] [PMC free article] [PubMed] [Google Scholar]
- 29.Das S et al. Immune-related adverse events and immune checkpoint inhibitor efficacy in patients with gastrointestinal cancer with food and drug administration-approved indications for immunotherapy. Oncologist 25, 669–679 (2020). [DOI] [PMC free article] [PubMed] [Google Scholar]
- 30.Matsuoka H et al. Correlation between immune-related adverse events and prognosis in patients with various cancers treated with anti PD-1 antibody. BMC Cancer 20, 656 (2020). [DOI] [PMC free article] [PubMed] [Google Scholar]
- 31.Suo A et al. Anti-PD-1-induced immune-related adverse events and survival outcomes in advanced melanoma. Oncologist 25, 438–446 (2020). [DOI] [PMC free article] [PubMed] [Google Scholar]
- 32.Horvath A et al. Biomarkers for oralization during long-term proton pump inhibitor therapy predict survival in cirrhosis. Sci. Rep. 9, 12000 (2019). [DOI] [PMC free article] [PubMed] [Google Scholar]
- 33.Cortellini A et al. Integrated analysis of concomitant medications and oncological outcomes from PD-1/PD-L1 checkpoint inhibitors in clinical practice. J. Immunother. Cancer 8, e001361 (2020). [DOI] [PMC free article] [PubMed] [Google Scholar]
- 34.Stacy A et al. Infection trains the host for microbiota-enhanced resistance to pathogens. Cell 184, 615–627 (2021). [DOI] [PMC free article] [PubMed] [Google Scholar]
- 35.Kelsey CM et al. Gut microbiota composition is associated with newborn functional brain connectivity and behavioral temperament. Brain Behav. Immun. 91, 472–486 (2021). [DOI] [PubMed] [Google Scholar]
- 36.Benito M et al. Adjustment of systematic microarray data biases. Bioinformatics 20, 105–114 (2004). [DOI] [PubMed] [Google Scholar]
- 37.Lazar C et al. Batch effect removal methods for microarray gene expression data integration: a survey. Brief. Bioinform. 14, 469–490 (2013). [DOI] [PubMed] [Google Scholar]
- 38.Segata N et al. Metagenomic biomarker discovery and explanation. Genome Biol. 12, R60 (2011). [DOI] [PMC free article] [PubMed] [Google Scholar]
- 39.Subramanian A et al. Gene-set enrichment analysis: a knowledge-based approach for interpreting genome-wide expression profiles. Proc. Natl Acad. Sci. USA 102, 15545–15550 (2005). [DOI] [PMC free article] [PubMed] [Google Scholar]
- 40.Kang DD, Froula J, Egan R & Wang Z MetaBAT, an efficient tool for accurately reconstructing single genomes from complex microbial communities. PeerJ 3, e1165 (2015). [DOI] [PMC free article] [PubMed] [Google Scholar]
- 41.Kang DD et al. MetaBAT 2: an adaptive binning algorithm for robust and efficient genome reconstruction from metagenome assemblies. PeerJ 7, e7359 (2019). [DOI] [PMC free article] [PubMed] [Google Scholar]
- 42.Balomenou S et al. Distinct functions of polysaccharide deacetylases in cell shape, neutral polysaccharide synthesis and virulence of Bacillus anthracis. Mol. Microbiol. 87, 867–883 (2013). [DOI] [PubMed] [Google Scholar]
- 43.Bessman NJ et al. Dendritic cell-derived hepcidin sequesters iron from the microbiota to promote mucosal healing. Science 368, 186–189 (2020). [DOI] [PMC free article] [PubMed] [Google Scholar]
- 44.Kjer-Nielsen L et al. MR1 presents microbial vitamin B metabolites to MAIT cells. Nature 491, 717–723 (2012). [DOI] [PubMed] [Google Scholar]
- 45.Fan S et al. Cloning, characterization and production of three alpha-l-fucosidases from Clostridium perfringens ATCC 13124. J. Basic Microbiol. 56, 347–357 (2016). [DOI] [PubMed] [Google Scholar]
- 46.Wright DP, Rosendale DI & Robertson AM Prevotella enzymes involved in mucin oligosaccharide degradation and evidence for a small operon of genes expressed during growth on mucin. FEMS Microbiol. Lett. 190, 73–79 (2000). [DOI] [PubMed] [Google Scholar]
- 47.Arumugam M et al. Enterotypes of the human gut microbiome. Nature 473, 174–180 (2011). [DOI] [PMC free article] [PubMed] [Google Scholar]
- 48.Brooks AW, Priya S, Blekhman R & Bordenstein SR Gut microbiota diversity across ethnicities in the United States. PLoS Biol. 16, e2006842 (2018). [DOI] [PMC free article] [PubMed] [Google Scholar]
- 49.Dwiyanto J et al. Ethnicity influences the gut microbiota of individuals sharing a geographical location: a cross-sectional study from a middle-income country. Sci. Rep. 11, 2618 (2021). [DOI] [PMC free article] [PubMed] [Google Scholar]
- 50.Gorvitovskaia A, Holmes SP & Huse SM Interpreting Prevotella and Bacteroides as biomarkers of diet and lifestyle. Microbiome 4, 15 (2016). [DOI] [PMC free article] [PubMed] [Google Scholar]
- 51.Knights D et al. Rethinking ‘enterotypes’. Cell Host Microbe 16, 433–437 (2014). [DOI] [PMC free article] [PubMed] [Google Scholar]
- 52.Zhang R, Walker AR & Datta S Unraveling city-specific signature and identifying sample origin locations for the data from CAMDA MetaSUB challenge. Biol. Direct 16, 1 (2021). [DOI] [PMC free article] [PubMed] [Google Scholar]
- 53.McDonald D et al. American Gut: an open platform for citizen science microbiome research. mSystems 3, e00031–18 (2018). [DOI] [PMC free article] [PubMed] [Google Scholar]
- 54.Levine JH et al. Data-driven phenotypic dissection of aml reveals progenitor-like cells that correlate with prognosis. Cell 162, 184–197 (2015). [DOI] [PMC free article] [PubMed] [Google Scholar]
- 55.Costea PI et al. Enterotypes in the landscape of gut microbial community composition. Nat. Microbiol. 3, 8–16 (2018). [DOI] [PMC free article] [PubMed] [Google Scholar]
- 56.He Y et al. Regional variation limits applications of healthy gut microbiome reference ranges and disease models. Nat. Med. 24, 1532–1535 (2018). [DOI] [PubMed] [Google Scholar]
- 57.Luke NR et al. Identification and characterization of a glycosyltransferase involved in Acinetobacter baumannii lipopolysaccharide core biosynthesis. Infect. Immun. 78, 2017–2023 (2010). [DOI] [PMC free article] [PubMed] [Google Scholar]
- 58.Freeman-Keller M et al. Nivolumab in resected and unresectable metastatic melanoma: characteristics of immune-related adverse events and association with outcomes. Clin. Cancer Res. 22, 886–894 (2016). [DOI] [PMC free article] [PubMed] [Google Scholar]
- 59.Weber JS et al. Safety profile of nivolumab monotherapy: a pooled analysis of patients with advanced melanoma. J. Clin. Oncol. 35, 785–792 (2017). [DOI] [PubMed] [Google Scholar]
- 60.Weber JS, Kahler KC & Hauschild A Management of immune-related adverse events and kinetics of response with ipilimumab. J. Clin. Oncol. 30, 2691–2697 (2012). [DOI] [PubMed] [Google Scholar]
- 61.Asnicar F et al. Microbiome connections with host metabolism and habitual diet from 1,098 deeply phenotyped individuals. Nat. Med. 27, 321–332 (2021). [DOI] [PMC free article] [PubMed] [Google Scholar]
- 62.Gevers D et al. The Human Microbiome Project: a community resource for the healthy human microbiome. PLoS Biol. 10, e1001377 (2012). [DOI] [PMC free article] [PubMed] [Google Scholar]
- 63.Human Microbiome Project Consortium. A framework for human microbiome research. Nature 486, 215–221 (2012). [DOI] [PMC free article] [PubMed] [Google Scholar]
- 64.Human Microbiome Project Consortium. Structure, function and diversity of the healthy human microbiome. Nature 486, 207–214 (2012). [DOI] [PMC free article] [PubMed] [Google Scholar]
- 65.Amir A et al. Correcting for microbial blooms in fecal samples during room-temperature shipping. mSystems 2, e00199–16 (2017). [DOI] [PMC free article] [PubMed] [Google Scholar]
- 66.Davar D et al. Phase Ib/II study of pembrolizumab and pegylated-interferon alfa-2b in advanced melanoma. J. Clin. Oncol. 36, JCO1800632 (2018). [DOI] [PMC free article] [PubMed] [Google Scholar]
- 67.Eisenhauer EA et al. New response evaluation criteria in solid tumours: revised RECIST guideline (version 1.1). Eur. J. Cancer 45, 228–247 (2009). [DOI] [PubMed] [Google Scholar]
- 68.Bolger AM, Lohse M & Usadel B Trimmomatic: a flexible trimmer for Illumina sequence data. Bioinformatics 30, 2114–2120 (2014). [DOI] [PMC free article] [PubMed] [Google Scholar]
- 69.Langmead B & Salzberg SL Fast gapped-read alignment with Bowtie 2. Nat. Methods 9, 357–359 (2012). [DOI] [PMC free article] [PubMed] [Google Scholar]
- 70.Li D, Liu CM, Luo R, Sadakane K & Lam TW MEGAHIT: an ultra-fast single-node solution for large and complex metagenomics assembly via succinct de Bruijn graph. Bioinformatics 31, 1674–1676 (2015). [DOI] [PubMed] [Google Scholar]
- 71.Li D et al. MEGAHIT v1.0: a fast and scalable metagenome assembler driven by advanced methodologies and community practices. Methods 102, 3–11 (2016). [DOI] [PubMed] [Google Scholar]
- 72.Wood DE, Lu J & Langmead B Improved metagenomic analysis with Kraken 2. Genome Biol. 20, 257 (2019). [DOI] [PMC free article] [PubMed] [Google Scholar]
- 73.Seemann T Prokka: rapid prokaryotic genome annotation. Bioinformatics 30, 2068–2069 (2014). [DOI] [PubMed] [Google Scholar]
- 74.Gu Z, Eils R & Schlesner M Complex heat maps reveal patterns and correlations in multidimensional genomic data. Bioinformatics 32, 2847–2849 (2016). [DOI] [PubMed] [Google Scholar]
- 75.Shannon P et al. Cytoscape: a software environment for integrated models of biomolecular interaction networks. Genome Res. 13, 2498–2504 (2003). [DOI] [PMC free article] [PubMed] [Google Scholar]
- 76.Haratani K et al. Association of immune-related adverse events with nivolumab efficacy in non-small-cell lung cancer. JAMA Oncol. 4, 374–378 (2018). [DOI] [PMC free article] [PubMed] [Google Scholar]
- 77.Robert C et al. Long-term safety of pembrolizumab monotherapy and relationship with clinical outcome: a landmark analysis in patients with advanced melanoma. Eur. J. Cancer 144, 182–191 (2020). [DOI] [PMC free article] [PubMed] [Google Scholar]
- 78.Johnson WE, Li C & Rabinovic A Adjusting batch effects in microarray expression data using empirical Bayes methods. Biostatistics 8, 118–127 (2007). [DOI] [PubMed] [Google Scholar]
- 79.Ho TK Random decision forests. in Proceedings of the Third International Conference on Document Analysis and Recognition, vol. 1, 278–282 (IEEE Computer Society, 1995). [Google Scholar]
- 80.Boser BE, Guyon IM & Vapnik VN A training algorithm for optimal margin classifiers. in Proceedings of the Fifth Annual Workshop on Computational Learning Theory, 144–152 (Association for Computing Machinery, 1992). [Google Scholar]
- 81.McCullagh P & Nelder JA & Generalized Linear Models (Chapman and Hall, 1989). [Google Scholar]
Associated Data
This section collects any data citations, data availability statements, or supplementary materials included in this article.
Supplementary Materials
Data Availability Statement
The corresponding authors will comply with all requests for raw and analyzed data and materials after verification whether the request is subject to any patients’ confidentiality obligation. Patient-related data not included in the paper were generated as part of clinical trials and might be subject to patient confidentiality. All sequencing (human and microbiome) data and de-identified metadata that support the findings have been deposited in NCBI databases and are all accessible via BioProject accession no. PRJNA762360. AGP data are available at the ENA database (https://www.ebi.ac.uk/) under accession no. PRJEB11419. Access to publicly available sequencing data of the other cohorts analyzed in this study was obtained through BioProject accession nos. PRJNA399742 (Chicago), PRJNA541981 (New York), PRJNA397906 (Dallas) and PRJEB22893 (Houston). Source data are provided with this paper. The Sequence Read Archive accession numbers for each sample from each of these cohorts is the stated name of the sample on the spreadsheet in the source data. All other data are provided within the paper and its Supplementary Information files.