

Abstract
Accurate and reproducible color capture is vital in medical photography. Camera distance and angle are particularly important as they are highly variable in a clinical setting. To account for variability in illumination, camera technology, and geometric effects, color standards are often used for color correction. To explore how geometry affects color, we quantified the change in CIELAB color value of a color standard for diverse skin tones at varying smartphone camera distances and angles. Whereas both chromaticity (a* and b*) and lightness (L*) were affected by angle, distance only affected L* (standard error of measurement, SEM > 1 CIELAB unit). Flash usage did not generally reduce distance and angle associated variability. Compared to compressed (JPG) format, raw (DNG) images had decreased median variability across different distances and angles. These findings suggest that in medical photography, inconsistent camera distance and angle can increase variability in photographed skin appearance over time.
Keywords: color calibration, color reference, color standard, skin imaging, teledermatology
Graphical Abstract

1 |. INTRODUCTION
The capture of reliable medical photographs has become increasingly important with the rise of telemedicine [1]. In particular, accurate capture of color can be critical for clinical decision-making. Color in skin photos can aid in evaluating chronic wounds [2] and psoriasis [3], diagnosing nodular melanoma [4], tracking chronic graft-versus-host disease [5], as well as in assessing the level of erythema in dogs with atopic dermatitis [6]. In non-skin photography, color analysis can estimate blood hemoglobin content in inner eyelids [7] and evaluate tongue [8] and urine appearance [9]. To acquire reliable medical photographs, it is important to understand what affects color and to develop strategies for correcting color.
Color is affected by a variety of factors including camera technology, illumination spectra [10], surface curvature [11], as well as camera distance and angle [12]. To compensate for this variability, color standards are often included in photographs for color correction [2, 3, 13, 14] or device calibration [15, 16]. The standards often contain a wide array of colors, such as the commonly used Color-Checker Classic by Xrite, and are often selected based on the application. For example, the Pantone SkinTone Guide is a skin tone-based color standard that is specialized to include a diverse range of skin tones. Each color within a standard has known color values under standard lighting conditions, for example, under D65 (~6500 K) or D50 (~5000 K) light specified by the international commission on illumination (CIE). In photographs captured under the same D65/D50 illumination, color standards can be used to correct color by reducing the difference in color between the captured values and the known values through post-processing image analysis. Color standards can also be used to reduce variability in photographs captured under different illumination or to shift colors to appear as they would under D65/D50 illumination.
Although widely used, color correction has limitations. In a typical color correction, each image pixel is assumed to be equally affected by all factors that alter color. The implication of this is that image will not be properly corrected if the shift in color is not constant throughout the captured area. For example, if uneven lighting makes the standard appear yellower than the rest of the image, the rest of the image will be improperly corrected. Because color standards cannot always accurately correct color due to uneven lighting or geometrical factors, such as differing camera distance and angle, it is important to understand the extent of these effects on color.
Prior studies have identified factors that affect color in photographs [10–12], but quantitative evaluations of these effects remain to be investigated. Camera distance and angle are of particular interest, as they are highly variable in a fast-paced clinical setting. Here we aimed to quantify the change in captured color values of swatches from a color standard of diverse skin tones when imaged at different camera distances and angles. Additionally, we aimed to investigate the effect of illumination type and flash on change in color across various angles and distances. By quantifying the effects of distance, angle, and illumination, these assessments will aid in the development of clear guidelines for medical photography.
2 |. METHODS
2.1 |. Color palette design
To mimic taking photographs of human skin, we selected swatches of the Pantone Skintone Guide. Of the standard deck comprising 110 swatches, we sought to select nine swatches of diverse skin tones. First, we partitioned the set of 110 swatches into nine groups by K-means clustering. Second, we selected the swatches closest to each of the group’s centroids, resulting in the following swatches: 2Y07, 1Y03, 2R14, 3R15, 1Y11, 1R13, 2Y10, 4R08, and 4R05. We cut a 3 × 4 cm section of each swatch from the 17 × 4 cm deck and attached it to a white polyester backdrop (Figure 1). All swatches came from the same brand-new Pantone deck and were made of the same material. The same area of the larger swatch was cut to make the smaller 3 × 4 cm sections.
FIGURE 1.
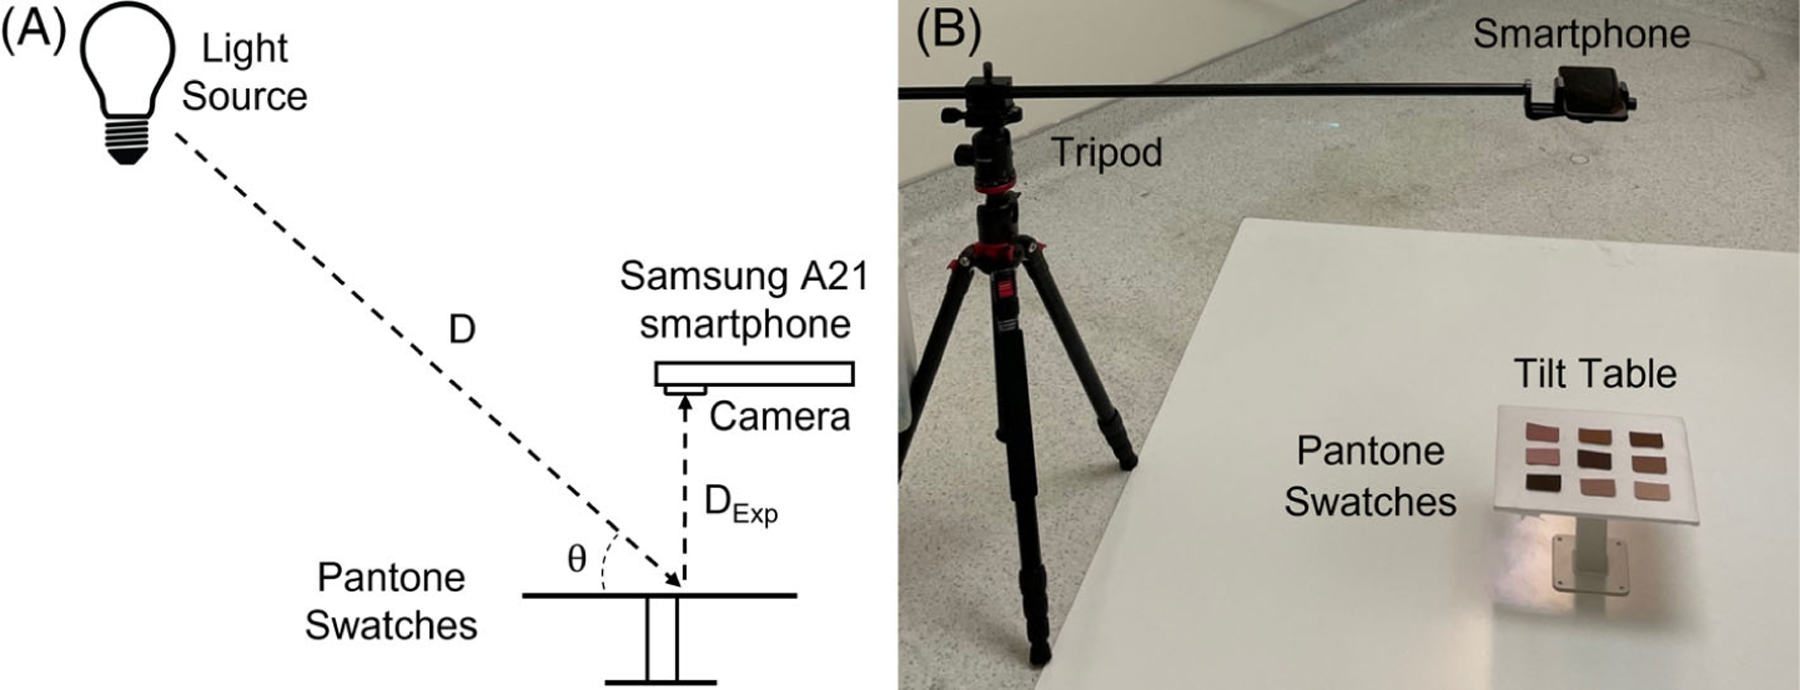
(A) Schematic of the experimental setup. Distances and angles between the swatches and each light source were as follows: D = 305 cm and θ = 35° for the soft white light, and D = 225 cm and θ = 45° for the D50 light. DExp was held at a constant 1 m for the angle experiments and was varied from 30 cm to 1 m for the distance experiment. (B) Photo of the experimental setup.
2.2 |. Experimental setup
Our experimental setup consisted of a smartphone as the camera (Samsung A21 Galaxy), tripod (Neewer Tripod Monopod), a horizontal mount (Alzo Digital Smartphone Camera Horizontal Mount), a D50 light source (Waveform Absolute Series 5000 K), a soft white (Walmart Great Value, 2700 K) LED light source, and a tilt table (Vidabox 360 Tilting and Rotating VESA Surface Mount) (Figure 1). The smartphone camera uses a white 5000 K LED flash with emission spectrum similar to that of D50 light [17].
The tripod and horizontal mount were used to keep the phone steady and to change the distance between the phone and the color standard. The horizontal mount was counterbalanced with two separate three-pound weights to avoid tilting. To change the angle between the color standard and the phone, we placed the color standard on a white polyester backdrop and attached it to the tilt table. A large whiteboard was used as a background for the whole setup to minimize background effects. The distance from the camera to the color standard was measured using a tape measurer. The angle of the swatches relative to the camera was measured using a digital angle measurer (Johnson Digital Angle Finder).
2.3 |. Study design
We performed two main experiments: one to investigate the effect of camera distance and another to investigate the effect of camera angle on captured color value. Within each experiment, we tested the effect of lighting, the effect of camera flash, as well as variability of color in repeated photos. To evaluate the effect of lighting in each experiment, we tested two different light sources: a soft white LED, and a D50 LED linear module. A diffuser (Fotoconic Soft White) was placed over each light source to provide more diffuse illumination and therefore minimize uneven lighting. Because the two different light sources were positioned next to each other rather than in the same location, each light source had a slightly different distance and angle relative to the swatches: 305 cm, 35° for soft white light, and 225 cm, 45° for D50. Light power on the surface of the swatches was 0.14 mW for soft white and 0.19 mW for D50, as measured by an EPM 2000 Laser Energy/Power Meter. To test the effect of flash in each experiment, we acquired photos with the smartphone flash on and with the flash off under each light source. This resulted in four lighting conditions for all experiments: soft white light with flash off, soft white light with flash on, D50 light with flash off, and D50 light with flash on. To assess the effect of any potential factors other than the experimental condition, three repeated photos were captured in quick succession. This resulted in 12 photos at each distance or angle.
To observe distance and angle effects with and without the phone’s automated processing, each photo was saved and later analyzed in both raw (DNG) and compressed (JPG) image format. The Adobe Lightroom app was used to control the camera for image capture. In the app, all capture options were set to “automatic” to better represent a typical image capture process in medical photography. The JPG photos were saved using the app’s export-to-JPG option. All image processing for JPG images was done using the phone’s automatic processing. Whereas raw DNG images are saved in a 10-bit (1024-shade) format, the compressed JPG images are saved in an 8-bit (256-shade) format.
2.3.1 |. Distance experiment
To test the effect of distance on color variability, we acquired photos at eight distances from the experiment surface, ranging from DExp = 30 cm to 100 cm. Initially, the phone was 30 cm away from and parallel to the tilt table with swatches (Figure 1). After the capture of 12 photos under the four lighting conditions, the distance from the phone to the swatches was increased by 10 cm and the process was repeated. In total, the distance experiment resulted in 96 photos.
2.3.2 |. Angle experiment
To test the effect of angle on color variability, we acquired photos at eight angles ranging from θ = 0° to 70°. Throughout the angle experiment, the phone was kept at a constant distance of DExp = 1 m between the tilt table with swatches. Of the range of distances in the previous experiment, we selected the longest distance (1 m) to minimize the effect of varying distances between the camera and swatches on the side versus in the center of the deck. Initially, the phone was parallel to the tilt table with swatches. After the capture of 12 photos under the four lighting conditions, the tilt table holding the swatches was rotated in increments of 10° around its center. We performed the angle experiment in two ways: with the angle of rotation parallel or perpendicular (Figure 2) to the incoming light, resulting in 96 photos for each of the two angle experiments.
FIGURE 2.
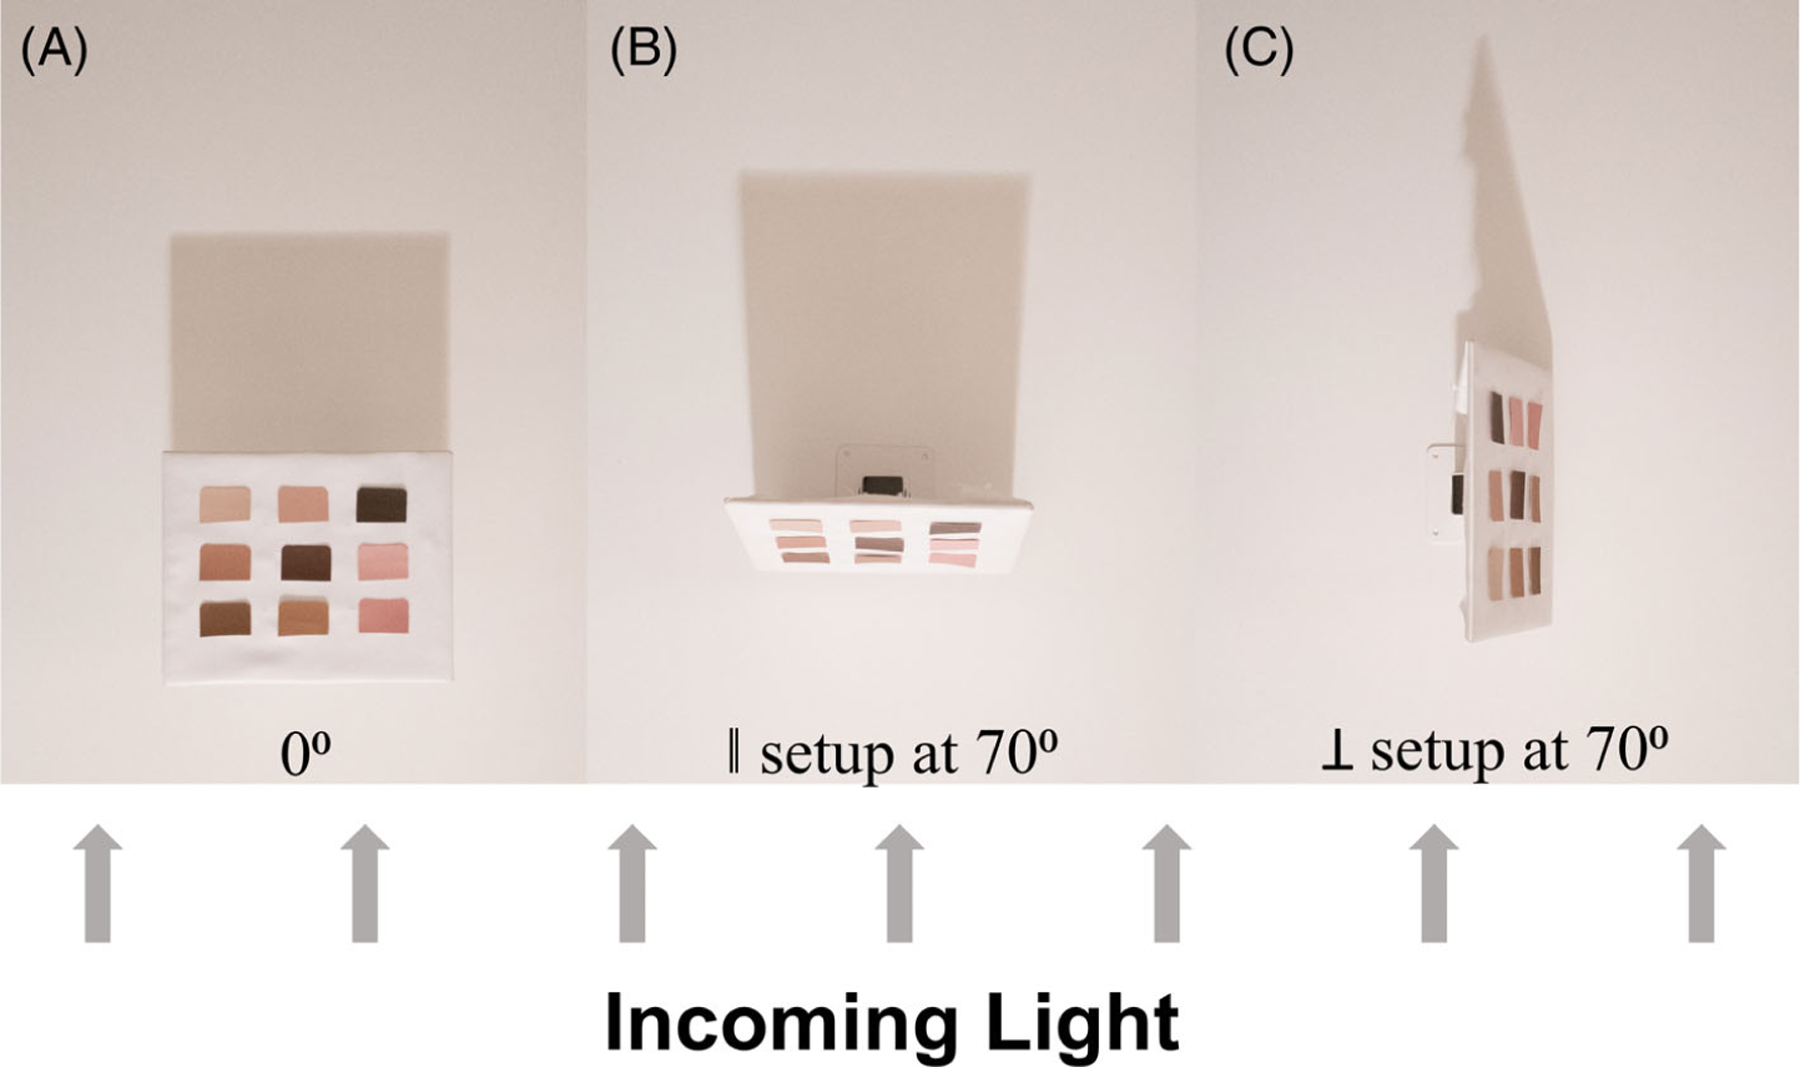
(A) Setup at 0°. (B) In the parallel (‖) setup, the tilt table is rotated in a way that the top of the table is moving towards the incoming light (towards the bottom of the image). (C) In the perpendicular (⊥) setup, the tilt table is rotated in a way that the top of the table is moving perpendicular to the incoming light (towards the right side of the image). The direction of the light source is indicated by the shadow of the tilt tables.
2.4 |. DNG image processing
Our DNG image processing workflow followed the procedure by Sumner [18] using values specified in the metadata of the captured images. The DNG images were captured and stored in a 10-bit format, which was conserved throughout the processing and all further analyses.
2.4.1 |. Cropping
Image cropping was done based on the areas specified in the DefaultCropOrigin tag in the metadata, which resulted in cropping of the first and last eight rows and columns of the image.
2.4.2 |. Linearization and brightness adjustment
All pixels were linearized and scaled based on the WhiteLevel and BlackLevel tags using Equation (1):
| (1) |
where is the original pixel value, the first value in the BlackLevel tag, the largest value in the Blacklevel tag, and is the value specified in the WhiteLevel tag.
2.4.3 |. White balancing and debayering
To represent scene colors without interference from factors such as color filter transparency, we adjusted the brightness and camera neutral. To adjust each image equally, the pixels corresponding to the red and blue color channels were scaled by the same values for all images. These values were determined by averaging the AsShotNeutral tags from all images captured under D50 light. The result was scaled according to Equation (2):
| (2) |
where is the red channel pixel values and the blue channel pixel values. The images were then debayered using the MATLAB demosaic function.
2.5 |. Choice of color space
We used the CIELAB color space to analyze color variation as it is a more perceptually oriented color space than the RGB space. In CIELAB, the L* channel represents the lightness of the color and the a* and b* channels represent chromaticity. The a* channel represents the red to greenness and b* represents the yellow to blueness. Color differences in this space are typically expressed using the Euclidean distance, where one unit of change is considered a just-noticeable difference, and greater than five units will likely be noticed.
2.6 |. Extraction of color values from captured photographs
For further image analysis, we extracted the color values of each of the swatches. To isolate the swatches from the image background, we used MATLAB R2020b edge detection to separate different swatches and form a connected components image. Eight border pixels on the outer edge of each swatch were discarded to avoid inclusion of any background pixels. The image components containing the isolated swatches were selected based on shape. Any missed swatches were isolated manually. The color of each isolated swatch was measured by converting the image from the sRGB color space to CIELAB. All pixels in each isolated swatch were then averaged across the L*, a*, and b* channels. This resulted in a single L*, a*, and b* value for each isolated swatch. An example of the averaged L* value for each isolated swatch across distance between the phone and the swatches (i.e., the distance experiment) is shown in Figure 3. LAB conversion assumed that exported JPG images used an sRGB color space and processed DNG images used a linear RGB space.
FIGURE 3.
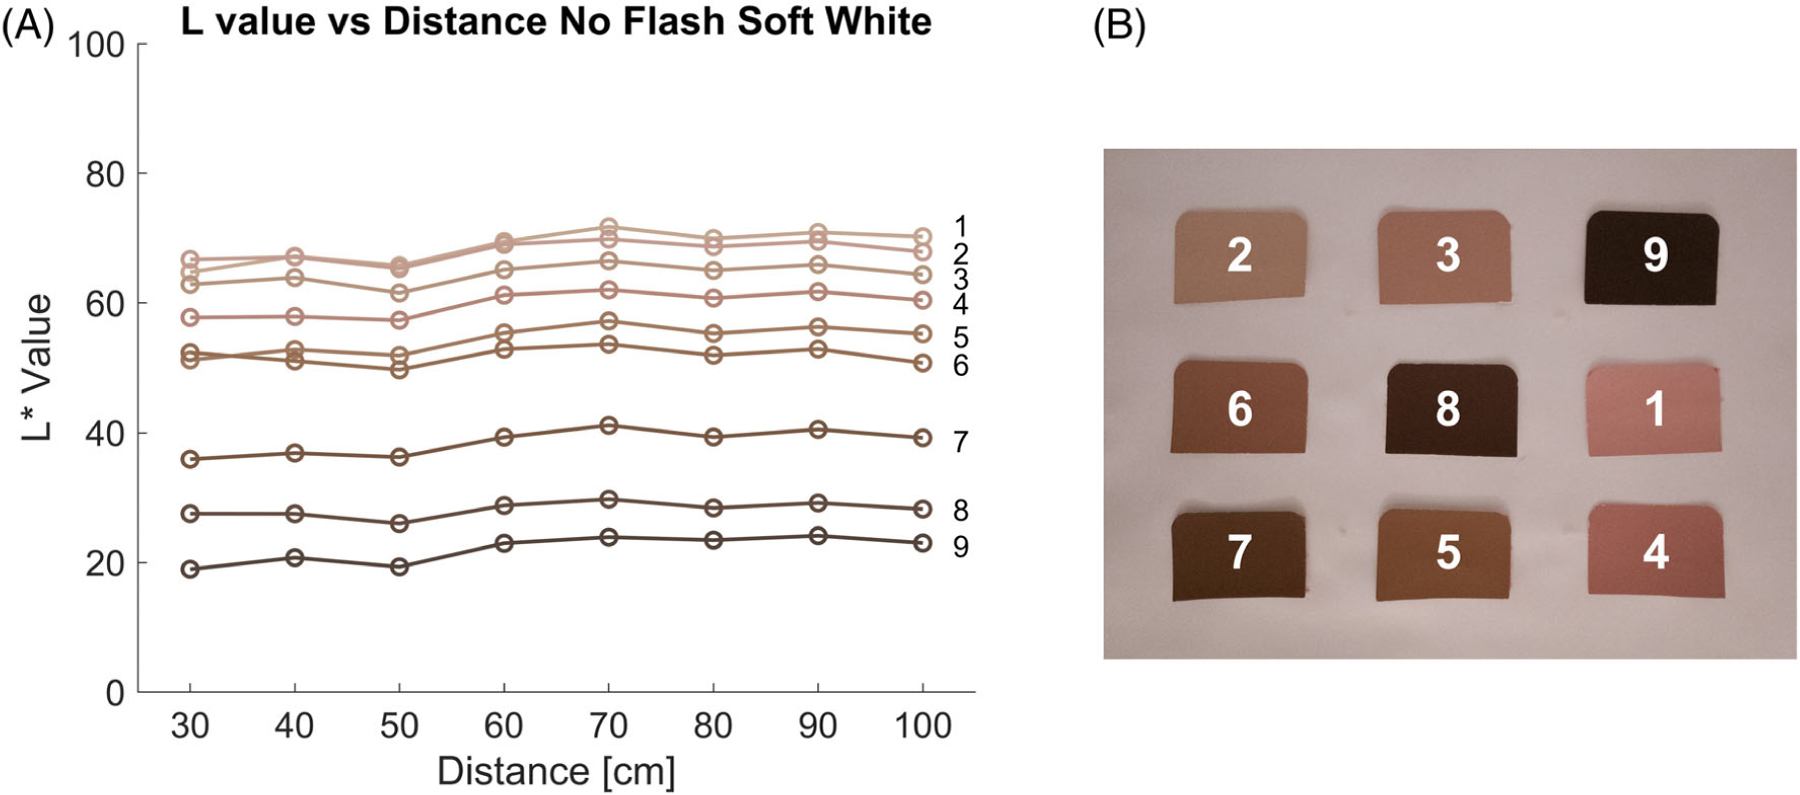
(A) Change in L* value across distances between the camera and the isolated swatches. The line color represents the color of the Pantone swatch. (B) Pantone swatches corresponding to each line.
2.7 |. Statistical analysis
Color variation across different distances and angles was quantified using the ANOVA-based standard error of measurement (SEM). Using all swatches across all distances or angles for each L*, a*, and b* channel under each imaging condition, SEM was calculated by using Equation (3):
| (3) |
where is the number of images, the number of swatches, and is the mean across all distances or angles for the i-th swatch. The upper and lower confidence intervals were calculated using Equation (4):
| (4) |
where is a constant derived from the degrees of freedom for the 2.5% and 97.5% confidence levels based on a chi-squared distribution.
To compare SEMs of the chromaticity (a* and b*) channels, we performed a t-test across all imaging conditions for each individual experiment and across all experiments. To compare the median SEM across all and just a* and b* channels from DNG versus JPG images, we performed a Wilcoxon rank sum test across all imaging conditions and experiments.
3 |. RESULTS
First, we report color variability across distances, angles, and illuminations for JPG versions only, as this format is more commonly used in medical photography than DNG. Then, we report a comparison of color variability between JPG and DNG versions.
3.1 |. Across distance, L* variability is noticeable (SEM > 1 CIELAB unit)
Across distance, only the lightness channel L* had SEMs consistently greater than 1 LAB unit (Figure 4A). For the a* channel, only photos taken under soft white light with camera flash on had a SEM greater than 1 LAB unit. For the b* channel, only photos taken with camera flash on had an SEM greater than 1 LAB unit.
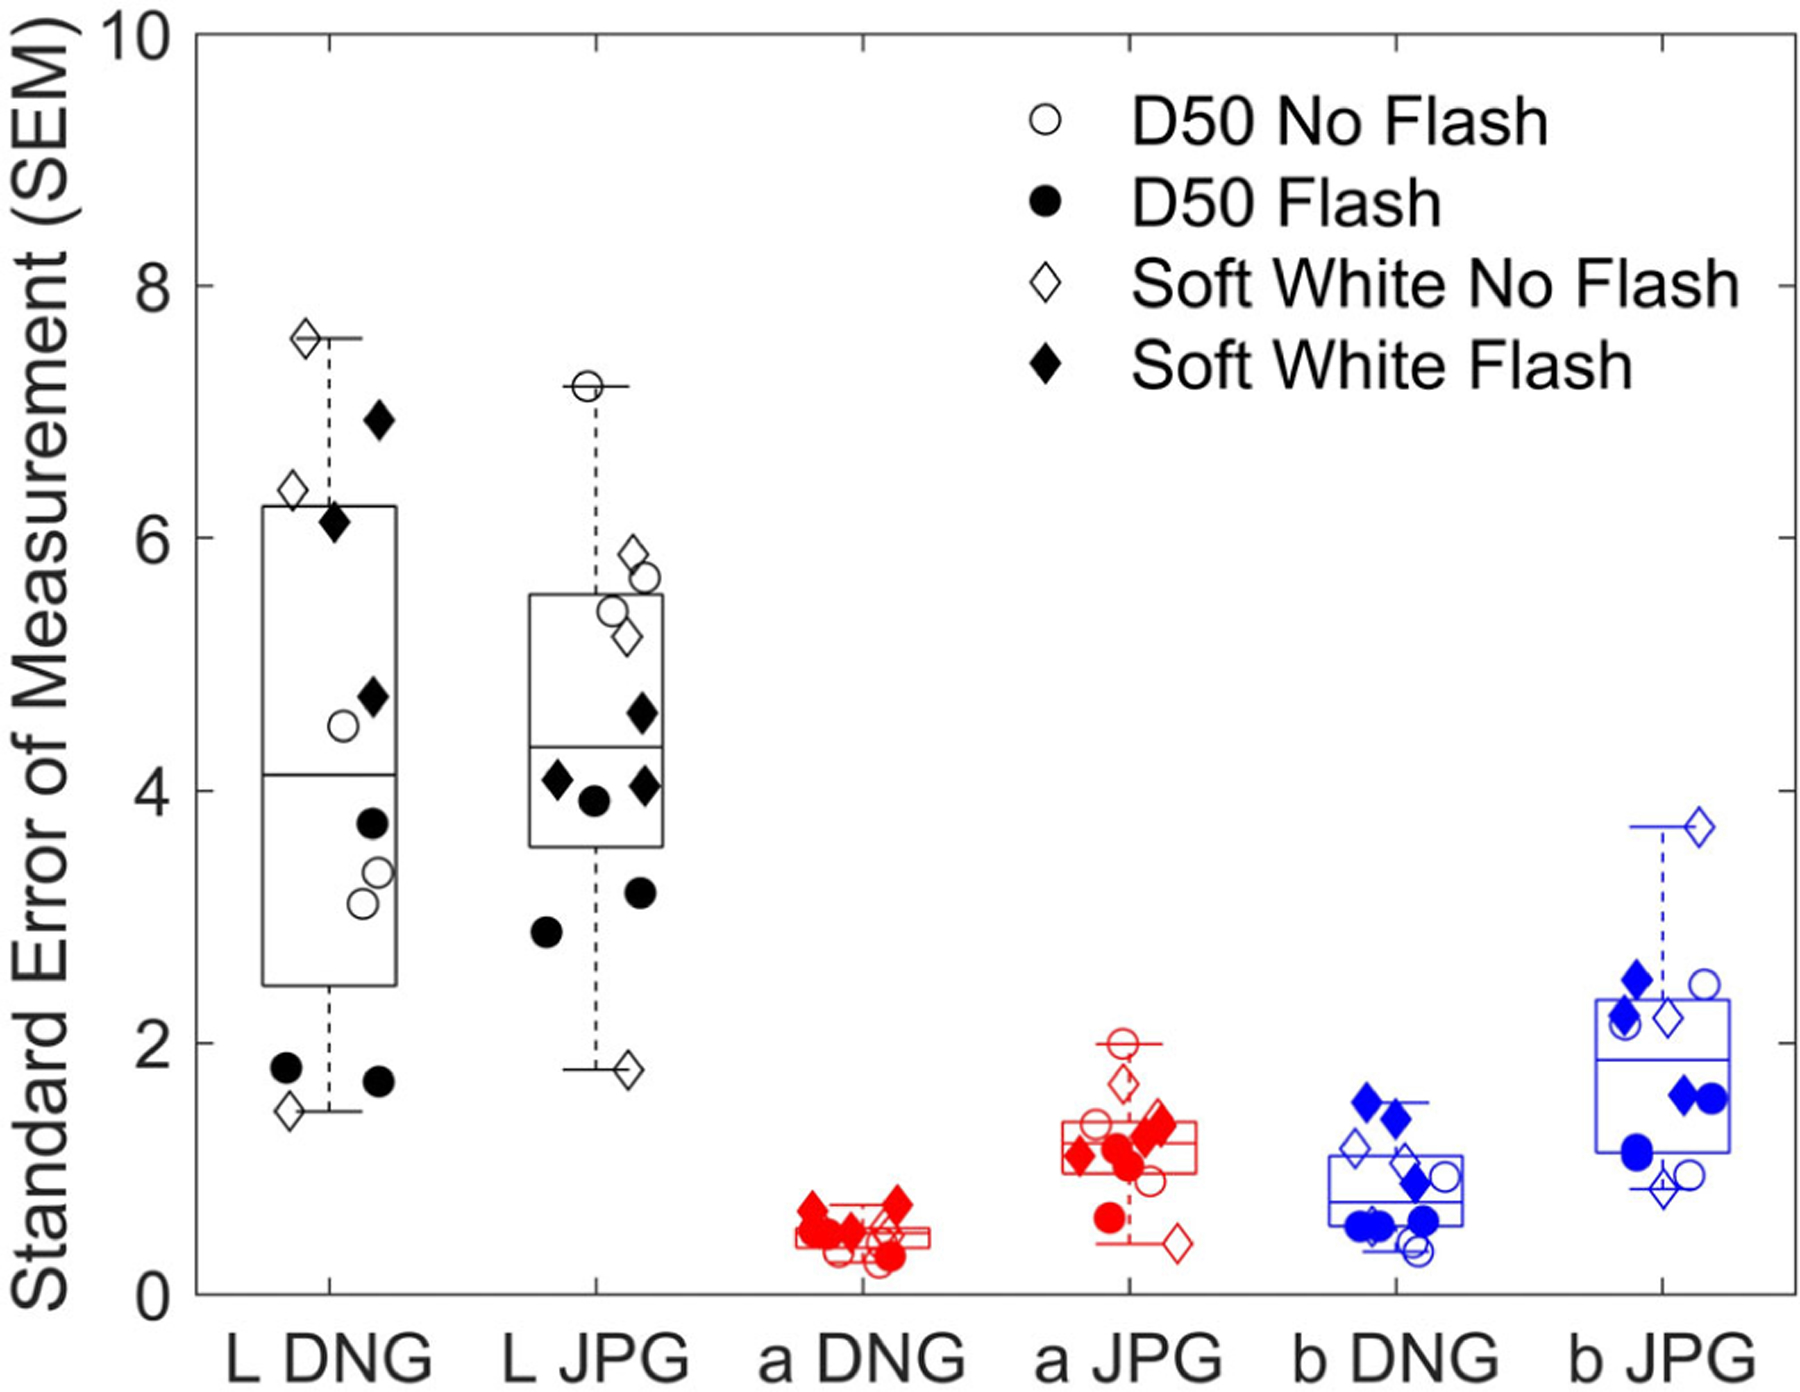
FIGURE 4.
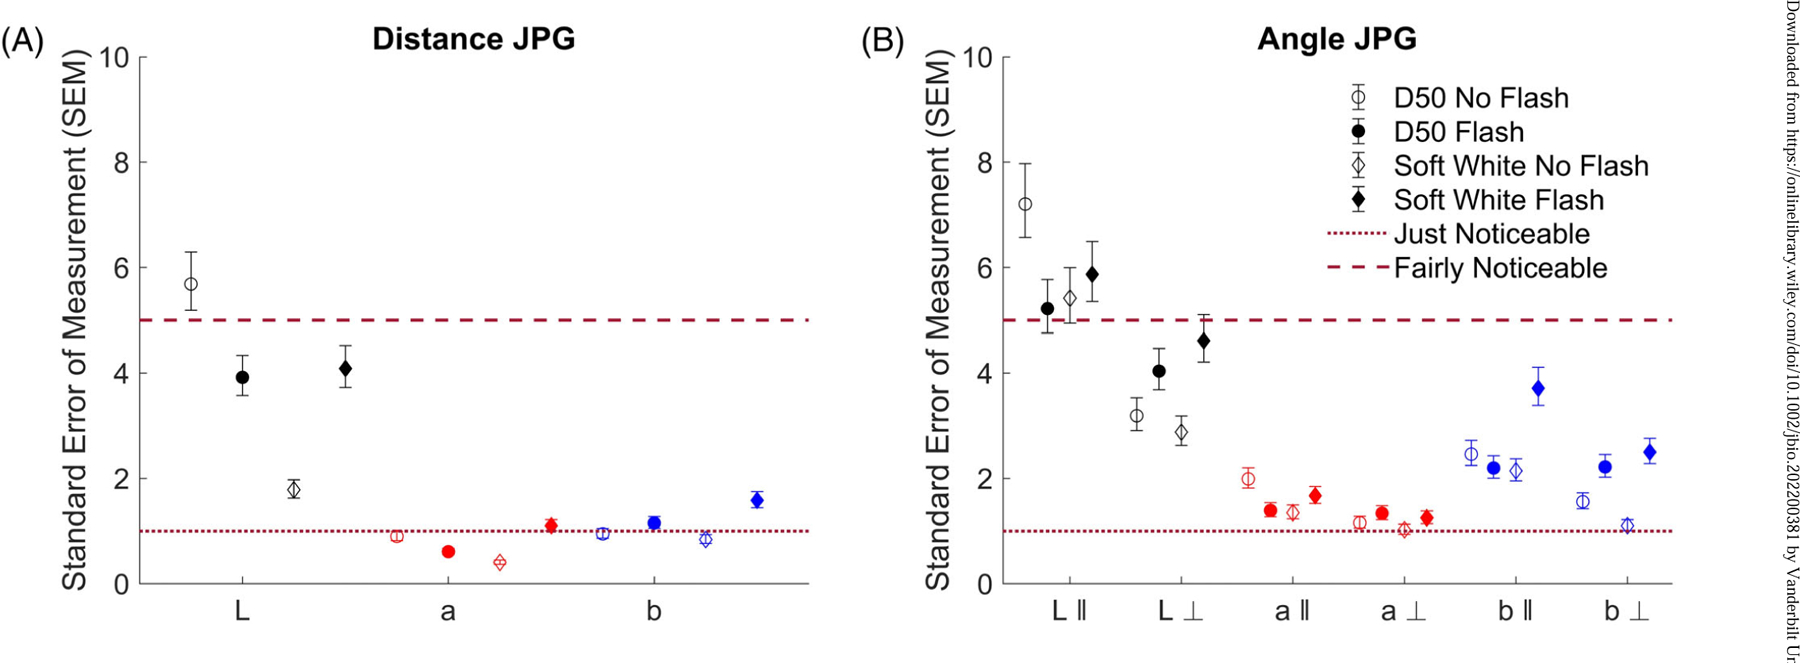
Color variation across distance (A) and angle (B), expressed by standard error of measurement (SEM): comparison of different lighting conditions, rotation angles, and flash usage. Dashed and dotted lines represent the thresholds for fairly noticeable [>5] and just noticeable [>1] differences. The k and ⊥ symbols represent the parallel and perpendicular angle experiments, respectively. SEMs for images with flash off are represented by an empty marker while flash on is represented by a filled marker. Images under D50 light are represented by circular markers while soft white is represented by diamond markers. The 95% confidence interval for each SEM is represented by the error bars. The marker colors represent the color channel used in the calculation, with black representing L*, red representing a*, and blue representing b*.
3.2 |. Across angles, all CIELAB values have noticeable variability
Across different angles, all CIELAB channels had SEMs greater than 1 LAB unit, but only the lightness channel in the parallel (‖) angle experiment had SEMs greater than 5 LAB units (Figure 4B). The parallel and perpendicular (⊥) angle experiments had similar chromaticity SEMs.
3.3 |. Lightness is more variable than chromaticity, and the b* channel is less variable than the a* channel
To determine whether a* variability was significantly different from b* variability, we performed a paired t-test for each experiment: distance, angle parallel, and angle perpendicular, as well as across all experiments. Across all experiments, chromaticity variation was lower than the corresponding lightness variation under the same imaging conditions. The a* variability never exceeded the corresponding b* variability under the same imaging condition (p value = 0.001) (Table 1).
TABLE 1.
Comparison of standard error of measurements (SEMs) of a* and b* channels in all experiments from exported JPG images
| SEM comparison (a vs. b, JPG) | p value (paired t-test) |
|---|---|
| Distance | 0.044# |
| Angle parallel (‖) | 0.013# |
| Angle perpendicular (⊥) | 0.086 |
| All | 0.001# |
Note: SEMs of a* and b* were significantly different (p < 0.05 indicated by #) in distance, parallel (‖) angle, and all experiments together, but not in perpendicular (⊥) angle.
3.4 |. Flash has a variable effect
Flash did not generally reduce L*, a*, or b* variability. For the distance experiment, flash usage decreased the SEM for the L* and a* channels under D50 light, but increased the SEM for the L*, a*, and b* channels under soft white light and b* channel under D50 light. For the angle experiment, flash use decreased the SEM for L*, a*, and b* channels under D50 light in the parallel experiment, but increased the SEM for L*, a*, and b* channels under soft white in the parallel experiment and under both light sources for the perpendicular angle experiment.
3.5 |. JPG increases median color variation
To compare color variation between the raw (DNG) and compressed (JPG) image formats, we calculated the median SEM value across all imaging conditions for each channel (L*, a*, and b*). Across all CIELAB channels, the JPG-format images had a higher median SEM than the DNG-format images (p = 0.005) (Figure 5). The difference in median SEM was significantly higher for a* and b* channels (p < 0.0001). For both a* and b* channels, the range of SEM values was larger for JPG compared to DNG format. To test whether these findings were affected by the difference in DNG and JPG file format (10-bit vs. 8-bit, respectively), we additionally calculated SEM values for DNG format images that have been compressed to an 8-bit format. The results and conclusions remained the same.
FIGURE 5.
Comparison of DNG and JPG SEMs from all distance and angle experiments. Each point represents a calculated SEM for each imaging condition and each color channel. SEM, standard error of measurement.
4 |. DISCUSSION AND CONCLUSION
Through standardized experiments of changing one parameter at a time, we quantified the effect of distance, angle, illumination, flash, and file format on color of a standard of diverse skin tones. By demonstrating the extent to which each variable affects color, these findings highlight the importance of developing clear guidelines for medical photography.
Changing the angle between the camera and the swatches resulted in a noticeable color variability (SEM > 1 CIELAB unit) across all channels. Interestingly, when changing the distance, only lightness (L*) had a noticeable variability. This finding indicates that both chromaticity channels representing red to green (a*) and yellow to blue (b*) may be reliable in longitudinal skin imaging even with varying distance across imaging sessions. Interestingly, b* variability was overall slightly higher than a* variability. This higher b* variability could be at least partly caused by an extra peak at 420 nm [19] in the LED light sources that we used in the experiments, compared to ideal D50/D65 light sources of the CIE standard. If lightness is also important, the standard should be placed at a constant distance in repeated sessions. To reduce color variability due to change in angle, the standard and the photographed area of interest should be placed as parallel to the camera detector as possible. Generally, maintaining a consistent camera angle and distance is important to reduce errors in color correction and device calibration and therefore reliably capture color in photographs.
Across all distance and angle experiments, the “raw” DNG image format had a decreased color variability compared to the JPG format. The main source of this increased variability for JPG format images is likely caused by the phone’s automated JPG processing rather than the difference in DNG and JPG file format (10-bit vs. 8-bit). In photography protocols, capturing photographs in the DNG format could reduce the variability caused by different camera orientations, illumination, or differences in camera-specific features such as image processing algorithms and Bayer Filter structure. However, DNG image acquisition and processing (e.g., manual white-balancing) require significant expertise and time investment, which may not be feasible for medical applications.
Flash is commonly used as a normalizing light source in medical photography. Because the flash is physically located roughly in the same plane right next to the camera, we hypothesized that its effect would be highly dependent on camera orientation. Surprisingly, camera orientation did not have a consistent positive or negative effect on captured color. This finding suggests that flash may be used even in settings with high variability in camera orientation. Future studies should explore whether flash can aid color calibration when light sources of varying color temperature and brightness are used.
To ensure standardization, we studied color variability on a relatively simple, single-plane, paper-based color standard of diverse skin tones. Our experiments were limited by a small set of nine colors, two light sources, a single camera, and one type of color standard material. In this study, we did not explore the effect of surface curvature on color variability. This is especially important for photography of human skin, as it is challenging and often impossible to keep the color standard in the same imaging plane as the skin due to body’s curvature. Future studies should explore color variability across different smartphone cameras and operating systems, light sources, and a wide range of colors and materials. Advanced processing methods such as focus stacking that combines multiple images taken at different focus distances could be explored for further reducing color variability. Eventually, color variability of measuring human skin should be evaluated to improve our ability to accurately capture and longitudinally monitor color of diverse skin tones in a wide range of clinical applications.
Supplementary Material
ACKNOWLEDGMENTS
This work was supported by a Career Development Award from the United States Department of Veterans Affairs Clinical Sciences R&D Service (IK2 CX001785 to E.R.T.), and the European Regional Development Fund (1.1.1.2/VIAA/4/20/665 to I.S.). We thank Alec Walter and Trevor Voss from the Vanderbilt Biophotonics Center for equipment, assistance, and advice. We also thank Xiaoqi Liu for help with experiments.
Funding information
European Regional Development Fund, Grant/Award Number: 1.1.1.2/VIAA/4/20/665; U.S. Department of Veterans Affairs, Grant/Award Number: IK2 CX001785
Abbreviations:
- CIE
Commission Internationale de l’Eclairage
- SEM
standard error of measurement
DATA AVAILABILITY STATEMENT
The data that support the findings of this study are available from the corresponding author upon reasonable request.
REFERENCES
- [1].Barnett ML, Ray KN, Souza J, Mehrotra A, JAMA 2018, 320, 2147. [DOI] [PMC free article] [PubMed] [Google Scholar]
- [2].van Poucke S, Haeghen YV, Vissers K, Meert T, Jorens P, BMC Med. Imaging 2010, 10, 7. [DOI] [PMC free article] [PubMed] [Google Scholar]
- [3].Ahmad Fadzil MH, Ihtatho D, Mohd Affandi A, Hussein SH, Hussein S, J. Med. Eng. Technol 2009, 33, 516. [DOI] [PubMed] [Google Scholar]
- [4].Menzies SW, Moloney FJ, Byth K, Avramidis M, Argenziano G, Zalaudek I, Braun RP, Malvehy J, Puig S, Rabinovitz HS, Oliviero M, Cabo H, Bono R, Pizzichetta MA, Claeson M, Gaffney DC, Soyer HP, Stanganelli I, Scolyer RA, Guitera P, Kelly J, McCurdy O, Llambrich A, Marghoob AA, Zaballos P, Kirchesch HM, Piccolo D, Bowling J, Thomas L, Terstappen K, Tanaka M, Pellacani G, Pagnanelli G, Ghigliotti G, Ortega BC, Crafter G, Ortiz AMP, Tromme I, Karaarslan IK, Ozdemir F, Tam A, Landi C, Norton P, Kaçar N, Rudnicka L, Slowinska M, Simionescu O, di Stefani A, Coates E, Kreusch J, JAMA Dermatol 2013, 149, 699. [DOI] [PubMed] [Google Scholar]
- [5].Tkaczyk ER, Chen F, Wang J, Gandelman JS, Saknite I, Dellalana LE, Jagasia MH, Dawant BM, Bone Marrow Transplant 2018, 53, 1356. [DOI] [PMC free article] [PubMed] [Google Scholar]
- [6].Cugmas B, Olivry T, Vet. Dermatol 2021, 32, 183. [DOI] [PubMed] [Google Scholar]
- [7].Park SM, Visbal-Onufrak MA, Haque MM, Were MC, Naanyu V, Hasan MK, Kim YL, Optica 2020, 7, 563. [DOI] [PMC free article] [PubMed] [Google Scholar]
- [8].Wang X, Zhang D, IEEE Trans. Inf. Technol. Biomed 2010, 14, 1355. [DOI] [PubMed] [Google Scholar]
- [9].Bowden AK et al. , Lab Chip 2014, 16, 2069. [Google Scholar]
- [10].Penczek J, Boynton PA, Splett JD, Digit J. Imaging 2014, 27, 182. [DOI] [PMC free article] [PubMed] [Google Scholar]
- [11].Hung Y-C, J. Food Qual 1990, 13, 259. [Google Scholar]
- [12].Jia MY, Wu QS, Li H, Zhang Y, Guan YF, Feng L, Biosens. Bioelectron 2015, 74, 1029. [DOI] [PubMed] [Google Scholar]
- [13].Raina A, Hennessy R, Rains M, Allred J, Hirshburg JM, Diven DG, Markey MK, Skin Res. Technol 2016, 22, 375. [DOI] [PMC free article] [PubMed] [Google Scholar]
- [14].Improving Color Image Quality in Medical Photography, International Color Consortium, Reston, VA: 2017. [Google Scholar]
- [15].Badano A, Revie C, Casertano A, Cheng WC, Green P, Kimpe T, Krupinski E, Sisson C, Skrøvseth S, Treanor D, Boynton P, Clunie D, Flynn MJ, Heki T, Hewitt S, Homma H, Masia A, Matsui T, Nagy B, Nishibori M, Penczek J, Schopf T, Yagi Y, Yokoi H, Summit on Color in Medical Imaging, J. Digit. Imaging 2015, 28, 41. [DOI] [PMC free article] [PubMed] [Google Scholar]
- [16].Yagi Y, Diagn. Pathol 2011, 6, S15. [DOI] [PMC free article] [PubMed] [Google Scholar]
- [17].Solyman O, Hamdy O, Abdelkawi S, Hassan A, Pan Afr. Med. J 2022, 43, 15. [DOI] [PMC free article] [PubMed] [Google Scholar]
- [18].Sumner R, Processing RAW Images in MATLAB, Department of Electrical Engineering, University of California Santa Cruz, Santa Cruz, CA: 2014. [Google Scholar]
- [19].Photometric Data for ABSOLUTE SERIES™ LED Linear Module 5000K, Waveform Lighting, Vancouver, WA: rev 1.0, 2018 PN: 7001.50. [Google Scholar]
Associated Data
This section collects any data citations, data availability statements, or supplementary materials included in this article.
Supplementary Materials
Data Availability Statement
The data that support the findings of this study are available from the corresponding author upon reasonable request.