Abstract
Purpose
The velocity time integral (VTI) of the left ventricular outflow tract (LVOT) obtained in the apical view by echocardiography can be regarded as a surrogate for the stroke volume. In critically ill patients it is often difficult to obtain an appropriate apical view to assess the VTI. The subcostal view is more accessible, but while it allows a qualitative assessment of the heart, is not adequate for estimating a reliable LVOT VTI, given the inappropriate angle between the Doppler signal and the flow through the LVOT. We present a new modified subcostal view that allows a proper LVOT VTI measurement.
Methods
This is a single-centre experimental, retrospective, and observational study using data from patients in a tertiary-care centre. We included adult patients admitted to the intensive care unit in the period from June 2020 to January 2022, who were evaluated by echocardiography and whose LVOT VTI was measured aligned with the Doppler signal in both the apical five-chamber view and the modified subcostal view.
Results
A total of 30 patients were evaluated in the study period by ultrasonography. The Bland–Altman method analysis of the LVOT VTI measured in the apical view compared with that obtained in the subcostal view showed a bias of 0.8 (95% CI 0.39–1.21) with a 95% limit of agreement between − 1.35 (95% CI − 2.06 to − 0.64) and 2.96 (95% CI 2.25–3.67). The percentage error was calculated to be 23%. The Pearson correlation coefficient for the two forms of measurements showed an R value of 0.98 (95% CI 0.96–0.99).
Conclusion
The LVOT VTI measured in a modified subcostal view is useful for estimating the value of the LVOT VTI obtained in an apical view.
Keywords: POCUS, Echocardiography, Cardiac output, Subcostal view, Critical care
Introduction
In recent years, echocardiographic assessment has become a fundamental tool for monitoring the hemodynamics of critically ill patients. It enables calculating a patient’s stroke volume (SV) and cardiac output (CO) based on the measurement of the left ventricle outflow tract (LVOT) velocity–time integral (VTI) in an apical five-chamber view and the LVOT area. The VTI represents the column of blood that travels through the LVOT during the systole [1, 2]. The SV and CO can be obtained by multiplying the LVOT VTI by the LVOT area. The latter is obtained by measuring the LVOT diameter in a parasternal long-axis view [2]. Given that the LVOT is constant in the same patient, it is possible to simplify the hemodynamic assessment and regard the LVOT VTI as a surrogate for the SV [3–7]. In critically ill patients it is often difficult to obtain an appropriate five-chamber view, due to the patient’s position, mechanical ventilation, or the presence of thoracic drainages. The subcostal window is more accessible and allows a qualitative assessment of the heart. However, in this view, the alignment between the Doppler signal and the direction of the LVOT flow is not appropriate for estimating a reliable VTI [8]. We present a modified subcostal view that allows the LVOT VTI to be obtained.
Material and methods
We present an experimental, observational, retrospective, and single-centre study, performed in our intensive care unit (ICU) between June 2020 and January 2022. The study was conducted in accordance with the principles of the Helsinki declaration and in compliance with the necessary precautions established by ethical and legal standards, preserving the identity of patients. The ethics and research committee of our institution approved this study and waived the requirement for informed consent. We included all adult patients admitted to the ICU who were evaluated by echocardiography and whose LVOT VTI was measured with the correct alignment with the Doppler signal, both in the apical five-chamber view and in the modified subcostal view.
Sample size
We used MedCalc® Statistical Software version 20.011 (MedCalc Software Ltd, Ostend, Belgium; https://www.medcalc.org; 2021) to calculate the sample size for the Bland–Altman plot, assuming a power of 0.8, an alpha value of 0.05, an expected mean difference of 1.1, an expected standard deviation of 0.95, and a maximum allowed difference between methods of 4, which resulted in a minimum required number of pairs of 24.
Ultrasonography
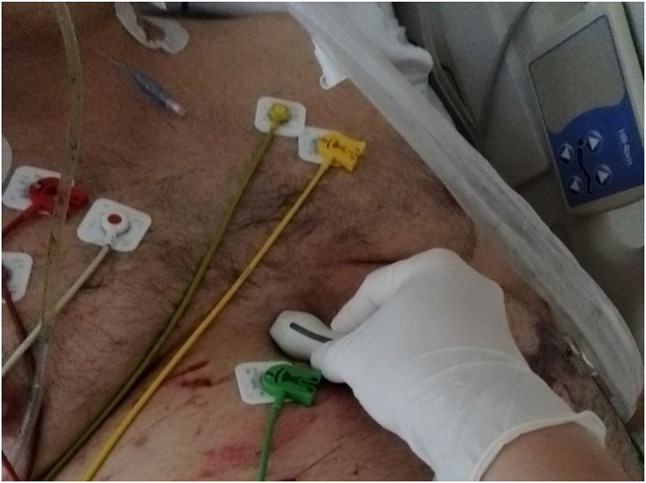
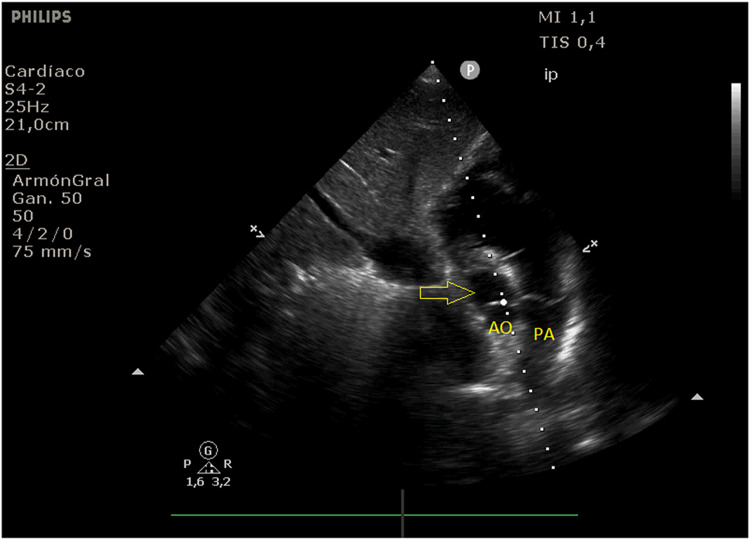
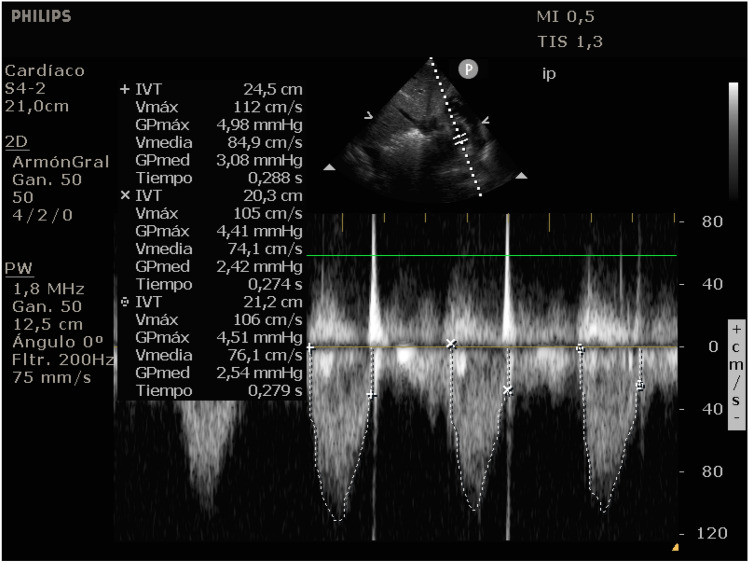
For ultrasonographic evaluation, we used a Philips Envisor HD or Sparq ultrasound machine (Philips Healthcare, WA, USA) with a phased array transducer. The modified subcostal view was obtained by placing the transducer below the subxiphoid region with an angle of approximately 45° from the skin, with its mark pointing upwards with the patient in supine and semi-recumbent position. We obtained an axial view of the aortic valve, with the right ventricle and pulmonary artery. From this position, the transducer was rotated slightly counterclockwise until the LVOT was visualized together with the aortic valve. Once the signal was aligned to the direction of the LVOT flow, the pulsed-wave Doppler was activated, and we positioned the sample volume just above de aortic valve to obtain the respective spectra (Figs. 1, 2 and 3). Subsequently, the LVOT VTI was obtained through the apical five-chamber window, considered to be the reference method, thereby ensuring a correct alignment between the Doppler signal and the flow direction. Three consecutive measurements of each method were made, and the recorded value corresponded to the average of the three.
Fig. 1.

Transducer position for the modified subcostal windows to visualize LVOT
Fig. 2.
B mode of the modified subcostal view that allows the visualization of the LVOT (yellow arrow) which is aligned with the dotted line representing the incidence of the Doppler signal (AO aorta, PA pulmonary artery)
Fig. 3.
Pulsed wave Doppler mode at the LVOT above the aortic valve in the modified subcostal view with its VTI measurement
Data collection
The data were collected from the patients’ electronic medical records, as well as from stored ultrasonographic studies. The following variables were considered: age, gender, comorbidities, APACHE II score, cause for admission, requirement of mechanical ventilation, vasopressor and inotropic support, systolic function of the left ventricle (LV) and right ventricle (RV), presence of valvulopathies, apical LVOT VTI, and subcostal LVOT VTI.
Statistical analysis
The frequencies and distribution of the qualitative variables were expressed in absolute quantities and percentages, while the quantitative variables were expressed as means ± standard deviations and interquartile ranges according to the observed characteristics of the distribution. The normal distribution of the quantitative variables was evaluated with the Shapiro–Wilk test. To study the agreement between the LVOT VTI measurements obtained in the apical five-chamber view and the modified subcostal view, the Bland–Altman method was used. We calculated the percentage error derived by dividing the limits of agreement by the mean value of the measurements obtained with the established method [9]. The Pearson correlation coefficient was used to find an association between the variables. For all measurements, a 95% confidence interval (95% CI) showing no overlap was considered to be statistically significant.
Results
A total of 30 patients were evaluated in the study period by ultrasonography. Trauma was the most frequent reason for hospitalization (20%), followed by pneumonia (16.6%), septic shock (10%), and stroke (10%). The mean value of the APACHE II score was 15.7 ± 9.4. Of all patients, 56.6% required mechanical ventilation, 16.6% vasopressor support with noradrenaline, and 3.3% inotropic support with dobutamine. Based on the echocardiographic assessment, the majority of the patients had a normal LV systolic function (90%) and RV systolic function (96.7%). The mean value of the apical LVOT VTI measured in the standard view was 19.1 ± 6 cm, and the one obtained in the subcostal view was 18.2 ± 5.8 cm. Table 1 shows the demographic, clinical, and echocardiographic characteristics of the patients.
Table 1.
Characteristics of the patients
| Variable | n = 30 |
|---|---|
| Age (years), median (SD) | 51.4 (19.1) |
| Gender (male), n (%) | 25 (83.3%) |
| Comorbidities | |
| Arterial Hypertension | 9 (30%) |
| Diabetes | 4 (13.3%) |
| Ischemic heart disease | 4 (13.3%) |
| Dyslipidemia | 1 (3.3%) |
| Obesity | 1 (3.3%) |
| Cause for admission, n (%) | |
| Trauma | 6 (20%) |
| Pneumonia | 5 (16.6%) |
| Septic shock | 3 (10%) |
| Stroke | 3 (10%) |
| Gastrointestinal bleeding | 2 (6.7%) |
| Other causes | 11 (36.7%) |
| APACHE II score (points), mean (SD) | 15.7 (9.4) |
| Mechanical ventilation, n (%) | 17 (56.6%) |
| Noradrenaline vasopressor support, n (%) | 5 (16.6%) |
| Dobutamine inotropic support, n (%) | 1 (3.3%) |
| Left ventricle systolic function, n (%) | |
| Normal | 27 (90%) |
| Moderately impaired | 1 (3.3%) |
| Severely impaired | 2 (6.7%) |
| Right ventricle systolic function, n (%) | |
| Normal | 29 (96.7%) |
| Impaired | 1 (3.3%) |
| Valvulopathies, n (%) | |
| Mild mitral regurgitation | 2 (6.6%) |
| Moderate mitral regurgitation | 1 (3.3%) |
| Mild tricuspid regurgitation | 3 (10%) |
| Moderate tricuspid regurgitation | 1 (3.3%) |
| Mild aortic regurgitation | 5 (16.6%) |
| Apical LVOT VTI (cm), mean (SD) | 19.1 (6) |
| Subcostal LVOT VTI (cm), mean (SD) | 18.2 (5.8) |
The Bland–Altman method analysis of the LVOT VTI value measured in the apical view compared with that obtained in the subcostal view showed a bias of 0.8 (95% CI 0.39–1.21) with a 95% limit of agreement between − 1.35 (95% CI − 2.06 to − 0.64) and 2.96 (95% CI 2.25–3.67). The analysis showed that 100% of the differences fell between the limits of agreement (Fig. 4). The percentage error was calculated to be 23%. The Pearson correlation coefficient for the two forms of measurements showed an R value of 0.98 (95% CI 0.96–0.99) (Figs. 5).
Fig. 4.

Bland–Altman plot between LVOT VTI in apical and the modified subxiphoid views
Fig. 5.

Correlation between LVOT VTI in apical and the modified subxiphoid views
Discussion
The cardiac output measurement is extremely useful in the management of critically ill patients. Echocardiographic assessment is the recommended non-invasive approach, especially for patients with shock [10]. The SV can be obtained by multiplying the LVOT area by the LVOT VTI from the apical five-chamber view. Considering that the diameter of the LVOT does not change in the same patient, the LVOT VTI can be regarded as a surrogate for the SV. However, it is not always possible to obtain an apical five-chamber view in critically ill patients. In this case, the subcostal windows could be an interesting alternative, allowing a qualitative hemodynamic assessment. Considering that in Doppler mode the velocity of a flow depends on the cosine of the angle formed between the Doppler signal’s incidence and the direction of the flow, the alignment in this view is not adequate, so it is not recommended to measure the LVOT VTI in this view. Some authors have proposed using the angle correction function, but this option does not seem to be useful for correcting the velocity [8]. In this context, according to our knowledge, this is the first study that shows the possibility of measuring the LVOT VTI through a modified subcostal window, obtaining an adequate alignment between the Doppler signal and the LVOT flow.
Generally, when a new measurement technique of a variable is proposed, it is compared with the reference technique to obtain the degree of agreement between both methods and to validate the benefits of the new method [11]. Critchley and Critchley showed that the variation between the new method and the reference method of measuring cardiac output could be considered acceptable if the percentage error was less than 30% [12]. The percentage error calculated in our study was 23%, which would indicate that this novel method for estimating the LVOT VTI could be interchangeable with the conventional method and could be used when it is not possible to obtain an apical five-chamber view.
Our study has several limitations. First, we should mention the retrospective design, which reduces the control over multiple confounders. Second, only a single centre participated in the study. Third, interobserver reproducibility was not assessed, and finally, there was no blind operator.
Conclusion
Even with the limitations described, our findings suggest that the LVOT VTI measured in the modified subcostal view, with the incidence of the Doppler signal aligned to the LVOT, is practically interchangeable with the LVOT VTI obtained in the conventional apical five-chamber view. It is, therefore, a useful alternative for assessing the LVOT VTI when the apical view is not available.
Authors contributions
Conceptualization: Issac Cheong; Methodology: Issac Cheong; Formal analysis and investigation: Issac Cheong; Writing – original draft preparation: Issac Cheong; Writing – review and editing: Issac Cheong, Victoria Otero Castro; Supervision: Raúl A Gómez, Pablo M Merlo, Francisco M Tamagnone.
Funding
The authors declare that no funds, grants, or other support were received during the preparation of this manuscript. The authors have no relevant financial or non-financial interests to disclose.
Declarations
Conflict of interest
The authors declare that they have no conflict of interest.
Footnotes
Publisher's Note
Springer Nature remains neutral with regard to jurisdictional claims in published maps and institutional affiliations.
References
- 1.Blanco P. Rationale for using the velocity-time integral and the minute distance for assessing the stroke volume and cardiac output in point-of-care settings. Ultrasound J. 2020;12(1):21. doi: 10.1186/s13089-020-00170-x. [DOI] [PMC free article] [PubMed] [Google Scholar]
- 2.Mercado P, Maizel J, Beyls C, Titeca-Beauport D, Joris M, Kontar L, Riviere A, Bonef O, Soupison T, Tribouilloy C, de Cagny B, Slama M. Transthoracic echocardiography: an accurate and precise method for estimating cardiac output in the critically ill patient. Crit Care. 2017;21(1):136. doi: 10.1186/s13054-017-1737-7. [DOI] [PMC free article] [PubMed] [Google Scholar]
- 3.Wang J, Zhou D, Gao Y, Wu Z, Wang X, Lv C. Effect of VTILVOT variation rate on the assessment of fluid responsiveness in septic shock patients. Medicine (Baltimore) 2020;99(47):e22702. doi: 10.1097/MD.0000000000022702. [DOI] [PMC free article] [PubMed] [Google Scholar]
- 4.Feissel M, Michard F, Mangin I, Ruyer O, Faller JP, Teboul JL. Respiratory changes in aortic blood velocity as an indicator of fluid responsiveness in ventilated patients with septic shock. Chest. 2001;119(3):867–873. doi: 10.1378/chest.119.3.867. [DOI] [PubMed] [Google Scholar]
- 5.Biais M, Vidil L, Sarrabay P, Cottenceau V, Revel P, Sztark F. Changes in stroke volume induced by passive leg raising in spontaneously breathing patients: comparison between echocardiography and Vigileo/FloTrac device. Crit Care. 2009;13(6):R195. doi: 10.1186/cc8195. [DOI] [PMC free article] [PubMed] [Google Scholar]
- 6.Jozwiak M, Depret F, Teboul JL, Alphonsine JE, Lai C, Richard C, Monnet X. Predicting fluid responsiveness in critically ill patients by using combined end-expiratory and end-inspiratory occlusions with echocardiography. Crit Care Med. 2017;45(11):e1131–e1138. doi: 10.1097/CCM.0000000000002704. [DOI] [PubMed] [Google Scholar]
- 7.Muller L, Toumi M, Bousquet PJ, Riu-Poulenc B, Louart G, Candela D, Zoric L, Suehs C, de La Coussaye JE, Molinari N, Lefrant JY, AzuRéa Group An increase in aortic blood flow after an infusion of 100 ml colloid over 1 minute can predict fluid responsiveness: the mini-fluid challenge study. Anesthesiology. 2011;115(3):541–547. doi: 10.1097/ALN.0b013e318229a500. [DOI] [PubMed] [Google Scholar]
- 8.Maizel J, Salhi A, Tribouilloy C, Massy ZA, Choukroun G, Slama M. The subxiphoid view cannot replace the apical view for transthoracic echocardiographic assessment of hemodynamic status. Crit Care. 2013;17(5):R186. doi: 10.1186/cc12869. [DOI] [PMC free article] [PubMed] [Google Scholar]
- 9.Hanneman SK. Design, analysis, and interpretation of method-comparison studies. AACN Adv Crit Care. 2008;19(2):223–234. doi: 10.1097/01.AACN.0000318125.41512.a3. [DOI] [PMC free article] [PubMed] [Google Scholar]
- 10.Cecconi M, De Backer D, Antonelli M, Beale R, Bakker J, Hofer C, Jaeschke R, Mebazaa A, Pinsky MR, Teboul JL, Vincent JL, Rhodes A. Consensus on circulatory shock and hemodynamic monitoring. Task force of the European Society of Intensive Care Medicine. Intensive Care Med. 2014;40(12):1795–1815. doi: 10.1007/s00134-014-3525-z. [DOI] [PMC free article] [PubMed] [Google Scholar]
- 11.Souza RSE, Melo WB, Freire CMV, Vilas Boas WW. Comparative study between suprasternal and apical windows: a user-friendly cardiac output measurement for the anesthesiologist. Braz J Anesthesiol. 2021 doi: 10.1016/j.bjane.2021.02.063. [DOI] [PMC free article] [PubMed] [Google Scholar]
- 12.Critchley LA, Critchley JA. A meta-analysis of studies using bias and precision statistics to compare cardiac output measurement techniques. J Clin Monit Comput. 1999;15(2):85–91. doi: 10.1023/a:1009982611386. [DOI] [PubMed] [Google Scholar]


