Abstract
Purpose
The purpose of this study was to assess the diagnostic performance of mammography (MMG) and ultrasound (US) imaging for detecting breast cancer.
Methods
Comprehensive searches of PubMed, Scopus and EMBASE from 2008 to 2021 were performed. A summary receiver operating characteristic curve (SROC) was constructed to summarize the overall test performance of MMG and US. Histopathologic analysis and/or close clinical and imaging follow-up for at least 6 months were used as golden reference.
Results
Analysis of the studies revealed that the overall validity estimates of MMG and US in detecting breast cancer were as follows: pooled sensitivity per-patient were 0.82 (95% CI 0.76–0.87) and 0.83 (95% CI 0.71–0.91) respectively, The pooled specificities for detection of breast cancer using MMG, and US were 0.84 (95% CI 0.73–0.92) and 0.84 (95% CI 0.74–0.91) respectively. AUC of MMG, and US were 0.8933 and 0.8310 respectively. Pooled sensitivity and specificity per-lesion was 76% (95% CI 0.62–0.86) and 82% (95% CI 0.66–0.91) for MMG and 94% (95% CI 0.87–0.97) and 84% (95% CI 0.74–0.91) for US.
Conclusions
The meta-analysis found that, US and MMG has similar diagnostic performance in detecting breast cancer on per-patient basis after corrected threshold effect. However, on a per-lesion basis US was found to have a better diagnostic accuracy than MMG.
Keywords: Breast cancer, Diagnostic methods, Mammography, Ultrasound, Meta-analysis
Introduction
Breast cancer is the most frequently diagnosed cancer and the leading cause of cancer death in females, worldwide [1]. One in eight of women has a chance to develop invasive breast cancer in her life [2]. Breast cancer is a heterogeneous disease with no single characterized cause. Epidemiological studies have identified many risk factors that increase the chance for a woman to develop breast cancer. Important risk factors for female breast cancer include menstruation (early age at menarche, later age at menopause), reproduction (nulliparity, late age at first birth, and fewer children), exogenous hormone intake (oral contraceptive use and hormone replacement therapy), nutrition (alcohol intake), and anthropometry (greater weight, weight gain during adulthood, and body fat distribution); whereas breastfeeding and physical activity are known protective factors [3].
Mammography (MMG) has a paramount of importance in early detection of breast cancers, detecting about 75% of cancers at least a year before they can be felt [4]. Screening and diagnostic are two types of mammography examinations. Screening mammography is done in asymptomatic women. Screening mammography has a paramount of importance in greatly improving a woman’s chances for successful treatment. It is also recommended that to be done in every 1–2 years for the women greater than 40 years old and every year for the greater than 50 years [4] Sometimes, physicians may indorse beginning screening mammography before age 40 if the woman has a strong family history of breast cancer [5]. Studies have shown that regular mammograms may decrease the risk of late-stage breast cancer in women 80 years of age and older [6, 7]. When a breast lump or nipple discharge is found during the self-examination or irregularity is found during screening, diagnostic mammography is will be performed.
Ultrasonography (US) has been playing an increasingly important role in the evaluation of breast cancer, particularly in the case of a symptomatic patient, after clinical examination. In the case of a patient without symptoms, breast ultrasound is ascribed a higher sensitivity for detecting breast cancer in women with dense breast tissue, women under the age of 50 and high-risk women [4].
Despite the increasing numbers of publications concerning MMG and US in the diagnosis procedure for breast cancer in patients the effectiveness of these modalities still remains unknown and no consensus has been reached. Thus, the aim of our study was to perform a meta-analysis to compare the diagnostic value of MMG and US imaging in detecting breast cancer to provide better evidence-based advice to physicians in this area, which, to our knowledge, had not previously been studied.
Materials and methods
Our review methods followed the recommendations of the Preferred Reporting Items for Systematic Reviews and Meta-Analyses (PRISMA) [8]. According to the PICO approach [8] the ‘PICOS’ questions pertinent to this review were: patients (P)- over the age of 18 years undergoing MMG and US; intervention (I)- diagnostic tests: MMG and US; comparison (C)-histopathologic results or six months follow-up; outcome (O)- accuracy of imaging modalities to detect breast cancer.
Search strategy
We searched the PubMed, Scopus, and EMBASE for studies about the diagnostic value of MMG and US, for detecting BC. A core strategy was developed in PubMed and then translated for each database. Published year was limited between 2008 and 2021. The steps employed to select eligible studies for this systematic review and meta-analysis is depicted in Fig. 1.
Fig. 1.
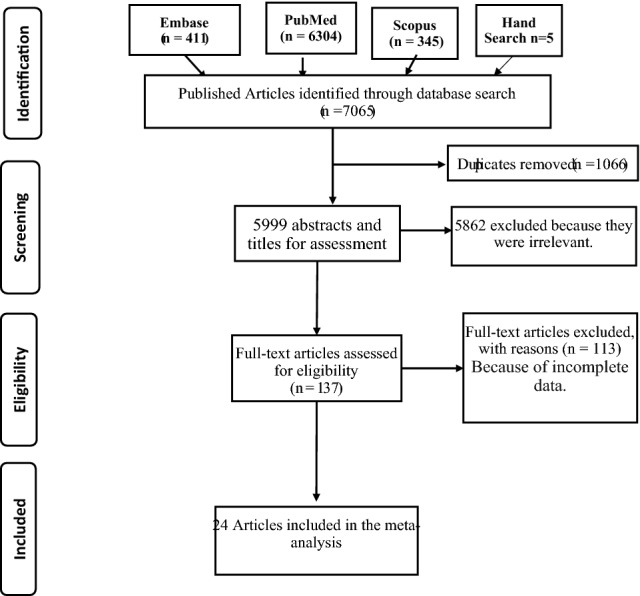
PRISMA flow diagram for the meta-analysis
(((((((breast cancer [tiab]) OR breast cancer [MeSH Terms]) OR breast carcinoma [tiab]) OR breast tumor [tiab]) OR breast neoplasm [tiab])) AND (((((US [tiab]) OR ultrasound [tiab]) OR ultrasonography [tiab]) OR MMG [tiab]) OR mammography [tiab])) AND ((((((sensitivity [tiab]) OR specificity [tiab]) OR false negative [tiab]) OR false positive [tiab]) OR detection [tiab]) OR diagnosis [tiab]).
In addition, reference lists of identified articles were also searched for relevant articles not identified during search strategy to find additional studies for the systematic review. The search was performed in December 2021 to ensure inclusion of all recent publications in the analysis. Then the studies were exported to Endnote to maintain and manage citation and facilitate the review process. All citations were imported into a reference management system and duplicates were removed.
Selection criteria
The included studies in our analysis had to meet the selection criteria given as follows: (a) evaluating the diagnostic value of MMG or US in detecting breast cancer; (b) breast cancer has to be confirmed by histopathological analysis, or clinical and imaging follow-up for at least 6 months; (c) absolute number of sensitivity or specificity or true positive, true negative, false negative and false positive result were provided for patient-based analysis compared with standard; (d) the study should include ten or more patients; (e) only woman breast diagnosis is included.
Exclusion criteria
The studies were reviewed for the following exclusion criteria: (a) case reports, letters, comments, animal experiments, review studies, and original studies with incomplete data; (b) repeatedly published literature or similar literature.
Selection of studies and data extraction
Two investigators (GF and EM) independently assessed and included the potentially eligible studies according to the inclusion and exclusion criteria mentioned above after reading the title and abstract. For the equivocal studies, we read the full text to make a decision. If there was still a disagreement, a third investigator evaluated the results and reached a consensus. The same investigators independently extracted relevant data from the included studies based on a piloted form, with disagreement resolved through discussion with a third author.
We extracted the following data from each included study: (a) Frist author name, publication year, country, study design, sample size, mean age of study participants, (b) Diagnostic value of MMG and US, in terms of true positive, true negative, false negative and false positive for detection of breast cancer. (c) Type of US probe, probe frequency (MHz) and contrast agent were also extracted.
Quality assessment of each study and statistical analysis
The GF and EM independently assessed the quality of each included studies using QUADAS criteria [9]. There are 14 items in QUADAS criteria, and for each question there are three answers: “yes” “no”, and “unclear with scores of 1 for “yes” and 0 for “unclear” or “no”. When there was disagreement in the scoring of quality was solved by conciseness.
Statistical analysis
The diagnostic ability of each modality was assessed by calculating the pooled sensitivity, specificity and diagnostic odds ratio with their respective 95% confidence interval. Bivariate meta-analysis was used to determine a correlation between sensitivity and specificity for possible threshold effect [10]. The sensitivity and specificity of each study were used to plot a summary receiver operating characteristic (SROC) curve [11, 12]. Q* indexes (the point on the SROC curve where sensitivity and specificity are equal) were calculated. The higher the Q* value, the better the diagnostic test performance [12]. A random effects model was used to account a variance between studies and within the study. We used chi squared (X2) test to assess statistical heterogeneity of included studies at P-value < 0.10. We also calculated I-square (I2) statistic to reflect the percentage of total variation across the studies [13]. We set the acceptability of heterogeneity at I-square at 50%. We examined publication bias with the Deeks’ funnel plots and tested asymmetry with linear regression of log diagnostic odds ratios (DOR) on the inverse root of the effective sample size using egger’s test [14]. All statistical analyses were performed using Meta-Disc1.4, OpenMeta analyst current version and STATA version 13.
Results
Literature search
The computerized search yielded 7,065 primary studies including 5 studies identified by hand search selection, of which 7041 were excluded including duplication. The reasons for exclusion were as follows: (a) duplicated (n = 1066), (b) the aim of the articles was not to reveal the diagnostic value of MMG and US for identification and characterization of breast cancer (n = 5823); (b) the reference standard was not used as histopathologic analysis or close clinical and imaging follow-up for at least 6 months (n = 85); (c) data from the article that could be used to construct or calculate TP, FP, TN and FN (n = 47) were not found; (d) case reports, letters, editorials (n = 20). Finally, a total of 24 studies [15–38] were included, consisting of 19 studies for MMG and 20 studies for US (Fig. 1), because most of the studies have reported for both of imaging modalities.
Study characteristics
There were 17 retrospective studies, and 7 prospective studies in all included studies. A total of 6 researches were performed in Europe, 16 in Asia, 2 in USA and 1 in South America. In total, there were 18,203 patients in the included studies, with the publication year ranging from 2008 to 2021. The characteristics of the included studies are presented in Table 1 for MMG and in Table 2 for US.
Table 1.
Study characteristics of the included research for MMG
| Author | Year of publication | Country | Patients/lesions (n) | Mean age (range) | Imaging modalities | Study design | TP | FP | FN | TN |
|---|---|---|---|---|---|---|---|---|---|---|
| Ying | 2012 | China | 549/665 | 46 (12–92) | MMG | Retrospective | 201 | 61 | 45 | 358 |
| Wu | 2016 | China | 312 | 49 (27–85) | MMG | Prospective | 77 | 9 | 41 | 185 |
| Shao | 2013 | China | 90/90 | 53.2 ± 7.6 | MMG | Prospective | 40 | 13 | 15 | 22 |
| Mello | 2017 | Brazil | 664 | NA | MMG | Retrospective | 83 | 44 | 9 | 528 |
| Berg | 2012 | USA | 4814 | NA | MMG | Retrospective | 57 | 414 | 18 | 4325 |
| Habib | 2009 | Pakistan | 20 | 36.5 [17–80] | MMG | Retrospective | 11 | 4 | 1 | 4 |
| Lehman | 2012 | USA | 954/1208 | 35 [30–39] | MMG | Retrospective | 14 | 66 | 9 | 1119 |
| Zahid | 2009 | Pakistan | 210 | 35–60 | MMG | Retrospective | 40 | 6 | 12 | 152 |
| Yu | 2016 | China | 287 | 48.2 (32–75) | MMG | Retrospective | 127 | 40 | 41 | 79 |
| Ozulker | 2010 | Turkey | 46/29 | NA | MMG | Prospectively | 13 | 5 | 3 | 8 |
| Omranipour | 2016 | Iran | 132 | 49.5 ± 10.3 | MMG | Prospectively | 70 | 12 | 17 | 33 |
| Meissnitzer | 2015 | Austria | 67/92 | > 50 | MMG | Prospective | 57 | 18 | 10 | 7 |
| Tan | 2014 | China | 326 | 40–60 | MMG | Retrospective | 36 | 28 | 38 | 224 |
| Cho | 2016 | Korea | 162 | NA | MMG | Retrospective | 49 | 42 | 17 | 54 |
| Lee | 2012 | Korea | 107/474 | 49.63 ± 10.43 | MMG | Retrospective | 103 | 34 | 7 | 330 |
| Zhao | 2015 | China | 274 | NA | MMG | Retrospective | 117 | 37 | 15 | 105 |
| Park | 2014 | Korea | 114/118 | 49.6 ± 9.8 | MMG | Retrospective | 24 | 14 | 18 | 62 |
| Yao | 2014 | China | 2036 | > 35 | MMG | Retrospective | 374 | 27 | 104 | 1529 |
| Novikov | 2017 | Austria | 367 | NA | MMG | Prospective | 346 | 19 | 21 | 51 |
NA not assigned, MMG mammograpgy
Table 2.
Study characteristics of the included research for US
| Author | Year of publication | Country | Patients/lesions (n) | Mean age (range) | Imaging modality | Study design | TP | FP | FN | TN | Type of probe | Probe frequency (MHz) |
|---|---|---|---|---|---|---|---|---|---|---|---|---|
| Barco | 2016 | Spain | 1533 | 58.5 ± 13.3 [22–95] | US | Retrospective | 162 | 76 | 180 | 1115 | NA | 7.5–12 |
| Habib | 2009 | Pakistan | 22 | 36.5 [17–80] | US | Retrospective | 12 | 3 | 2 | 5 | NA | NA |
| Lehman | 2012 | USA | 954/1208 | 35 [30–39] | US | Prospective | 22 | 128 | 1 | 1057 | Linear | 12 |
| Sarica | 2014 | Turkey | 277 | 48 | US | Retrospective | 130 | 61 | 8 | 78 | NA | NA |
| Shao | 2013 | China | 90 | 53.2 ± 7.6 [26–85] | US | Prospective | 44 | 14 | 11 | 21 | Linear | 7.5- to 13 |
| Ying | 2012 | China | 549/665 | 50 [40–49] | US | Retrospective | 235 | 82 | 11 | 337 | NA | NA |
| Wu | 2016 | China | 312 | 49 (27–85) | US | Retrospective | 32 | 3 | 86 | 191 | Linear | 12 |
| Zahid | 2009 | Pakistan | 210 | 35–60 | US | Retrospective | 40 | 9 | 12 | 148 | NA | NA |
| Yu | 2016 | China | 287 | 48.2 (32–75) | US | Retrospective | 138 | 27 | 30 | 92 | NA | NA |
| Ozulker | 2010 | Turkey | 46/27 | NA | US | Prospectively | 11 | 1 | 5 | 10 | NA | NA |
| Meissnitzer | 2015 | Austria | 67/92 | > 50 | US | Prospective | 66 | 20 | 1 | 5 | Linear | 12–18 |
| Vassiou | 2009 | Greece | 69/78 | 39–78 | US | Prospectively | 44 | 6 | 6 | 21 | NA | 7–12 |
| Wang | 2015 | China | 86 | 44 (23–78) | US | Retrospective | 32 | 16 | 7 | 41 | NA | 9–13 |
| Tan | 2014 | China | 311/326 | 40–60 | US | Retrospective | 58 | 38 | 13 | 202 | NA | 7.5 |
| Zhao | 2015 | China | 274 | NA | US | Retrospective | 127 | 47 | 5 | 95 | NA | 10–18 Hz |
| Zhi | 2012 | China | 136 | 43 (18–86) | US | Retrospective | 52 | 6 | 2 | 52 | Linear | 7.5–15 |
| Cho | 2016 | Korea | 162 | NA | US | Retrospective | 58 | 19 | 8 | 77 | NA | NA |
| Lee | 2012 | Korea | 107/474 | 49.63 ± 10.43 | US | Retrospective | 108 | 47 | 2 | 317 | NA | NA |
| Park | 2014 | Korea | 114/118 | 49.6 ± 9.8 | US | Retrospective | 41 | 29 | 1 | 47 | NA | NA |
| Yao | 2014 | China | 2036 | > 35 | US | Retrospective | 399 | 108 | 81 | 1148 | NA | 25 |
NA not assigned, US ultrasound
Heterogeneity test and publication bias
We found considerable heterogeneity between studies included to pool sensitivity and specificity of MMG and US. For instance, the percentage of I2 statistics for MMG per-patient is 88.3% for pooled sensitivity and 97% for pooled specificity (Table 3). Therefore, there is significant heterogeneity between studies included for per-patient pooled sensitivity and pooled specificity of MMG, and US.
Table 3.
Assessment of heterogeneity and threshold effect of included articles
| Chi2 | df | p value | I2 index (%) | |
|---|---|---|---|---|
| Per patient | ||||
| Sensitivity | ||||
| MMG | 93.93 | 11 | 0..000 | 88.3 |
| US | 400.09 | 12 | 0.000 | 97 |
| Specificity | ||||
| MMG | 390.36 | 11 | 0.00 | 97.2 |
| US | 334.10 | 12 | 0.000 | 96.4 |
| Per lesion | ||||
| Sensitivity | ||||
| MMG | 67.41 | 6 | 0.000 | 91.1 |
| US | 30.30 | 6 | 0.000 | 80.2 |
| Specificity | ||||
| MMG | 106.18 | 6 | 0.000 | 94.3 |
| US | 50.26 | 6 | 0.000 | 88.1 |
Chi2 Chi-square, df degree of freedom, I2 I-square (inconsistency)
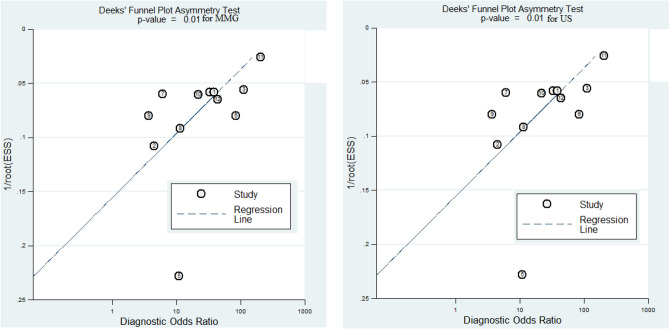
We assessed the funnel plot for asymmetry by visual inspection for US per-patient, in addition to the statistical Egger’s test. The funnel plot was appeared quite symmetrical and Egger’s test also showed evidence of no publication bias (Egger’s test, P = 0.70) (Fig. 2). However, there was significant publication bias for MMG per-patient. We couldn’t do publication bias for per-lesion basis because of small sample size associated with less statistical power.
Fig. 2.
Deek’s funnel plot for MMG and US per-patient basis
Quality assessment
Quality Assessment of Diagnostic Accuracy Studies (QUADAS) criteria were used to assess the quality of every article [9] (Fig. 3). The MMG studies were generally of moderate quality.
Fig. 3.
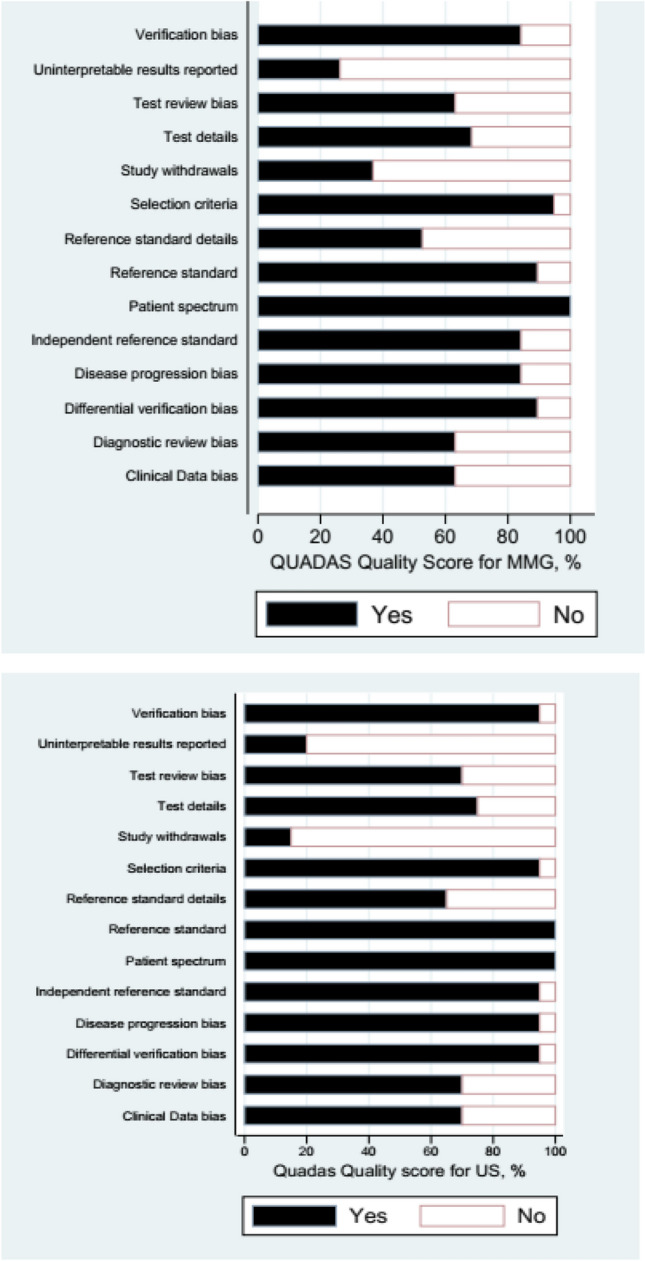
Quality score for mammography and ultrasound imaging modalties
Only 3 of the QUADAS items (reporting uninterpretable results, reference standard details, and reporting withdrawals) were met by less than 60% of the studies. All of the studies fulfilled at least 5 of the items, but none fulfilled all of them. About 60% of the included MMG studies fulfilled 8 or more of the 14 criteria.
The US studies were of high quality than the MMG studies. Only 2 of the items (reporting uninterpretable results, and reporting withdrawals selection criteria), were met less than by 20% of the studies. All of the MRI studies fulfilled at least 7 of the criteria, but none fulfilled all of them. Twenty of included US studies fulfilled 8 or more of the 14 criteria.
Pooled sensitivity, pooled specificity and DORs
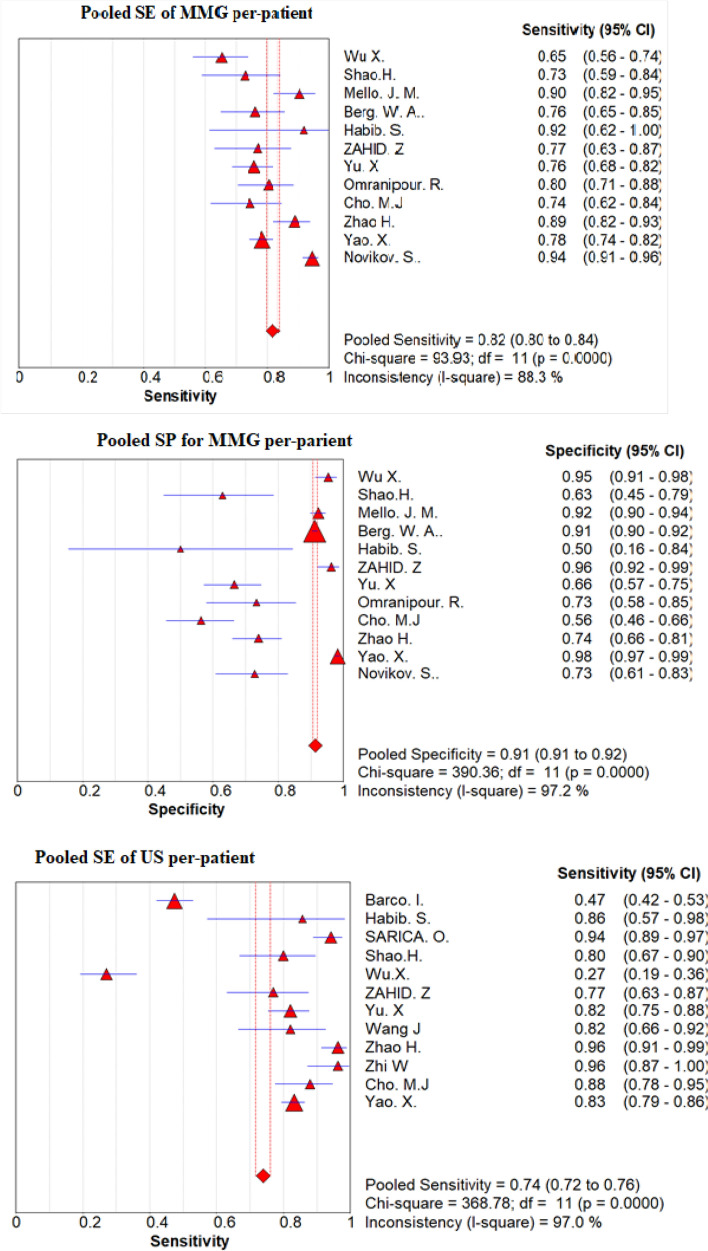
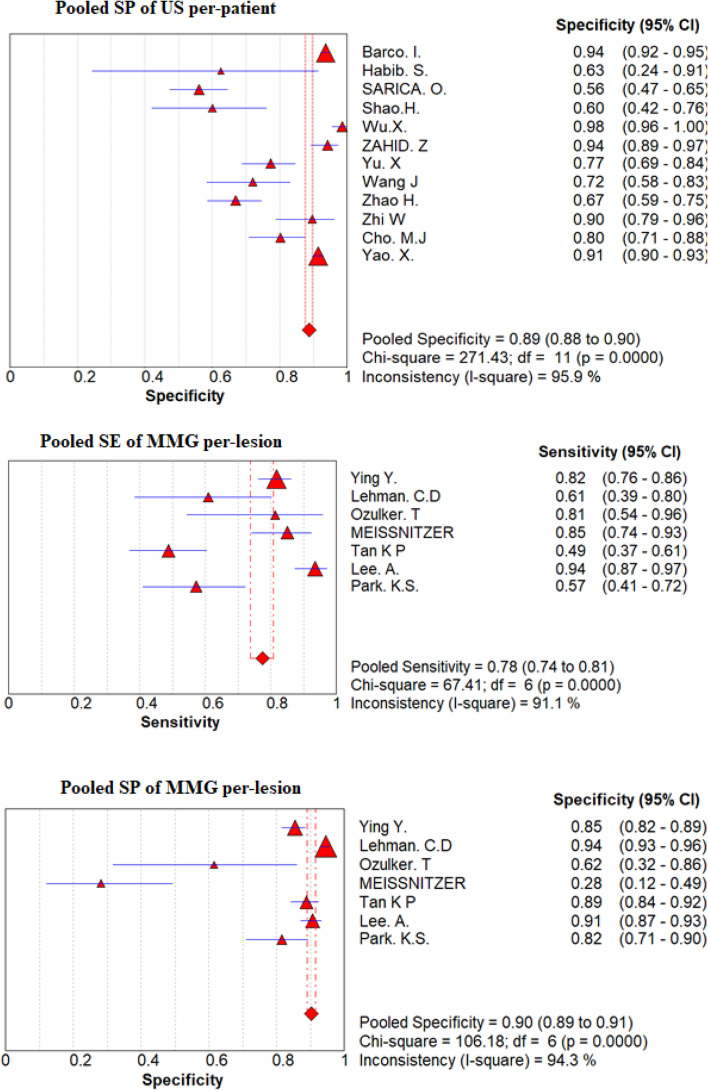
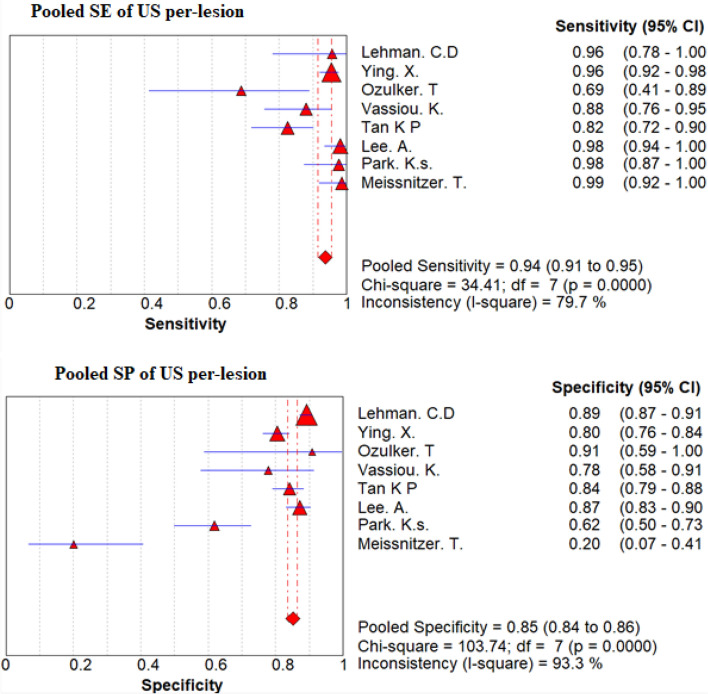
On the basis of a convectional random effect model, pooled sensitivity, and pooled specificity of those non-invasive modalities were shown in Fig. 4 and Table 4 for the convectional random effect method. The Pooled sensitivity of MMG and US per-lesion was 78% (95% CI 74–81%) and 94% (95% CI 85–97%), respectively, Pooled specificity per-lesion of MMG was 90% (95% CI 89–91%) and of US was 86% (95% CI 84–87%).
Fig. 4.
Forest plot of sensitivity and specificity of MMG and US per-patient and per-lesion for detecting breast cancer respectively
Table 4.
Diagnostic performance for MMG, and US on a per-patient and per-lesion basis
| Modality and group | Study numbers | Conventional meta-analysis summary | Bivariate meta-analysis summary | ||||||
|---|---|---|---|---|---|---|---|---|---|
| Sensitivity (95% CI) | Specificity (95% CI) | DOR (95% CI) | AUC | Q* | Sensitivity (95% CI) | Specificity (95% CI) | Correlation | ||
| Perpatient | |||||||||
| MMG | 12 | 0.82 (0.80–0.84) | 0.91 (0.91–0.92) | 24.34 (10.555–56.127) | 0.8933 | 0.8242 | 0.82 (0.76–0.87) | 0.84 (0.73–0.92) | − 0.2587 |
| US | 13 | 0.74 (0.72–0.76) | 0.89 (0.88–0.90) | 24.19 (14.824–39.463) | 0.8998 | 0.8310 | 0.83 (0.71–0.91) | 0.84 (0.74–0.91) | − 0.8085 |
| Per lesion | |||||||||
| MMG | 7 | 0.78 (0.74–0.81) | 0.90 (0.89–0.91) | 13.84 (5.577–34.357) | 0.8503 | 0.7814 | 0.76 (0.62–0.86) | 0.82 (0.66–0.91) | − 0.3041 |
| US | 7 | 0.94 (0.91–0.95) | 0.85 (0.84–0.86) | 63.219 (27.949–142.99) | 0.9138 | 0.8463 | 0.94 (0.87–0.97) | 0.79 (0.63–0.89 | − 0.6907 |
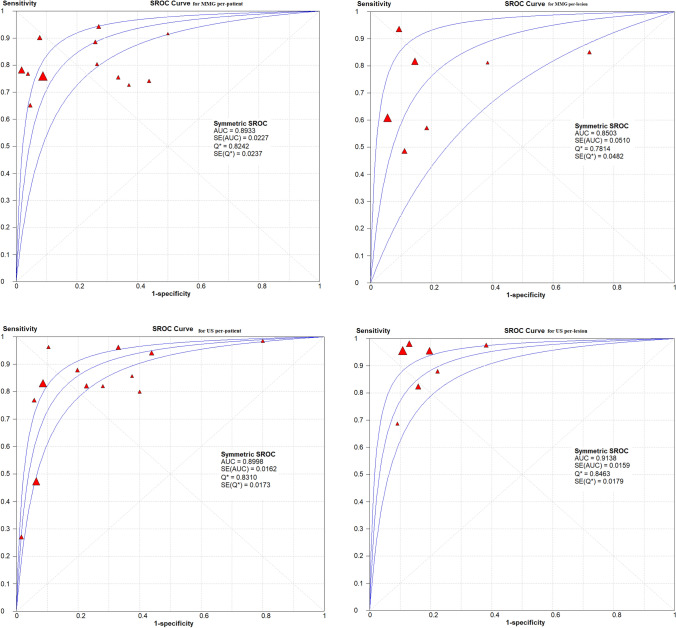
The bivariate meta-analysis summary of sensitivity and specificity per-patient was 82% (95% CI 0.76–0.87) and 84% (95% CI 0.71–0.91) for MMG with correlation of − 0.2587 and 83% (95% CI 0.71–0.91) and 84% (95% CI 0.74–0.91) for US with correlation of − 0.8085 respectively. Summary of sensitivity and specificity per-lesion was 76% (95% CI 0.62–0.86) and 82% (95% CI 0.66–0.91) for MMG with correlation of − 0.3041 and 94% (95% CI 0.87–0.97) and 84% (95% CI 0.74–0.91) for US with correlation of − 0.6907 respectively (Table 4.)
Summary ROC curves, AUC, DOR and the Q* index
Summary receiver operating characteristic analysis was used to compare those non-invasive modalities. AUC for per-lesion of MMG and US was 0.8503 and 0.9138, respectively; US had highest AUC when compared with MMG. The Q* index estimates for MMG was 0.7814, and for US was 0.8463. Like DOR, AUC, the Q* index estimates for US was higher than for MMG (Table 4; Fig. 5).
Fig. 5.
The SROC curves for MMG and US on a per-patient and per-lesion basis. Each solid triangle represents each study in the meta-analysis. The size of the triangle indicates the study size. The AUC and Q* for MMG and US were 0.9549, 0.8852, 0.8573 and 0.8972, 0.8158, 0.7882 respectively. PET/CT showed better diagnostic accuracy than others
Discussion
Our meta-analysis suggests that US has better sensitivity, DOR, AUC and Q* than MMG for the per-lesion. Therefore, US is advantageous for detecting and ruling out clinically relevant breast cancer. The DOR is one of the parameters used to test the accuracy that combines the data from sensitivity and specificity into a single number [39]. DOR is the ratio of the odds of positivity in disease to the odds of positivity in the non-diseased and has a value that ranges from 0 to infinity, with higher values indicating higher accuracy.
A bivariate random-effects model to study for the correlation between sensitivity and specificity observed across studies that is because of the functional relationship between the two at a given threshold within each study. Sensitivity and specificity are often negatively correlated within studies [12]. One possible cause for this negative correlation between sensitivity and specificity is that studies may have used different thresholds to define positive and negative test results. The model consider two levels of statistical distribution of variance to solve the problem: At first level, a binomial distribution and logistic transformation of sizes preserves the shared characteristics within each study that associate sensitivity and specificity, taking the correlation between the two, as well as the absolute values observed in each study, and the heterogeneity (variance) between studies beyond that accounted for by sampling variability at the first [40]. Our meta-analysis result showed that threshold effect was prominent over the US studies with the correlation of − 0.8085 for per-patient and − 0.6907 per-lesion.
As evidence accumulates in breast cancer screening and detection, a systematic review and meta-analysis can more effectively compare the diagnostic value of MMG and US imaging in detecting breast cancer and provide better evidence-based advice for physicians. This meta-analysis focused on evaluating the diagnostic performance of convectional MMG and US, the widely used non-invasive modalities for the detection of breast cancer. According to Table 3, there were significantly high heterogeneity between included studies for MMG and US, possibly due to different threshold settings associated with those studies. Thus, random-effects model, which accounted not only for the heterogeneity but also for the error of estimation of these indexes for diagnostic study was selected [41]. However, absence of a relevant covariate in the included studies, is a limitation of this approach which make it impossible to carry out subgroup analysis. Moreover, there is not an accepted gold standard, which may be a universal drawback to all modalities included in this study for detecting breast cancer. Therefore, we had to use reference standard as histopathologic analysis and/or close clinical and imaging follow-up for at least 6 months.
The sensitivity, specificity and AUC of MMG were 75%, 71% and 0.78 according to meta-analysis done for diagnostic accuracy of magnetic resonance imaging (MRI) and MMG for breast cancer patients respectively [42]. This finding is consistent with our findings of pooled sensitivity, and AUC on a per-lesion basis, but with higher specificity. Previous studies have discussed the diagnosis ability of MMG in detecting breast cancer; Zhang and Ren [43] conducted a study to evaluate accuracy of mammography screening for breast cancer, revealed a sensitivity of 81% and a specificity of 96%. Moreover, Kang et al.[44] presented similar results with 82 and 93% the diagnostic sensitivity and specificity of MMG in breast cancer screening in Asian women. Again this finding is consistent with our findings of pooled sensitivity, and specificity on a per-patient basis which is 82 and 91%.
Ultrasound (US) is an excellent method for assessing palpable abnormalities, differentiating between cystic and solid lesions, and classifying solid masses. Previous study have reported the sensitivity (89%) and specificity (88%) of 3-D ultrasound in benign and malignant breast [45]. Li et al. [46] also demonstrated a meta-analysis for direct comparison between contrast-enhanced ultrasound and convectional ultrasound, the result showed that the sensitivity and specificity of convectional ultrasound was 86 and 72%. US imaging has a great importance in diagnosing breast lesions as benign or malignant and can further improve early breast cancer detection [47]. Moreover, study conducted by Sadigh et al. [48] on the accuracy of quantitative ultrasound for differentiation of malignant and benign breast abnormalities and presented a summary sensitivity and specificity 88% (95% (CI) 84–91%), and 83% (95% CI 78–88%), respectively. Finding of these studies are almost collinear with our finding of lesion-based analysis of sensitivity and specificity were 94% (95% (CI) 91–95%) and 85% (95% (CI) 84–87%) respectively.
Researches have been widely reported that ultrasonography is more sensitive than mammography in breast cancer diagnosis [20, 49–51]. Although the specificity of mammography is higher than that of ultrasonography [52] in the view of breast cancer screening, the higher sensitivity is more beneficial for early diagnosis of breast cancer. Moreover, due to its non-radiation exposure, its low cost than mammography and its ability to monitor the shape, size, border and blood flow situation of the tumors dynamically that are occult on mammography, ultrasonography, an alternative imaging modality that is widely used [53].
Our meta-analysis had some drawbacks. Firstly, some relevant articles might have been omitted even though we tried our best to retrieve medical literature. Secondly, the impact of patient characteristics could not be examined due to lack of data. Thirdly, the reference standard used in this systematic review ranged from histopathologic analysis to follow-up. Fourthly, most results showed heterogeneity, suggesting the needs for high-quality prospective studies and multi-center trials. Unfortunately, it is difficult for us to find the exact source of heterogeneity due to the limited information. Fifthly, the possibility of publications bias occurred in our meta-analysis. Finally, further cost-effectiveness analysis should be conducted regarding to the surveillance techniques in the breast cancer.
Conclusion
This meta-analysis focused on evaluating the diagnostic performance of convectional MMG and US, the widely used non-invasive modalities for the detection of breast cancer to provide better evidence-based advice for physicians. Our finding indicates that US and MMG has similar diagnostic performance in detecting breast cancer on per-patient basis after corrected threshold effect. However, on a per-lesion basis US was found to have better diagnostic accuracy than MMG.
Funding
This study was not received any external fund.
Declarations
Conflict of interest
The authors declare that there is no conflict of interest.
Ethics approval and informed consent
Not applicable.
Consent for publication
Not applicable.
Footnotes
Publisher's Note
Springer Nature remains neutral with regard to jurisdictional claims in published maps and institutional affiliations.
Contributor Information
Getu Ferenji Tadesse, Email: ofjan2007@gmail.com.
Eyachew Misganew Tegaw, Email: eyachew1@yahoo.com.
Ejigu Kebede Abdisa, Email: ejigukebede@gmail.com.
References
- 1.Jemal A, Bray F, Center MM, Ferlay J, Ward E, Forman D. Global cancer statistics. CA Cancer J Clin. 2011;61(2):69–90. doi: 10.3322/caac.20107. [DOI] [PubMed] [Google Scholar]
- 2.Saslow D, Boetes C, Burke W, Harms S, Leach MO, Lehman CD, Morris E, Pisano E, Schnall M, Sener S. American Cancer Society guidelines for breast screening with MRI as an adjunct to mammography. CA Cancer J Clin. 2007;57(2):75–89. doi: 10.3322/canjclin.57.2.75. [DOI] [PubMed] [Google Scholar]
- 3.Bray F, Ferlay J, Soerjomataram I, Siegel RL, Torre LA, Jemal A. Global cancer statistics 2018: GLOBOCAN estimates of incidence and mortality worldwide for 36 cancers in 185 countries. CA Cancer J Clin. 2018;68(6):394–424. doi: 10.3322/caac.21492. [DOI] [PubMed] [Google Scholar]
- 4.Devolli-Disha E, Manxhuka-Kërliu S, Ymeri H, Kutllovci A. Comparative accuracy of mammography and ultrasound in women with breast symptoms according to age and breast density. Bosn J Basic Med Sci. 2009;9(2):131. doi: 10.17305/bjbms.2009.2832. [DOI] [PMC free article] [PubMed] [Google Scholar]
- 5.Ravishankar N, Shivakumar S, Divakar S, Gaud JA. Comparative study between accuracy of mammography and USG in preoperative assessment of breast cancer.
- 6.Badgwell BD, Giordano SH, Duan ZZ, Fang S, Bedrosian I, Kuerer HM, Singletary SE, Hunt KK, Hortobagyi GN, Babiera G. Mammography before diagnosis among women age 80 years and older with breast cancer. J Clin Oncol. 2008;26(15):2482–2488. doi: 10.1200/JCO.2007.12.8058. [DOI] [PubMed] [Google Scholar]
- 7.Schonberg MA, Ramanan RA, McCarthy EP, Marcantonio ER. Decision making and counseling around mammography screening for women aged 80 or older. J Gen Intern Med. 2006;21(9):979–985. doi: 10.1007/BF02743148. [DOI] [PMC free article] [PubMed] [Google Scholar]
- 8.Liberati A, Altman DG, Tetzlaff J, Mulrow C, Gøtzsche PC, Ioannidis JP, Clarke M, Devereaux PJ, Kleijnen J, Moher D. The PRISMA statement for reporting systematic reviews and meta-analyses of studies that evaluate health care interventions: explanation and elaboration. PLoS Med. 2009;6(7):e1000100. doi: 10.1371/journal.pmed.1000100. [DOI] [PMC free article] [PubMed] [Google Scholar]
- 9.Whiting P, Rutjes AW, Reitsma JB, Bossuyt PM, Kleijnen J. The development of QUADAS: a tool for the quality assessment of studies of diagnostic accuracy included in systematic reviews. BMC Med Res Methodol. 2003;3(1):25. doi: 10.1186/1471-2288-3-25. [DOI] [PMC free article] [PubMed] [Google Scholar]
- 10.Sadeghi R, Treglia G. Systematic reviews and meta-analyses of diagnostic studies: a practical guideline. Clin Transl Imaging. 2017;5(2):83–87. doi: 10.1007/s40336-016-0219-2. [DOI] [Google Scholar]
- 11.Moses LE, Shapiro D, Littenberg B. Combining independent studies of a diagnostic test into a summary ROC curve: data-analytic approaches and some additional considerations. Stat Med. 1993;12(14):1293–1316. doi: 10.1002/sim.4780121403. [DOI] [PubMed] [Google Scholar]
- 12.Reitsma JB, Glas AS, Rutjes AW, Scholten RJ, Bossuyt PM, Zwinderman AH. Bivariate analysis of sensitivity and specificity produces informative summary measures in diagnostic reviews. J Clin Epidemiol. 2005;58(10):982–990. doi: 10.1016/j.jclinepi.2005.02.022. [DOI] [PubMed] [Google Scholar]
- 13.Higgins JP, Thompson SG. Quantifying heterogeneity in a meta-analysis. Stat Med. 2002;21(11):1539–1558. doi: 10.1002/sim.1186. [DOI] [PubMed] [Google Scholar]
- 14.Egger M, Smith GD, Schneider M, Minder C. Bias in meta-analysis detected by a simple, graphical test. BMJ. 1997;315(7109):629–634. doi: 10.1136/bmj.315.7109.629. [DOI] [PMC free article] [PubMed] [Google Scholar]
- 15.Barco I, Chabrera C, García-Fernández A, Fraile M, González S, Canales L, Lain JM, González C, Vidal MC, Vallejo E, Deu J, Pessarrodona A, Giménez N, García Font M. Role of axillary ultrasound, magnetic resonance imaging, and ultrasound-guided fine-needle aspiration biopsy in the preoperative triage of breast cancer patients. Clin Transl Oncol. 2017;19(6):704–710. doi: 10.1007/s12094-016-1589-7. [DOI] [PubMed] [Google Scholar]
- 16.Berg WA, Madsen KS, Schilling K, Tartar M, Pisano ED, Larsen LH, Narayanan D, Kalinyak JE. Comparative effectiveness of positron emission mammography and MRI in the contralateral breast of women with newly diagnosed breast cancer. AJR Am J Roentgenol. 2012;198(1):219–232. doi: 10.2214/ajr.10.6342. [DOI] [PubMed] [Google Scholar]
- 17.Cho MJ, Yang JH, Yu YB, Park KS, Chung HW, So Y, Choi N, Kim MY. Validity of breast-specific gamma imaging for breast imaging reporting and data system 4 lesions on mammography and/or ultrasound. Ann Surg Treat Res. 2016;90(4):194–200. doi: 10.4174/astr.2016.90.4.194. [DOI] [PMC free article] [PubMed] [Google Scholar]
- 18.Habib S, Maseeh Z, Hameed A, Niaz K, Hashmi H, Kamal S. Diagnostic accuracy of Tc-99m-MIBI for breast carcinoma in correlation with mammography and sonography. J Coll Physicians Surg Pak. 2009;19(10):622–626. doi: 10.2009/jcpsp.622626. [DOI] [PubMed] [Google Scholar]
- 19.Lee A, Chang J, Lim W, Kim BS, Lee JE, Cha ES, Moon BI. Effectiveness of breast-specific gamma imaging (BSGI) for breast cancer in Korea: a comparative study. Breast J. 2012;18(5):453–458. doi: 10.1111/j.1524-4741.2012.01280.x. [DOI] [PubMed] [Google Scholar]
- 20.Lehman CD, Lee CI, Loving VA, Portillo MS, Peacock S, Demartini WB. Accuracy and value of breast ultrasound for primary imaging evaluation of symptomatic women 30–39 years of age. Am J Roentgenol. 2012;199(5):1169–1177. doi: 10.2214/AJR.12.8842. [DOI] [PubMed] [Google Scholar]
- 21.Meissnitzer T, Seymer A, Keinrath P, Holzmannhofer J, Pirich C, Hergan K, Meissnitzer MW. Added value of semi-quantitative breast-specific gamma imaging in the work-up of suspicious breast lesions compared to mammography, ultrasound and 3-T MRI. Br J Radiol. 2015;88(1051):20150147. doi: 10.1259/bjr.20150147. [DOI] [PMC free article] [PubMed] [Google Scholar]
- 22.Mello JMRB, Bittelbrunn FP, Rockenbach MABC, May GG, Vedolin LM, Kruger MS, Soldatelli MD, Zwetsch G, de Miranda GTF, Teixeira SIP, Arruda BS. Breast cancer mammographic diagnosis performance in a public health institution: a retrospective cohort study. Insights Imaging. 2017;8(6):581–588. doi: 10.1007/s13244-017-0573-2. [DOI] [PMC free article] [PubMed] [Google Scholar]
- 23.Omranipour R, Kazemian A, Alipour S, Najafi M, Alidoosti M, Navid M, Alikhassi A, Ahmadinejad N, Bagheri K, Izadi S. Comparison of the accuracy of thermography and mammography in the detection of breast cancer. Breast Care. 2016;11(4):260–264. doi: 10.1159/000448347. [DOI] [PMC free article] [PubMed] [Google Scholar]
- 24.Ozulker T, Ozulker F, Ozpacaci T, Bender O, Degirmenci H. The efficacy of (99m)Tc-MIBI scintimammography in the evaluation of breast lesions and axillary involvement: a comparison with X-rays mammography, ultrasonography and magnetic resonance imaging. Hell J Nucl Med. 2010;13(2):144–149. [PubMed] [Google Scholar]
- 25.Park KS, Chung HW, Yoo YB, Yang JH, Choi N, So Y. Complementary role of semiquantitative analysis of breast-specific gamma imaging in the diagnosis of breast cancer. AJR Am J Roentgenol. 2014;202(3):690–695. doi: 10.2214/ajr.13.11324. [DOI] [PubMed] [Google Scholar]
- 26.Sarica O, Uluc F. Additional diagnostic value of MRI in patients with suspicious breast lesions based on ultrasound. Br J Radiol. 2014 doi: 10.1259/bjr.20140009. [DOI] [PMC free article] [PubMed] [Google Scholar]
- 27.Shao H, Li B, Zhang X, Xiong Z, Liu Y, Tang G. Comparison of the diagnostic efficiency for breast cancer in Chinese women using mammography, ultrasound, MRI, and different combinations of these imaging modalities. J Xray Sci Technol. 2013;21(2):283–292. doi: 10.3233/xst-130376. [DOI] [PubMed] [Google Scholar]
- 28.Tan K, Mohamad ZA, Rumaisa M, Siti MAM, Radhika S, Nurismah M, Norlia A, Zulfiqar M. The comparative accuracy of ultrasound and mammography in the detection of breast cancer. Med J Malay. 2014;69(2):79–85. [PubMed] [Google Scholar]
- 29.Vassiou K, Kanavou T, Vlychou M, Poultsidi A, Athanasiou E, Arvanitis DL, Fezoulidis IV. Characterization of breast lesions with CE-MR multimodal morphological and kinetic analysis: comparison with conventional mammography and high-resolution ultrasound. Eur J Radiol. 2009;70(1):69–76. doi: 10.1016/j.ejrad.2008.01.012. [DOI] [PubMed] [Google Scholar]
- 30.Wang J, Chen H, Wu X, Tang L. Comparison of diagnostic efficiency of breast cancer imaging in chinese women: digital mammography, ultrasound, MRI, and combinations of these modalities. J Med Imaging Health Inform. 2015;5(7):1488–1493. doi: 10.1166/jmihi.2015.1564. [DOI] [Google Scholar]
- 31.Wu X, Lin Q, Lu J, Chen G, Zeng Y, Lin Y, Chen Y, Wang Y, Yan J. Comparison of mammography and ultrasound in detecting residual disease following bioptic lumpectomy in breast cancer patients. Mol Clin Oncol. 2016;4(3):419–424. doi: 10.3892/mco.2016.729. [DOI] [PMC free article] [PubMed] [Google Scholar]
- 32.Ying X, Lin Y, Xia X, Hu B, Zhu Z, He P. A comparison of mammography and ultrasound in women with breast disease: a receiver operating characteristic analysis. Breast J. 2012;18(2):130–138. doi: 10.1111/j.1524-4741.2011.01219.x. [DOI] [PubMed] [Google Scholar]
- 33.Yu X, Hu G, Zhang Z, Qiu F, Shao X, Wang X, Zhan H, Chen Y, Deng Y, Huang J. Retrospective and comparative analysis of 99m Tc-Sestamibi breast specific gamma imaging versus mammography, ultrasound, and magnetic resonance imaging for the detection of breast cancer in Chinese women. BMC Cancer. 2016;16(1):450. doi: 10.1186/s12885-016-2537-1. [DOI] [PMC free article] [PubMed] [Google Scholar]
- 34.Zahid Z, Ibrahim Z, Bilal S, Farooq M. Comparison of diagnostic accuracy of film-screen mammography and ultrasound in breast masses. Pak J Med Health Sci. 2011;5(3):433–435. [Google Scholar]
- 35.Zhao H, Zou L, Geng X, Zheng S. Limitations of mammography in the diagnosis of breast diseases compared with ultrasonography: a single-center retrospective analysis of 274 cases. Eur J Med Res. 2015;20(1):49. doi: 10.1186/s40001-015-0140-6. [DOI] [PMC free article] [PubMed] [Google Scholar]
- 36.Zhi W, Gu X, Qin J, Yin P, Sheng X, Gao SP, Li Q. Solid breast lesions: clinical experience with US-guided diffuse optical tomography combined with conventional US. Radiology. 2012;265(2):371–378. doi: 10.1148/radiol.12120086. [DOI] [PubMed] [Google Scholar]
- 37.Novikov S, Kanaev S, Chernaya A, Krzhivitskiy P, Krivorotko P, Jukova L, Artemyeva A. Diagnostic accuracy of mammography and scintimammography with 99M Tc-MIBI in detection of early breast cancer. Eur J Nucl Med Mol Imaging. 2017;44(2):S655–S656. doi: 10.1007/s00259-017-3822-1. [DOI] [Google Scholar]
- 38.Yao X, Wei W, Li J, Wang L, Xu Z, Wan Y, Li K, Sun S. A comparison of mammography, ultrasonography, and far-infrared thermography with pathological results in screening and early diagnosis of breast cancer. Asian Biomed. 2014;8(1):11–19. doi: 10.5372/1905-7415.0801.257. [DOI] [Google Scholar]
- 39.Glas AS, Lijmer JG, Prins MH, Bonsel GJ, Bossuyt PM. The diagnostic odds ratio: a single indicator of test performance. J Clin Epidemiol. 2003;56(11):1129–1135. doi: 10.1016/S0895-4356(03)00177-X. [DOI] [PubMed] [Google Scholar]
- 40.Lee J, Kim KW, Choi SH, Huh J, Park SH. Systematic review and meta-analysis of studies evaluating diagnostic test accuracy: a practical review for clinical researchers-part II. Statistical methods of meta-analysis. Korean J Radiol. 2015;16(6):1188–1196. doi: 10.3348/kjr.2015.16.6.1188. [DOI] [PMC free article] [PubMed] [Google Scholar]
- 41.Liu T, Xu J-Y, Xu W, Bai Y-R, Yan W-L, Yang H-L. Fluorine-18 deoxyglucose positron emission tomography, magnetic resonance imaging and bone scintigraphy for the diagnosis of bone metastases in patients with lung cancer: which one is the best?—a meta-analysis. Clin Oncol. 2011;23(5):350–358. doi: 10.1016/j.clon.2010.10.002. [DOI] [PubMed] [Google Scholar]
- 42.Zhang Y, Ren H. Meta-analysis of diagnostic accuracy of magnetic resonance imaging and mammography for breast cancer. J Cancer Res Ther. 2017;13(5):862. doi: 10.4103/jcrt.JCRT_678_17. [DOI] [PubMed] [Google Scholar]
- 43.Zhu C, Wang L, Du L, Li J, Zhang J, Dai M, Shi J. The accuracy of mammography screening for breast cancer: a meta-analysis. JAMA. 2016;37:1296–1305. doi: 10.3760/cma.j.issn.0254-6450.2016.09.022. [DOI] [PubMed] [Google Scholar]
- 44.Kang M, Pang Y, Li J-Y, Liu L-H, Liu X-T. Accuracy evaluation of mammography in the breast cancer screening in Asian women: a community-based follow-up study and meta analysis. JAMA. 2010;305:790–799. [PubMed] [Google Scholar]
- 45.Fu J, Li Y, Li N, Li Z. Comprehensive analysis of clinical utility of three-dimensional ultrasound for benign and malignant breast masses. Cancer Manag Res. 2018;10:3295. doi: 10.2147/CMAR.S176494. [DOI] [PMC free article] [PubMed] [Google Scholar]
- 46.Li Q, Hu M, Chen Z, Li C, Zhang X, Song Y, Xiang F. Meta-analysis: contrast-enhanced ultrasound versus conventional ultrasound for differentiation of benign and malignant breast lesions. Ultrasound Med Biol. 2018;2:2. doi: 10.1016/j.ultrasmedbio.2018.01.022. [DOI] [PubMed] [Google Scholar]
- 47.Guo R, Lu G, Qin B, Fei B. Ultrasound imaging technologies for breast cancer detection and management: a review. Ultrasound Med Biol. 2018;44(1):37–70. doi: 10.1016/j.ultrasmedbio.2017.09.012. [DOI] [PMC free article] [PubMed] [Google Scholar]
- 48.Sadigh G, Carlos RC, Neal CH, Dwamena BA. Accuracy of quantitative ultrasound elastography for differentiation of malignant and benign breast abnormalities: a meta-analysis. Breast Cancer Res Treat. 2012;134(3):923–931. doi: 10.1007/s10549-012-2020-x. [DOI] [PubMed] [Google Scholar]
- 49.Huang Y, Kang M, Li H, Li J, Zhang J, Liu L, Liu X, Zhao Y, Wang Q, Li C. Combined performance of physical examination, mammography, and ultrasonography for breast cancer screening among Chinese women: a follow-up study. Curr Oncol. 2012;19(2):S22. doi: 10.3747/co.19.1137. [DOI] [PMC free article] [PubMed] [Google Scholar]
- 50.Kang DK, Jeon GS, Yim H, Jung YS. Diagnosis of the intraductal component of invasive breast cancer: assessment with mammography and sonography. J Ultrasound Med. 2007;26(11):1587–1600. doi: 10.7863/jum.2007.26.11.1587. [DOI] [PubMed] [Google Scholar]
- 51.Ya-jie J, Wei-jun P, Cai C, Jian-hui D, Wei Z, Min C, Guang-yu L. Application of breast ultrasound in a mammography-based Chinese breast screening study. Cell Biochem Biophys. 2013;65(1):37–41. doi: 10.1007/s12013-012-9400-z. [DOI] [PubMed] [Google Scholar]
- 52.Birdwell RL. The preponderance of evidence supports computer-aided detection for screening mammography. Radiology. 2009;253(1):9–16. doi: 10.1148/radiol.2531090611. [DOI] [PubMed] [Google Scholar]
- 53.Wang F-L, Chen F, Yin H, Xu N, Wu X-X, Ma J-J, Gao S, Tang J-H, Lu C. Effects of age, breast density and volume on breast cancer diagnosis: a retrospective comparison of sensitivity of mammography and ultrasonography in Chinas rural areas. Asian Pac J Cancer Prev. 2013;14(4):2277–2282. doi: 10.7314/APJCP.2013.14.4.2277. [DOI] [PubMed] [Google Scholar]


