

Abstract
Interrelations between alcohol use disorder and chronic pain have received increasing empirical attention, and several lines of evidence support the possibility of shared genetic liability. However, research on the genetic contributions to the component processes of these complex and potentially overlapping phenotypes remains scarce. The goal of the current study was to test polygenic risk scores (PRSs) for alcohol consumption and multisite chronic pain as predictors of ad lib drinking behavior during an experimental taste test. PRSs were calculated for 209 pain-free, moderate-to-heavy drinkers (57.9% male; 63.6% White). Among White participants, the alcohol and chronic pain PRSs showed nominally significant (ps < 0.05) positive associations with the volume of alcohol consumed and peak blood alcohol concentration (BAC), respectively. However, associations did not survive correction for multiple comparisons. When stratifying results by experimental condition (between-subjects design: no-pain vs. pain), the alcohol PRS was significantly and negatively associated with the volume of alcohol poured, consumed, and peak BAC among Black participants randomized to the no-pain condition (all FDRp < 0.05). Conversely, the chronic pain PRS was significantly and positively associated with study outcomes among White participants in both the no-pain (alcohol consumed; FDRp = 0.037) and pain conditions (peak BAC; FDRp = 0.017). These findings lend partial support to the assertion that alcohol consumption in the laboratory is reflective of drinking behavior in naturalistic settings. This was also the first study to use a pain-related PRS to predict alcohol outcomes, which may be indicative of shared etiology between base and target traits.
Keywords: alcohol, pain, polygenic risk
Alcohol use and pain are both prevalent and frequently co-occur (Edwards et al., 2020). As such, the study of their interplay has become a burgeoning area of research. An established reciprocal model suggests alcohol consumption and pain interact in the manner of a positive-feedback loop, giving rise to increased drinking and greater pain over time (Ditre et al., 2019; Zale et al., 2015). Consistent with this framework, Egli, Koob, and Edwards (2012) have reviewed evidence that alcohol dependence and chronic pain share overlapping neural substrates, and proposed an allostatic load model in which recurrent episodes of alcohol intoxication and withdrawal engender pathological changes to stress and reward neurocircuitry. This model further emphasizes the role of genetics in the initial homeostatic responses to alcohol and painful injury, as well as the parameters involved in allostatic load development (Egli et al., 2012).
Twin studies indicate that approximately 50% of the variability in alcohol use disorder (AUD) and 25% - 50% of the variability in chronic pain are due to genetic factors (Nielsen et al., 2012; Verhulst et al., 2015). Given the notable heritability estimates and neurobiological overlap between these conditions (Egli et al., 2012), some genetic variants may confer risk for both AUD and chronic pain (Yeung et al., 2017). A review of genetic association studies highlights the possibility of shared genetic liability, and polymorphisms within genes involved in dopamine (e.g., ANKK1) and opioid (e.g., OPRM1) neurotransmitter systems were recognized as having the strongest overlap in regard to AUD and chronic pain (Yeung et al., 2017). However, genetic investigations of alcohol- and pain-related phenotypes have progressed largely independent of one another in the form of candidate-gene association studies and genome-wide association studies (GWASs; e.g., Johnston et al., 2019; Liu et al., 2019).
The utilization of polygenic risk scores (PRSs) has become an increasingly popular method of estimating genetic susceptibility to disease and assessing shared etiology between phenotypes (Choi et al., 2020). Using prior GWAS summary statistics, PRSs are typically calculated as the effect-size-weighted sum of trait-associated alleles an individual possesses (Chatterjee et al., 2016). As predictors of trait values or disease risk, these aggregate measures usually have greater discriminative ability than single markers (Dudbridge, 2013). First applied in schizophrenia (Purcell et al., 2009), PRSs are now being implemented in alcohol and pain research. For example, PRSs derived from GWASs of alcohol dependence, alcohol consumption, and risky behaviors have accounted for approximately 2.5 – 3.5% of the variance in AUD in the Collaborative Study on the Genetics of Alcoholism (COGA) and FinnTwin12 (FT12) samples (Barr et al., 2020). Similarly, PRS analyses have demonstrated genetic overlap between chronic post-surgical pain and conditions such as rheumatoid arthritis and chronic widespread pain (van Reij et al., 2020).
Interrelations between AUD and chronic pain have garnered increasing empirical attention over the past ten years (Edwards et al., 2020; Egli et al., 2012; Zale et al., 2015). Nationally representative longitudinal data suggest that drinkers who ceased alcohol consumption over a three-year follow-up period displayed reduced bodily pain at the subsequent wave (Imtiaz, Loheswaran, Le Foll, & Rehm, 2018), and pain interference has been observed to be prospectively associated with AUD development (McDermott et al., 2018). However, there remains a dearth of research into the genetic contributions to the component processes of these complex and potentially overlapping phenotypes. The goal of the current study was to test the hypothesis that polygenic risk for alcohol consumption and multisite chronic pain would be positively associated with ad lib drinking behavior during an experimental taste test. Given that the effects of PRSs may vary under certain environmental conditions (e.g., Salvatore et al., 2014), an exploratory aim was to evaluate the role of concurrent pain induction in the putative associations between PRSs and ad lib alcohol consumption. Analyses were performed using data collected from a primary study of bidirectional pain-alcohol effects among pain-free, moderate-to-heavy drinkers (R01AA024844).
Method
Participant Recruitment and Procedure
Participants were recruited via newspaper and internet advertisements for a primary experimental study on bidirectional alcohol-pain effects. This study was approved by the Institutional Review Board at Syracuse University. Eligibility was initially assessed by telephone and included the following inclusion criteria: (1) 21 – 65 years of age; and (2) classified as a moderate or heavy drinker as per the Quantity-Frequency Variability Index (QFV; Cahalan, Cisin, & Crossley, 1969). Exclusion criteria included: (1) current acute or chronic pain; (2) current use of prescription pain medications; (3) current pregnancy; (4) self-reported history of or treatment for psychiatric or alcohol/other drug problems; or (5) medical conditions or use of medications that contraindicate the use of alcohol. Following telephone screening, eligible participants were scheduled for two study sessions (no greater than one week apart) and instructed to refrain from alcohol or other illicit substance use for at least 24 hours prior to their appointments. During the first session, informed consent was obtained, baseline questionnaires were completed, and saliva samples for genetic testing were provided. Because procedures were counterbalanced across sessions of the parent study, ad lib alcohol consumption was assessed during either the first or second appointment. The alternate study visit involved a quantitative sensory testing battery (pain threshold/tolerance, conditioned pain modulation, offset analgesia, and temporal summation), as described elsewhere (White et al., 2022).
Measures and Materials
Extraction and Preparation of DNA for Genome-wide Genotyping Arrays
Approximately 2 milliliters of saliva were collected and preserved from each participant using the Saliva DNA Collection and Preservation Devices (Norgen Biotek). DNA was prepared at SUNY UMU PsychGENe Lab in Syracuse, NY from 0.5 milliliters of preserved saliva utilizing the Saliva DNA Isolation Kit (Norgen Biotek) and company procedures. DNA samples were shipped to the Clinical Research Sequencing Platform of Broad Institute for genotyping on the Infinium Global Screening Array (Illumina) using standard methods.
Prior to genotyping, composition and purity TE-solubilized DNA was measured in-house at SUNY Upstate using a Synergy 2 microplate reader and Take3 Spot Reader from Biotek, respectively. Tris-EDTA was used as a blank control for plate readings. DNA concentrations ranged from 13.5 to 474.9 ng/μL (mean value of 52.1 ng/μL ± 49.2 standard deviations) and the 260/280 absorbance ratios of samples ranged from 0.96 to 3.17 (mean value of 1.7 ± 0.3 standard deviations).
Quality Control and Imputation of Genome-wide Genotypes
Initial quality control procedures were performed on 260 individuals and 688,032 genotyped variants. Genetic variants were filtered with Plink (version 1.9) using the following criteria: a call rate less than 98%, deviating from Hardy-Weinberg equilibrium (p < 1×10⁻⁶) and a minor allele frequency (MAF) less than 1%. Individuals were checked to ensure a minimum call rate of 98%. An identity-by-descent analysis identified 6 individuals with significant genetic overlap (≥ 90%) who were removed to avoid biasing our PRS association tests (Wray et al., 2013). A sex-check analysis was performed which identified two samples whose reported sex conflicted with their genetically inferred sex, potentially reflecting poor genotyping; thus, these samples were removed. The filtered dataset contained 252 individuals and 458,507 variants.
Pre-phasing and imputation of missing genotypes was performed on the Michigan Imputation Server with the 1000 Genomes (phase 3v5) dataset as the selected reference panel. After imputation, filtering steps were followed to remove variants with a MAF less than 1%, a call rate less than 98%, and poor imputation quality (R2 < 30%) leaving 9,475,244 variants for downstream analysis.
Population Stratification
A principal component analysis (PCA) was performed on genotyped variants with a MAF ≥ 10% and in approximate linkage equilibrium (Plink command: --indep-pairwise 100 10 0.2) to capture genetic variability related to ancestry. To avoid capturing LD structure in our PCA, we removed variants from 24 regions with long-range, high LD (Price et al., 2008; Weale, 2010).
Polygenic Risk Scoring
We obtained summary statistics from GWASs of the following phenotypes: multisite chronic pain among 387,649 participants from the UK Biobank (Johnston et al., 2019), and frequency of alcohol consumption (measured as drinks per week) in 941,280 European-ancestry individuals (Liu et al., 2019). To calculate PRSs, the GWAS summary statistics were clumped using the 1000 Genomes as a reference panel for LD structure to identify SNPs that were maximally correlated at a r2 = 0.1 in 250-kilobase windows after pruning. Given the small sample size, we retained SNPs for polygenic risk scoring with a MAF ≥ 10% (Ni et al., 2021), and removed strand-ambiguous variants (AT/GC). Akin to our population stratification PCA, we removed variants from 24 regions of long-range, high LD. Polygenic scores were calculated in each study participant as the sum of all risk alleles weighted by the effect size of each risk SNP (natural logarithm of the odds ratio for multisite chronic pain; beta for drinks per week). There were 78,885 and 78,666 SNPs available for polygenic scoring of multisite chronic pain and drinks per week, respectively. PRSs were computed using 10 p-values bins (threshold p-values < 1×10⁻⁶, 1×10⁻⁵, 1e-04, 0.001, 0.01, 0.05, 0.1, 0.2, 0.5, and 1.0). Calculating PRSs using significance thresholds is a routine approach. For our study, we sought to leverage sub-threshold risk SNPs and risk SNPs with low-to-moderate effect sizes, because this can significantly improve the predictive power of PRSs beyond the summative effects of genome-wide significant loci (for in-depth discussion, see Choi et al., 2020 & Euesden et al., 2015). Permitting risk SNPs with small effect sizes into the PRS allows for more of the SNP-based heritability to be captured, but can increase the sampling variance. Hence, it is common for fluctuations to be observed in PRSs estimates when different p-value bins are tested (e.g., Grama et al., 2020; Santoro et al., 2018; Wang et al., 2019).
Alcohol Consumption Paradigm
Participants were randomly assigned to either pain or no-pain conditions. For participants assigned to the pain condition, an established capsaicin/heat paradigm was used to deliver continuous pain throughout ad lib alcohol consumption. A 10% capsaicin solution was applied to the volar surface of the non-dominant forearm using 1.5 × 1.5 cm bandages, inducing a burning sensation that resembles neuropathic and inflammatory clinical pain (Arendt-Nielsen & Andersen, 2005; Lötsch et al., 2015). Capsaicin also sensitizes local nociceptive endings to heat (Schmelz, 2009), enabling lower intensity contact-heat to be used to induce prolonged pain without the risk of skin burn (Kilminster, 1974). Following a 15-minute waiting period after application of the capsaicin solution, a 30 × 30 mm Peltier-based thermode was placed over the capsaicin-treated skin, and the temperature was increased to an individually predetermined P80 level using a Medoc Q-Sense CPM System (Medoc Ltd., Ramat Yishai, Israel). P80 (i.e., the temperature that elicited a pain rating of 8 on a 0 – 10 numerical rating scale) temperatures were established prior to pain induction using a method of limits protocol. For participants randomized to the no-pain condition, water was used instead of the capsaicin solution and thermode temperatures were set to 32°C.
Ad lib alcohol consumption was then assessed with an experimental “taste test” paradigm (Marlatt et al., 1973). Participants were given three pitchers, two of which contained 710 ml of U.S. domestic beer (different brands were used, each 5% alcohol by volume) and one of which contained 710 ml of seltzer water (included to control for potential differences among participants in thirst; Sharbanee et al., 2014). Empty glasses corresponding to each pitcher were also provided. Participants were informed they had 15 minutes to rate each beverage on four characteristics (i.e., pleasantness, taste, flavor, and carbonation) and to consume as much of each beverage as needed to be exact in their ratings. These data were not analyzed, as indices of drinking behavior were the primary outcomes of interest. Upon completion of the paradigm, blood alcohol concentration (BAC) estimates were assessed at 15-minute intervals until two consecutive readings under .04% were attained. Outcome measures included the volume of beer poured and consumed (assessed outside of the testing room and unbeknownst to participants) and peak BAC.
Alcohol Consumption Pattern
The Quantity-Frequency Variability Index (QFV; Cahalan et al., 1969) was used to classify patterns of alcohol consumption. Participants indicated, over the previous three months, the types of alcoholic beverages they drank, their frequency of consumption, and the typical quantity of beverages they consumed during these occasions. The QFV yields categorical classifications of alcohol use behavior (i.e., abstainers, infrequent, light, moderate, and heavy drinkers). Only individuals classified as moderate or heavy drinkers were included in the present study. The QFV has demonstrated good reliability and validity (Cahalan et al., 1969).
Alcohol Use Disorder Screen
The Short Michigan Alcoholism Screening Test (SMAST; Selzer et al., 1975) was used to screen for AUD. The SMAST has shown good validity as a screening tool for adults (Maisto et al., 1995). Individuals that scored ≥ 5 were excluded from study participation.
Body Mass Index
Participant weight measurements were taken using an Etekcity digital scale (Model: EB9380H, Anaheim, USA), and height was measured in inches. Body mass index (BMI) was calculated by dividing weight in pounds by height in inches squared and multiplying by a conversion factor of 703.
Sociodemographic Characteristics
Participants reported a range of sociodemographic characteristics, including race, ethnicity, age, gender, education, marital status, and annual income.
Data Analytic Strategy
The PRSs applied in our study population were derived from GWASs of predominantly European-ancestry samples. PRSs derived in European-ancestry training samples typically suffer from a loss of accuracy in non-European target samples due to differences in variant frequencies between populations (Martin et al., 2019). Splitting data into ancestrally homogenous groups prior to PRS analyses is a recommended analytic approach (Duncan et al., 2019), hence we performed linear regression analyses to test association of PRSs with three response variables (alcohol poured, alcohol consumed, and peak BAC) from two subgroups based on self-reported race (White/Black). We restricted our analysis to White (n = 133) and Black (n = 76) participants as there were too few individuals from other races for subgroup analysis.
We used the Box-Cox transformation method from the forecast package in R to transform non-normally distributed response variables to resemble a normal distribution. We tested the association of PRSs with alcohol poured, alcohol consumed, and peak BAC using linear models while covarying for principal components to account for genetic ancestry. In addition, we included phenotype-specific covariates for alcohol-consumption outcomes (gender, body mass index, average beer pleasantness, and QFV classification). We used multiple linear regression to test the association of genotyping principal components with PRSs, then chose principal components that showed a nominally significant association (p < 0.1) to include as covariates. We applied the Benjamini-Hochberg false discovery rate adjustment procedure to correct for the number of response variables tested per threshold p-value of PRS (n = 3). Associations between PRSs and study outcomes were first tested among the entire sample, covarying for experimental condition (pain vs. no-pain). Subgroup analyses were then conducted among participants in each condition separately. A post-hoc power analysis was performed using the pwr.f2.test function in R to estimate the number of additional samples needed to drive associations to statistical significance using an adjusted alpha of 0.017 (= 0.05/3 tests) with a minimum of 80% power.
Transparency and Openness
The parent study’s design was pre-registered at clinicaltrials.gov (NCT03311594), but the data analytic strategy reported herein was not specified. Materials and analysis code for this study are available by emailing the corresponding author.
Results
Participant Characteristics
Participants included 209 pain-free, moderate (n = 73) or heavy (n = 136) drinkers (Mage = 34.5, SD = 12.6). The sample was primarily single (73.2%), male (57.9%), and non-Hispanic (91.4%). Approximately 44% of participants reported an annual household income of less than $20,000 and 38% having a high-school degree or less education. Participant characteristics stratified by race and drinking pattern are presented in Table 1.
Table 1.
Sociodemographic and Drinking Pattern Characteristics
| Total Sample | Self-Reported Race | QFV Category | |||
|---|---|---|---|---|---|
|
| |||||
| White | Black | Moderate | Heavy | ||
|
| |||||
| n (%) | n (%) | n (%) | n (%) | n (%) | |
|
| |||||
| Gender | |||||
| Male | 121 (57.9%) | 78 (58.6%) | 43 (56.6%) | 36 (49.3%) | 85 (62.5%) |
| Female | 88 (42.1%) | 55 (41.4%) | 33 (43.4%) | 37 (50.7%) | 51 (37.5%) |
| Ethnicity | |||||
| Non-Hispanic | 191 (91.4%) | 123 (92.5%) | 68 (89.5%) | 65 (89.0%) | 126 (92.6%) |
| Marital Status | |||||
| Single | 153 (73.2%) | 96 (72.2%) | 57 (75.0%) | 48 (65.8%) | 105 (77.2%) |
| Married | 29 (13.9%) | 20 (15.0%) | 9 (11.8%) | 15 (20.5%) | 14 (10.3%) |
| Separated/Divorced/Widowed | 27 (12.9%) | 17 (12.8%) | 10 (13.2%) | 10 (13.7%) | 17 (12.5%) |
| Education | |||||
| Did Not Graduate High School | 12 (5.7%) | 6 (4.5%) | 6 (7.9%) | 0 (0.0%) | 12 (8.8%) |
| High School Graduate | 67 (32.1%) | 33 (24.8%) | 34 (44.7%) | 14 (19.2%) | 53 (39.0%) |
| Some College | 49 (23.4%) | 27 (20.3%) | 22 (28.9%) | 18 (24.7%) | 31 (22.8%) |
| Technical School/Associates Degree | 25 (12.0%) | 19 (14.3%) | 6 (7.9%) | 12 (16.4%) | 13 (9.6%) |
| 4-Year College Degree | 40 (19.1%) | 35 (26.3%) | 5 (6.6%) | 19 (26.0%) | 21 (15.4%) |
| Professional Degree (e.g., MD, JD) | 6 (2.9%) | 6 (4.5%) | 0 (0.0%) | 6 (8.2%) | 0 (0.0%) |
| Other | 10 (4.8%) | 7 (5.3%) | 3 (3.9%) | 4 (5.5%) | 6 (4.4%) |
| Annual Household Income | |||||
| Less Than $10,000 | 54 (25.8%) | 21 (15.8%) | 33 (43.4%) | 10 (13.7%) | 44 (32.4%) |
| $10,000 – $19,999 | 39 (18.7%) | 23 (17.3%) | 16 (21.1%) | 13 (17.8%) | 26 (19.1%) |
| $20,000 – $29,999 | 35 (16.7%) | 25 (18.8%) | 10 (13.2%) | 15 (20.5%) | 20 (14.7%) |
| $30,000 – $39,999 | 23 (11.0%) | 17 (12.8%) | 6 (7.9%) | 11 (15.1%) | 12 (8.8%) |
| Greater Than $40,000 | 58 (27.8%) | 47 (35.3%) | 11 (14.5%) | 24 (32.9%) | 34 (25.0%) |
|
| |||||
| M (SD) | M (SD) | M (SD) | M (SD) | M (SD) | |
|
| |||||
| Age | 34.55 (12.64) | 33.62 (12.08) | 36.17 (13.50) | 32.78 (12.28) | 35.49 (12.78) |
Note. QFV = Quantity-Frequency Variability Index
PRS Analyses
Full Sample Controlling for Condition
Among White participants, drinks-per-week PRS (threshold p-value = 0.01) showed nominally significant association (unadjusted p < 0.05) with alcohol consumed (R2 = 0.024, β = 0.115, p = 0.047, FDRp = 0.140) and no association with alcohol poured or peak BAC. Based on the results of the post-hoc power analysis, it was estimated that data from an additional 608 White participants would be needed to drive the alcohol consumed association to statistical significance. No associations between drinks-per-week PRS and outcome variables were observed among Black participants.
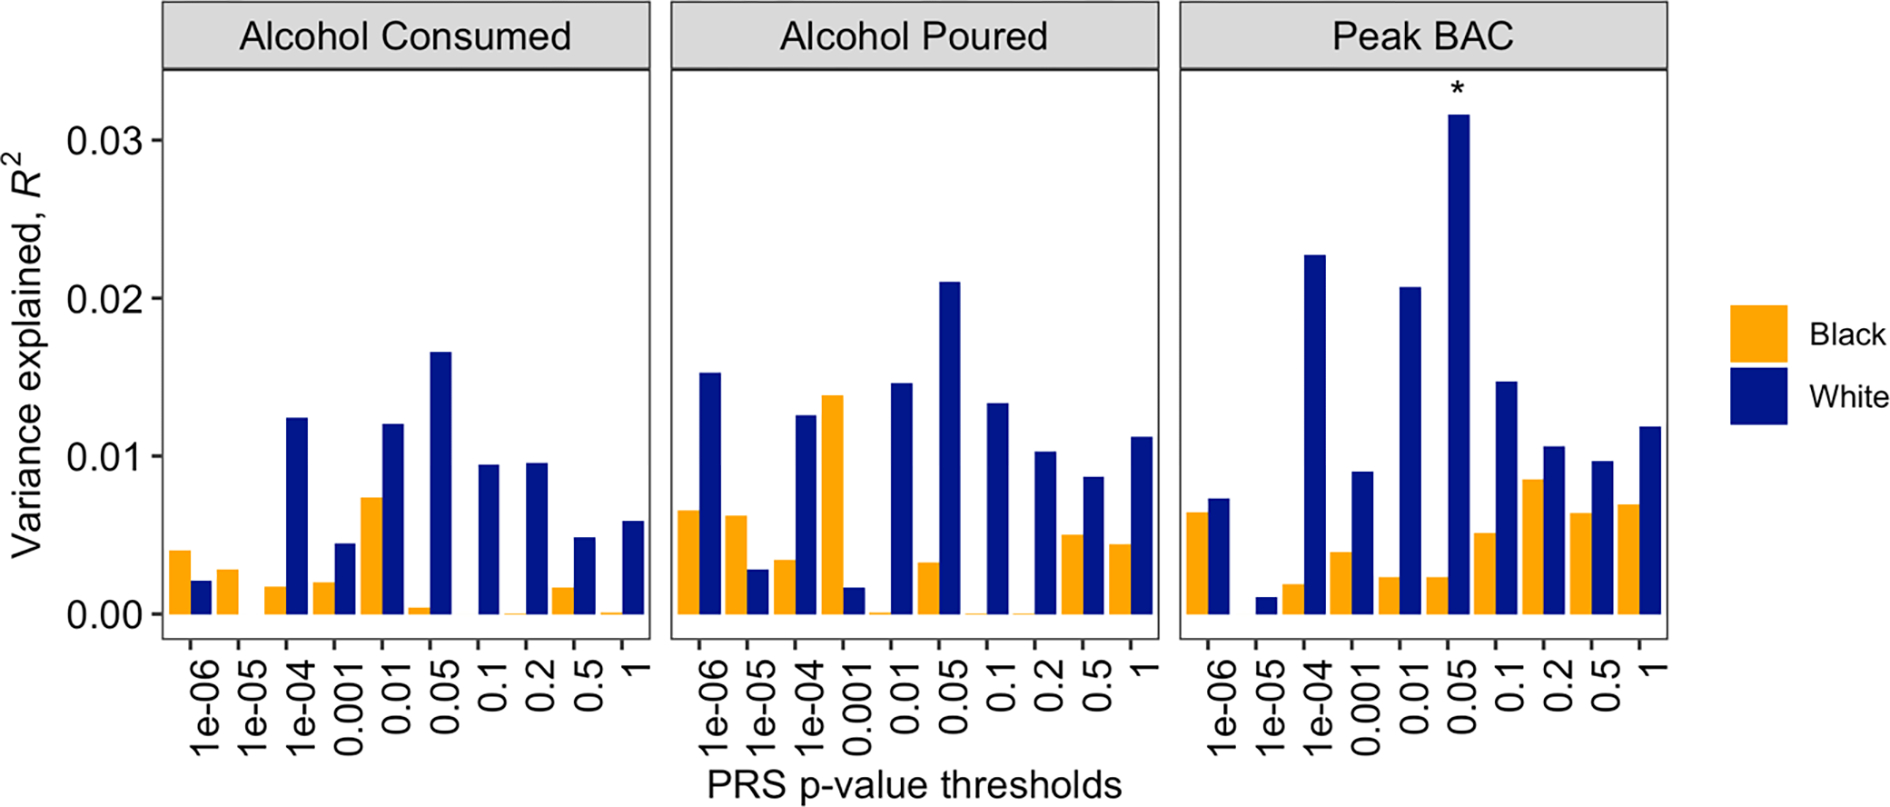
Among White participants, chronic pain PRS (threshold p-value = 0.05) showed nominally significant association with peak BAC (R2 = 0.032, β = 0.013, p = 0.025, FDRp = 0.075) and no association with alcohol poured or alcohol consumed. The post-hoc power analysis suggested data from an additional 374 White participants would be needed to drive the peak BAC association to statistical significance. No associations between chronic pain PRS and outcome variables were observed among Black participants (see Figures 1 and 2).
Figure 1.

Association of drinks-per-week PRS with study outcomes, stratified by self-reported race.
Note. Regressions covaried for gender, body mass index, average beer pleasantness, QFV classification, and experimental condition; * p < .05.
Figure 2.
Association of chronic pain PRS with study outcomes, stratified by self-reported race.
Note. Regressions covaried for gender, body mass index, average beer pleasantness, QFV classification, and experimental condition; * p < .05.
Drinks-Per-Week PRS - No Pain Induction Condition
Drinks-per-week PRS was not associated with outcomes among White participants randomized to the no-pain condition. Among Black participants randomized to the no-pain condition, drinks-per-week PRS was significantly associated with alcohol poured (R2 = 0.115, β = −64.859, p = 0.012, FDRp = 0.024), alcohol consumed (R2 = 0.109, β = −0.762, p = 0.012, FDRp = 0.024), and peak BAC (R2 = 0.135, β = −0.035, p = 0.010, FDRp = 0.024; see Figure 3).
Figure 3.

Association of drinks-per-week PRS with study outcomes, stratified by self-reported race and experimental condition.
Note. Regressions covaried for gender, body mass index, average beer pleasantness, and QFV classification; * p < .05; # FDRp < .05.
Drinks-Per-Week PRS - Pain Induction Condition
Drinks-per-week PRS was not associated with outcomes among White participants randomized to pain induction. Among Black participants randomized to pain induction, drinksper-week PRS demonstrated nominally significant associations with alcohol poured (R2 = 0.077, β = −9.635, p = 0.037, FDRp = 0.129) and peak BAC (R2 = 0.069, β = −0.003, p = 0.043, FDRp = 0.129) but no association with alcohol consumed (see Figure 3).
Chronic Pain PRS - No Pain Induction Condition
Among White participants randomized to the no-pain condition, chronic pain PRS showed significant association with alcohol consumed (R2 = 0.095, β = 0.493, p = 0.006, FDRp = 0.037), nominally significant association with peak BAC (R2 = 0.063, β = 0.017, p = 0.034, FDRp = 0.102), and no association with alcohol poured. Chronic pain PRS was not associated with outcomes among Black participants randomized to the no-pain condition (see Figure 4).
Figure 4.

Association of chronic pain PRS with study outcomes, stratified by self-reported race and experimental condition.
Note. Regressions covaried for gender, body mass index, average beer pleasantness, and QFV classification; * p < .05; # FDRp < .05.
Chronic Pain PRS - Pain Induction Condition
Among White participants randomized to pain induction, chronic pain PRS demonstrated significant association with peak BAC (max R2 = 0.090, β = 0.024, p = 0.003, FDRp = 0.017) and nominally significant associations with alcohol poured (max R2 = 0.048, β = 0.703, p = 0.034, FDRp = 0.103) and alcohol consumed (R2 = 0.052, β = 0.782, p = 0.026, FDRp = 0.071). Among Black participants randomized to pain induction, chronic pain PRS showed nominally significant association with alcohol poured (R2 = 0.076, β = 10.315, p = 0.046, FDRp = 0.279) and no association with alcohol consumed or peak BAC (see Figure 4).
Discussion
In this study of pain-free, moderate-to-heavy drinkers recruited from the community, we tested whether common genetic liability to alcohol consumption and multisite chronic pain, assessed via PRS, was predictive of ad lib drinking behavior during an experimental taste test. Among self-identifying White participants, the chronic pain and drinks-per-week PRSs showed nominally significant positive associations with peak BAC and volume of alcohol consumed, respectively. However, these associations did not survive FDR correction. Assuming observed effect sizes persisted, post-hoc power analysis suggested data from an additional 374 White participants would be needed to drive the association between the chronic pain PRS and peak BAC to significance, and data from an additional 608 White participants would be needed to drive the association between the drinks-per-week PRS and alcohol consumed to significance.
The role of concurrent pain-induction in the putative associations between PRS and ad lib drinking behavior was also explored. When stratifying results by experimental condition, the drinks-per-week PRS was significantly and negatively associated with alcohol poured, alcohol consumed, and peak BAC among self-identifying Black participants randomized to the no-pain condition. The direction of these associations was surprising; however, it is important to note that the PRSs employed in this study were derived from GWASs of predominantly European-ancestry samples. Although race and ancestry are related, self-reported race is a social construct influenced by cultural, language, geographic, and geopolitical factors, among many others (Ioannidis et al., 2021). Genetic ancestry is a concept that describes the genetic diversity between populations, and is impacted by patterns of linkage disequilibrium and allele frequencies (Lewis & Green, 2021; Martin et al., 2019). Therefore, reduced accuracy can be expected with the application of PRSs in target samples that are genetically divergent from the population used to derive the PRS. Combined with the small sample sizes of our subgroup analyses, the negative associations between the drinks-per-week PRS and ad lib drinking behavior among Black participants in the no-pain condition may reflect spurious findings. Given research that suggests Black individuals consume larger alcoholic drinks than White individuals (Kerr et al., 2005; Kerr et al., 2009), it is also possible that alcohol consumption measures (e.g., drinks per week) may not be directly comparable between racial groups if drink size is not carefully accounted for. The drinks-per-week PRS demonstrated no additional associations when stratifying results by experimental condition. Conversely, the chronic pain PRS was significantly and positively associated with study outcomes among White, but not Black, participants in both the no-pain (alcohol consumed) and pain conditions (peak BAC).
Although related, alcohol consumption in the laboratory is not entirely representative of drinking behavior in the real-world (Jones et al., 2016). The current results suggest alcohol use in each context may be genetically correlated, and that PRS for alcohol consumption, given sufficient sample sizes, could be used to predict drinking behavior in experimental paradigms. However, concordance in genetic ancestry between training and target samples would be important. To our knowledge, this was also the first study to use a pain-related PRS to predict alcohol outcomes, which may be suggestive of shared etiology (i.e., overlapping genetic risk) between base and target traits. Future research, employing Mendelian Randomization methods, could build off this study by clarifying whether shared etiology between alcohol- and pain-related phenotypes is attributable to horizontal (i.e., separate direct effects) or vertical (i.e., downstream effect) pleiotropy (Choi et al., 2020; Van Rheenen et al., 2019). Interestingly, the polymorphisms included in the multisite chronic pain PRS were located in genes involved in diverse functions, including nervous system development, neural connectivity, and neurogenesis (Johnston et al., 2019). This observation is consistent with the notion that a potential shared genetic architecture between AUD and chronic pain likely extends beyond stress and reward mechanisms (Yeung et al., 2017).
Strengths of the current study include the preliminary application of PRSs to an experimental drinking paradigm, novel testing of shared etiology between alcohol- and pain-related phenotypes, and recruitment of drinkers from the community. However, several limitations of this study need to be considered when interpreting its results. First, the sample size was relatively small for a genetic association study and precludes strong conclusions from being drawn. Larger confirmatory studies will be needed to further examine the influence of genetic liability to alcohol consumption and chronic pain on ad lib drinking behavior. Second, although necessitated by the parent study, the between-subjects design limited the power of the exploratory analyses. Replication efforts might utilize counterbalanced, within-subject designs if possible. Third, the PRSs used in these analyses were derived from GWASs of mostly European ancestry samples, likely reducing their accuracy in our subgroup of participants that identified as Black (Martin et al., 2019). Future GWASs among currently underrepresented samples will be necessary to increase the predictive utility of PRSs for populations of non-European ancestry (Roberts et al., 2019). Finally, the sample consisted of pain-free, moderate-to-heavy drinkers, which poses limits to the generalizability of results. Future work may benefit from testing these relations among individuals with pain and/or varied drinking patterns.
In summary, this study identified associations between PRSs for alcohol consumption and multisite chronic pain and ad lib drinking behavior during an experimental taste test. These findings contribute to a growing literature on the interrelations between alcohol use and pain (e.g., Edwards et al., 2020; Zale et al., 2015), and underscore the role of genetics in both outcomes.
Public Significance Statement:
Polygenic risk for alcohol consumption and multisite chronic pain were shown to influence drinking behavior during an experimental taste test. This study contributes to a growing literature on the interrelations between alcohol use and pain and underscores the role of genetic factors in such behavioral health problems.
Acknowledgments
This work was funded by a National Institute on Alcohol Abuse and Alcoholism of the National Institutes of Health grant awarded to Joseph W. Ditre and Stephen A. Maisto (R01AA024844). Research reported in this publication was also supported by a National Institute on Minority Health and Health Disparities of the National Institutes of Health grant awarded to the University of Houston under Award Number U54MD015946. The content is solely the responsibility of the authors and does not necessarily represent the official views of the National Institutes of Health.
All authors contributed in a significant way to the manuscript and all authors have read and approved the final manuscript.
Footnotes
We have no conflicts of interest to declare.
The parent study’s design was pre-registered at clinicaltrials.gov (NCT03311594), but the data analytic strategy reported herein was not specified. Materials and analysis code for this study are available by emailing the corresponding author.
References
- Arendt-Nielsen L, & Andersen OK (2005). Capsaicin in human experimental pain models of skin, muscle and visceral sensitization. In Malmberg AB & Bley KR (Eds.), Turning up the Heat on Pain: TRPV1 Receptors in Pain and Inflammation (pp. 117–144): Birkhäuser Basel. [Google Scholar]
- Barr PB, Ksinan A, Su J, Johnson EC, Meyers JL, Wetherill L, Latvala A, Aliev F, Chan G, Kuperman S, Nurnberger J, Kamarajan C, Anokhin A, Agrawal A, Rose RJ, Edenberg HJ, Schuckit M, Kaprio J, & Dick DM (2020). Using polygenic scores for identifying individuals at increased risk of substance use disorders in clinical and population samples. Translational Psychiatry, 10(1), 1–9. [DOI] [PMC free article] [PubMed] [Google Scholar]
- Cahalan D, Cisin IH, & Crossley HM (1969). American drinking practices: A national study of drinking behavior and attitudes. Monographs of the Rutgers Center of Alcohol Studies, 6, 260. [Google Scholar]
- Chatterjee N, Shi J, & García-Closas M (2016). Developing and evaluating polygenic risk prediction models for stratified disease prevention. Nature Reviews Genetics, 17(7), 392–406. [DOI] [PMC free article] [PubMed] [Google Scholar]
- Choi SW, Mak TSH, & O’Reilly PF (2020). Tutorial: A guide to performing polygenic risk score analyses. Nature Protocols, 15(9), 2759–2772. [DOI] [PMC free article] [PubMed] [Google Scholar]
- Ditre JW, Zale EL, & LaRowe LR (2019). A reciprocal model of pain and substance use: Transdiagnostic considerations, clinical implications, and future directions. Annual Review of Clinical Psychology, 15, 503–528. [DOI] [PubMed] [Google Scholar]
- Dudbridge F (2013). Power and predictive accuracy of polygenic risk scores. PLoS Genetics, 9(3), e1003348. [DOI] [PMC free article] [PubMed] [Google Scholar]
- Duncan L, Shen H, Gelaye B, Meijsen J, Ressler K, Feldman M, Peterson R, & Domingue B (2019). Analysis of polygenic risk score usage and performance in diverse human populations. Nature Communications, 10(1), 1–9. [DOI] [PMC free article] [PubMed] [Google Scholar]
- Edwards S, Vendruscolo LF, Gilpin NW, Wojnar M, & Witkiewitz K (2020). Alcohol and pain: A translational review of preclinical and clinical findings to inform future treatment strategies. Alcoholism: Clinical and Experimental Research, 44(2), 368–383. [DOI] [PMC free article] [PubMed] [Google Scholar]
- Egli M, Koob GF, & Edwards S (2012). Alcohol dependence as a chronic pain disorder. Neuroscience & Biobehavioral Reviews, 36(10), 2179–2192. [DOI] [PMC free article] [PubMed] [Google Scholar]
- Euesden J, Lewis CM, & O’Reilly PF (2015). PRSice: polygenic risk score software. Bioinformatics, 31(9), 1466–1468. [DOI] [PMC free article] [PubMed] [Google Scholar]
- Grama S, Willcocks I, Hubert JJ, Pardiñas AF, Legge SE, Bracher-Smith M, [Google Scholar]
- Menzies GE, Hall LS, Pocklington AJ, Anney RJL, Bray NJ, Escott-Price V, & Caseras X (2020). Polygenic risk for schizophrenia and subcortical brain anatomy in the UK Biobank cohort. Translational Psychiatry, 10(1), 1–10. [DOI] [PMC free article] [PubMed] [Google Scholar]
- Imtiaz S, Loheswaran G, Le Foll B, & Rehm J (2018). Longitudinal alcohol consumption patterns and health-related quality of life: Results from the National Epidemiologic Survey on Alcohol and Related Conditions. Drug and Alcohol Review, 37(1), 48–55. [DOI] [PubMed] [Google Scholar]
- Ioannidis JP, Powe NR, & Yancy C (2021). Recalibrating the use of race in medical research. JAMA, 325(7), 623–624. [DOI] [PubMed] [Google Scholar]
- Johnston KJA, Adams MJ, Nicholl BI, Ward J, Strawbridge RJ, Ferguson A, McIntosh AM, Bailey MES, & Smith DJ (2019). Genome-wide association study of multisite chronic pain in UK Biobank. PLoS Genetics, 15(6), e1008164. [DOI] [PMC free article] [PubMed] [Google Scholar]
- Jones A, Button E, Rose AK, Robinson E, Christiansen P, Di Lemma L, & Field M (2016). The ad-libitum alcohol ‘taste test’: secondary analyses of potential confounds and construct validity. Psychopharmacology, 233(5), 917–924. [DOI] [PMC free article] [PubMed] [Google Scholar]
- Kerr WC, Greenfield TK, Tujague J, & Brown SE (2005). A drink is a drink? Variation in the amount of alcohol contained in beer, wine and spirits drinks in a US methodological sample. Alcoholism: Clinical and Experimental Research, 29(11), 2015–2021. [DOI] [PubMed] [Google Scholar]
- Kerr WC, Patterson D, & Greenfield TK (2009). Differences in the measured alcohol content of drinks between black, white and Hispanic men and women in a US national sample. Addiction, 104(9), 1503–1511. [DOI] [PMC free article] [PubMed] [Google Scholar]
- Kilminster DT (1974). A model to predict human skin burns. Army Ballistic Research Aberdeen Proving Ground, Maryland. [Google Scholar]
- Lewis ACF, & Green RC (2021). Polygenic risk scores in the clinic: new perspectives needed on familiar ethical issues. Genome Medicine, 13(1), 1–10. [DOI] [PMC free article] [PubMed] [Google Scholar]
- Liu M, Jiang Y, Wedow R, Li Y, Brazel DM, Chen F, Datta G, Davila-Velderrain J, McGuire D, Tian C, Zhan X, Choquet H, Docherty AR, Faul JD, Foerster JR, Fritsche LG, Gabrielsen ME, Gordon SD, Haessler J, … Vrieze S (2019). Association studies of up to 1.2 million individuals yield new insights into the genetic etiology of tobacco and alcohol use. Nature Genetics, 51(2), 237–244. [DOI] [PMC free article] [PubMed] [Google Scholar]
- Lötsch J, Dimova V, Hermens H, Zimmermann M, Geisslinger G, Oertel BG, & Ultsch A (2015). Pattern of neuropathic pain induced by topical capsaicin application in healthy subjects. Pain, 156(3), 405–414. [DOI] [PubMed] [Google Scholar]
- Maisto SA, Connors GJ, & Allen JP (1995). Contrasting self-report screens for alcohol problems: a review. Alcoholism: Clinical and Experimental Research, 19(6), 1510–1516. [DOI] [PubMed] [Google Scholar]
- Marlatt GA, Demming B, & Reid JB (1973). Loss of control drinking in alcoholics: An experimental analogue. Journal of Abnormal Psychology, 81(3), 233. [DOI] [PubMed] [Google Scholar]
- Martin AR, Kanai M, Kamatani Y, Okada Y, Neale BM, & Daly MJ (2019). Current clinical use of polygenic scores will risk exacerbating health disparities. Nature Genetics, 51(4), 584. [DOI] [PMC free article] [PubMed] [Google Scholar]
- McDermott KA, Joyner KJ, Hakes JK, Okey SA, & Cougle JR (2018). Pain interference and alcohol, nicotine, and cannabis use disorder in a national sample of substance users. Drug and Alcohol Dependence, 186, 53–59. [DOI] [PubMed] [Google Scholar]
- Ni G, Zeng J, Revez JA, Wang Y, Zheng Z, Ge T, Restuadi R, Kiewa J, Nyholt DR, Coleman JRI, Smoller JW, Yang J, Visscher PM, & Wray NR (2021). A comparison of ten polygenic score methods for psychiatric disorders applied across multiple cohorts. Biological Psychiatry, 90(9), 611–620. [DOI] [PMC free article] [PubMed] [Google Scholar]
- Nielsen C, Knudsen G, & Steingrimsdottir O (2012). Twin studies of pain. Clinical Genetics, 82(4), 331–340. [DOI] [PubMed] [Google Scholar]
- Price AL, Weale ME, Patterson N, Myers SR, Need AC, Shianna KV, Ge D, Rotter JI, Torres E, Taylor KD, Goldstein DB, & Reich D (2008). Long-range LD can confound genome scans in admixed populations. American Journal of Human Genetics, 83(1), 132–135. [DOI] [PMC free article] [PubMed] [Google Scholar]
- Purcell SM, Wray NR, Stone JL, Visscher PM, O’Donovan MC, Sullivan PF, Sklar P, Ruderfer DM, McQuillin A, Morris DW, O’Dushlaine CT, Corvin A, Holmans PA, Macgregor S, Gurling H, Blackwood DHR, Craddock NJ, Gill M, Hultman CM, … Daly MJ (2009). Common polygenic variation contributes to risk of schizophrenia and bipolar disorder. Nature, 460(7256), 748–752. doi: 10.1038/nature08185 [DOI] [PMC free article] [PubMed] [Google Scholar]
- Roberts MC, Khoury MJ, & Mensah GA (2019). Perspective: The clinical use of polygenic risk scores: race, ethnicity, and health disparities. Ethnicity & Disease, 29(3), 513. [DOI] [PMC free article] [PubMed] [Google Scholar]
- Salvatore JE, Aliev F, Edwards AC, Evans DM, Macleod J, Hickman M, Lewis G, Kendler KS, Loukola A, Korhonen T, Latvala A, Rose RJ, Kaprio J, & Dick DM (2014). Polygenic scores predict alcohol problems in an independent sample and show moderation by the environment. Genes, 5(2), 330–346. [DOI] [PMC free article] [PubMed] [Google Scholar]
- Santoro ML, Ota V, de Jong S, Noto C, Spindola LM, Talarico F, Gouvea E, Lee SH, Moretti P, Curtis C, Patel H, Newhouse S, Carvalho CM, Gadelha A, Cordeiro Q, Bressan RA, Belangero SI, & Breen G (2018). Polygenic risk score analyses of symptoms and treatment response in an antipsychotic-naïve first episode of psychosis cohort. Translational Psychiatry, 8(1), 1–8. [DOI] [PMC free article] [PubMed] [Google Scholar]
- Schmelz M (2009). Translating nociceptive processing into human pain models. Exp Brain Res, 196(1), 173–178. doi: 10.1007/s00221-009-1809-2 [DOI] [PubMed] [Google Scholar]
- Selzer ML, Vinokur A, & van Rooijen L (1975). A self-administered short Michigan alcoholism screening test (SMAST). Journal of Studies on Alcohol, 36(1), 117–126. [DOI] [PubMed] [Google Scholar]
- Sharbanee JM, Hu L, Stritzke WG, Wiers RW, Rinck M, & MacLeod C (2014). The effect of approach/avoidance training on alcohol consumption is mediated by change in alcohol action tendency. PLoS One, 9(1), e85855. [DOI] [PMC free article] [PubMed] [Google Scholar]
- van Reij RR, Voncken JW, Joosten EA, & van den Hoogen NJ (2020). Polygenic risk scores indicates genetic overlap between peripheral pain syndromes and chronic postsurgical pain. neurogenetics, 21(3), 205–215. [DOI] [PMC free article] [PubMed] [Google Scholar]
- Van Rheenen W, Peyrot WJ, Schork AJ, Lee SH, & Wray NR (2019). Genetic correlations of polygenic disease traits: from theory to practice. Nature Reviews Genetics, 20(10), 567–581. [DOI] [PubMed] [Google Scholar]
- Verhulst B, Neale MC, & Kendler KS (2015). The heritability of alcohol use disorders: a meta-analysis of twin and adoption studies. Psychological Medicine, 45(5), 1061–1072. [DOI] [PMC free article] [PubMed] [Google Scholar]
- Wang T, Han Z, Yang Y, Tian R, Zhou W, Ren P, Wang P, Zong J, Hu Y, & Jiang Q (2019). Polygenic risk score for Alzheimer’s disease is associated with Ch4 volume in normal subjects. Frontiers in Genetics, 10, 519. [DOI] [PMC free article] [PubMed] [Google Scholar]
- Weale ME (2010). Quality control for genome-wide association studies. Genetic Variation, 341–372. [DOI] [PubMed] [Google Scholar]
- White KM, LaRowe LR, Powers JM, Paladino MB, Maisto SA, Zvolensky MJ, Glatt SJ, & Ditre JW (2022). Family history of alcohol use disorder as a predictor of endogenous pain modulation among moderate to heavy drinkers. The Journal of Pain, 23(5), 864–875. [DOI] [PMC free article] [PubMed] [Google Scholar]
- Wray NR, Yang J, Hayes BJ, Price AL, Goddard ME, & Visscher PM (2013). Pitfalls of predicting complex traits from SNPs. Nature Reviews Genetics, 14(7), 507–515. [DOI] [PMC free article] [PubMed] [Google Scholar]
- Yeung EW, Craggs JG, & Gizer IR (2017). Comorbidity of alcohol use disorder and chronic pain: Genetic influences on brain reward and stress systems. Alcoholism: Clinical and Experimental Research, 41(11), 1831–1848. [DOI] [PMC free article] [PubMed] [Google Scholar]
- Zale EL, Maisto SA, & Ditre JW (2015). Interrelations between pain and alcohol: An integrative review. Clinical Psychology Review, 37, 57–71. [DOI] [PMC free article] [PubMed] [Google Scholar]