

Abstract
In wheat, meta-QTLs (MQTLs) and candidate genes (CGs) were identified for multiple disease resistance (MDR). For this purpose, information was collected from 58 studies for mapping QTLs for resistance to one or more of the five diseases. As many as 493 QTLs were available from these studies, which were distributed in five diseases as follows: septoria tritici blotch (STB) 126 QTLs; septoria nodorum blotch (SNB), 103 QTLs; fusarium head blight (FHB), 184 QTLs; karnal bunt (KB), 66 QTLs; and loose smut (LS), 14 QTLs. Of these 493 QTLs, only 291 QTLs could be projected onto a consensus genetic map, giving 63 MQTLs. The CI of the MQTLs ranged from 0.04 to 15.31 cM with an average of 3.09 cM per MQTL. This is a ~ 4.39 fold reduction from the CI of QTLs, which ranged from 0 to 197.6 cM, with a mean of 13.57 cM. Of 63 MQTLs, 60 were anchored to the reference physical map of wheat (the physical interval of these MQTLs ranged from 0.30 to 726.01 Mb with an average of 74.09 Mb). Thirty-eight (38) of these MQTLs were verified using marker–trait associations (MTAs) derived from genome-wide association studies. As many as 874 CGs were also identified which were further investigated for differential expression using data from five transcriptome studies, resulting in 194 differentially expressed candidate genes (DECGs). Among the DECGs, 85 genes had functions previously reported to be associated with disease resistance. These results should prove useful for fine mapping and cloning of MDR genes and marker-assisted breeding.
Supplementary Information
The online version contains supplementary material available at 10.1007/s11032-022-01282-z.
Keywords: Meta-analysis, Wheat, Multiple disease resistance, Genome-wide association studies, Candidate genes
Introduction
Major yield losses in wheat (Triticum aestivum L.) are often caused by each of a number of diseases. These losses range from 10 to 15% and can sometimes approach 50% or more in favorable conditions for the pathogen, especially in low-input agriculture with poor disease control measures (Duveiller et al. 2007). The most important measure for controlling these losses is to develop disease resistant cultivars, which requires knowledge of the genetics of resistance against individual diseases (Kaur et al. 2021a). Such genetic studies have already been undertaken for almost all diseases in wheat. In these studies, resistance against individual diseases was initially treated as a qualitative trait. However, more recently, QTL analysis has generally been used leading to the identification of quantitative trait loci (QTLs) for individual diseases or multiple diseases. Genome-wide association studies (GWAS) have also been undertaken to identify marker–trait associations (MTAs) showing genomic regions conferring resistance to different individual wheat diseases (see Saini et al. 2022a for review).
Different genes or gene systems are generally available for resistance against different individual diseases, irrespective of whether we are dealing with race-specific resistance or non-race-specific, broad-spectrum, durable resistance, or adult plant resistance (APR) (Kou and Wang, 2010). The broad-spectrum resistance or non-race-specific durable resistance generally means resistance against the majority of prevalent races for a particular disease, and not the resistance against a number of diseases (Wiesner-Hanks and Nelson, 2016). Similarly, APR is often used to provide durable resistance, but this also generally deals with resistance against individual and specific diseases, one at a time.
Efforts have also been made to develop cultivars with resistance against multiple diseases, often described as MDR, which differs from the above broad-spectrum resistance. This concept of MDR is not new. Nene (1988) reviewed the information on MDR in legumes, and Pooja et al. (2014) described the phenomenon of MDR in wheat. More recently, Wiesner-Hanks and Nelson (2016) discussed the available evidence related to MDR in plants. One such evidence includes the high level of correlations between resistance against each of several individual diseases, suggesting the occurrence of pleiotropic loci or tightly linked clusters of R genes for resistance against several individual diseases (Wiesner-Hanks and Nelson, 2016). Multi-trait (MT) analysis for quantitative disease resistance involving more than one correlated disease has also been undertaken, and multi-trait QTLs for disease resistance have been identified, suggesting that there may be complex MDR loci, which control resistance against more than one disease (Hernandez et al. 2012).
QTL analysis, as above, has considerably improved our understanding of the inheritance of disease resistance and underlying genetic architecture for resistance against individual diseases. Genes/QTLs providing resistance against multiple diseases are largely unknown. Very few studies are available, where genes/QTLs for MDR have been discovered (Hernandez et al. 2012; Jighly et al. 2016; Mago et al. 2011; Zwart et al. 2010). In recent studies, mainly involving GWAS, MDR has also been reported in 5–10% of the naturally occurring wheat genotypes, including some synthetic wheat (Friesen et al. 2008; Gurung et al. 2009; Miedaner et al. 2020).
In general, while breeding for MDR in wheat, the pyramiding of multiple QTLs/genes for more than one disease has been conducted by wheat breeders (Gupta et al. 2021a; Rana et al. 2021; Sharma et al. 2021). However, this method is a lengthy process as it starts with combining two or more than two genes/QTLs for different diseases, one after another for achieving MDR. In addition, the QTLs for individual diseases that are introgressed might have epistatic interactions, which may alter the outcome of the introgression process. Co-localization of QTLs for different diseases has also provided evidence for the occurrence of MDR loci (Ali et al. 2013; Wiesner-Hanks and Nelson, 2016).
Meta-analysis of QTLs is a relatively newer approach, which provides more robust QTLs for marker-assisted selection (MAS) by addressing the problem of heterogeneity among QTL studies, thus refining both QTL location and magnitude of the genetic effects. The feasibility and utility of meta-analysis of QTLs have already been demonstrated in several recent studies in wheat and related crops (Kumar et al. 2021; Pal et al. 2021; Saini et al. 2021, 2022b; Sandhu et al. 2021). Meta-analysis for identification of MQTLs for MDR has also been conducted in barley (Schweizer and Stein, 2011), maize (Ali et al. 2013) and rice (Kumar and Nadarajah 2020). However, no meta-analysis of QTLs has been conducted to identify meta-QTLs (MQTLs) for MDR in wheat.
In the present study in wheat, a meta-analysis of QTLs was used for the identification of MQTLs for MDR involving the following five diseases: (i) septoria tritici blotch [STB; caused by Zymoseptoria tritici, synonyms Septoria tritici, Mycosphaerella graminicola], (ii) septoria nodorum blotch [SNB; caused by Parastagonospora nodorum, syn. Phaeosphaeria nodorum (E. Müll.), syn. Leptosphaeria nodorum (E. Müll.), syn. Stagonospora nodorum (Berk.), syn. Septoria nodorum (Berk.)], (iii) fusarium head blight [FHB; caused by Fusarium graminearum, syn. Gibberella zeae], (iv) karnal bunt [KB; caused by Tilletia indica Mitra, syn. Neovossia indica (Mitra) Mundkur], and (v) loose smut [LS; caused by Ustilago tritici (Pers.) Rostr.]. QTL studies leading to the identification of numerous resistance QTLs for each of these five diseases have been undertaken (Online Resource 1, 2). As QTLs conferring resistance to each of the above five diseases have been mapped on wheat genomes, the spatial relationships among them (in the chromosomal context) could also be assessed.
For the purpose of meta-analysis in the present study, results of QTL mapping studies for resistance against each of the above five diseases were utilized. Among these five diseases, for FHB, a large number of QTLs were available (Venske et al. 2019; Zheng et al. 2020); therefore, to make an equal proportion of the QTLs associated with each of the five different diseases, QTLs published after the year 2019 were included in the present study. The results of the meta-analysis from the present study were also compared with the available results from earlier GWA studies. Transcriptomics data from previous studies were also used for in silico expression analysis to validate the promising genomic regions and important candidate genes (CGs), which affect MDR in wheat. We believe that the results of the present study should help to lay the foundation for identification, transfer, and aggregation of the promising MQTLs or CGs in wheat for MDR.
Materials and methods
Bibliographic survey and collection of data on QTLs
Using PubMed (https://pubmed.ncbi.nlm.nih.gov/) and Google Scholar (https://scholar.google.com/), an extensive search for publications reporting QTLs associated with STB, SNB, FHB, KB, and LS resistance in wheat was undertaken. The following information was collected and compiled from each mapping study: type and size of the population, markers flanking individual QTLs and their genetic positions on the map, peak positions for individual QTLs, phenotypic variation explained (PVE or R2), logarithm of the odds (LOD) scores of the individual QTLs, inoculation conditions and isolates used. Wherever there was no information available on the peak position, the mid-position of the two flanking markers was taken as the peak. Similarly, when the LOD score of an individual QTL was not available, a LOD score of 3.0 was used. For the QTLs, lacking original confidence interval (CI), CI (95%) was calculated based on population-specific equations derived from different simulations (Darvasi and Soller, 1997; Guo et al. 2006). Studies lacking necessary information required for analysis such as PVE values and genetic positions of markers were excluded from the analysis (e.g., Knox et al. 2014; Simón et al. 2004).
Construction of the consensus map
A consensus genetic map was constructed using LPmerge package of R programming (Endelman and Plomion 2014). For this purpose, the following five high-quality genetic maps were utilized: (i) the ‘Wheat, Consensus SSR, 2004’ involving 1235 markers (Somers et al. 2004); (ii) ‘Wheat_Composite_2004’ map with 4403 markers, available at GrainGenes database (http://wheat.pw.usda.gov); (iii) an integrated durum wheat map with 3669 markers (Marone et al. 2013); and (iv) two SNP maps assayed by the platforms Illumina 9 K iSelect Beadchip Assay (Cavanagh et al. 2013) and Illumina iSelect 90 K SNP Assay (Wang et al. 2014).
Further, the markers flanking each QTLs reported in individual studies were also included on the consensus genetic map. In order to avoid marker duplications on the consensus map, the consistency of all marker names was verified across the above five high-quality linkage maps and maps from individual studies. Construction of consensus map using LPmerge involved two major steps: (i) assessment of the number of consensus bins, markers, and the initial number of ordinal conflicts. Whenever there was inconsistency in marker order, the package corrects it by removing ordinal constraints using certain statistical manipulations; (ii) creation of one to four consensus maps (K = 1 to 4, where K is the maximum interval size), from which one can choose one or more maps based on the associated statistics, which include estimating root-mean-square error (RMSE) between each individual map and the consensus map (based on mean and standard deviation, sd). For further analysis, the consensus map with the lowest RMSE was chosen as the final map.
QTL projection and meta-analysis
Following the approach described by Chardon et al. (2004), available QTLs were projected onto the newly generated consensus map using the projection tool, QTLProj that is available in BioMercator v4.2 software (Arcade et al. 2004; Sosnowski et al. 2012). Meta-analysis of QTLs was then performed using the same software BioMercator v4.2. For analysis, two distinct approaches were used, depending on the number of QTLs available for each chromosome. If the number of QTLs on an individual chromosome was ≤ 10, the approach proposed by Goffinet and Gerber (2000) was used; if the number of QTLs on an individual chromosome was > 10, the second approach proposed by Veyrieras et al. (2007) was utilized. The model with the lowest Akaike information criterion (AIC) value was chosen as the best fit in the first approach. In the second approach, the best model was chosen among the following: AIC, corrected AIC, AIC3, Bayesian information criterion (BIC), and average weight of evidence (AWE) models. The model with the lowest criteria in at least three of the models was chosen as the best fit model.
The MQTLs were named based on their genetic positions; for instance, MQTLs mapped on chromosome 1A were named as MQTL1A.1, MQTL1A.2, and so on. The PVE value and LOD score of an MQTL were calculated as the mean of PVE values and LOD scores of QTLs included in the MQTL. The sequences of flanking markers (retrieved from databases, such as GrainGenes and CerealDB) of each MQTL were BLASTed against the Chinese Spring (CS) reference genome available at Ensembl Plants database (https://plants.ensembl.org) to determine their physical coordinates. Physical positions of some SNPs were directly searched at JBrowse wheat genome browser (https://wheat-urgi.versailles.inra.fr/Tools/Jbrowse).
Comparison of MQTLs with MTAs identified in previous GWAS studies
MQTLs identified in the present study were validated using the results of recently published GWA studies. For this purpose, the data from 16 GWA studies involving the five different diseases, published during 2017–2021 were collected. The details of these GWA studies are summarized in Table 1. The phenotypic data used in these studies were collected from 15 different countries, with the population size ranging from 96 to 406, including one durum wheat population, two spring wheat populations, eight winter wheat populations, and five mixed wheat populations involving both spring and winter wheat. Physical positions of markers (significantly associated with the trait) were obtained either from the source papers or through BLAST searches. Keeping in view the relatively long linkage disequilibrium (LD) decay distance of wheat (approx. 5 Mb), the MTAs detected from GWAS within 5 Mb genomic regions near an MQTL were considered to be co-located (Yang et al. 2021).
Table 1.
GWA studies on different wheat diseases (used for validating MQTLs identified in the present study)
| Type of wheat (Panel size) | Marker type/ Number | #MTAs | Disease | Environment | References |
|---|---|---|---|---|---|
| Winter wheat accessions (mainly cultivars and advanced breeding lines) (96) | DArT/874 | 38 | STB | Argentina | Gerard et al. (2017) |
| Ethiopian durum wheat landraces and 25 Ethiopian durum improved varieties (318) | SNPs (90 K SNP array)/16223 | 5 | STB | Ethiopia | Kidane et al. (2017) |
| European winter wheat varieties (371) | SNPs (35 K and 90 K SNP array)/28222 | 39 | STB | Germany | Muqaddasi et al. (2019) |
| Winter wheat landraces and historical cultivars (175) | SNPs (20 K SNP array)/7401 | 12 | STB | Denmark, Estonia, Lithuania, and Sweden | Alemu et al. (2021) |
| Swiss wheat landraces, breeder’s lines and cultivars (188) | SNPs (15 K SNP array)/9284 | 1 | STB | Netherlands | Dutta et al. (2021) |
| Iranian improved lines, diverse lines and differential lines (185) | SNPs and SilicoDArT/21773 | 37 | STB | Iran | Mahboubi et al. (2021) |
| Russian historic wheat accessions (295) | DArT and SNPs (12,886) | 24 | SNB | Australia | Phan et al. (2018) |
| Hard winter wheat association mapping panel (274) | SNPs (90 K SNP array)/15590 | 7 | SNB | USA | AlTameemi et al. (2021) |
| Australian breeding lines and accession from CIMMYT wheat germplasm (144) | SNPs (90 K SNP array)/1628 | 8 | KB | India, Mexico | Emebiri et al. (2019) |
| Landraces, elite lines, released varieties and advanced breeding lines (339) | DArTseq/13098 | 18 | KB | Mexico | Gupta et al. (2019) |
| Pre-breeding lines (179) | DArTseq SNPs/6382 | 15 | KB | Mexico | Singh et al. (2020) |
| Soft red winter wheat (360) | GBS-SNPs/71428 | 10 | FHB | Arkansas | Holder (2018) |
| Elite soft red winter wheat cultivars and breeding lines (238) | SNPs (90 K SNP array)/3919 | 29 | FHB | USA | Tessmann and Sanford, (2018) |
| Winter wheat cultivars (171) | SNPs (90 K SNP array)/23556 | 26 | FHB | China | Hu et al. (2020) |
| Soft red winter wheat (354) | GBS-SNPs/72634 | 42 | FHB | USA | Larkin et al. (2020) |
| Chinese wheat accessions (406) | SNPs (90 K and 660 SNP arrays)/437343 | 21 | FHB | China | Shi et al. (2021) |
#No. of significant MTAs detected, STB septoria tritici blotch, SNB septoria nodorum blotch, KB karnal bunt, FHB fusarium head blight
Association of known resistance genes with MQTLs
Information was also collected for the resistance genes associated with five diseases to see if they are co-located with the MQTLs identified in the present study. For this purpose, the nucleotide sequences of the markers linked to resistance genes or the gene sequences were BLASTed against the wheat reference genome sequence available in the Ensembl Plants database, which provided the genomic coordinates of the markers or genes. These physical intervals were then compared with the physical coordinates of the MQTL regions; any resistance gene that fell within a given MQTL region was considered as the MQTL region co-located with the corresponding resistance gene.
Candidate gene mining within the MQTLs
The CGs within the defined physical intervals of promising MQTLs were identified using the BioMart tool (https://plants.ensembl.org/biomart/martview) of Ensembl Plants. MQTLs with a physical interval of less than 2 Mb were directly considered for detection of available CGs; in the remaining cases, when the physical interval was > 2 Mb, the physical position of the MQTL peak was estimated first, and then, the complete 2 Mb region surrounding the peak (1 Mb each left and right of the MQTL peak) was investigated to identify the available CGs. The following formula was used to estimate the peak positions of MQTLs:
The descriptions of the functions of identified genes were extracted from the InterPro database (https://www.ebi.ac.uk/interpro/).
Gene ontology (GO) analysis and expression analysis of the candidate genes
For the CGs detected within the MQTL regions, GO analysis was conducted using the BioMart tool available in Ensembl Plants. Further, in silico expression analysis of CGs was conducted using an expression visualization and integration platform, expVIP (http://www.wheat-expression.com/; Ramírez-González et al. 2018). For this purpose, five different expression datasets including expression data related to two diseases, FHB and STB, were utilized based on experiments reported at expVIP (Buhrow et al. 2016; Gou et al. 2016; Kugler et al. 2013; Schweiger et al. 2016; Yang et al. 2013).
Following is a summary of these five expression datasets: (i) The first dataset (Yang et al. 2013) consists of differential expression data of a susceptible wheat cv. Sevin, inoculated with S. tritici isolate IPO323, with samples collected every day from 3 to 14 days post-inoculation. (ii) The second dataset (Kugler et al. 2013) consists of differential expression data of four NILs that carry either of the FHB resistance QTLs, Fhb1 (NIL2) or Qfhs.ifa-5A (NIL3), both of these QTLs (NIL1) or none of them (NIL4, susceptible) in the background of the FHB susceptible German spring wheat cv. Remus, treated with F. graminearum spore suspension or mock (control), with samples (spike tissues) collected 30 and 50 h after inoculation. (iii) The third dataset (Schweiger et al. 2016) consists of transcriptomic data of two NILs, one NIL carried either Fhb1 or Qfhs.ifa-5A (CM-NIL38) from donor CM-82036 and the other NIL (CM-NIL51) carried susceptible alleles from the German spring wheat cv. Remus, treated with F. graminearum or mock (control), with head tissues sampled in a dense time-course series from three to 48 h after inoculation. (iv) The fourth dataset (Buhrow et al. 2016) consists of differential expression data of wheat cv. Fielder challenged with F. graminearum GZ3639 spores in the absence and presence of 1.0 mM ABA or GA, with spikelets collected 24 h after inoculation. (v) The fifth dataset (Gou et al. 2016) included transcriptomic data of Chinese Spring (moderately FHB-susceptible variety) and CS-7EL (FHB-resistant ditelocentric addition line that contains the long arm of chromosome 7E from Th. elongatum), both treated with F. graminearum (DAOM 180,378) or mock, with samples (the inoculated portion of each head) collected 4 days after inoculation.
Transcriptomic data repositories for the remaining three diseases, viz. SNB, KB, and LS, were not available on expVIP. The expression data were obtained in the form of log2-transformed TPM (transcripts per million) values. Only genes that showed fold change (FC) ≥ 2 or FC ≤ -2, when TPM values were compared under pathogen inoculation versus mock (control), were considered differentially expressed. Further, to analyze the expression patterns of the differentially expressed CGs (DECGs) in different wheat tissues during development, relevant expression datasets available at the expVIP platform were used (Gillies et al. 2012; Leach et al. 2014; Li et al. 2013; Pfeifer et al. 2014; Ramírez-González et al. 2018). Heatmaps were then generated using Morpheus (https://software.broadinstitute.org/morpheus/) to show the expression levels of genes in different wheat tissues. Among the DECGs detected, those with functions previously reported to be associated with disease resistance were also selected for the different MQTLs.
Ascertaining homoeologous relationships among the MQTLs
Since bread wheat genes are available as triplicate homoeologues, the MQTLs were also examined for homoeologous relationships. This analysis involved the following two steps: (i) investigation of genomic regions of the available MQTLs to extract the information on underlying CGs on three homoeologous chromosomes using BioMart tool of Ensembl Plants database and (ii) comparison of physical positions of these homoeologues with the physical coordinates of the MQTLs identified on corresponding chromosomes. MQTLs located on homoeologous chromosomes of three sub-genomes having similar genes were considered as homoeologous MQTLs. Homoeologous relationships of MQTLs among different wheat chromosomes were depicted through a circular map (or circos) constructed using an integrated toolkit, TBtools (Chen et al. 2020).
Results
Salient features of the QTLs collected for meta-analysis
A total of 493 QTLs were available from 58 studies, including 21 studies for STB, 17 for SNB, 12 for FHB, 6 for KB, and only 2 for LS published from 1998 to April 2021 (Online Resource 1, 2). The studies involved 62 different mapping populations, including 20 DH, 39 RIL populations, and 3 F2/BC populations (some studies involved more than one population) ranging in size from 70 to 316 lines.
The total number of QTLs was 493 (184 were associated with FHB, 126 with STB, 103 with SNB, 66 with KB, and only 14 QTLs with LS) (Fig. 1a). These QTLs were unevenly distributed on the 21 wheat chromosomes ranging from 9 QTLs on 5D to 54 on 5B (Fig. 1b) and on three sub-genomes, with 151 on sub-genome A, 232 on sub-genome B, and 110 on sub-genome D. The PVE for a single QTL ranged from 0.13 to 94.1 (average of 13.47%), with most of the QTLs showing PVE < 20% (Fig. 1c); the confidence intervals (CIs) ranged from zero to 197.6 cM, with an average of 13.57 cM (Fig. 1d). The QTL data collected in this study have been included in the recently developed WheatQTL database (http://wheatqtldb.net/) (Singh et al. 2021).
Fig. 1.

Salient features of the QTLs: (a) distribution of QTLs associated with different diseases, (b) number of QTLs per chromosome (the changes in colour from red to blue represent the frequency of QTLs identified for each of the five diseases), (c) PVE and (d) CI of the collected QTLs
Characteristics of the consensus map
The consensus map had 50,211 markers (including SSR, RFLP, AFLP, DArT, SNPs, etc.) spread over a distance of 5,570.32 cM (ranging from 104.51 cM for 3D to 408.96 cM for 5B with an average of 265.25 cM) (Online Resource 3). The overall marker density was 9.01 markers/cM, ranging from 1.78 markers/cM on chromosome 4D to 23.56 markers/cM on chromosome 2B (Online Resource 3). Sub-genome A contained 18,835 markers over a distance of 2,028.01 cM, sub-genome B carried 22,883 markers over a distance of 1,850.26 cM (highest marker density with 12.37 markers/cM), and sub-genome D carried 8,493 markers over a distance of 1,692.05 cM (lowest marker density with 5.02 markers/cM). Overall, the marker density at the one end of chromosomes was higher than that at the other end (Fig. S1).
MQTLs for MDR in wheat
Only 291 QTLs of the available 493 QTLs could be projected onto the consensus map; 208 QTLs were grouped into 63 MQTLs (Table 2, Online Resource 4), leaving 38 singletons (single QTLs), and 45 unassigned to any MQTL (predicted QTL peaks were outside the MQTL CI). The 63 MQTLs were distributed on different wheat chromosomes (Fig. 2), with a maximum of 7 MQTLs on 5B and a minimum of only one MQTL each on 1D, 2A, 4A, 6D, and 7D. As many as 22 MQTLs (34.92%) were based on four or more QTLs from different mapping studies (Fig. 3a). The CI of MQTLs ranged from 0.04 to 15.31 cM with an average of 3.09 cM (4.35-fold less than that of QTLs) (Fig. 3b); 33 out of 63 MQTLs had CI < 2 cM. There were substantial differences in average CIs of MQTLs among different chromosomes (Fig. 3b). The PVE ranged from 2.24 to 51.23% with a mean of 15.24%; LOD score ranged from 2.93 to 48.44 with an average of 7.42. Only a solitary MQTL (MQTL2B.2) provided resistance to all the 5 diseases; ten MQTLs (1A.1, 1B.4, 2A.1, 2B.2, 2D.3, 3B.1, 3B.2, 3B.3, 4A.1, 4B.3, 5B.3) each provided resistance to 3–4 diseases (Table 2); the remaining MQTLs provided resistance to only one or two diseases (Online Resource 4, 5), although there could be more than one MQTL for the same disease (for instance, MQTL6A.2 accommodated 4 QTLs for FHB, 4B.4 carried 3 QTLs for LS, and 3A.1 carried 3 QTLs for SNB).
Table 2.
MQTLs associated with multiple disease resistance identified in this study
| MQTL | Flanking markers (CI, in cM) | Number of QTLs (avg. LOD) | Disease (avg. PVE) |
|---|---|---|---|
| (a) MQTLs conferring resistance to 4 or more diseases | |||
| MQTL2B.2 | RAC875_rep_c109471_154/Xwmc25 (57.59–58.48) | 6 (6.98) | STB, FHB, KB, LS, SNB (20.8) |
| MQTL3B.1 | 3,955,846/M21/P76.3 (2.22–3) | 5 (8.47) | SNB, FHB, KB, STB (15.57) |
| MQTL3B.2 | XksuG53/4989073 (14.79–15.07) | 6 (6.99) | SNB, STB, FHB, KB (17.19) |
| (b) MQTLs conferring resistance to 3 diseases | |||
| MQTL1A.1 | RAC875_c16820_419/wsnp_Ra_c26191_35761997 (32.98–37.6) | 4 (4.25) | STB, SNB, FHB (5.78) |
| MQTL1B.4 | Kukri_c147_1620/cfa2129b (66.86–68.86) | 4 (8.7) | STB, LS, FHB (12.42) |
| MQTL2A.1 | wPt-9793/AX-94570860 (5.67–13.19) | 5 (3.96) | FHB, SNB, STB (7.86) |
| MQTL2D.3 | Xfba88/Xfba4 (39.55–39.85) | 3 (5.12) | STB, FHB, SNB (10.43) |
| MQTL3B.3 | Xgwm566/Xwmc762 (61.18–76.49) | 3 (5.17) | FHB, SNB, STB (9.1) |
| MQTL4A.1 | Excalibur_c56041_728/wsnp_BE403710B_Ta_2_1 (1.08–3.07) | 5 (12.36) | FHB, STB, KB (33.14) |
| MQTL4B.3 | BS00081631_51/Tdurum_contig64772_417 (111.89–115.45) | 4 (14.15) | STB, FHB, SNB (19.15) |
| MQTL5B.3 | XP7152-196/AX-110438459 (54.06–55.86) | 3 (4.9) | KB, FHB, STB (12.33) |
Fig. 2.
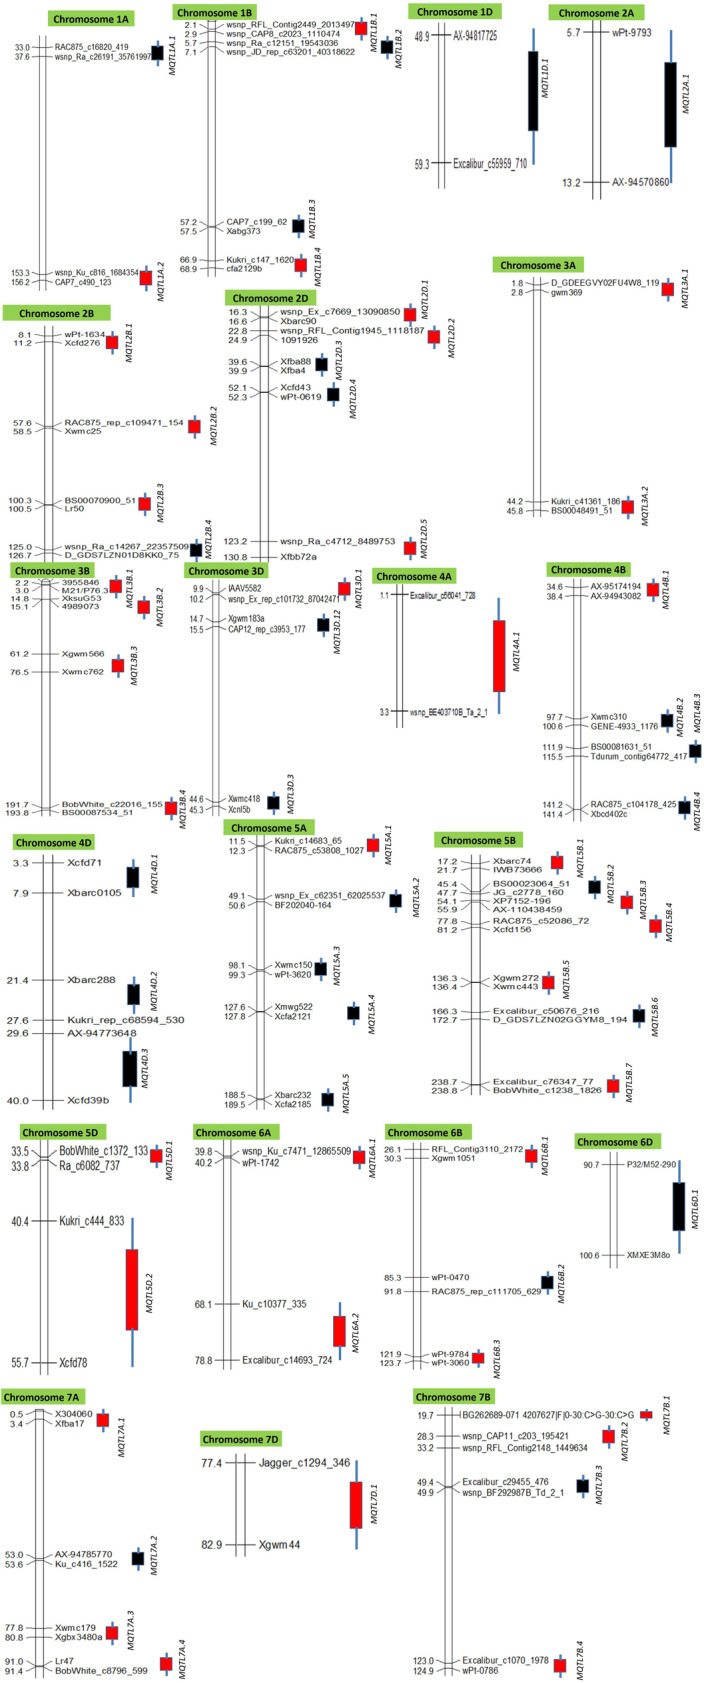
Distribution of 63 MQTLs on 21 wheat chromosomes. The boxes on the right of each chromosomes represent the position of MQTLs (red boxes represent the positions of GWAS-validated MQTLs). Only the flanking markers of the MQTLs have been shown in the figure for better visualization
Fig. 3.

Basic information of MQTLs identified in the present study: (a) number of MQTLs harboring different number of QTLs, (b) A comparison of mean CI for initial QTLs and MQTLs
All MQTLs (except MQTL5A.4, 5B.6, and 6D.1) were anchored to the physical map of the wheat reference genome (Online Resource 5). The mean physical interval of MQTLs ranged from 0.30 Mb (MQTL6A.1) to 726.01 Mb (MQTL4A.1), with a mean of 74.09 Mb (31 MQTLs had < 20 Mb). The physical intervals of several MQTLs were shown to overlap, for instance, 2B.3 (613.09–788.53 Mb) and 2B.4 (698.3–773.15 Mb); 4B.1 (24.33–37.55 Mb) and 4B.3 (24.55–26.49 Mb).
Validation of MQTLs with GWAS
The physical coordinates of the above 60 MQTLs were compared with MTAs for disease resistance reported in 16 GWAS, earlier conducted in wheat (6 studies for STB, 2 studies for SNB, 3 studies for KB, and 5 studies for FHB; no GWAS was available for LS). Of the 60 MQTLs, 38 could be validated, each in at least one GWAS, (involving a total of 111 MTAs) (Fig. 4a, Online Resource 6); among them, 22, 20, 13, and 5 MQTLs were verified using MTAs associated with FHB, STB, KB, and SNB resistance, respectively (Fig. 4a). The number of MTAs for each MQTL also varied so that as many as 15 MQTLs each matched with at least 3 MTAs identified in 16 GWA studies; of these MQTL4A.1 matched with 23 MTAs, followed by MQTL1B.1 and 1B.7 with 9 and 8 MTAs, respectively. Some of the MQTLs (e.g., 2B.3, 3B.2, and 4A.1) each involving 5 or more initial QTLs matched with more than 4 MTAs (Fig. 4a).
Fig. 4.

(a) The co-localization of MQTLs with MTAs (derived from GWAS) associated with different diseases. The changes in colour from green to red represent the frequency of MTAs co-localized with MQTLs (from 0 to 23). (b) Histogram showing frequencies of CGs encoding proteins involved in disease resistance
Co-localization of MQTLs with known resistance genes
Positions of MQTLs were also compared with those of the 50 available known resistance genes (Online Resource 7). MQTLs identified in the present study overlapped 12 resistance genes [including 6 genes for STB (Stb1, TaSSP6, Stb8, Stb11, Stb12, and TaSRTRG6), 5 for FHB (Fhb2, WFhb1-1, Tapgip3, TaNACL-D1, Ta-UGT3), and 1 for KB (Chs-1B)] (Online Resource 7). For instance, MQTL1B.1 overlapped Chs-1B and Stb11, MQTL3B.3 overlapped Tapgip3 and Ta-UGT3 genes, and MQTL2B.4 and 1B.4 overlapped two most recently cloned STB resistance genes, TaSSP6 and TaSRTRG6, respectively.
Candidate genes and their gene ontology terms
As many as 874 CGs were available in the genomic regions of 39 selected MQTLs, each based on at least three QTLs and with an average genetic and physical CIs of 2.94 cM and 81.55 Mb, respectively (Online Resource 8). These CGs included 149 genes with unknown functions. On the two extremes, MQTL2A.1 gave a maximum of 81 CGs and MQTL6B.3 gave a solitary CG. Many CGs were detected repeatedly in different MQTL regions, and the frequency distributions of these CGs are presented in Fig. 4b. The number of R genes (with domains belonging to NBS-LRR and protein kinase superfamilies) per MQTL ranged from no R gene in several MQTLs to 17 in MQTL6B.1 (Online Resource 8). GO analysis suggested a variety of functions for the CGs including those involved in a variety of biological processes and molecular functions; at least some of them are known to be associated with disease resistance (Online Resource 8). SNPs available in coding sequences (CDS) of CGs available from the four most promising MQTLs (MQTL2B.2, 3B.1, and 3B.2 each conferring resistance to at least four diseases; and MQTL4A.1 providing resistance against three different diseases with highest PVE, 33.14%) were also examined using Ensembl Plants and CerealsDB databases. CGs underlying MQTL2B.2 included 9 SNPs, those associated with MQTL3B.1 included 30 SNPs, and those with MQTL3B.2 included 101 SNPs, whereas no SNP was identified within the CGs associated with MQTL4A.1. Detailed information about SNPs is available in Online Resource 9.
Differentially expressed candidate genes (DECGs) in MQTL regions
In silico expression analysis was performed for a total of 453 CGs detected in 20 most robust and stable MQTLs (those involving at least 4 QTLs) (Online Resource 10). The first transcriptomic dataset revealed 82 DECGs with 23 up-regulated genes, 50 down-regulated genes, and 9 genes that were up-regulated under some conditions and down-regulated under others (Online Resource 10). The number of DECGs ranged from one in MQTL2B.3 to 12 in MQTL2A.1. The second dataset revealed 36 DECGs with 15 genes up-regulated, 12 genes down-regulated, and 9 genes up-regulated under some conditions and down-regulated under others. MQTL2A.1 had the maximum DECGs (9); no DECG was available for the following MQTLs: 1A.1, 2B.3, 4B.1, 7A.4, and 7B.2 (Online Resource 10). The third dataset uncovered 32 DECGs with 10 up-regulated genes, 14 down-regulated genes, and 8 genes that were up-regulated at one time-point and down-regulated in others. From the first and second datasets, MQTL2A.1 had the maximum number of 7 DECGs in all three datasets. The following MQTLs had no DECGs: 2B.3, 4B.1, 5B.7, 7A.2, 7A.4, and 7B.2.
The fourth dataset did not provide expression values of the CGs under control conditions; therefore, comparative evaluation (stress versus control) of the expression of the CGs could not be performed. In this case, we considered those CGs as important for the concerned disease that showed at least 2 TPM expressions. As many as 108 such CGs were discovered. The fifth dataset gave 50 DECGs, with 19 up-regulated genes and 31 down-regulated genes. From this dataset also, MQTL2A.1 had the maximum DECGs (11), while no DECG was identified for 1B.4, 2B.3, and 5B.7. A total of 25 genes were observed to be differentially expressed across three or more expression databases used (Online Resource 10).
Overall, 194 DECGs were identified for all MQTLs (except MQTL4A.1) (Online Resource 10); the number of DECGs per MQTL ranged from 1 (MQTL2B.3) to 36 (MQTL2A.1). Further, these DECGs encoded the following different proteins: (i) R-domain containing proteins, (ii) transcription factors like NAC domain, AP2/ERF, SANT/Myb domain, zinc finger binding domain-containing proteins, etc., (iii) different protein kinases, (iv) transporters like SWEET sugar transporter, sugar/inositol transporter, etc., (v) proteins involved in oxidation–reduction reactions like cytochrome P450, (vi) proteins involved in antioxidative defense, for instance, glutathione S-transferase, (vii) cupin superfamily proteins, for instance, germin-like protein, (viii) invertase inhibitors like pectinesterase inhibitor, etc., (ix) glycosyltransferase enzymes, for instance, UDP-glucuronosyl/UDP-glucosyltransferase, and (x) WD40 repeat proteins. Among the DECGs detected, those with functions earlier reported as important for disease resistance were considered the most promising CGs for individual MQTLs. As many as 85 such CGs were available from 18 MQTLs; these are listed in Online Resource 11 along with their GO terms.
The expression patterns of all the 194 DECGs across different tissues at different wheat developmental stages were also analyzed. Column clustering was performed, and consequently, the 194 DECGs were grouped into two classes based on their expression patterns in different tissues. The expression patterns of some selected CGs in different wheat tissues are shown in Fig. 5. Genes in class I showed high expression in the roots and leaves/shoots at vegetative stages when compared to other stages of growth (Fig. 5). Class I included the genes (encoding mainly for protein kinases, glutathione S-transferase, ankyrin repeat-containing domain, G10 protein, Thiolase, zinc finger, NAC domain, calmodulin-binding protein, and germin-like protein, etc.), whereas genes from Class II showed high expression mainly in the spike (including stamen, rachis, stigma, pistil, and ovary, etc.) and grains (including seed coat, endosperm, embryo, and aleurone layer, etc.) (Fig. 5). The following are some examples of class II genes- cytochrome P450, Pectinesterase inhibitors, and SWEET sugar transporter.
Fig. 5.

Expression pattern of 50 CGs (deferentially expressed under different pathogen inoculations) in 47 tissues. All transcriptomic data were downloaded from expVIP. The change in colour from blue to red signifies alteration in level of expression from low to high
Homoeology among the MQTLs
Homoeology was observed among 48 of the 60 physically anchored MQTLs. The number of conserved genes at corresponding homoeologous positions of MQTLs varied from just a few to hundreds of the genes. The maximum number of genes were conserved among the MQTLs located on chromosomes 4A and 4D followed by the MQTLs on chromosomes 1A and 1B (Circos map, Fig. 6). The following MQTLs exhibited partial homoeology: MQTL2B.1, MQTL5B.3, MQTL6B.2, and MQTL7B.1. Further, in some cases, more than one homoeologous copy of a given gene was also observed per sub-genome. Information on the total number of genes available in the MQTLs and those showing homoeology among different MQTLs is given in Online Resource 12.
Fig. 6.

Circos showing the homoeologous relationships between genes present within the MQTLs located on 20 wheat chromosomes. Ruler drawn above on chromosomes indicates the physical sizes of the chromosomes, with larger and smaller tick marks at every 100 and 20 Mbp, respectively
Discussion
In wheat, disease resistance against each of a number of diseases has been shown to be controlled by R genes as well as QTLs. In case of some necrotrophs, sensitivity (S) genes are also known, which facilitate the pathogen to render the host susceptible. Recessive or null alleles of these S genes can also be used for providing resistance (Gupta et al. 2021b). Examples are also available, where individual QTLs, each conferring resistance to more than one disease, are available (Hernandez et al. 2012; Jighly et al. 2016; Mago et al. 2011; Zwart et al. 2010). These examples have been used to formulate MDR hypothesis, which states that although much of the plant immunity is based on highly specific disease resistance against individual diseases, there is evidence that some components of plant defense provides MDR. The available literature on MDR has been reviewed by Wiesner-Hanks and Nelson (2016).
Availability of individual MQTLs each for more than one diseases, as observed in the present study, is yet another evidence in favor of MDR hypothesis. The present study is perhaps the first study on meta-analysis of QTLs for MDR in wheat, although several meta-analyses have been recently conducted for individual traits (Kumar et al. 2021; Pal et al. 2021; Saini et al. 2021, 2022b). However, meta-analysis of QTLs for MDR has been conducted in some crops including barley, maize, and rice (Ali et al. 2013; Kumar and Nadarajah 2020; Schweizer and Stein, 2011; Wisser et al. 2005).
A characteristic of the QTL data and the consensus map used in the present study was that the B sub-genome had the highest marker density and carried the maximum number of QTLs, whereas the D sub-genome had the lowest marker density and contained the minimum number of QTLs. This feature of marker density and distribution of QTLs used for meta-analysis is in agreement with several earlier studies on meta-analysis for resistance against a number of individual diseases in wheat (Aduragbemi and Soriano, 2021; Goudemand et al. 2013; Jan et al. 2021; Liu et al. 2020; Soriano and Royo, 2015; Venske et al. 2019; Zheng et al. 2020). The markers on individual chromosomes were not evenly distributed, and the density of markers on the two ends of individual chromosomes differed. This was mainly due to the use of independent genetic maps, which differed for numbers and types of markers. Similar cases have also been reported in previous meta-analysis (Kumar et al. 2021; Liu et al. 2020; Venske et al. 2019; Yang et al. 2021).
In the present study, more than 80% (51/63) of the MQTLs were involved in providing resistance to at least two of the five diseases used. Some of these MQTLs (e.g., 2B.2, 3B.1) were associated with resistance to diverse pathogens with a range of lifestyles [necrotrophic (FHB, SNB, and STB), hemibiotrophic (KB) and biotrophic (LS)], whereas others (e.g., 1A.2, 1B.3, 2B.1) were associated with resistance only to necrotrophs (FHB, SNB, and STB). The phenomenon of co-localization of QTLs for MDR in wheat was also discovered in an earlier study, where 13 QTLs spread over on nine wheat chromosomes were significantly associated with resistance to four different diseases, viz. stripe rust, leaf rust, tan spot, and karnal bunt (Hernandez et al. 2012). In another study, Zwart et al. (2010) identified a QTL representing a cluster of tightly linked loci on chromosome 3D for resistance against a number of foliar diseases (STB, tan spot, stripe rust, leaf rust, and stem rust). It is thus obvious that although individual QTLs for MDR were known, no earlier report on meta-analysis of QTLs for MDR is available in wheat.
The occurrence of individual QTLs/genes or MQTLs for MDR may be attributed to pleiotropic effects or clusters of tightly linked QTLs/genes. These closely linked multiple QTLs may be available either in the coupling or in the repulsion phase resulting in positive and negative correlations between resistance against more than one disease. For instance, the wheat Sr2 locus, which provides resistance to stem rust, leaf rust, and powdery mildew (Mago et al. 2011), was tightly linked in the repulsion phase to the Fhb1 locus, which confers resistance to FHB (Flemmig, 2012). Similarly, QTLs for resistance against STB and yellow leaf spot, inherited from one parent, were linked in repulsion to Lr24/Sr24 locus conferring resistance to leaf rust and stem rust inherited from another parent (Zwart et al. 2010). QTLs may be introgressed easily if they are linked in the coupling phase, but introgression of MDR may be relatively difficult if they are linked in the repulsion phase. It is thus obvious that to make efficient use of a MDR source, it is necessary to have a thorough understanding of its inheritance.
In the present study, 63% MQTLs could be validated with earlier reports of GWAS. However, the earlier reports of validation of MQTLs with GWAS include results which are similar to the results of the present study with 61.3% MQTLs validated with GWAS (Yang et al. 2021); there are also reports, which differ from the present study with only 38.66% MQTLs validated by GWAS (Aduragbemi and Soriano, 2021). These widely different results may be attributed to the nature of materials used for interval mapping (eventually utilized for meta-analysis) and GWAS (Saini et al. 2022a).
Some of the MQTLs identified during the present study also overlap known wheat resistance genes. The following are some examples: (i) MQTL6B.3 overlaps Fhb2 (Cuthbert et al. 2007). (ii) MQTL3B.2 overlaps the gene WFhb1-1 (already cloned) (Paudel et al. 2020). (iii) MQTL3B.3 is co-localized with two FHB resistance genes (Ta-UGT3 and Tapgip3) (Hou et al. 2015; Xing et al. 2018). (iv) MQTL5D.2 is co-localized with gene TaNACL-D1 (Perochon et al. 2019). (v) MQTL1B.1 is co-localized with two genes, viz. Chs-1B and Stb11, which provide resistance against KB and STB, respectively. These examples suggest that some MDR MQTLs may also carry major genes for resistance against one or more diseases.
It is also known that a given MDR locus can be either simple (when a single gene underlies an MDR locus) or complex (when several genes underlie an MDR locus) (Cooley et al. 2000; Hulbert et al. 2001). Fine-mapping studies have shown that clusters of homologous R genes frequently underlie resistance loci, including MDR loci (Andersen et al. 2020; Hulbert et al. 2001; Michelmore and Meyers, 1998). The results of the present study involving 874 CGs could also be examined in the context of MDR; 725 of these genes are known to encode different proteins, and at least some of them are relevant for resistance. These genes also included 99 R genes, with several R gene clusters available in 2A.1, 4B.3, 6B.1, and 7A.1 regions. Keeping in view the occurrence of R gene clusters (including those at MDR loci) in plant genomes, we anticipate that more MDR loci, each representing a cluster of closely linked R genes may be discovered in future. R genes within a cluster can confer resistance to distantly related pathogen taxa because sequence changes between closely related members (e.g., homologs or even paralogs) of multigene families can generate novel specificities (Ashfield et al. 2012; Michelmore and Meyers, 1998). For instance, the two homologs of the Arabidopsis HRT/RPP8 gene family confer resistance to Peronospora parasitica and turnip crinkle virus, respectively (Cooley et al. 2000). Similarity, in Arabidopsis, different members of an extensive cluster of disease-resistance loci known as multiple resistance complex J (MRC-J) are known to confer resistance to several viruses, bacteria, an oomycete, and a fungus (Cooley et al. 2000; Gassmann et al. 1999; Narusaka et al. 2004; Takahashi et al. 2002), which also contains several other resistance gene homologs that are yet to be characterized.
The differential expression of CGs observed during the present study agrees with earlier studies (Jan et al 2021; Aduragbemi and Soriano, 2021). The DECGs identified in the present study encoded different proteins, of which at least some are known to confer resistance to different diseases in crop plants; these proteins include the following: NBS-LRR domain containing proteins (Dang et al. 2019; Kaur et al. 2021b), transcription factors (Akio Amorim et al. 2017), protein kinases (Meng and Zhang, 2013), genes involved in oxidation–reduction reactions (Gunupuru et al. 2018), and antioxidative defense (Gullner et al. 2018). The following four complex loci have been shown to confer MDR in wheat: (i) Lr34/Yr18/Sr57/Pm38/Ltn1 (located on 7DS; Krattinger et al. 2009), (ii) Sr2/Lr27/Yr30/Pbc1 (3BS; Mago et al. 2011), (iii) Lr67/Yr46/Sr55/Pm46/Ltn3 (4DL; Herrera-Foessel et al. 2014), (iv) Lr46/Yr29/Sr58/Pm39Ltn2 (1BL; Huerta-Espino et al. 2020). These loci are frequently described as pleiotropic; however, evidence for pleiotropy against close linkage is not unequivocal. However, no MDR loci conferring resistance to any of the five diseases studied in the present study have been reported. Among the four complex loci mentioned above, there are two complex loci which deserve further discussion; for instance, Lr34 multi-pathogen resistance loci encodes an ATP-binding cassette (ABC) transporter which regulate the translocation of phospholipids involved in signal transduction cascades at the plasma membrane, thereby conferring resistance to multiple pathogens (Deppe et al. 2018). Another example of complex locus is Lr67, which encodes a predicted hexose transporter that confers resistance against multiple pathogens by reducing the glucose transport activity (Moore et al. 2015). Some DECGs detected in the present study also encode different transporters, for instance, SWEET sugar transporter (TraesCS2A02G043200; MQTL2A.1) and sugar/inositol transporter (TraesCS3B02G047300; MQTL3B.1). Further studies can be conducted to explore their roles in providing resistance to multiple diseases in wheat.
Some of the important CGs detected during the present study may be validated or functionally characterized using different approaches like overexpression, gene editing, knockout strategies, or CG-based association mapping. Reports are also available where some of these approaches have been used for validation of genes for their role in MDR. For instance, overexpression of the Lr34res multi-pathogen resistance gene encoding an ABC transporter protein conferred resistance against rust and anthracnose diseases in sorghum (Schnippenkoetter et al. 2017). Similarly, in another study, CRISPR/Cas9-based genome editing technique was used to target tomato gene SlDmr6-1 encoding protein belonging to 2-oxoglutarate Fe(II)-dependent oxygenases; these oxygenases provide broad-spectrum resistance against multiple pathogens including Pseudomonas syringae, Phytophthora capsici, and Xanthomonas spp. in tomato (de Toledo Thomazella et al. 2016).
In breeding programs, two types of disease resistance are considered: race-specific or all-stage resistance (ASR) and non-race-specific and durable resistance or APR. A study of the expression of CGs across different tissues and developmental stages can help us figure out whether the gene has a role in ASR or APR. Keeping this in view, the CGs identified in the present study were grouped into two classes based on their expression patterns in different tissues. Class I included genes (mainly encoding for protein kinases, glutathione S-transferase, ankyrin repeat-containing domain, germin-like protein, and thiolase, etc.) which are believed to be involved in detection and activation of different physiological and developmental signals, particularly those involved in defense or plant-pathogen interactions, inferring their roles in seedling resistance or ASR (AbuQamar et al. 2008; Aduragbemi and Soriano, 2021; Gullner et al. 2018; Lv et al. 2019; Manosalva et al. 2009; Wang et al. 2019). Signaling role for a protein kinase gene in an ethylene-mediated shared defense mechanism was reported in tomato for resistance to necrotrophic fungi and herbivorous insects (AbuQamar et al. 2008). Similarly, a receptor like kinase gene associated with TaWRKY76 and TaWRKY62 has been recently shown to play a positive role in wheat seedling resistance to yellow rust (Wang et al. 2019). Induction of glutathione S-transferase genes or elevated glutathione S-transferase activities have often been observed in plants treated with different fungal and bacterial pathogens that induce a systemic resistance response to subsequent pathogen infections (Gullner et al. 2018). Different roles played by glutathione S-transferase genes in plant-pathogen interactions have been reviewed by Gullner et al. (2018). Genes belonging to germin-like protein family conferred resistance to multiple pathogens in rice with basal mechanisms conserved among all the cereals (Manosalva et al. 2009).
Class II included genes, which showed high expression mainly in the spike and grains suggesting their association with APR (Fig. 5). The following are some examples of class II genes encoding proteins involved in APR in different crops: cytochrome P450 (Gunupuru et al. 2018), pectinesterase inhibitors (Liu et al. 2018), and SWEET sugar transporter (Breia et al. 2021). A wheat cytochrome P450 was shown to enhance both resistance to FHB and grain yield in wheat (Gunupuru et al. 2018). Pectinesterase inhibitors have been previously shown to play a key role in defense against both bacteria and fungi (Wormit and Usadel, 2018). Liu et al. (2018) provided evidence that the pectin methylesterase-inhibiting protein GhPMEI3 functions in plant responses to infection by the fungus Verticillium dahlia in cotton. In Arabidopsis, overexpression of the tonoplast AtSWEET2 during Pythium irregulare infection restricted sugar availability to the pathogen, making plants more resistant. Further, the combination of seedling resistance and adult plant resistance has been shown to confer prolonged resistance (Figlan et al. 2020).
Homoeologous relationships among MQTLs
In the present study, homoeologous relationships were observed among different MQTLs, showing the duplicated or triplicated copies of the genes conferring resistance to different fungal diseases in wheat. Differences in the number of CGs conserved among the MQTLs located on three homoeologous chromosomes of a group were also observed. This unequal distribution of genes across three homoeologues of a group could be due to a variety of evolutionary events such as gene duplication, gene loss, and chromosomal translocations (Clavijo et al. 2017). From a crop improvement perspective, identifying homoeologs that may have been functionally conserved is important for elucidating or engineering the genetic basis for traits of interest (Huo et al. 2018; Juery et al. 2021). Detection of homoeologous genes among different MQTLs does not necessarily mean that these homoeologs are functionally conserved. These genes may be functionally different, although such a high rate of functional diversity is less surprising if the genes belong to the NBS-LRR class, as disease resistance genes in this class are among the most dynamically evolving gene functional groups known, with frequent duplication and rapid turnover (Mchale et al. 2006).
Gene expression studies in wheat have shown that homoeolog-specific transcriptional dominance affects up to 19% of genes (Akhunova et al. 2010), with different homoeologs predominating in different groups of functionally related genes and exhibiting tissue- or development-specific patterns of expression (Pfeifer et al. 2014; Takahagi et al. 2018). Further studies are required to understand the distribution of transcriptionally differentiated homoeologs in gene regulatory networks and their related biological relevance in hexaploid wheat. Such genes and transcriptional modules may prove useful in breeding for MDR in wheat.
MDR-MQTLs for resistance breeding
Eleven MQTLs were involved in providing resistance against three or more diseases (Table 2). After critical evaluation of these MQTLs, the following three promising MQTLs were selected: (i) MQTL2B.2, (ii) MQTL3B.2 (co-localized with major gene WFhb1-1), and (iii) MQTL4A.1 (co-localizing with major gene Stb12). Each of these MQTLs was validated with GWAS-MTAs. Furthermore, they had small CI (less than 2 cM) and a comparatively high LOD score (> 6). MQTL2B.2 involved six QTLs providing resistance against all five diseases: STB, SNB, FHB, KB, and LS with average PVE of 20.8%. MQTL3B.2 also included six QTLs conferring resistance to four diseases: STB, SNB, FHB, and KB, with an average PVE of 17.19%. MQTL4A.1 involved five QTLs providing resistance against three diseases, FHB, STB, and KB, with a maximum PVE of 33.14%. These MDR-MQTLs can be used for MAS in wheat breeding programs targeted toward developing wheat varieties with resistance against more than one disease included in the present study. SNPs were also identified within CDS regions of some promising CGs underlying two of the above mentioned MQTLs (2B.2 and 3B.2). Association of these SNPs with MDR may be determined using any of the available approaches including association studies for both single SNPs and haplotypes (N’Diaye et al. 2017; Sandhu et al. 2022). Favorable allelic variants contributing resistance to multiple diseases may be examined and used in breeding programs.
Concluding remarks
In the present study, we integrated the results of QTL mapping studies on STB, SNB, FHB, KB, and LS resistance leading to the identification of 63 MQTLs in wheat. More than half of these MQTLs were also validated using the results from GWAS. As many as 12 known major resistance genes were also found to be co-located with some of these MQTLs. Although there was only one MQTL (2B.2) providing resistance for all the five diseases, there were at least ten MQTLs that were involved in providing resistance against three or four diseases. The results of the present study will be useful for developing resistance to multiple diseases through the introgression of promising MQTLs into elite wheat germplasm and accelerate breeding for enhanced MDR. A fairly large number of R genes and defense genes were also identified within these MQTL regions; of these CGs, as many as 194 genes showed differential expressions across different transcriptomic datasets investigated; based on expression studies, 85 promising genes were selected and recommended for future basic studies. The results of the present study may support the improvement in breeding strategies for MDR.
Supplementary Information
Below is the link to the electronic supplementary material.
Acknowledgements
The Department of Science and Technology (DST), New Delhi, India, provided DKS with an INSPIRE fellowship, while the Head, Department of Plant Breeding and Genetics, Punjab Agricultural University, Ludhiana, India, provided the necessary facilities.
Authors' contributions
PS and PKG conceived and planned the study. AC, DKS, and NP collected the literature and tabulated the data for meta-analysis. DKS conducted the analysis. DKS and AC interpreted the results and wrote the first draft of the manuscript. PKG and PS edited and finalized the manuscript with the help of DKS.
Funding
This research received no external funding.
Data availability
Data generated or analyzed during this study are included in this published article (and its Supplementary Material).
Code availability
Not applicable.
Declarations
Ethics approval
Not applicable.
Consent to participate
Not applicable.
Consent for publication
Not applicable.
Conflicts of interest/Competing interests
There are no competing interests declared by the authors.
Footnotes
Publisher's note
Springer Nature remains neutral with regard to jurisdictional claims in published maps and institutional affiliations.
References
- AbuQamar S, Chai MF, Luo H, Song F, Mengiste T. Tomato protein kinase 1b mediates signaling of plant responses to necrotrophic fungi and insect herbivory. Plant Cell. 2008;20:1964–1983. doi: 10.1105/tpc.108.059477. [DOI] [PMC free article] [PubMed] [Google Scholar]
- Aduragbemi A, Soriano JM. Unravelling consensus genomic regions conferring leaf rust resistance in wheat via meta-QTL analysis. Plant Genome. 2021 doi: 10.1101/2021.05.11.443557. [DOI] [PMC free article] [PubMed] [Google Scholar]
- Akhunova AR, Matniyazov RT, Liang H, Akhunov ED. Homoeolog-specific transcriptional bias in allopolyploid wheat. BMC Genomics. 2010;11:1–16. doi: 10.1186/1471-2164-11-505. [DOI] [PMC free article] [PubMed] [Google Scholar]
- Akio Amorim LL, da Fonseca dos Santos R, Pacifico Bezerra Neto J, Guida-Santos M, Crovella S, Maria Benko-Iseppon A (2017) Transcription factors involved in plant resistance to pathogens. Curr Protein Pept Sci 18:335-351 [DOI] [PubMed]
- Alemu A, Brazauskas G, Gaikpa DS, Henriksson T, Islamov B, JØrgensen LN, Koppel M, Koppel R, Liatukas Ž, Svensson JT and Chawade A (2021) Genome-wide association analysis and genomic prediction for adult-plant resistance to Septoria tritici blotch and powdery mildew in winter wheat. Front Genet 12:66174210.3389/fgene.2021.661742 [DOI] [PMC free article] [PubMed]
- Ali F, Pan Q, Chen G, Zahid KR, Yan J, (2013) Evidence of multiple disease resistance (MDR) and implication of meta-analysis in marker assisted selection. PLoS One 8:pe68150. 10.1371/journal.pone.0068150 [DOI] [PMC free article] [PubMed]
- AlTameemi R, Gill HS, Ali S, et al. Genome-wide association analysis permits characterization of Stagonospora nodorum blotch (SNB) resistance in hard winter wheat. Sci Rep. 2021;11:12570. doi: 10.1038/s41598-021-91515-6. [DOI] [PMC free article] [PubMed] [Google Scholar]
- Andersen EJ, Nepal MP, Purintun JM, Nelson D, Mermigka G, Sarris PF. Wheat disease resistance genes and their diversification through integrated domain fusions. Front Genet. 2020;11:p898. doi: 10.3389/fgene.2020.00898. [DOI] [PMC free article] [PubMed] [Google Scholar]
- Arcade A, Labourdette A, Falque M, Mangin B, Chardon F, Charcosset A, Joets J. BioMercator: integrating genetic maps and QTL towards discovery of candidate genes. Bioinformatics. 2004;20:2324–2326. doi: 10.1093/bioinformatics/bth230. [DOI] [PubMed] [Google Scholar]
- Ashfield T, Egan AN, Pfeil BE, et al. Evolution of a complex disease resistance gene cluster in diploid Phaseolus and tetraploid Glycine. Plant Physiol. 2012;159:336–354. doi: 10.1104/pp.112.195040. [DOI] [PMC free article] [PubMed] [Google Scholar]
- Breia R, Conde A, Badim H, Fortes AM, Gerós H, Granell A. Plant SWEETs: from sugar transport to plant–pathogen interaction and more unexpected physiological roles. Plant Physiol. 2021;186:836–852. doi: 10.1093/plphys/kiab127. [DOI] [PMC free article] [PubMed] [Google Scholar]
- Buhrow LM, Cram D, Tulpan D, Foroud NA, Loewen MC. Exogenous abscisic acid and gibberellic acid elicit opposing effects on Fusarium graminearum infection in wheat. Phytopathology. 2016;106:986–996. doi: 10.1094/PHYTO-01-16-0033-R. [DOI] [PubMed] [Google Scholar]
- Cavanagh CR, Chao S, Wang S, et al. Genome-wide comparative diversity uncovers multiple targets of selection for improvement in hexaploid wheat landraces and cultivars. Proc Natl Acad Sci. 2013;110:8057–8062. doi: 10.1073/pnas.1217133110. [DOI] [PMC free article] [PubMed] [Google Scholar]
- Chardon F, Virlon B, Moreau L, et al. Genetic architecture of flowering time in maize as inferred from quantitative trait loci meta-analysis and synteny conservation with the rice genome. Genetics. 2004;168:2169–2185. doi: 10.1534/genetics.104.032375. [DOI] [PMC free article] [PubMed] [Google Scholar]
- Chen C, Chen H, Zhang Y, Thomas HR, Frank MH, He Y, Xia R. TBtools: an integrative toolkit developed for interactive analyses of big biological data. Mol Plant. 2020;13:1194–1202. doi: 10.1016/j.molp.2020.06.009. [DOI] [PubMed] [Google Scholar]
- Clavijo BJ, Venturini L, Schudoma C, Accinelli GG, Kaithakottil G, Wright J, Borrill P, Kettleborough G, Heavens D, Chapman H, Lipscombe J (2017) An improved assembly and annotation of the allohexaploid wheat genome identifies complete families of agronomic genes and provides genomic evidence for chromosomal translocations. Genome Res 27:885–896. http://www.genome.org/cgi/doi/10.1101/gr.217117.116 [DOI] [PMC free article] [PubMed]
- Cooley MB, Pathirana S, Wu HJ, Kachroo P, Klessig DF. Members of the Arabidopsis HRT/RPP8 family of resistance genes confer resistance to both viral and oomycete pathogens. Plant Cell. 2000;12:663–676. doi: 10.1105/tpc.12.5.663. [DOI] [PMC free article] [PubMed] [Google Scholar]
- Cuthbert PA, Somers DJ, Brulé-Babel A. Mapping of Fhb2 on chromosome 6BS: a gene controlling Fusarium head blight field resistance in bread wheat (Triticum aestivum L) Theor Appl Genet. 2007;114:429–437. doi: 10.1007/s00122-006-0439-3. [DOI] [PubMed] [Google Scholar]
- Dang PM, Lamb MC, Bowen KL, Chen CY. Identification of expressed R-genes associated with leaf spot diseases in cultivated peanut. Mol Biol Rep. 2019;46:225–239. doi: 10.1007/s11033-018-4464-5. [DOI] [PubMed] [Google Scholar]
- Darvasi A, Soller M. A simple method to calculate resolving power and confidence interval of QTL map location. Behav Genet. 1997;27:125–132. doi: 10.1023/A:1025685324830. [DOI] [PubMed] [Google Scholar]
- de Toledo Thomazella DP, Brail Q, Dahlbeck D, Staskawicz B (2016) CRISPR-Cas9 mediated mutagenesis of a DMR6 ortholog in tomato confers broad-spectrum disease resistance. BioRxiv p064824 10.1101/064824 [DOI] [PMC free article] [PubMed]
- Deppe JP, Rabbat R, Hörtensteiner S, Keller B, Martinoia E, Lopéz-Marqués RL. The wheat ABC transporter Lr34 modifies the lipid environment at the plasma membrane. J Biol Chem. 2018;293:18667–18679. doi: 10.1074/jbc.RA118.002532. [DOI] [PMC free article] [PubMed] [Google Scholar]
- Dutta A, Croll D, McDonald BA, et al. Genome-wide association study for septoria tritici blotch resistance reveals the occurrence and distribution of Stb6 in a historic Swiss landrace collection. Euphytica. 2021;217:108. doi: 10.1007/s10681-021-02843-7. [DOI] [Google Scholar]
- Duveiller E, Singh RP, Nicol JM. The challenges of maintaining wheat productivity: pests diseases and potential epidemics. Euphytica. 2007;157:417–430. doi: 10.1007/s10681-007-9380-z. [DOI] [Google Scholar]
- Emebiri L, Singh S, Tan MK et al (2019) Unravelling the complex genetics of Karnal bunt (Tilletia indica) resistance in common wheat (Triticum aestivum) by genetic linkage and genome-wide association analyses. G3: Genes Genom Genet 9:1437–1447. 10.1534/g3.119.400103 [DOI] [PMC free article] [PubMed]
- Endelman JB, Plomion C. LPmerge: an R package for merging genetic maps by linear programming. Bioinformatics. 2014;30:1623–1624. doi: 10.1093/bioinformatics/btu091. [DOI] [PubMed] [Google Scholar]
- Figlan S, Ntushelo K, Mwadzingeni L, Terefe T, Tsilo TJ, Shimelis H. Breeding wheat for durable leaf rust resistance in Southern Africa: variability distribution current control strategies challenges and future prospects. Front Plant Sci. 2020;11:549. doi: 10.3389/fpls.2020.00549. [DOI] [PMC free article] [PubMed] [Google Scholar]
- Flemmig EL (2012) Molecular markers to deploy and characterize stem rust resistance in wheat MS Thesis N C State Univ Raleigh
- Friesen TL, Xu SS, Harris MO. Stem rust, tan spot, Stagonosporanodorum blotch, and Hessian fl y resistance in Langdon durum-Aegilops tauschii synthetic hexaploid wheat lines. Crop Sci. 2008;48:1062–1070. doi: 10.2135/cropsci2007.08.0463. [DOI] [Google Scholar]
- Gassmann W, Hinsch ME, Staskawicz BJ. The Arabidopsis RPS4 bacterial-resistance gene is a member of the TIR-NBS-LRR family of disease-resistance genes. Plant J. 1999;20:265–277. doi: 10.1046/j.1365-313X.1999.00600.x. [DOI] [PubMed] [Google Scholar]
- Gerard GS, Börner A, Lohwasser U, et al. Genome-wide association mapping of genetic factors controlling Septoria tritici blotch resistance and their associations with plant height and heading date in wheat. Euphytica. 2017;213:27. doi: 10.1007/s10681-016-1820-1. [DOI] [Google Scholar]
- Gillies SA, Futardo A, Henry RJ. Gene expression in the developing aleurone and starchy endosperm of wheat. Plant Biotechnol. 2012;J10:668–679. doi: 10.1111/j.1467-7652.2012.00705.x. [DOI] [PubMed] [Google Scholar]
- Goffinet B, Gerber S. Quantitative trait loci: a meta-analysis. Genetics. 2000;155:463–473. doi: 10.1093/genetics/155.1.463. [DOI] [PMC free article] [PubMed] [Google Scholar]
- Gou L, Hattori J, Fedak G, Balcerzak M, Sharpe A, Visendi P, Edwards D, Tinker N, Wei YM, Chen GY, Ouellet T. Development and validation of Thinopyrum elongatum–expressed molecular markers specific for the long arm of chromosome 7E. Crop Sci. 2016;56:354–364. doi: 10.2135/cropsci2015.03.0184. [DOI] [Google Scholar]
- Goudemand E, Laurent V, Duchalais L, Ghaffary SMT, Kema GH, Lonnet P, Margalé E, Robert O. Association mapping and meta-analysis: two complementary approaches for the detection of reliable Septoria tritici blotch quantitative resistance in bread wheat (Triticum aestivum L) Mol Breed. 2013;32:563–584. doi: 10.1007/s11032-013-9890-4. [DOI] [Google Scholar]
- Gullner G, Komives T, Király L, Schröder P. Glutathione S-transferase enzymes in plant-pathogen interactions. Front Plant Sci. 2018;9:1836. doi: 10.3389/fpls.2018.01836. [DOI] [PMC free article] [PubMed] [Google Scholar]
- Gunupuru LR, Arunachalam C, Malla KB, Kahla A, Perochon A, Jia J, Thapa G, Doohan FM. A wheat cytochrome P450 enhances both resistance to deoxynivalenol and grain yield. PLoS ONE. 2018;13:0204992. doi: 10.1371/journal.pone.0204992. [DOI] [PMC free article] [PubMed] [Google Scholar]
- Guo B, Sleper DA, Lu P, Shannon JG, Nguyen HT, Arelli PR. QTLs associated with resistance to soybean cyst nematode in soybean: meta-analysis of QTL locations. Crop Sci. 2006;46:595. doi: 10.2135/cropsci2005.04-0036-2. [DOI] [Google Scholar]
- Gupta PK, Balyan HS, Chhuneja P et al (2021a) Pyramiding of genes for grain protein content, grain quality and rust resistance in eleven Indian bread wheat cultivars: a multi-institutional effort. 10.21203/rs.3.rs-637558/v1 [DOI] [PMC free article] [PubMed]
- Gupta PK, Vasistha NK, Singh PK (2021b) Sensitivity genes in wheat and corresponding effector genes in necrotrophs exhibiting inverse gene-for-gene relationship. 10.21203/rs.3.rs-223024/v1
- Gupta V, He X, Kumar N, et al. Genome wide association study of karnal bunt resistance in a wheat germplasm collection from Afghanistan. Int J Mol Sci. 2019;20:3124. doi: 10.3390/ijms20133124. [DOI] [PMC free article] [PubMed] [Google Scholar]
- Gurung S, Bonman JM, Ali S, Patel J, Myrfield M, Mergoum M, Singh PK, Adhikari TB. New and diverse sources of multiple disease resistance in wheat. Crop Sci. 2009;49:1655–1666. doi: 10.2135/cropsci2008.10.0633. [DOI] [Google Scholar]
- Hernandez MV, Crossa J, Singh PK, Bains NS, Singh K, Sharma I (2012) Multi-trait and multi-environment QTL analyses for resistance to wheat diseases. PLoS One 7:pe38008. 10.1371/journal.pone.0038008 [DOI] [PMC free article] [PubMed]
- Herrera-Foessel SA, Singh RP, Lillemo M, Huerta-Espino J, Bhavani S, Singh S, Lan C, Calvo-Salazar V, Lagudah ES. Lr67/Yr46 confers adult plant resistance to stem rust and powdery mildew in wheat. Theor Appl Genet. 2014;127:781–789. doi: 10.1007/s00122-013-2256-9. [DOI] [PubMed] [Google Scholar]
- Holder A (2018) A Genome wide association study for Fusarium head blight resistance in southern soft red winter wheat. Graduate theses and dissertations Retrieved from https://scholarworks.uark.edu/etd/2636
- Hou W, Mu J, Li A, Wang H, Kong L. Identification of a wheat polygalacturonase-inhibiting protein involved in Fusarium head blight resistance. Eur J Plant Pathol. 2015;141:731–745. doi: 10.1007/s10658-014-0574-7. [DOI] [Google Scholar]
- Hu W, Gao D, Wu H et al (2020) Genome-wide association mapping revealed syntenic loci QFhb-4AL and QFhb-5DL for Fusarium head blight resistance in common wheat (Triticum aestivum L.). BMC Plant Biol 20:29. 10.1186/s12870-019-2177-0 [DOI] [PMC free article] [PubMed]
- Huerta-Espino J, Singh R, Crespo-Herrera LA, Villaseñor-Mir HE, Rodriguez-Garcia MF, Dreisigacker S, Barcenas-Santana D, Lagudah E. Adult plant slow rusting genes confer high levels of resistance to rusts in bread wheat cultivars from Mexico. Front Plant Sci. 2020;11:824. doi: 10.3389/fpls.2020.00824. [DOI] [PMC free article] [PubMed] [Google Scholar]
- Hulbert SH, Webb CA, Smith SM, Sun Q. Resistance gene complexes: evolution and utilization. Annu Rev Phytopathol. 2001;39:285–312. doi: 10.1146/annurev.phyto.39.1.285. [DOI] [PubMed] [Google Scholar]
- Huo N, Zhang S, Zhu T, Dong L, Wang Y, Mohr T, Hu T, Liu Z, Dvorak J, Luo MC, Wang D. Gene duplication and evolution dynamics in the homeologous regions harboring multiple prolamin and resistance gene families in hexaploid wheat. Front Plant Sci. 2018;9:673. doi: 10.3389/fpls.2018.00673. [DOI] [PMC free article] [PubMed] [Google Scholar]
- Jan I, Saripalli G, Kumar K et al (2021) Meta-QTL Analysis for Stripe Rust Resistance in Wheat. 10.21203/rs.3.rs-380807/v1
- Jighly A, Alagu M, Makdis F, Singh M, Singh S, Emebiri LC, Ogbonnaya FC. Genomic regions conferring resistance to multiple fungal pathogens in synthetic hexaploid wheat. Mol Breed. 2016;36:1–19. doi: 10.1007/s11032-016-0541-4. [DOI] [Google Scholar]
- Juery C, Concia L, De Oliveira R, Papon N, Ramírez-González R, Benhamed M, Uauy C, Choulet F, Paux E. New insights into homoeologous copy number variations in the hexaploid wheat genome. Plant Genome. 2021 doi: 10.1002/tpg2.20069. [DOI] [PMC free article] [PubMed] [Google Scholar]
- Kaur B, Bhatia D, Mavi GS. Eighty years of gene-for-gene relationship and its applications in identification and utilization of R genes. J Genet. 2021;100:1–17. doi: 10.1007/s12041-021-01300-7. [DOI] [PubMed] [Google Scholar]
- Kaur B, Sandhu KS, Kamal R, Kaur K, Singh J, Röder MS, Muqaddasi QH. Omics for the improvement of abiotic, biotic, and agronomic traits in major cereal crops: applications, challenges, and prospects. Plants. 2021;10:1989. doi: 10.3390/plants10101989. [DOI] [PMC free article] [PubMed] [Google Scholar]
- Kidane YG, Hailemariam BN, Mengistu DK, Fadda C, Pè ME and Dell'Acqua M (2017) Genome-wide association study of Septoria tritici blotch resistance in Ethiopian durum wheat landraces. Front Plant Sci 8:1586 10.3389/fpls.2017.01586 [DOI] [PMC free article] [PubMed]
- Knox RE, Campbell HL, Clarke FR, et al. Quantitative trait loci for resistance in wheat (Triticum aestivum) to Ustilago tritici. Can J Plant Pathol. 2014;36:187–201. doi: 10.1080/07060661.2014.905497. [DOI] [Google Scholar]
- Kou Y, Wang S. Broad-spectrum and durability: understanding of quantitative disease resistance. Curr Opin Plant Biol. 2010;13:181–185. doi: 10.1016/j.pbi.2009.12.010. [DOI] [PubMed] [Google Scholar]
- Krattinger SG, Lagudah ES, Spielmeyer W, Singh RP, Huerta-Espino J, McFadden H, Bossolini E, Selter LL, Keller B. A putative ABC transporter confers durable resistance to multiple fungal pathogens in wheat. Science. 2009;323:1360–1363. doi: 10.1126/science.1166453. [DOI] [PubMed] [Google Scholar]
- Kugler KG, Siegwart G, Nussbaumer T, et al. Quantitative trait loci-dependent analysis of a gene co-expression network associated with Fusarium head blight resistance in bread wheat (Triticum aestivum L) BMC Genomics. 2013;14:1–15. doi: 10.1186/1471-2164-14-728. [DOI] [PMC free article] [PubMed] [Google Scholar]
- Kumar IS, Nadarajah K. A meta-analysis of quantitative trait loci associated with multiple disease resistance in rice (Oryza sativa L) Plants. 2020;9:1491. doi: 10.3390/plants9111491. [DOI] [PMC free article] [PubMed] [Google Scholar]
- Kumar S, Singh VP, Saini DK, Sharma H, Saripalli G, Kumar S, Balyan HS, Gupta PK. Meta-QTLs, ortho-MQTLs, and candidate genes for thermotolerance in wheat (Triticum aestivum L.) Mol Breed. 2021;41:1–22. doi: 10.1007/s11032-021-01264-7. [DOI] [PMC free article] [PubMed] [Google Scholar]
- Larkin DL, Holder AL, Mason RE, et al. Genome-wide analysis and prediction of Fusarium head blight resistance in soft red winter wheat. Crop Sci. 2020;60:2882–2900. doi: 10.1002/csc2.20273. [DOI] [Google Scholar]
- Leach LJ, Belfield EJ, Jiang C, Brown C, Mithani A, Harberd NP. Patterns of homoeologous gene expression shown by RNA sequencing in hexaploid bread wheat. BMC Genomics. 2014;15:1–19. doi: 10.1186/1471-2164-15-276. [DOI] [PMC free article] [PubMed] [Google Scholar]
- Li HZ, Gao X, Li XY, Chen QJ, Dong J, Zhao WC (2013) Evaluation of assembly strategies using RNA-seq data associated with grain development of wheat (Triticum aestivum L). PlOS one 8:pe83530. 10.1371/journal.pone.0083530 [DOI] [PMC free article] [PubMed]
- Liu N, Sun Y, Pei Y, Zhang X, Wang P, Li X, Li F, Hou Y. A pectin methylesterase inhibitor enhances resistance to Verticillium wilt. Plant Physiol. 2018;176:2202–2220. doi: 10.1104/pp.17.01399. [DOI] [PMC free article] [PubMed] [Google Scholar]
- Liu Y, Salsman E, Wang R, Galagedara N, Zhang Q, Fiedler JD, Liu Z, Xu S, Faris J, Li X. Meta-QTL analysis of tan spot resistance in wheat. Theor Appl Genet. 2020;133:2363–2375. doi: 10.1007/s00122-020-03604-1. [DOI] [PubMed] [Google Scholar]
- Lv T, Li X, Fan T, Luo H, Xie C, Zhou Y, Tian CE. The calmodulin-binding protein IQM1 interacts with CATALASE2 to affect pathogen defense. Plant Physiol. 2019;181:1314–1327. doi: 10.1104/pp.19.01060. [DOI] [PMC free article] [PubMed] [Google Scholar]
- Mago R, Tabe L, McIntosh RA, Pretorius Z, et al. A multiple resistance locus on chromosome arm 3BS in wheat confers resistance to stem rust (Sr2) leaf rust (Lr27) and powdery mildew. Theor Appl Genet. 2011;123:615–623. doi: 10.1007/s00122-011-1611-y. [DOI] [PubMed] [Google Scholar]
- Mahboubi M, Talebi R, Mehrabi R et al (2021) Genome-wide association mapping in wheat reveals novel QTLs and potential candidate genes involved in resistance to septoria tritici blotch. 10.21203/rs.3.rs-486336/v1
- Manosalva PM, Davidson RM, Liu B, Zhu X, Hulbert SH, Leung H, Leach JE. A germin-like protein gene family functions as a complex quantitative trait locus conferring broad-spectrum disease resistance in rice. Plant Physiol. 2009;149:286–296. doi: 10.1104/pp.108.128348. [DOI] [PMC free article] [PubMed] [Google Scholar]
- Marone D, Russo MA, Laidò G, De Vita P, Papa R, Blanco A, Gadaleta A, Rubiales D, Mastrangelo AM. Genetic basis of qualitative and quantitative resistance to powdery mildew in wheat: from consensus regions to candidate genes. BMC Genomics. 2013;14:1–17. doi: 10.1186/1471-2164-14-562. [DOI] [PMC free article] [PubMed] [Google Scholar]
- McHale L, Tan X, Koehl P, Michelmore RW. Plant NBS-LRR proteins: adaptable guards. Genome Biol. 2006;7:1–11. doi: 10.1186/gb-2006-7-4-212. [DOI] [PMC free article] [PubMed] [Google Scholar]
- Meng X, Zhang S. MAPK cascades in plant disease resistance signalling. Annu Rev Phytopathol. 2013;51:245–266. doi: 10.1146/annurev-phyto-082712-102314. [DOI] [PubMed] [Google Scholar]
- Michelmore RW, Meyers BC. Clusters of resistance genes in plants evolve by divergent selection and a birth-and-death process. Genome Res. 1998;8:1113–1130. doi: 10.1101/gr.8.11.1113. [DOI] [PubMed] [Google Scholar]
- Miedaner T, Akel W, Flath K, Jacobi A, Taylor M, Longin F, Würschum T. Molecular tracking of multiple disease resistance in a winter wheat diversity panel. Theor Appl Genet. 2020;133:419–431. doi: 10.1007/s00122-019-03472-4. [DOI] [PubMed] [Google Scholar]
- Moore JW, Herrera-Foessel S, Lan C, et al. A recently evolved hexose transporter variant confers resistance to multiple pathogens in wheat. Nat Genet. 2015;47:1494–1498. doi: 10.1038/ng.3439. [DOI] [PubMed] [Google Scholar]
- Muqaddasi QH, Zhao Y, Rodemann B, Plieske J, Ganal MW, Röder MS. Genome-wide association mapping and prediction of adult stage Septoria tritici blotch infection in European winter wheat via high-density marker arrays. Plant Genome. 2019;12:180029. doi: 10.3835/plantgenome2018.05.0029. [DOI] [PMC free article] [PubMed] [Google Scholar]
- N’Diaye A, Haile JK, Cory AT, Clarke FR, Clarke JM, Knox RE, Pozniak CJ. Single marker and haplotype-based association analysis of semolina and pasta colour in elite durum wheat breeding lines using a high-density consensus map. PLoS One. 2017;12:e0170941. doi: 10.1371/journal.pone.0170941. [DOI] [PMC free article] [PubMed] [Google Scholar]
- Narusaka Y, Narusaka M, Park P, et al. RCH1 a locus in Arabidopsis that confers resistance to the hemibiotrophic fungal pathogen Colletotrichum higginsianum. Mol Plant Microbe Interact. 2004;17:749–762. doi: 10.1094/MPMI.2004.17.7.749. [DOI] [PubMed] [Google Scholar]
- Nene YL. Multiple-disease resistance in grain legumes. Annu Rev Phytopathol. 1988;26:203–217. doi: 10.1146/annurev.py.26.090188.001223. [DOI] [Google Scholar]
- Pal N, Saini DK, Kumar S (2021) Meta-QTLs, ortho-MQTLs and candidate genes for the traits contributing to salinity stress tolerance in common wheat (Triticum aestivum L.). Physiol Mol Biol Plants 1–20. 10.1007/s12298-021-01112-0 [DOI] [PMC free article] [PubMed]
- Paudel B, Zhuang Y, Galla A, Dahal S, Qiu Y, Ma A, Raihan T, Yen Y. WFhb1-1 plays an important role in resistance against Fusarium head blight in wheat. Sci Rep. 2020;10:1–15. doi: 10.1038/s41598-020-64777-9. [DOI] [PMC free article] [PubMed] [Google Scholar]
- Perochon A, Kahla A, Vranić M, Jia J, Malla KB, Craze M, Wallington E, Doohan FM. A wheat NAC interacts with an orphan protein and enhances resistance to Fusarium head blight disease. Plant Biotechnol J. 2019;17:1892–1904. doi: 10.1111/pbi.13105. [DOI] [PMC free article] [PubMed] [Google Scholar]
- Pfeifer M, Kugler KG, Sandve SR, Zhan B, Rudi H, Hvidsten TR, Mayer KF, Olsen OA. Genome interplay in the grain transcriptome of hexaploid bread wheat. Science. 2014;345:1250091. doi: 10.1126/science.1250091. [DOI] [PubMed] [Google Scholar]
- Phan HTT, Rybak K, Bertazzoni S, et al. Novel sources of resistance to Septoria nodorum blotch in the Vavilov wheat collection identified by genome-wide association studies. Theor Appl Genet. 2018;131:1223–1238. doi: 10.1007/s00122-018-3073-y. [DOI] [PMC free article] [PubMed] [Google Scholar]
- Pooja S, Sharma RB, Singh AK, Rakesh S, Sundeep K. Multiple disease resistance in wheat: need of today. Wheat Information Service. 2014;118:7–16. [Google Scholar]
- Ramírez-González RH, Borrill P, Lang D, et al. The transcriptional landscape of polyploid wheat. Science. 2018;361:6403. doi: 10.1126/science.aar6089. [DOI] [PubMed] [Google Scholar]
- Rana M, Kaldate R, Nabi SU, Wani SH, Khan H (2021) Marker-assisted breeding for resistance against wheat rusts. In physiological molecular and genetic perspectives of wheat improvement (pp 229–262) Springer Cham 10.1007/978-3-030-59577-7_11
- Saini DK, Chopra Y, Pal N, Chahal A, Srivastava P, Gupta PK. Meta-QTLs, ortho-MQTLs and candidate genes for nitrogen use efficiency and root system architecture in bread wheat (Triticum aestivum L.) Physiol Mol Biol Plants. 2021;27:2245–2267. doi: 10.1007/s12298-021-01085-0. [DOI] [PMC free article] [PubMed] [Google Scholar]
- Saini DK, Chopra Y, Singh J, Sandhu KS, Kumar A, Bazzer S, Srivastava P. Comprehensive evaluation of mapping complex traits in wheat using genome-wide association studies. Mol Breed. 2022;42:1–52. doi: 10.1007/s11032-021-01272-7. [DOI] [PMC free article] [PubMed] [Google Scholar]
- Saini DK, Srivastava P, Pal N, Gupta PK (2022b) Meta-QTLs, ortho-meta-QTLs and candidate genes for grain yield and associated traits in wheat (Triticum aestivum L.). Theor Appl Genet 1–33. 10.1007/s00122-021-04018-3 [DOI] [PubMed]
- Sandhu KS, Merrick LF, Sankaran S, Zhang Z, Carter AH. Prospectus of Genomic Selection and Phenomics in Cereal, Legume and Oilseed Breeding Programs. Front Genet. 2022;12:829131. doi: 10.3389/fgene.2021.829131. [DOI] [Google Scholar]
- Sandhu N, Pruthi G, Raigar P, Singh MP, Phagna K, Kumar A, Sethi M, Singh J, Ade PA, Saini DK. Meta-QTL analysis in rice and cross-genome talk of the genomic regions controlling nitrogen use efficiency in cereal crops revealing phylogenetic relationship. Front Genet. 2021;12:807210–807210. doi: 10.3389/fgene.2021.807210. [DOI] [PMC free article] [PubMed] [Google Scholar]
- Schnippenkoetter W, Lo C, Liu G, et al. The wheat Lr34 multipathogen resistance gene confers resistance to anthracnose and rust in sorghum. Plant Biotechnol J. 2017;15:1387–1396. doi: 10.1111/pbi.12723. [DOI] [PMC free article] [PubMed] [Google Scholar]
- Schweiger W, Steiner B, Vautrin S, et al. Suppressed recombination and unique candidate genes in the divergent haplotype encoding Fhb1 a major Fusarium head blight resistance locus in wheat. Theor Appl Genet. 2016;129:1607–1623. doi: 10.1007/s00122-016-2727-x. [DOI] [PMC free article] [PubMed] [Google Scholar]
- Schweizer P, Stein N. Large-scale data integration reveals colocalization of gene functional groups with meta-QTL for multiple disease resistance in barley. Mol Plant Microbe Interact. 2011;24:1492–1501. doi: 10.1094/MPMI-05-11-0107. [DOI] [PubMed] [Google Scholar]
- Sharma A, Srivastava P, Mavi GS, Kaur S, Kaur J, Bala R, Sohu VS, Chhuneja P, Bains NS. Resurrection of wheat cultivar ‘PBW343’using marker assisted gene pyramiding for rust resistance. Front Plant Sci. 2021;12:42. doi: 10.3389/fpls.2021.570408. [DOI] [PMC free article] [PubMed] [Google Scholar]
- Shi C, Geng J, Ren Y et al (2021) Genome-wide association study and QTL mapping revealed genetic loci for Fusarium head blight resistance in Chinese hexaploid wheat. 10.21203/rs.3.rs-335212/v1
- Simón MR, Ayala FM, Cordo CA, Röder MS, Börner A. Molecular mapping of quantitative trait loci determining resistance to septoria tritici blotch caused by Mycosphaerella graminicola in wheat. Euphytica. 2004;138:41–48. doi: 10.1023/B:EUPH.0000047059.57839.98. [DOI] [Google Scholar]
- Singh K, Batra R, Sharma S et al (2021) WheatQTLdb: a QTL database for wheat. Mol Genet Genom 1-6 1010.1007/s00438-021-01796-9 [DOI] [PubMed]
- Singh S, Sehgal D, Kumar S, et al. GWAS revealed a novel resistance locus on chromosome 4D for the quarantine disease Karnal bunt in diverse wheat pre-breeding germplasm. Sci Rep. 2020;10:5999. doi: 10.1038/s41598-020-62711-7. [DOI] [PMC free article] [PubMed] [Google Scholar]
- Somers DJ, Isaac P, Edwards K. A high-density microsatellite consensus map for bread wheat (Triticum aestivum L) Theor Appl Genet. 2004;109:1105–1114. doi: 10.1007/s00122-004-1740-7. [DOI] [PubMed] [Google Scholar]
- Soriano JM, Royo C. Dissecting the genetic architecture of leaf rust resistance in wheat by QTL meta-analysis. Phytopathology. 2015;105:1585–1593. doi: 10.1094/PHYTO-05-15-0130-R. [DOI] [PubMed] [Google Scholar]
- Sosnowski O, Charcosset A, Joets J. BioMercator V3: an upgrade of genetic map compilation and quantitative trait loci meta-analysis algorithms. Bioinformatics. 2012;28:2082–2083. doi: 10.1093/bioinformatics/bts313. [DOI] [PMC free article] [PubMed] [Google Scholar]
- Takahagi K, Inoue K, Mochida K. Gene co-expression network analysis suggests the existence of transcriptional modules containing a high proportion of transcriptionally differentiated homoeologs in hexaploid wheat. Front Plant Sci. 2018;9:1163. doi: 10.3389/fpls.2018.01163. [DOI] [PMC free article] [PubMed] [Google Scholar]
- Takahashi H, Miller J, Nozaki Y. RCY1 an Arabidopsis thaliana RPP8/HRT family resistance gene conferring resistance to cucumber mosaic virus requires salicylic acid ethylene and a novel signal transduction mechanism. Plant J. 2002;32:655–667. doi: 10.1046/j.1365-313X.2002.01453.x. [DOI] [PubMed] [Google Scholar]
- Tessmann EW, Van Sanford DA. GWAS for Fusarium head blight related traits in winter wheat (Triticum aestivum L) in an artificially warmed treatment. Agronomy. 2018;8:68. doi: 10.3390/agronomy8050068. [DOI] [Google Scholar]
- Venske E, Dos Santos RS, Farias DDR, Rother V, da Maia LC, Pegoraro C, Costa de Oliveira A. Meta-analysis of the QTLome of Fusarium head blight resistance in bread wheat: refining the current puzzle. Front Plant Sci. 2019;10:727. doi: 10.3389/fpls.2019.00727. [DOI] [PMC free article] [PubMed] [Google Scholar]
- Veyrieras JB, Goffinet B, Charcosset A. MetaQTL: a package of new computational methods for the meta-analysis of QTL mapping experiments. BMC Bioinformatics. 2007;8:1–16. doi: 10.1186/1471-2105-8-49. [DOI] [PMC free article] [PubMed] [Google Scholar]
- Wang J, Wang J, Shang H, Chen X, Xu X, Hu X. TaXa21, a leucine-rich repeat receptor–like kinase gene associated with TaWRKY76 and TaWRKY62, plays positive roles in wheat high-temperature seedling plant resistance to Puccinia striiformis f. sp. tritici. Mol Plant-Microbe Interact. 2019;32:1526–1535. doi: 10.1094/MPMI-05-19-0137-R. [DOI] [PubMed] [Google Scholar]
- Wang S, Wong D, Forrest K, et al. Characterization of polyploid wheat genomic diversity using a high-density 90 000 single nucleotide polymorphism array. Plant Biotechnol J. 2014;12:787–796. doi: 10.1111/pbi.12183. [DOI] [PMC free article] [PubMed] [Google Scholar]
- Wiesner-Hanks T, Nelson R. Multiple disease resistance in plants. Annu Rev Phytopathol. 2016;54:229–252. doi: 10.1146/annurev-phyto-080615-100037. [DOI] [PubMed] [Google Scholar]
- Wisser RJ, Sun Q, Hulbert SH, Kresovich S, Nelson RJ. Identification and characterization of regions of the rice genome associated with broad-spectrum quantitative disease resistance. Genetics. 2005;169:2277–2293. doi: 10.1534/genetics.104.036327. [DOI] [PMC free article] [PubMed] [Google Scholar]
- Wormit A, Usadel B. The multifaceted role of pectin methylesterase inhibitors (PMEIs) Int J Mol Sci. 2018;19:2878. doi: 10.3390/ijms19102878. [DOI] [PMC free article] [PubMed] [Google Scholar]
- Xing L, Gao L, Chen Q, Pei H, Di Z, Xiao J, Wang H, Ma L, Chen P, Cao A, Wang X. Over-expressing a UDP-glucosyltransferase gene (Ta-UGT 3) enhances Fusarium head blight resistance of wheat. Plant Growth Regul. 2018;84:561–571. doi: 10.1007/s10725-017-0361-5. [DOI] [Google Scholar]
- Yang F, Li W, Jørgensen HJ (2013) Transcriptional reprogramming of wheat and the hemibiotrophic pathogen Septoria tritici during two phases of the compatible interaction . PLoS One 8:pe81606. 10.1371/journal.pone.0081606 [DOI] [PMC free article] [PubMed]
- Yang Y, Amo A, Wei D, Chai Y, Zheng J, Qiao P, Cui C, Lu S, Chen L, Hu YG (2021) Large-scale integration of meta-QTL and genome-wide association study discovers the genomic regions and candidate genes for yield and yield-related traits in bread wheat. Theor Appl Genet 1-2710.1007/s00122-021-03881-4 [DOI] [PubMed]
- Zheng T, Hua C, Li L, Sun Z, Yuan M, Bai G, Humphreys G, Li T. Integration of meta-QTL discovery with omics: Towards a Mol Breed platform for improving wheat resistance to Fusarium head blight. Crop J. 2020 doi: 10.1016/j.cj.2020.10.006. [DOI] [Google Scholar]
- Zwart RS, Thompson JP, Milgate AW, Bansal UK, Williamson PM, Raman H, Bariana HS. QTL mapping of multiple foliar disease and root-lesion nematode resistances in wheat. Mol Breed. 2010;26:107–124. doi: 10.1007/s11032-009-9381-9. [DOI] [Google Scholar]
Associated Data
This section collects any data citations, data availability statements, or supplementary materials included in this article.
Supplementary Materials
Data Availability Statement
Data generated or analyzed during this study are included in this published article (and its Supplementary Material).
Not applicable.